
Sustainable Growth in the Telecom Industry through Hybrid Renewable Energy Integration: A Technical, Energy, Economic and Environmental (3E) Analysis

 ,
,  , ,
, ,  and
and
Abstract
1. Introduction
Study Motivation and Objectives of the Proposed Study
- A framework for decision making that combines precise sustainability evaluation with techno-economic optimization should be established.
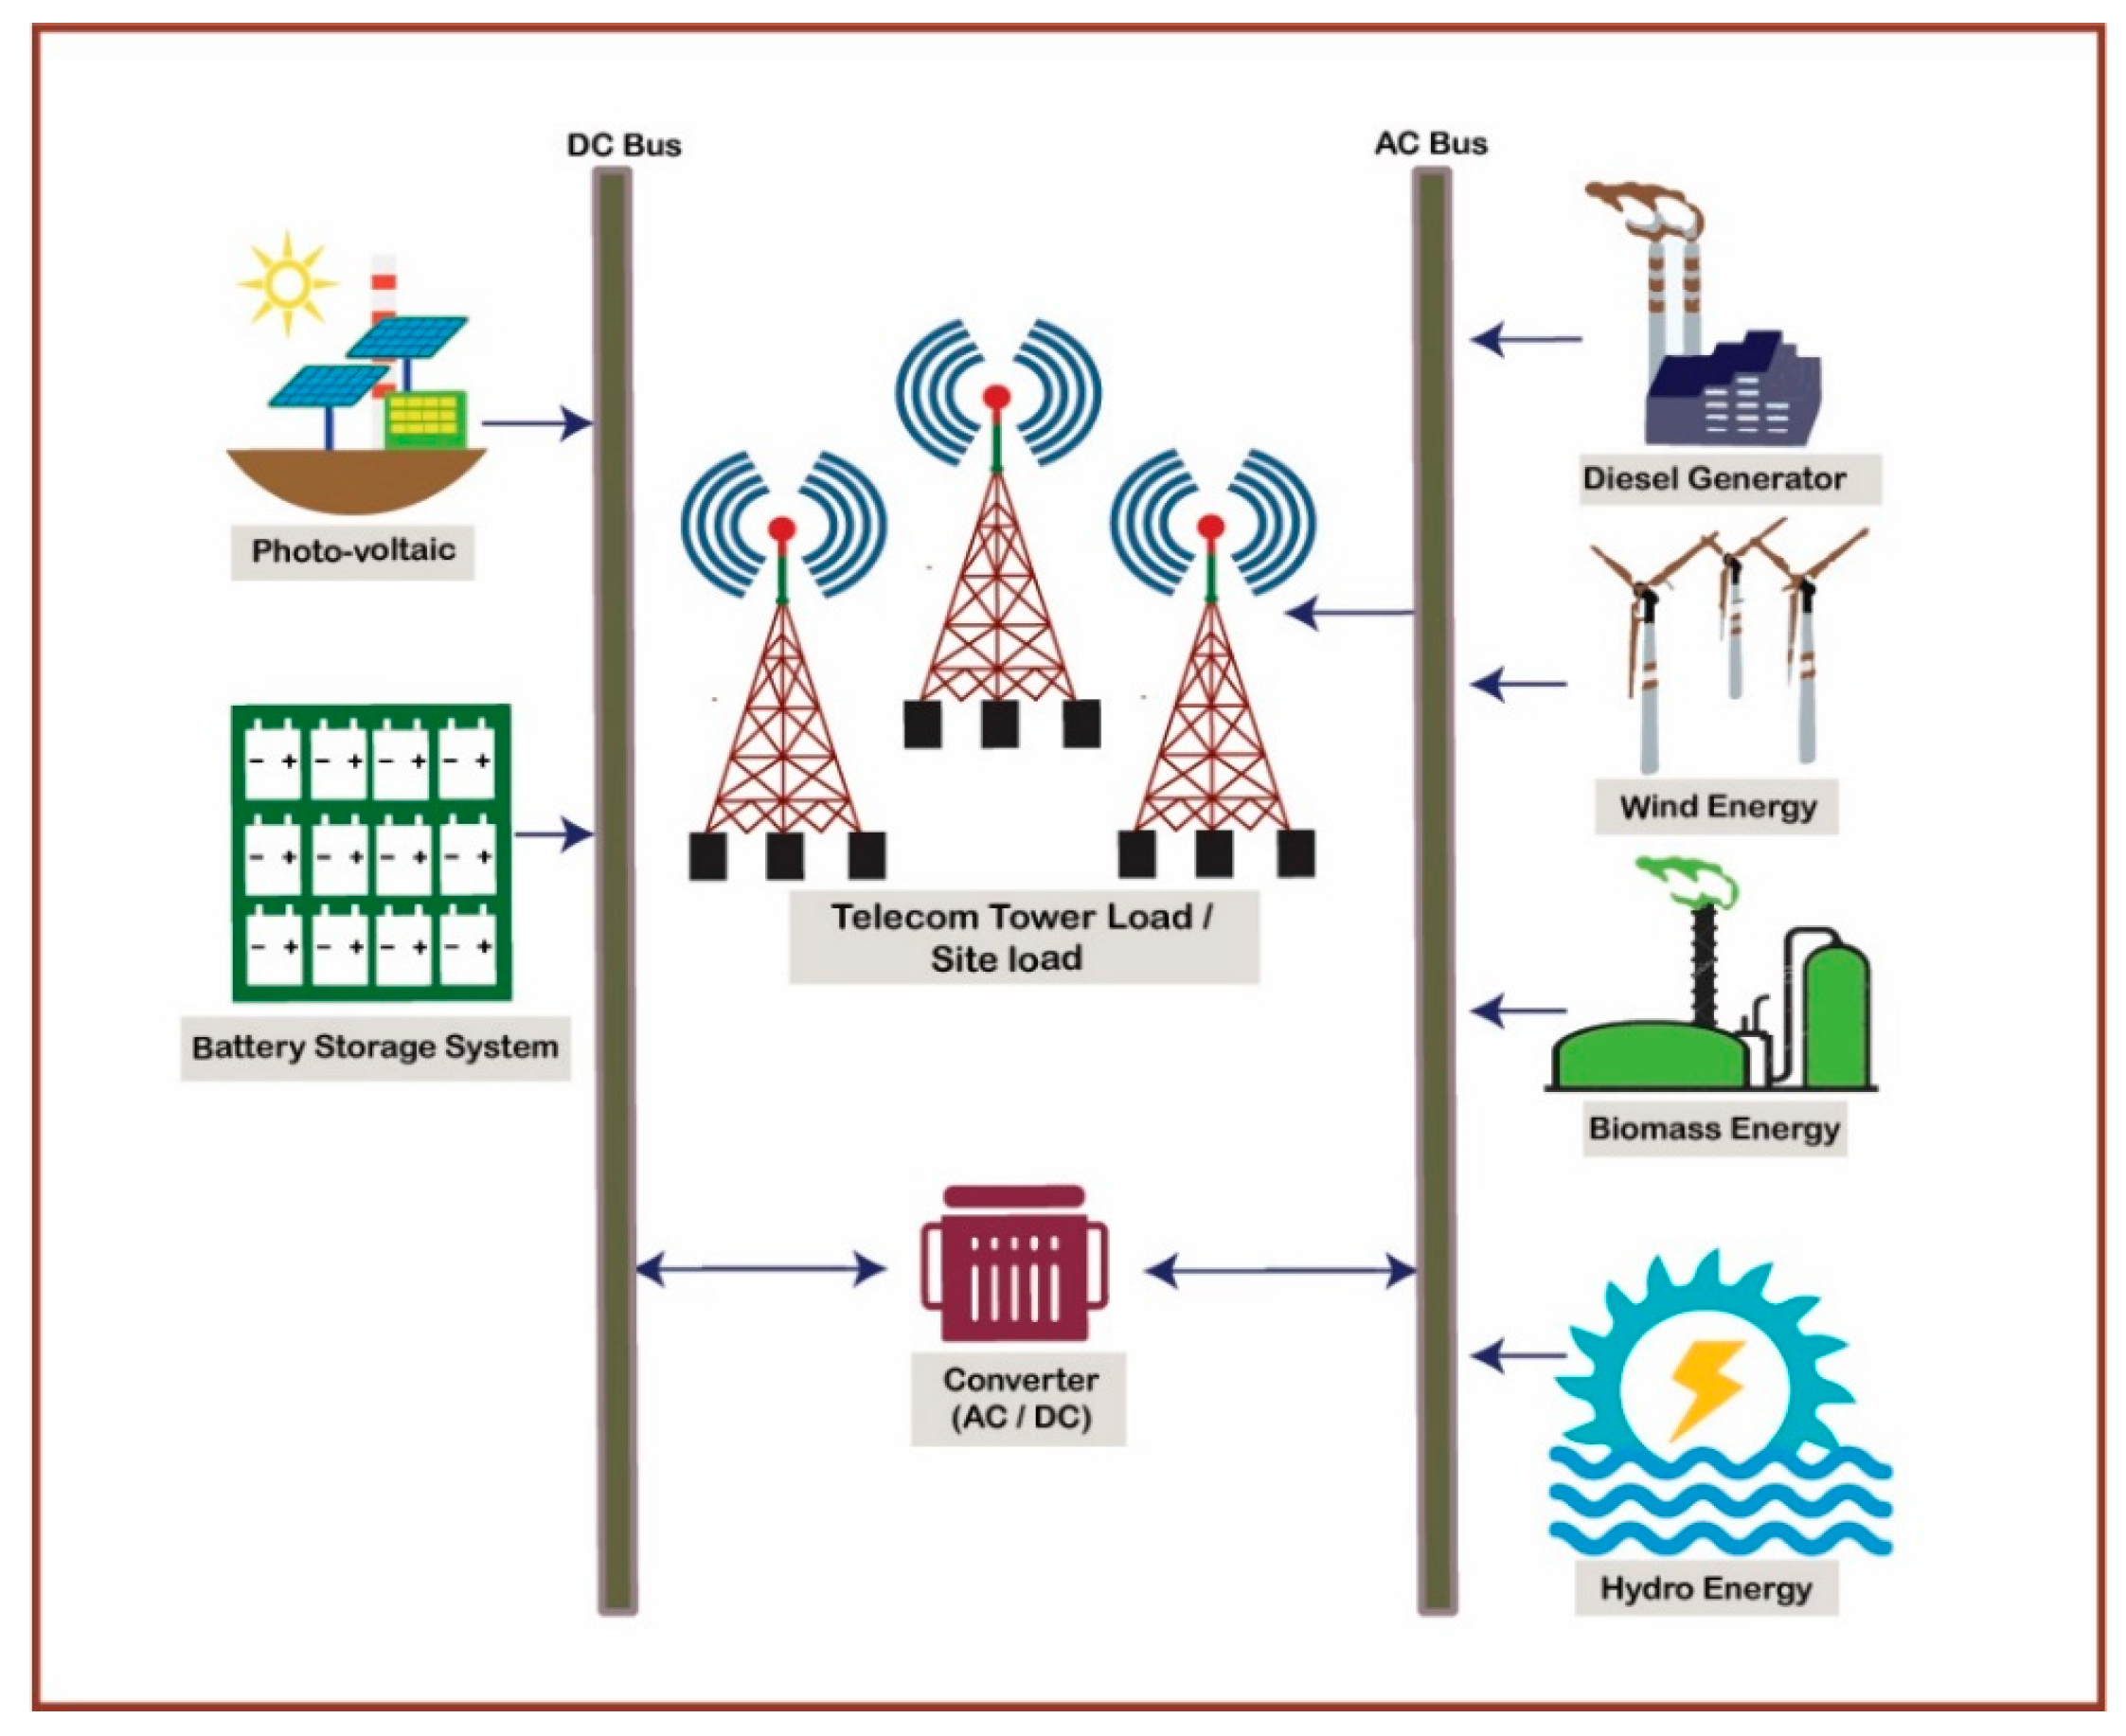
- To account for various potential power outage situations in the telecom sector, hybrid systems (PV, wind, hydro, biomass, and battery) should be used to maximize a system’s capacity to meet the energy demands of telecom towers.
- After initial screening, superior outcomes should be attained through the utilization of component models and storage technology. The optimization process must take into account various losses associated with wind turbines to offer a realistic perspective.
- Hybrid systems powered by solar PV, wind power, hydropower, biomass, and diesel with a battery storage system for telecom towers should be compared and contrasted with the conventional options presently on the market.
2. Literature Review
3. Research Methodology
3.1. Decision Parameters
3.2. Performance Indicators
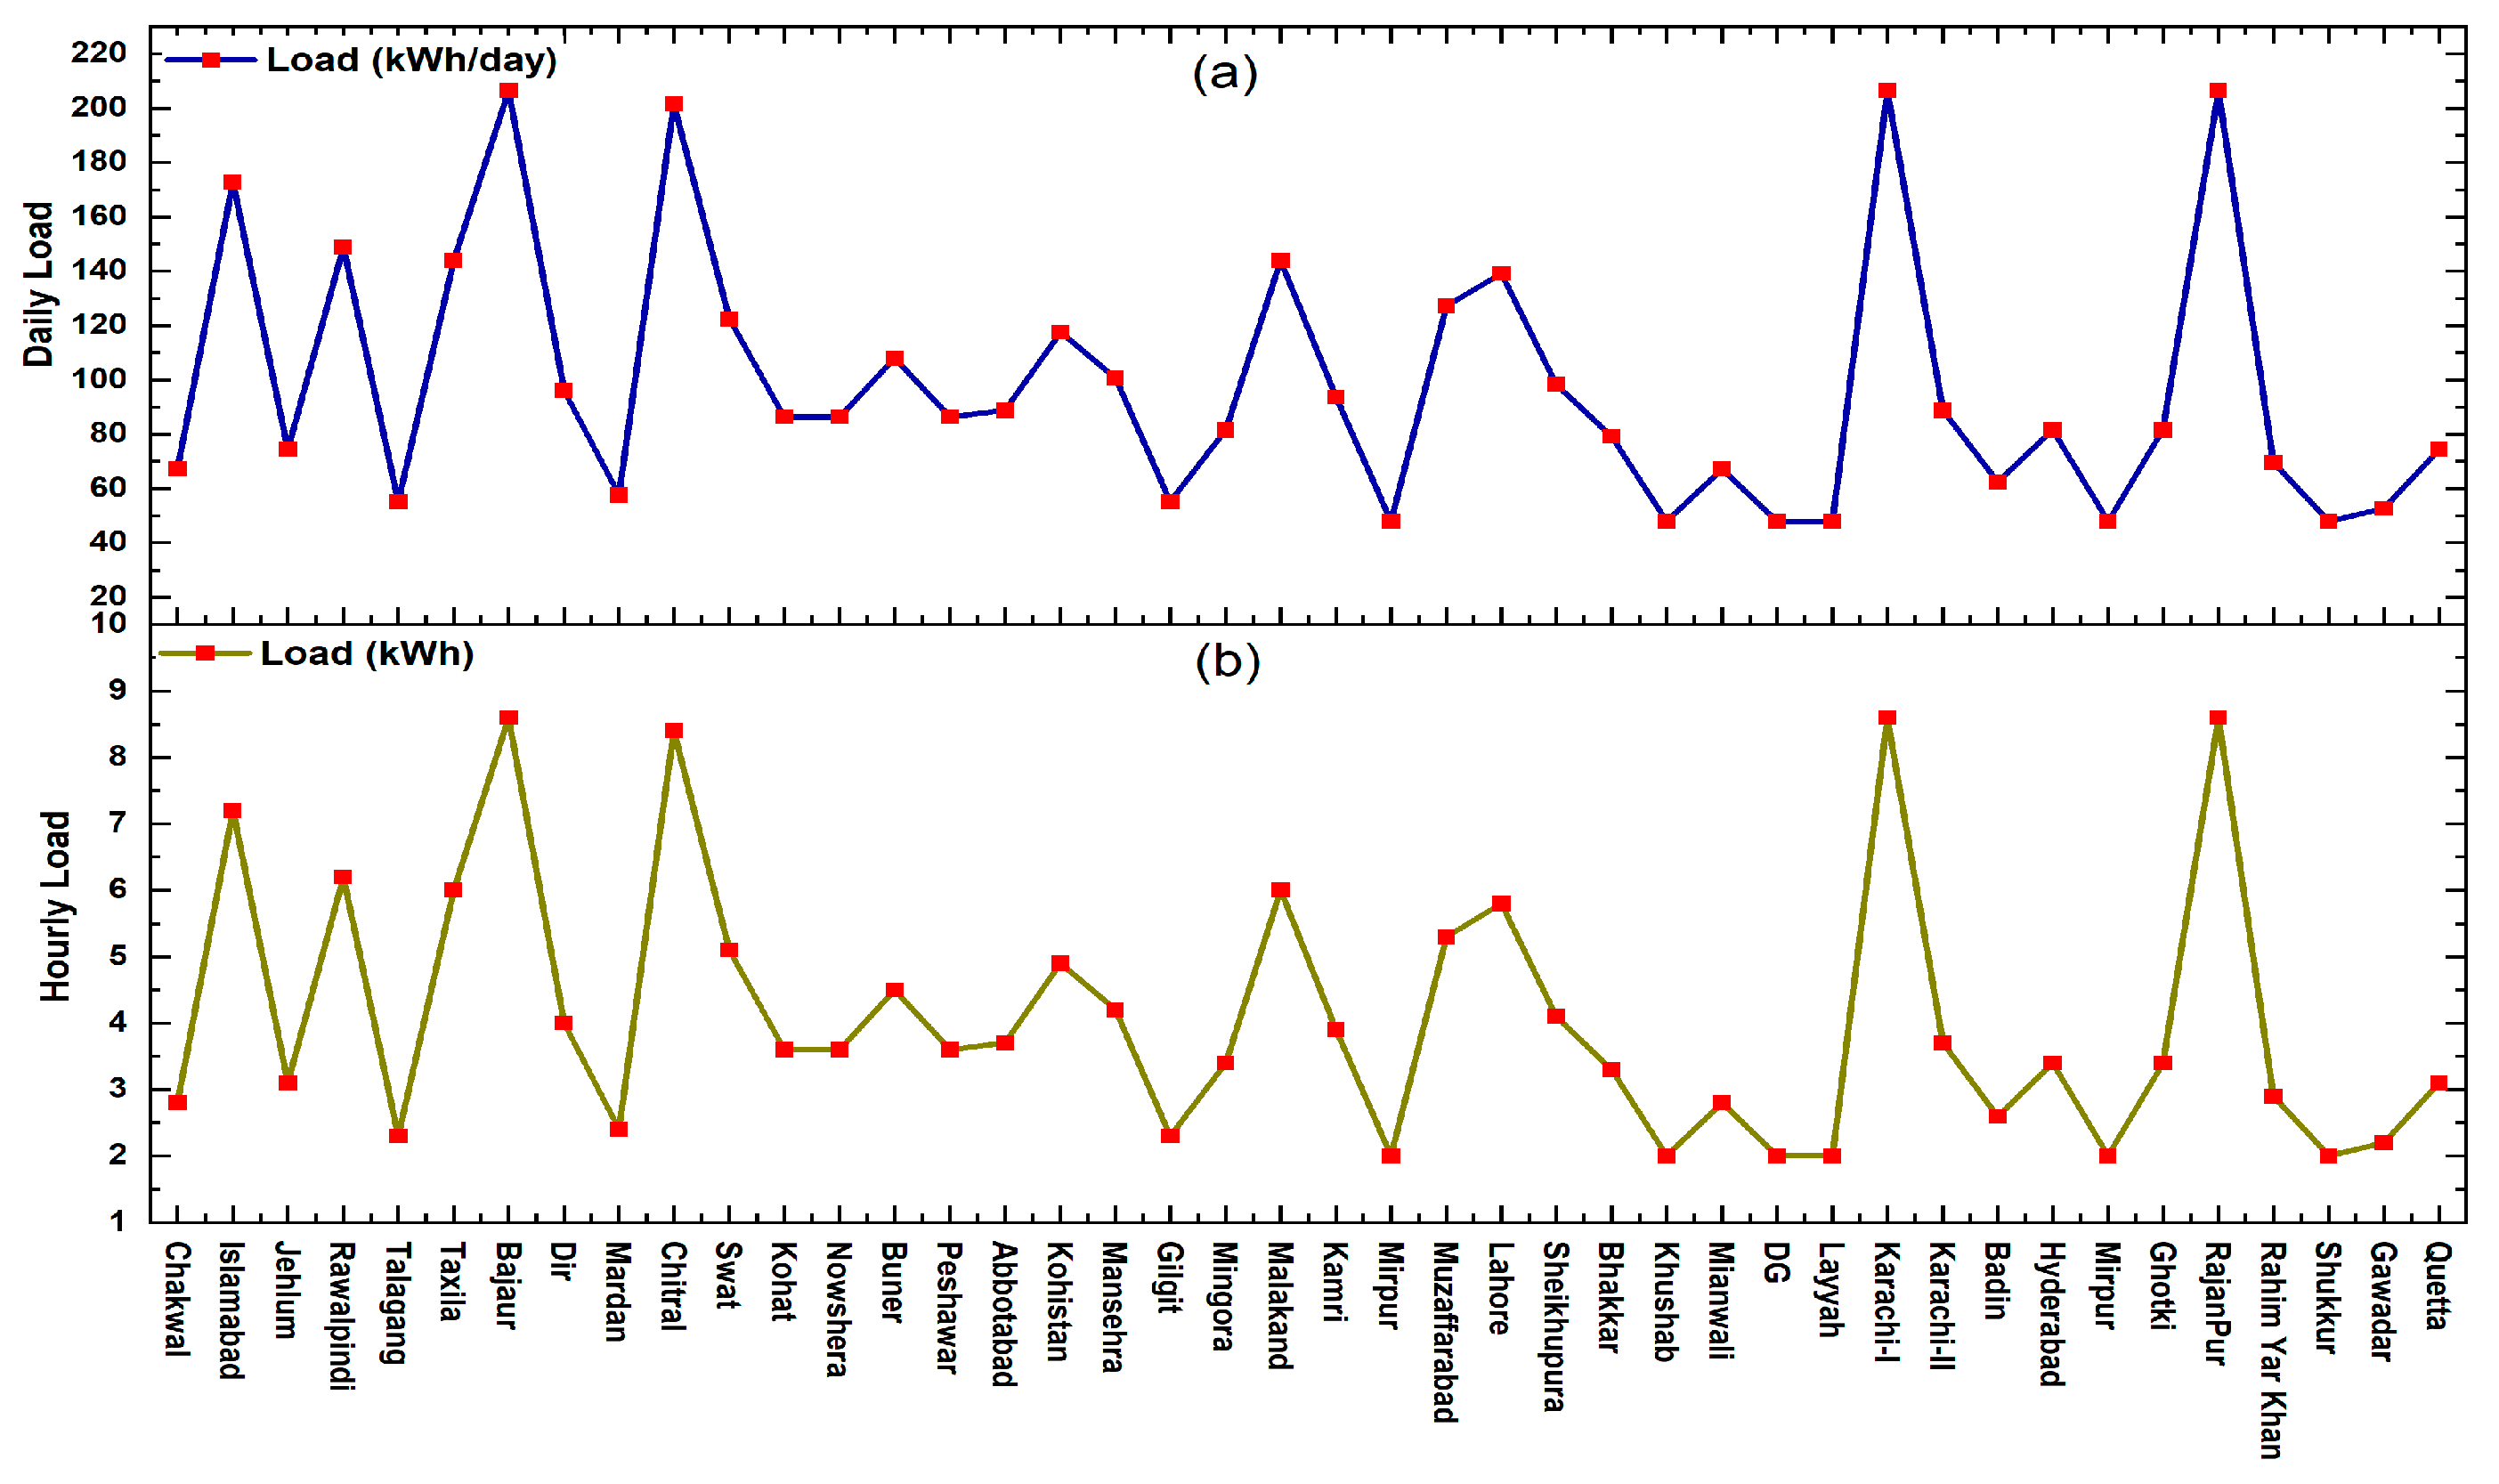
3.3. Site Selection with Load Assessment
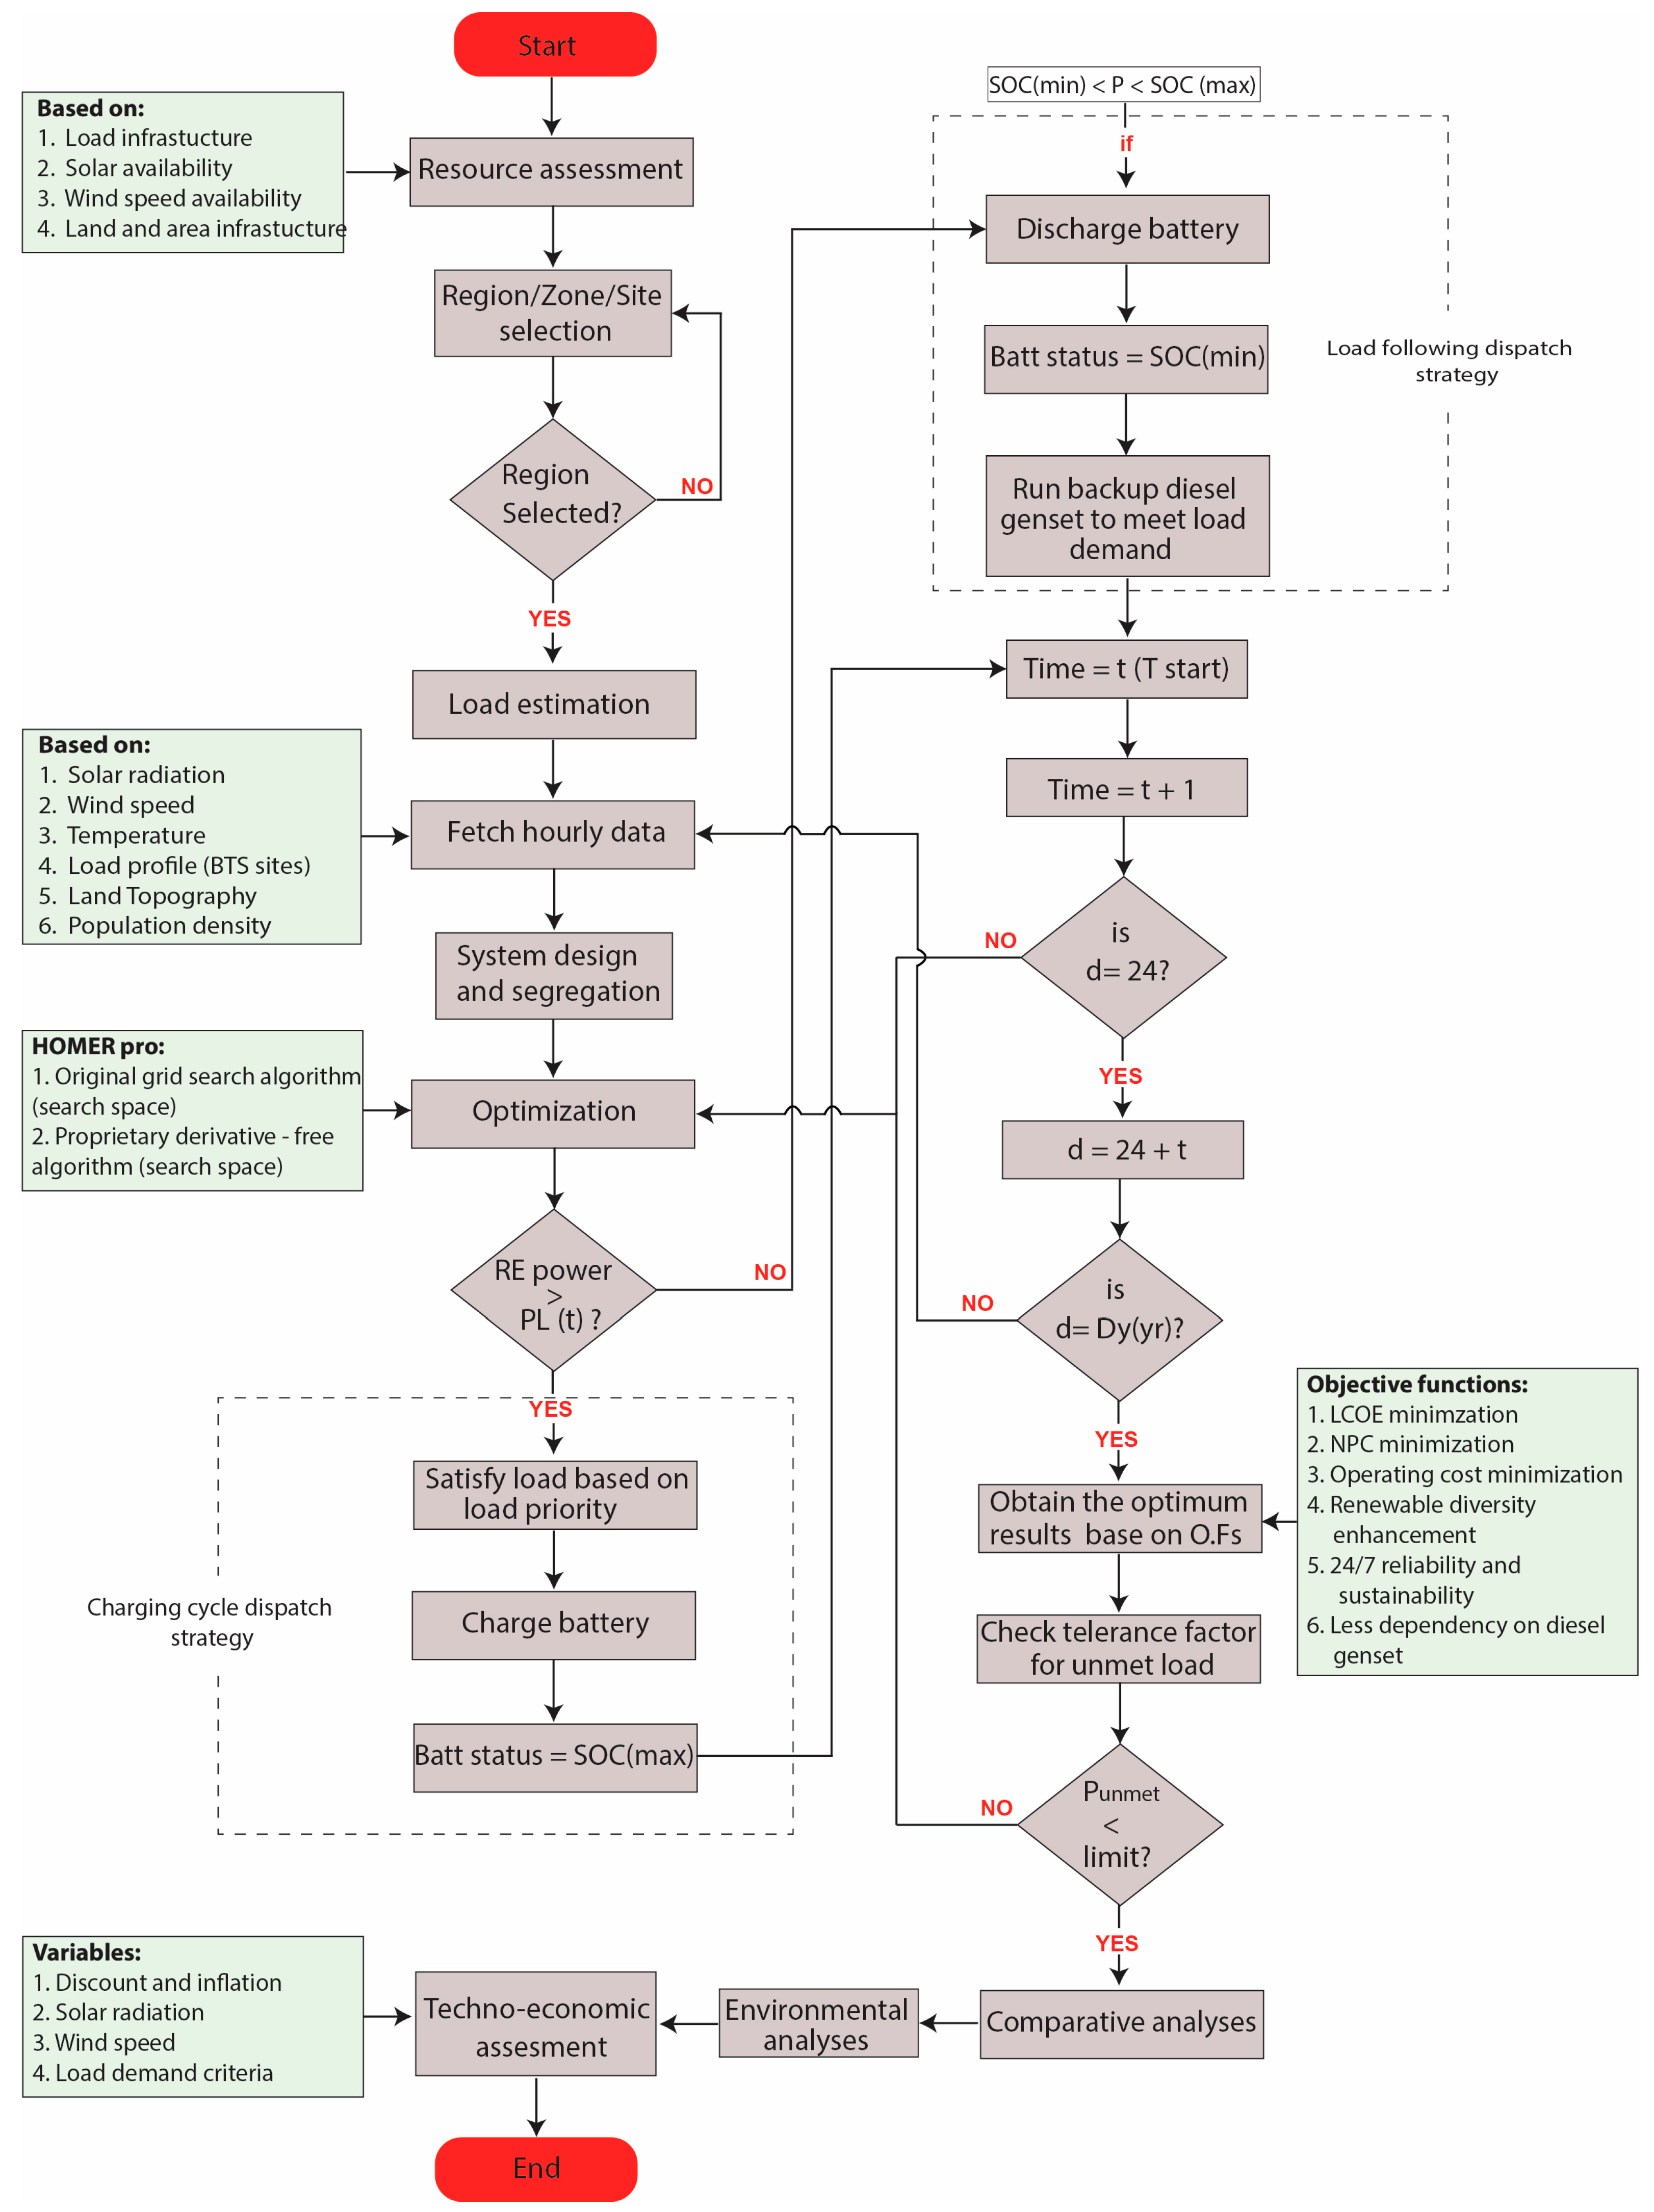
3.4. Proposed Design Framework for BTSs
4. Modeling of the System
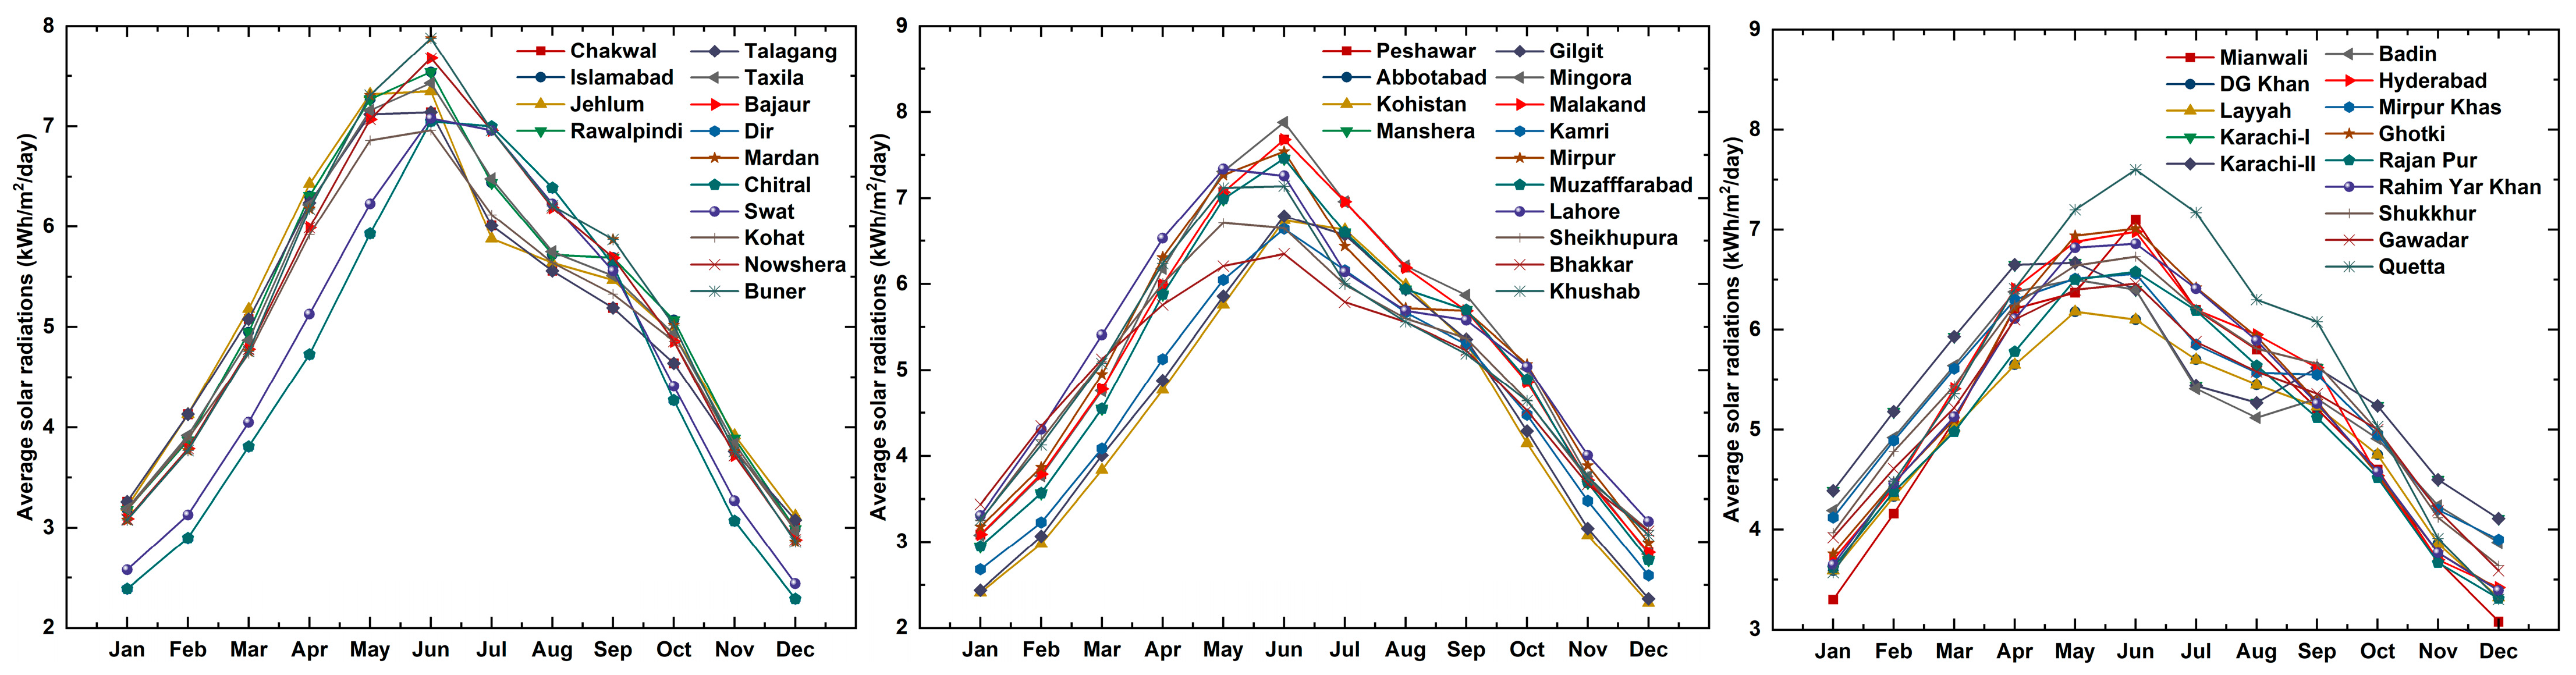
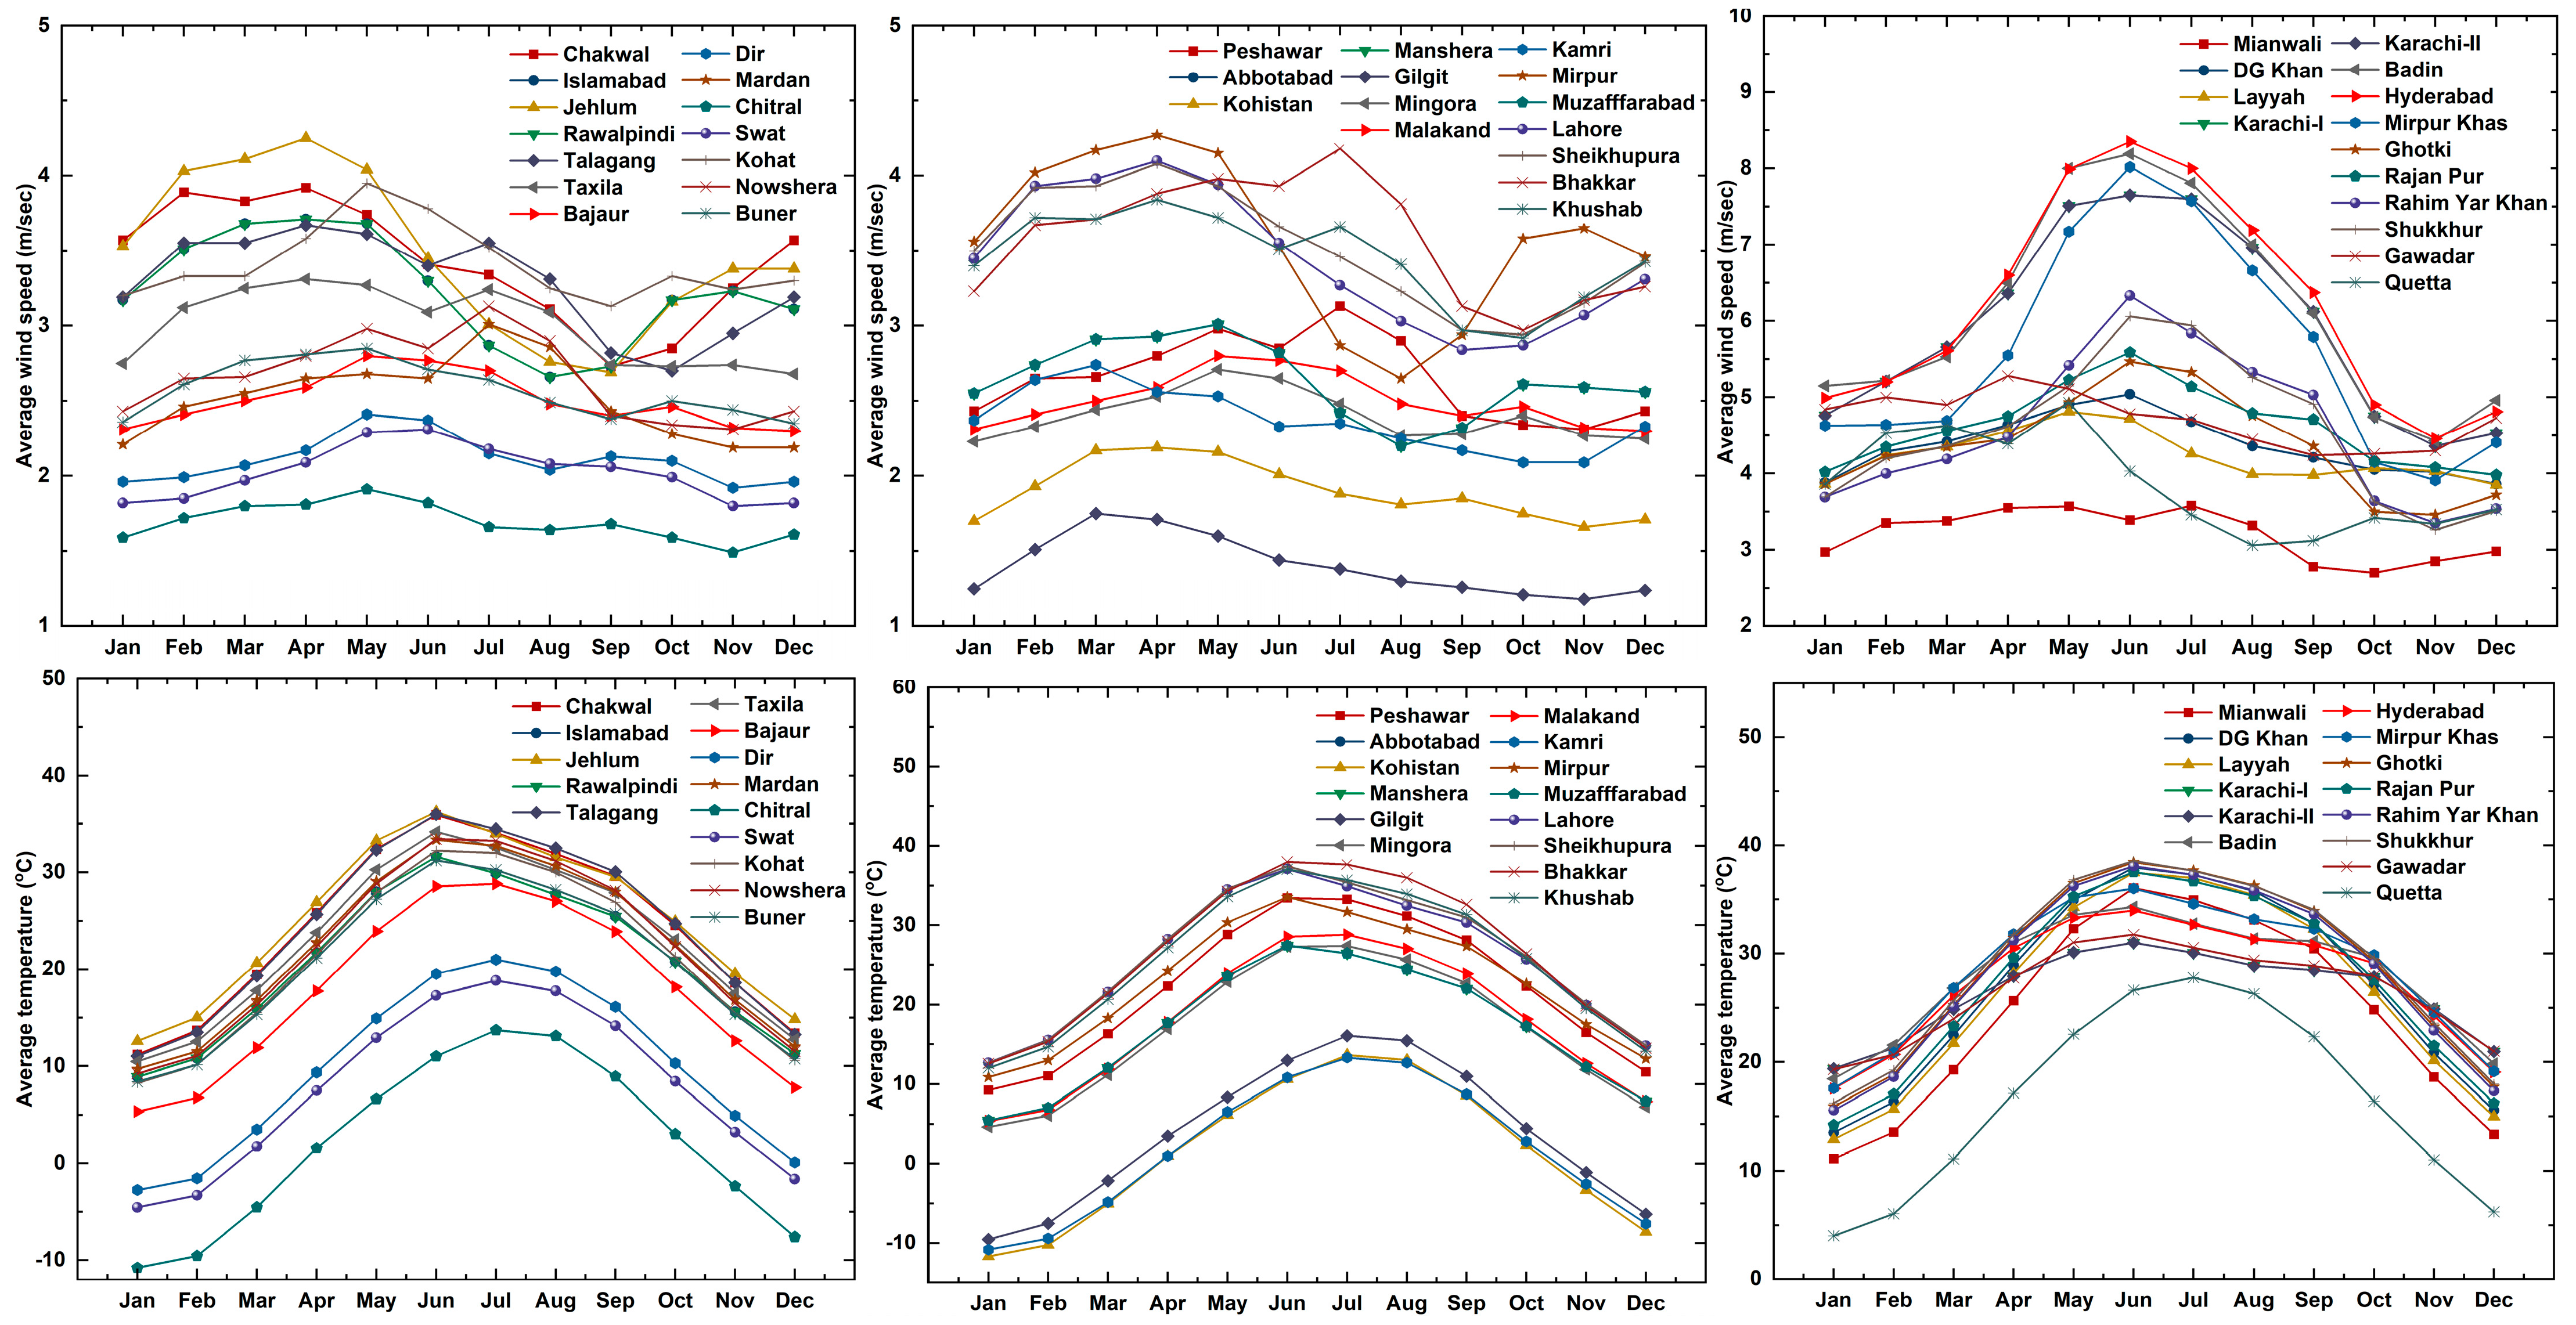
4.1. Resource Assessment of Selected System Components
4.1.1. Photovoltaic System
4.1.2. Battery
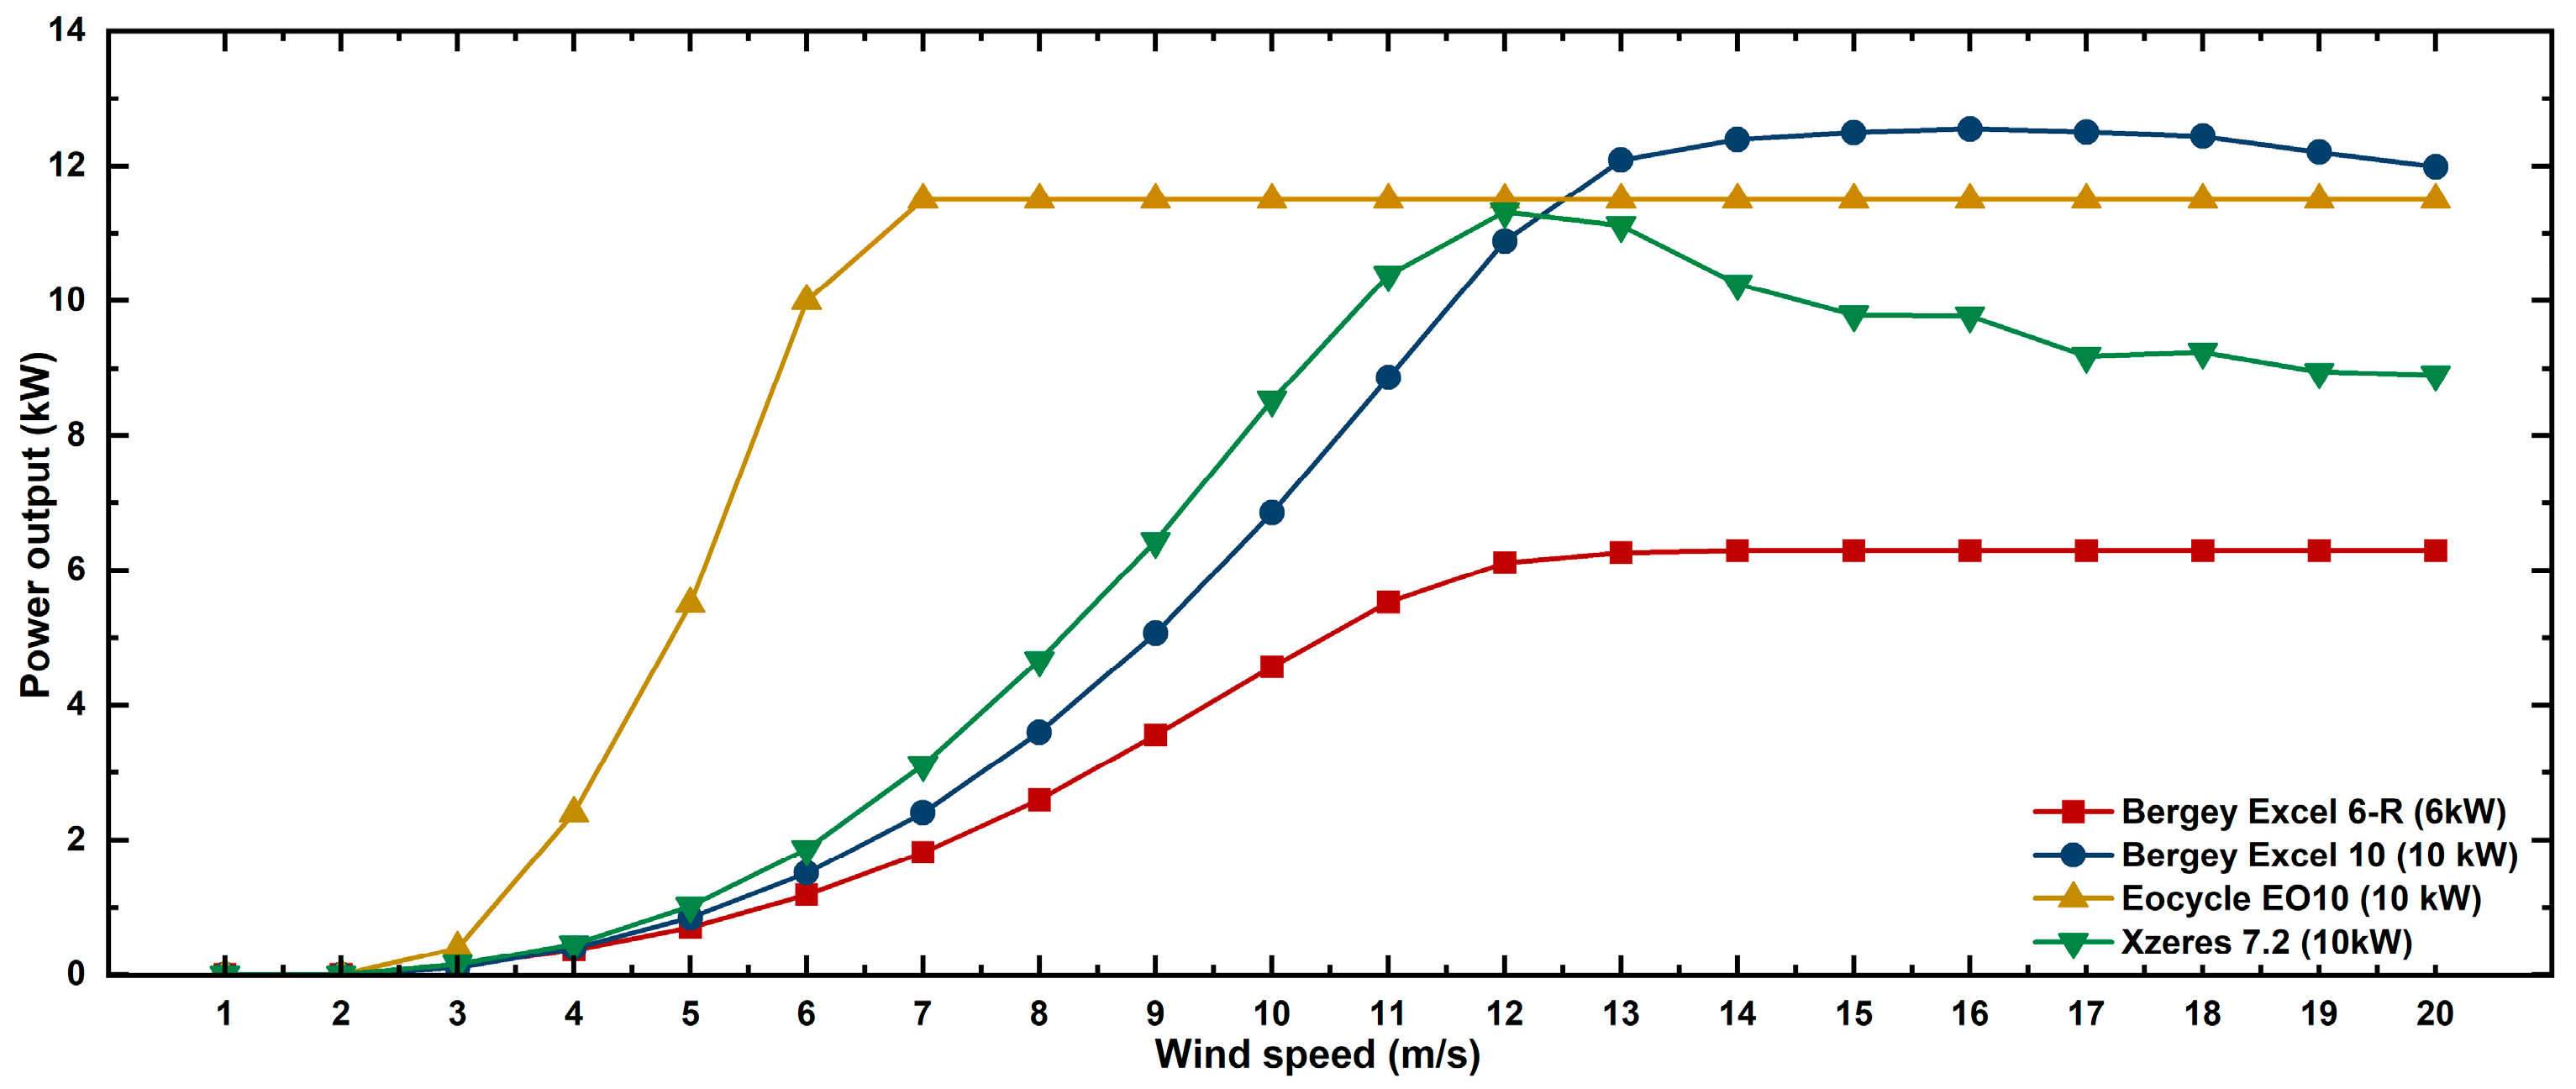
4.1.3. Wind Turbine
4.1.4. Power Converter
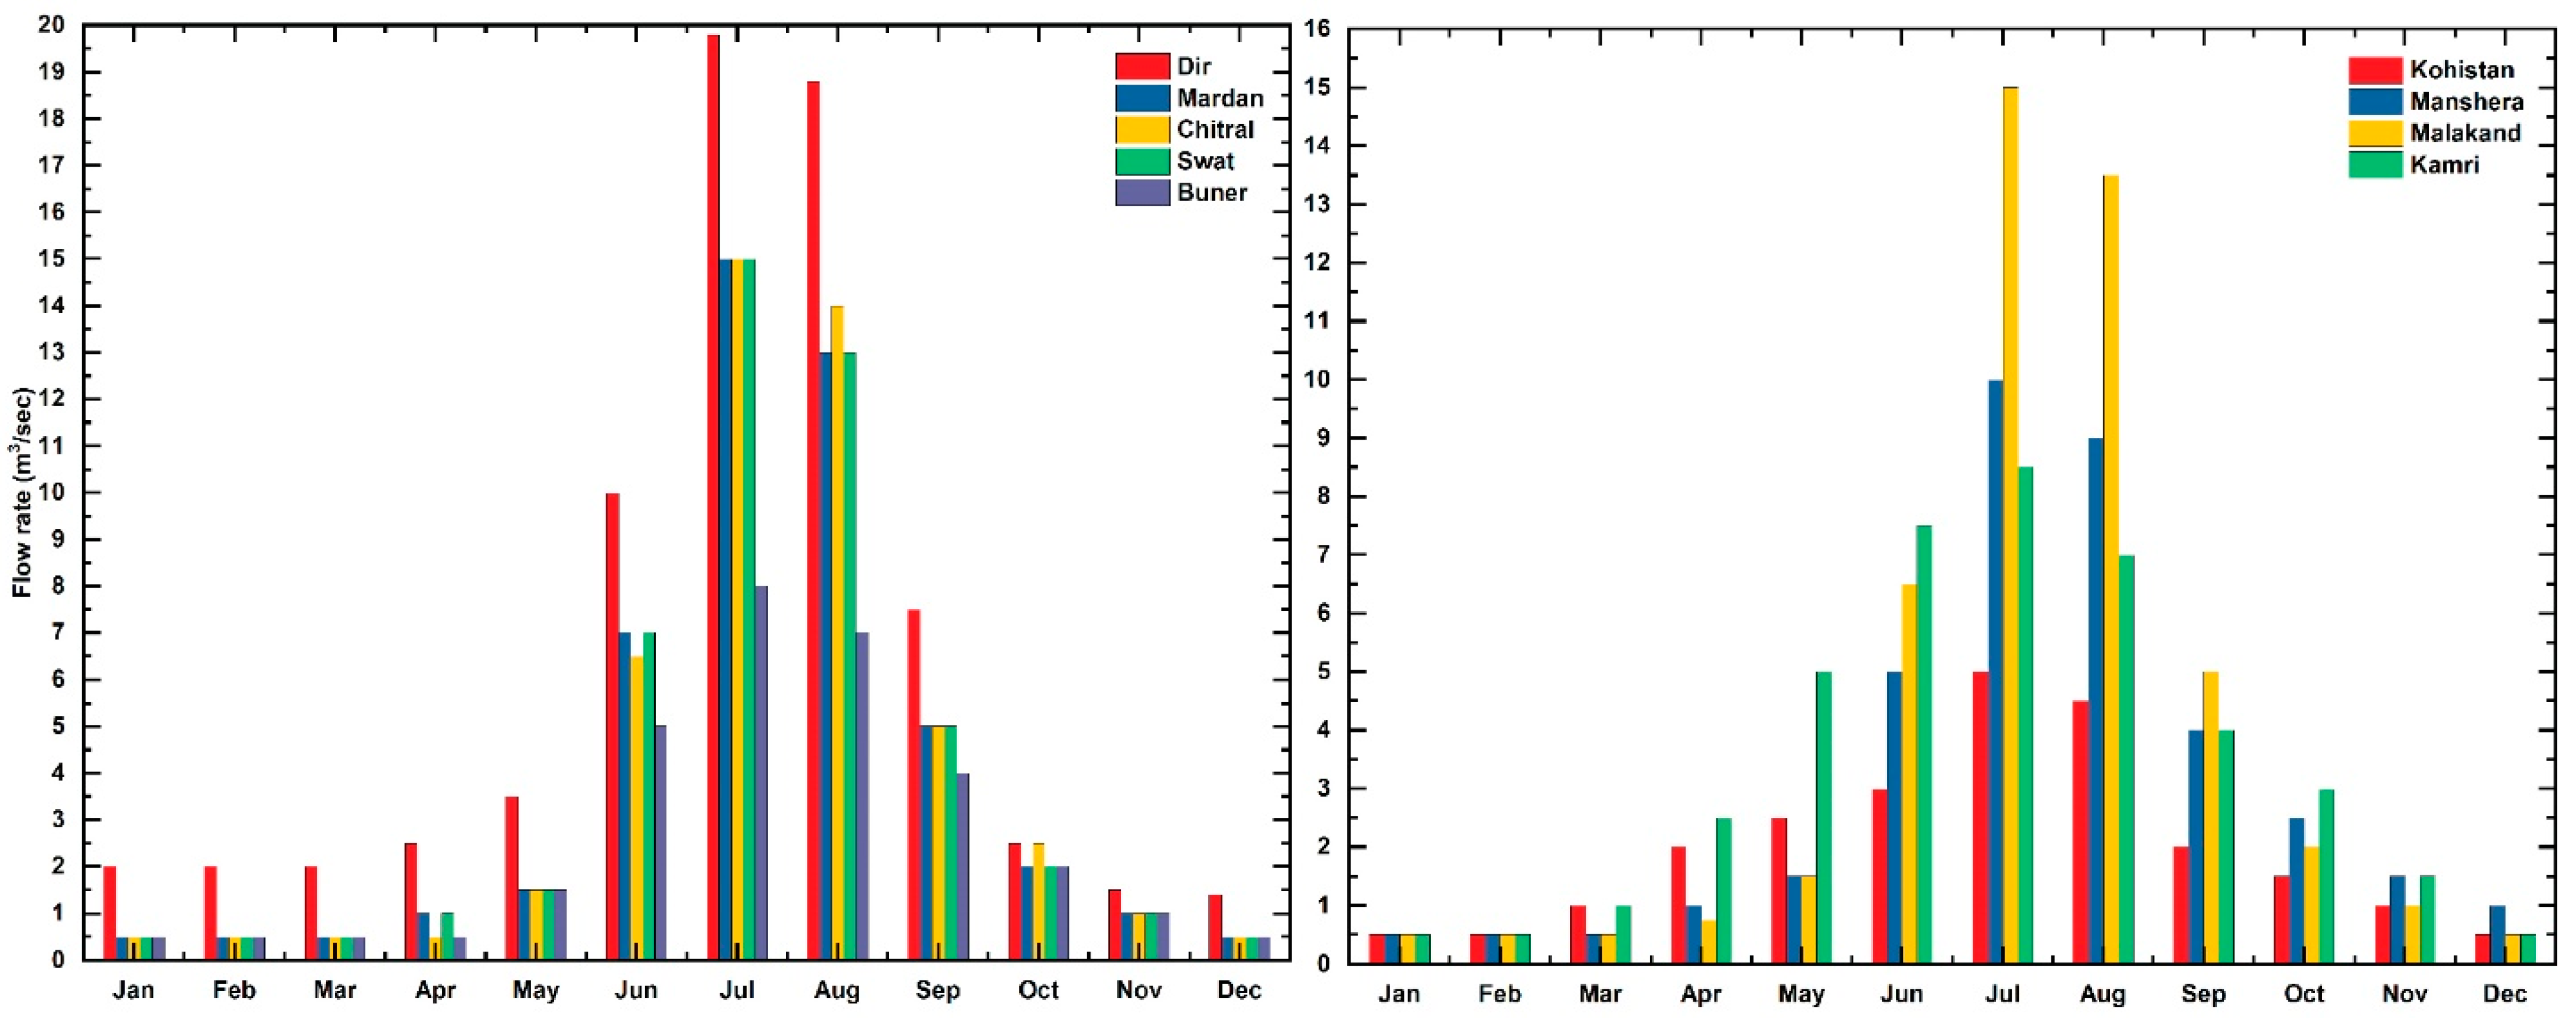
4.1.5. Hydel Power System
4.1.6. Biogas System
5. Analysis and Discussion of Results
5.1. Techno-Economic Optimization
5.1.1. DGs with PV and Battery Storage Systems (DG-PV-B)
5.1.2. PV-Wind and Battery with Hydro Energy (PV-W-B-HYD)
5.1.3. DG-PV and Wind with Battery Storage System (DG-PV-W-B)
5.1.4. DG-PV and Wind with Hydro Energy (DG-PV-W-HYD)
5.1.5. PV and Biomass with Battery Storage System (PV-BM-B)
5.1.6. Wind and Hydro with Battery Storage System (W-HYD-B)
5.1.7. DG-PV and Battery with Hydro Energy (DG-PV-B-HYD)
5.2. Comparative Analysis
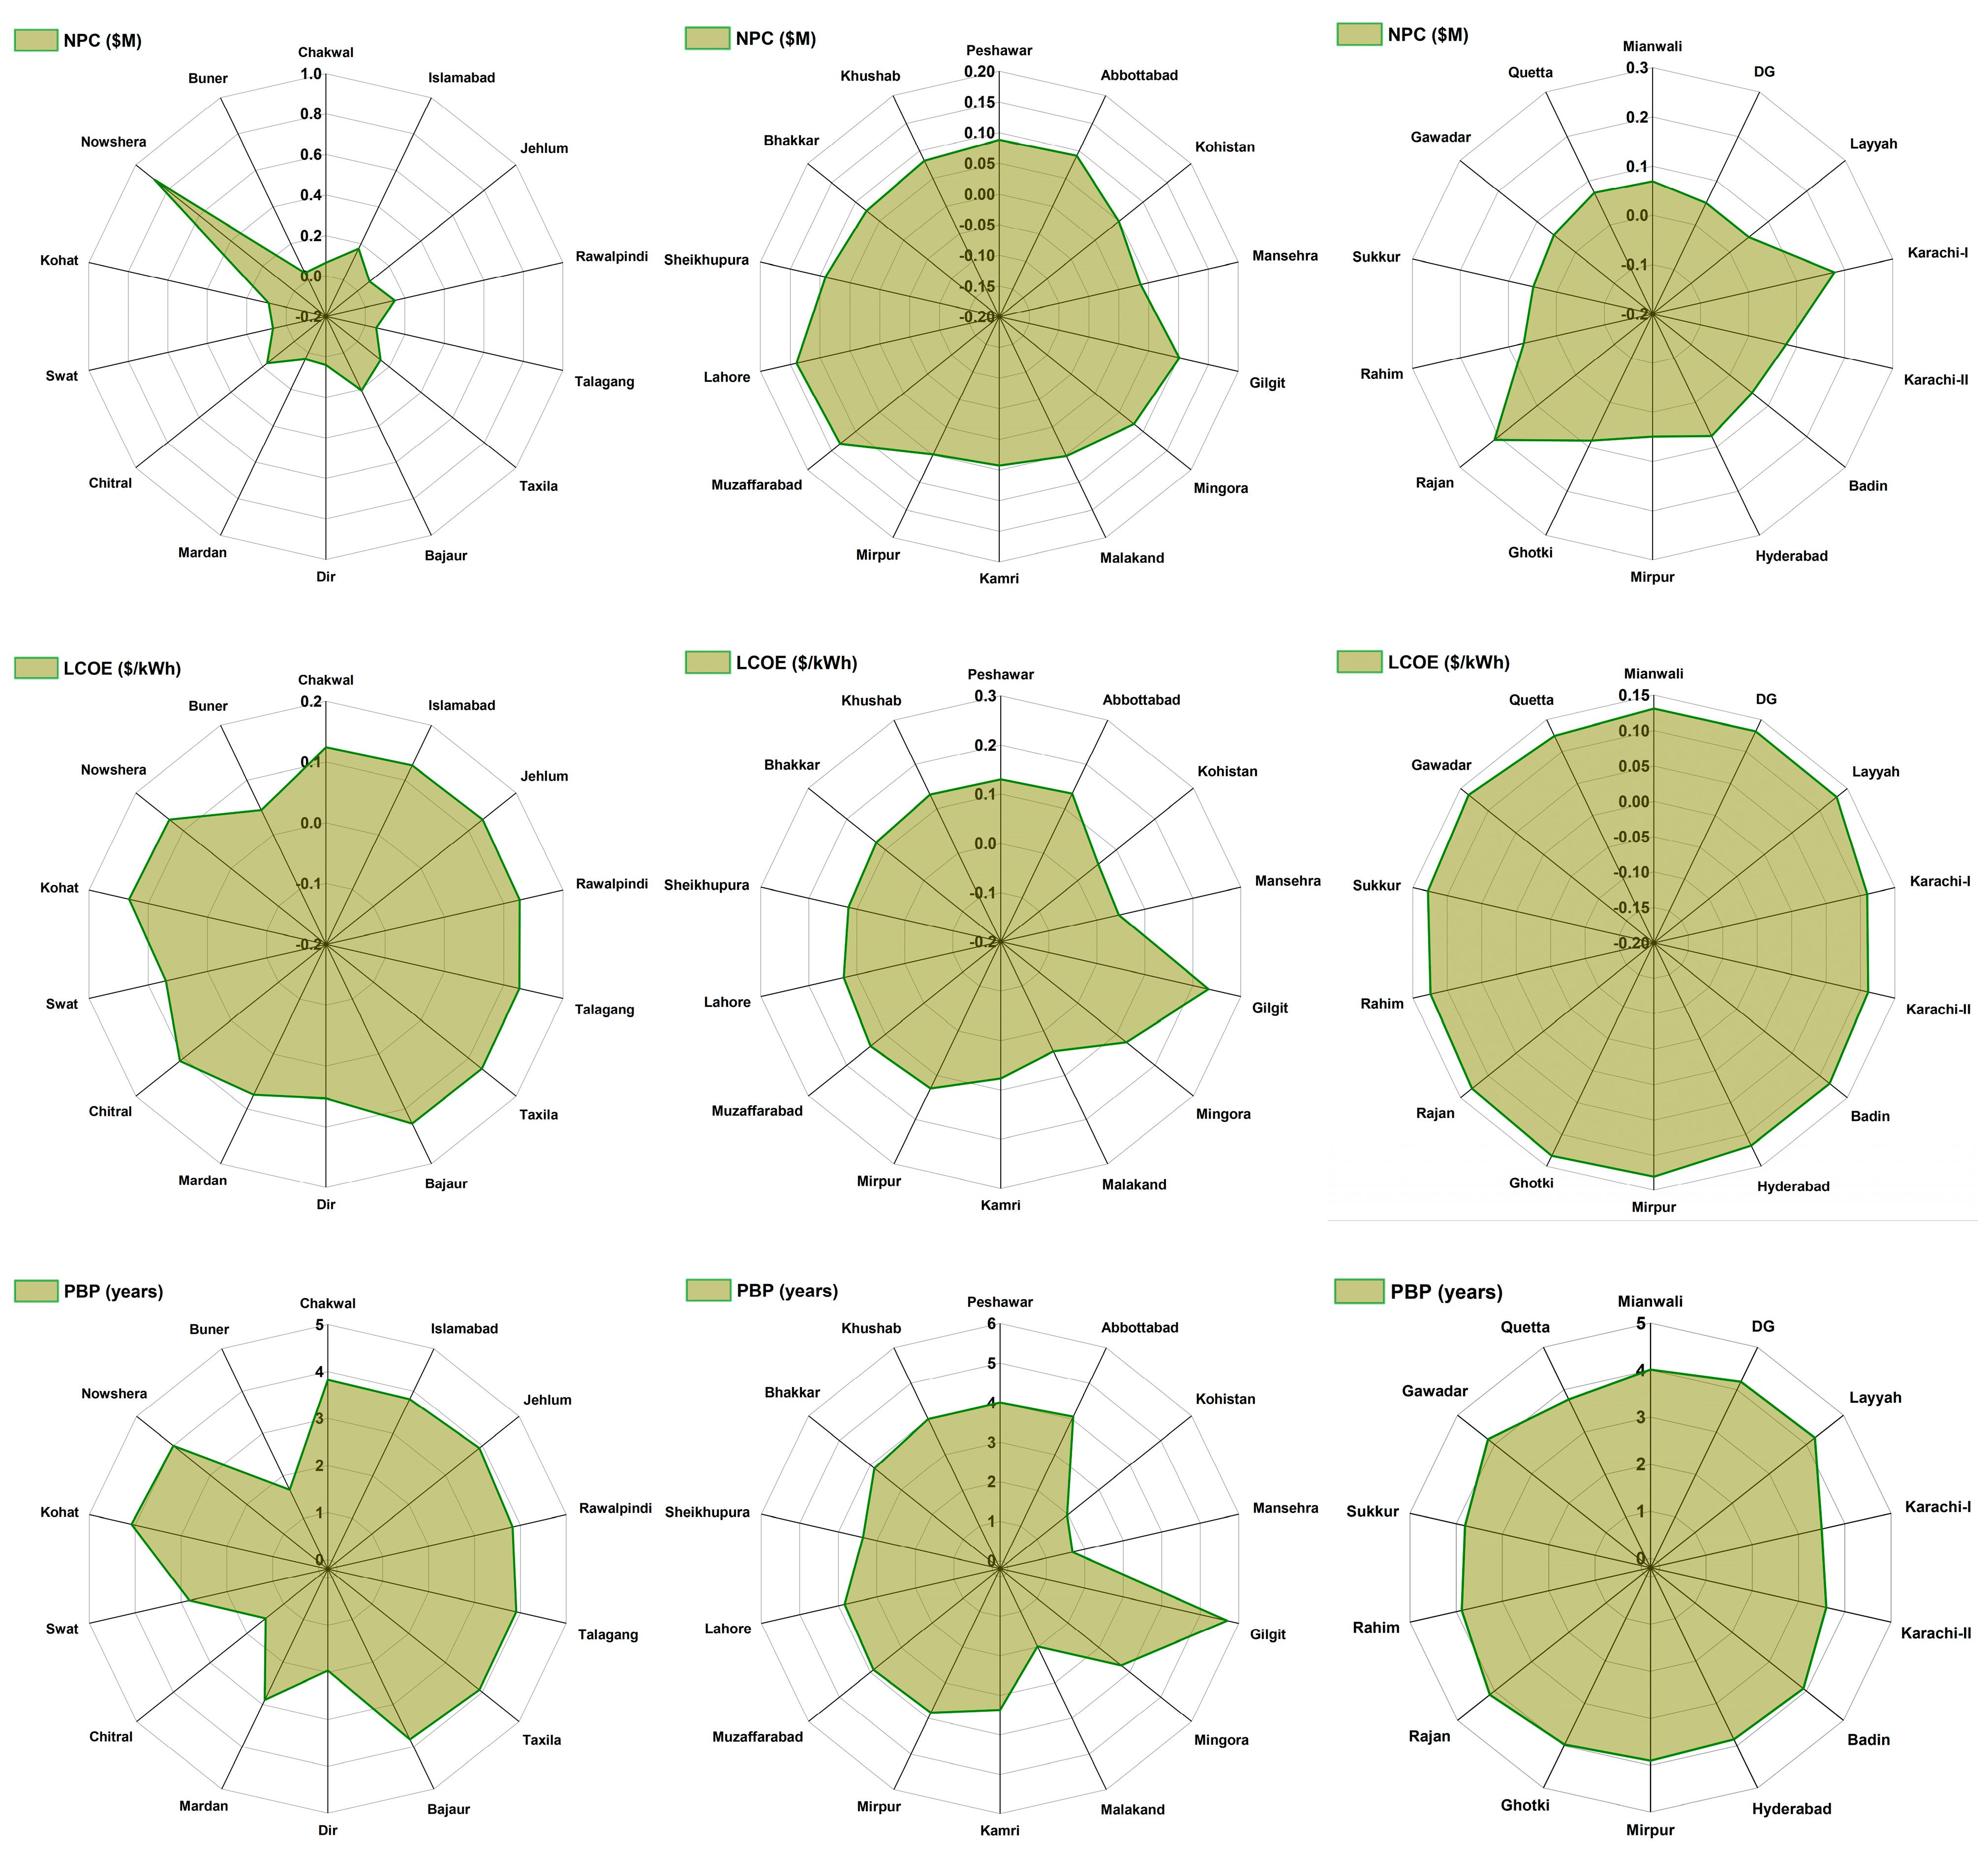
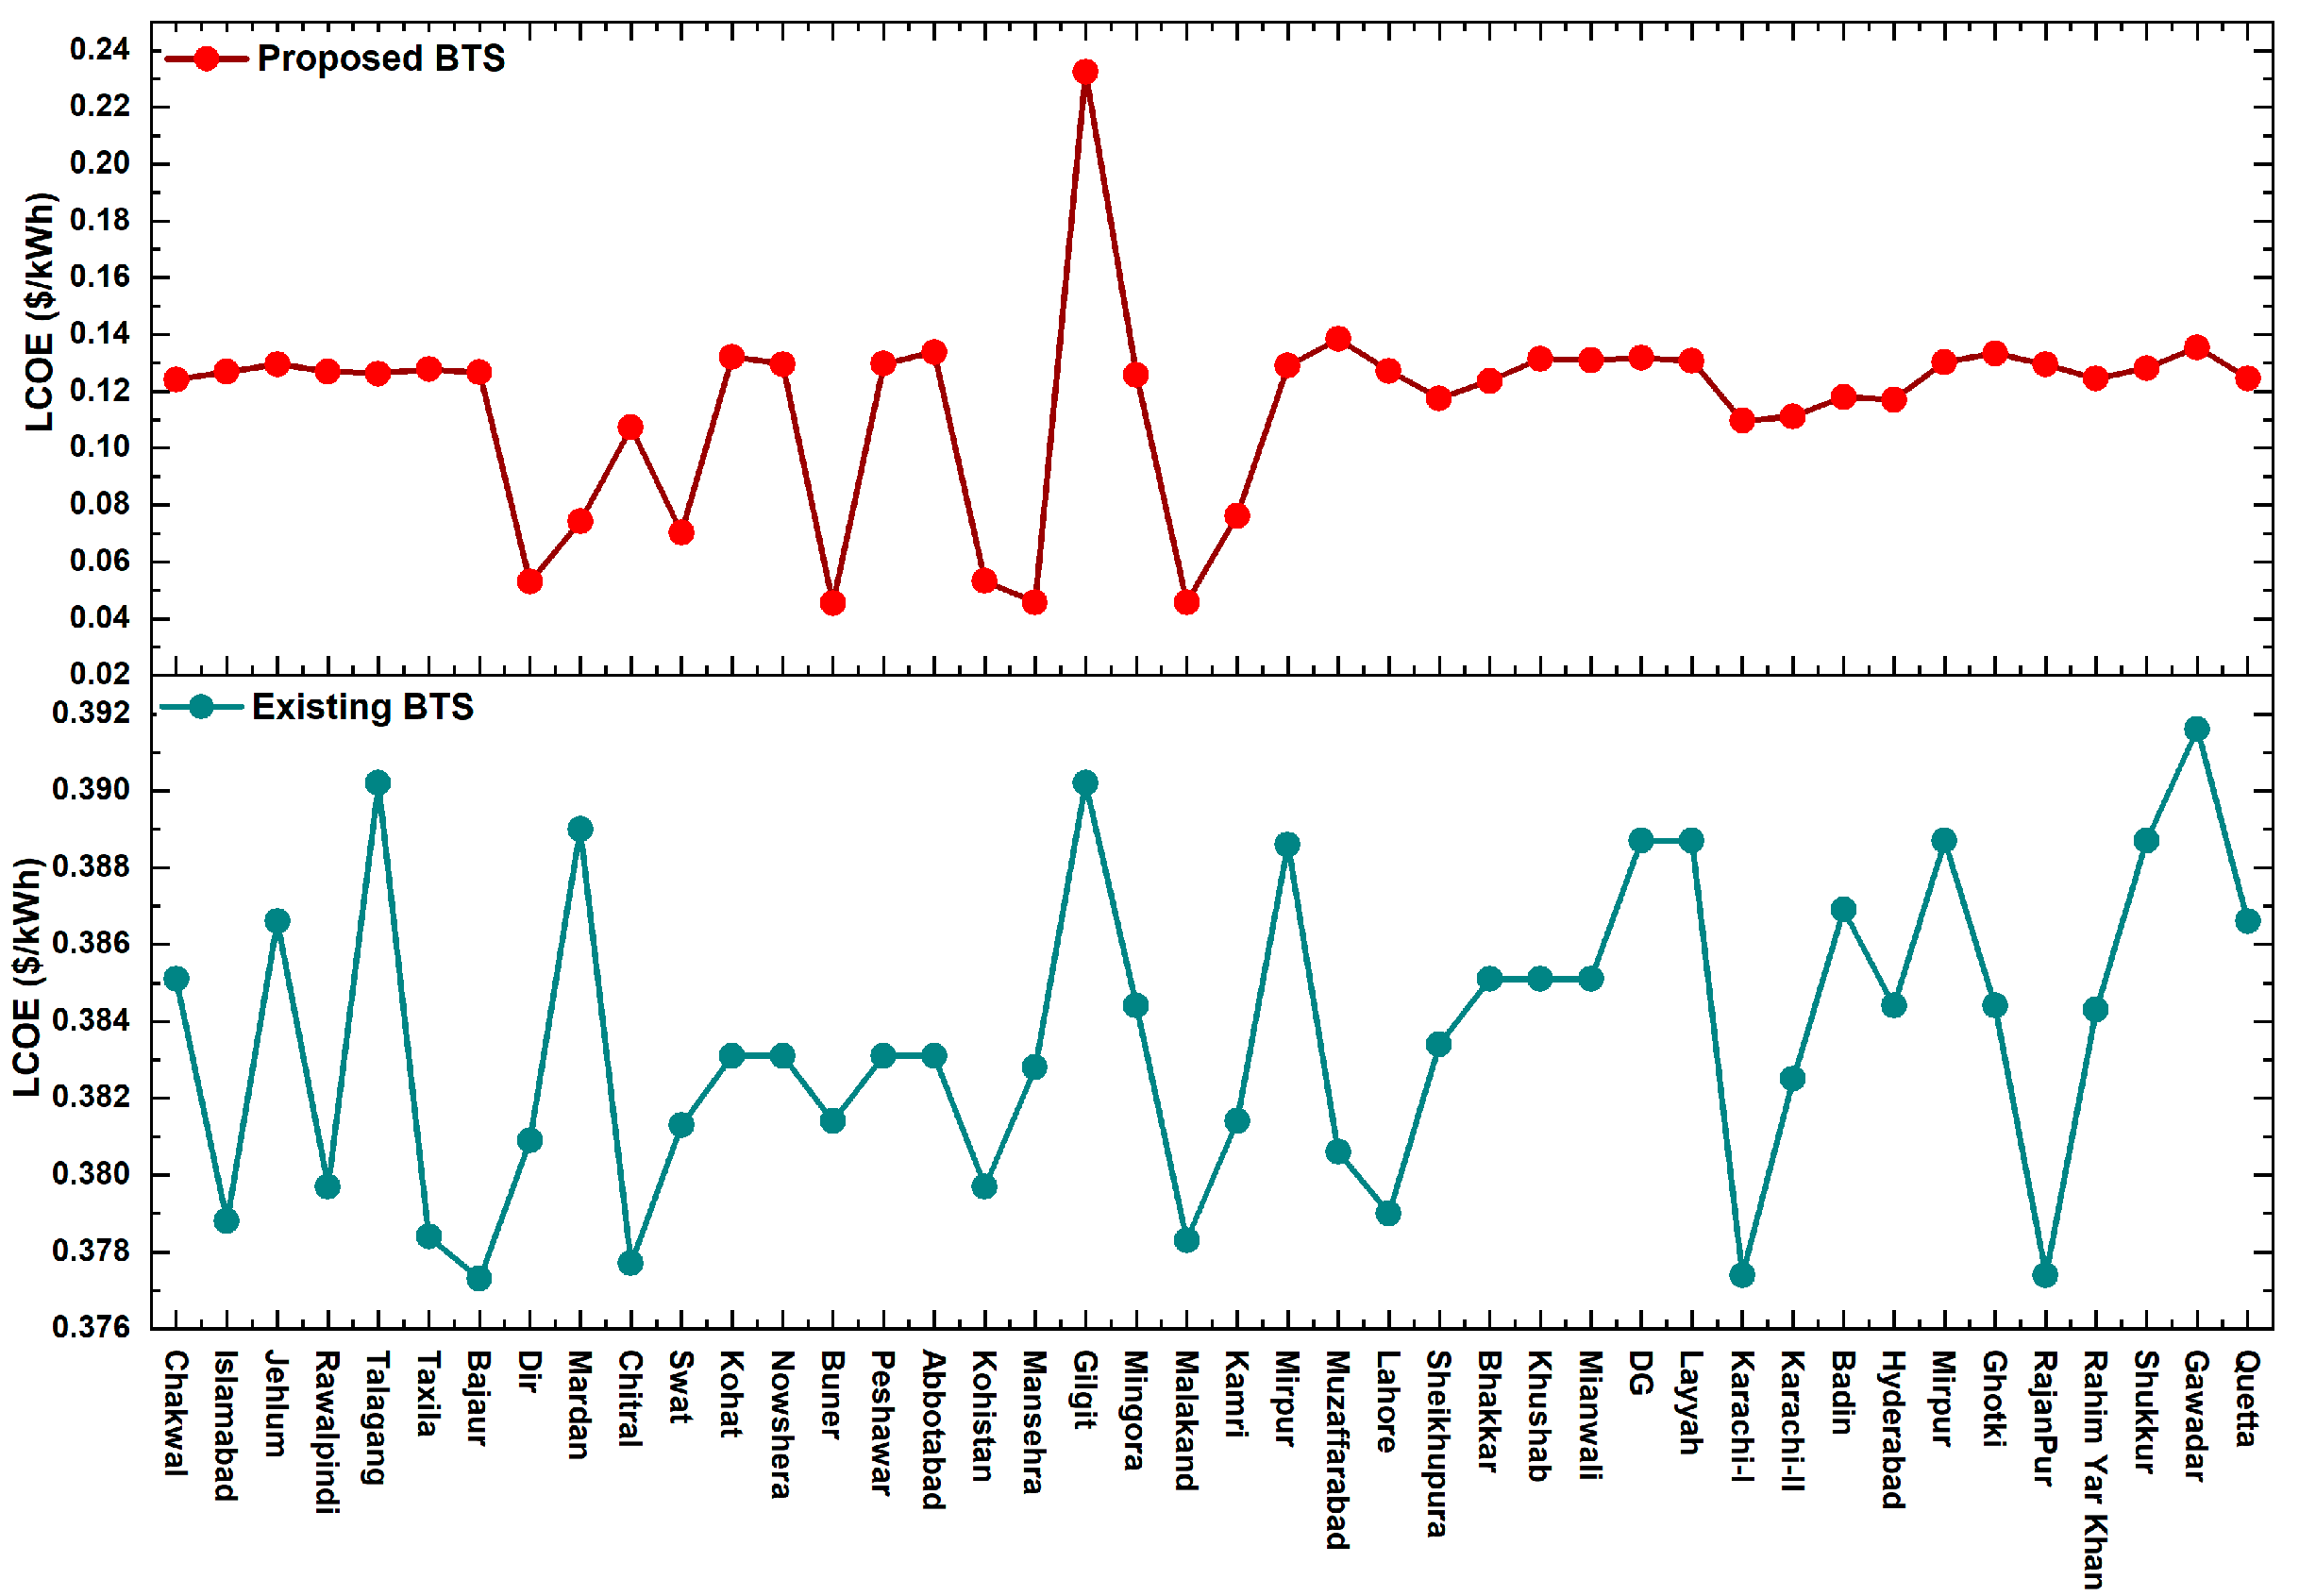
5.2.1. Levelized Cost of Energy
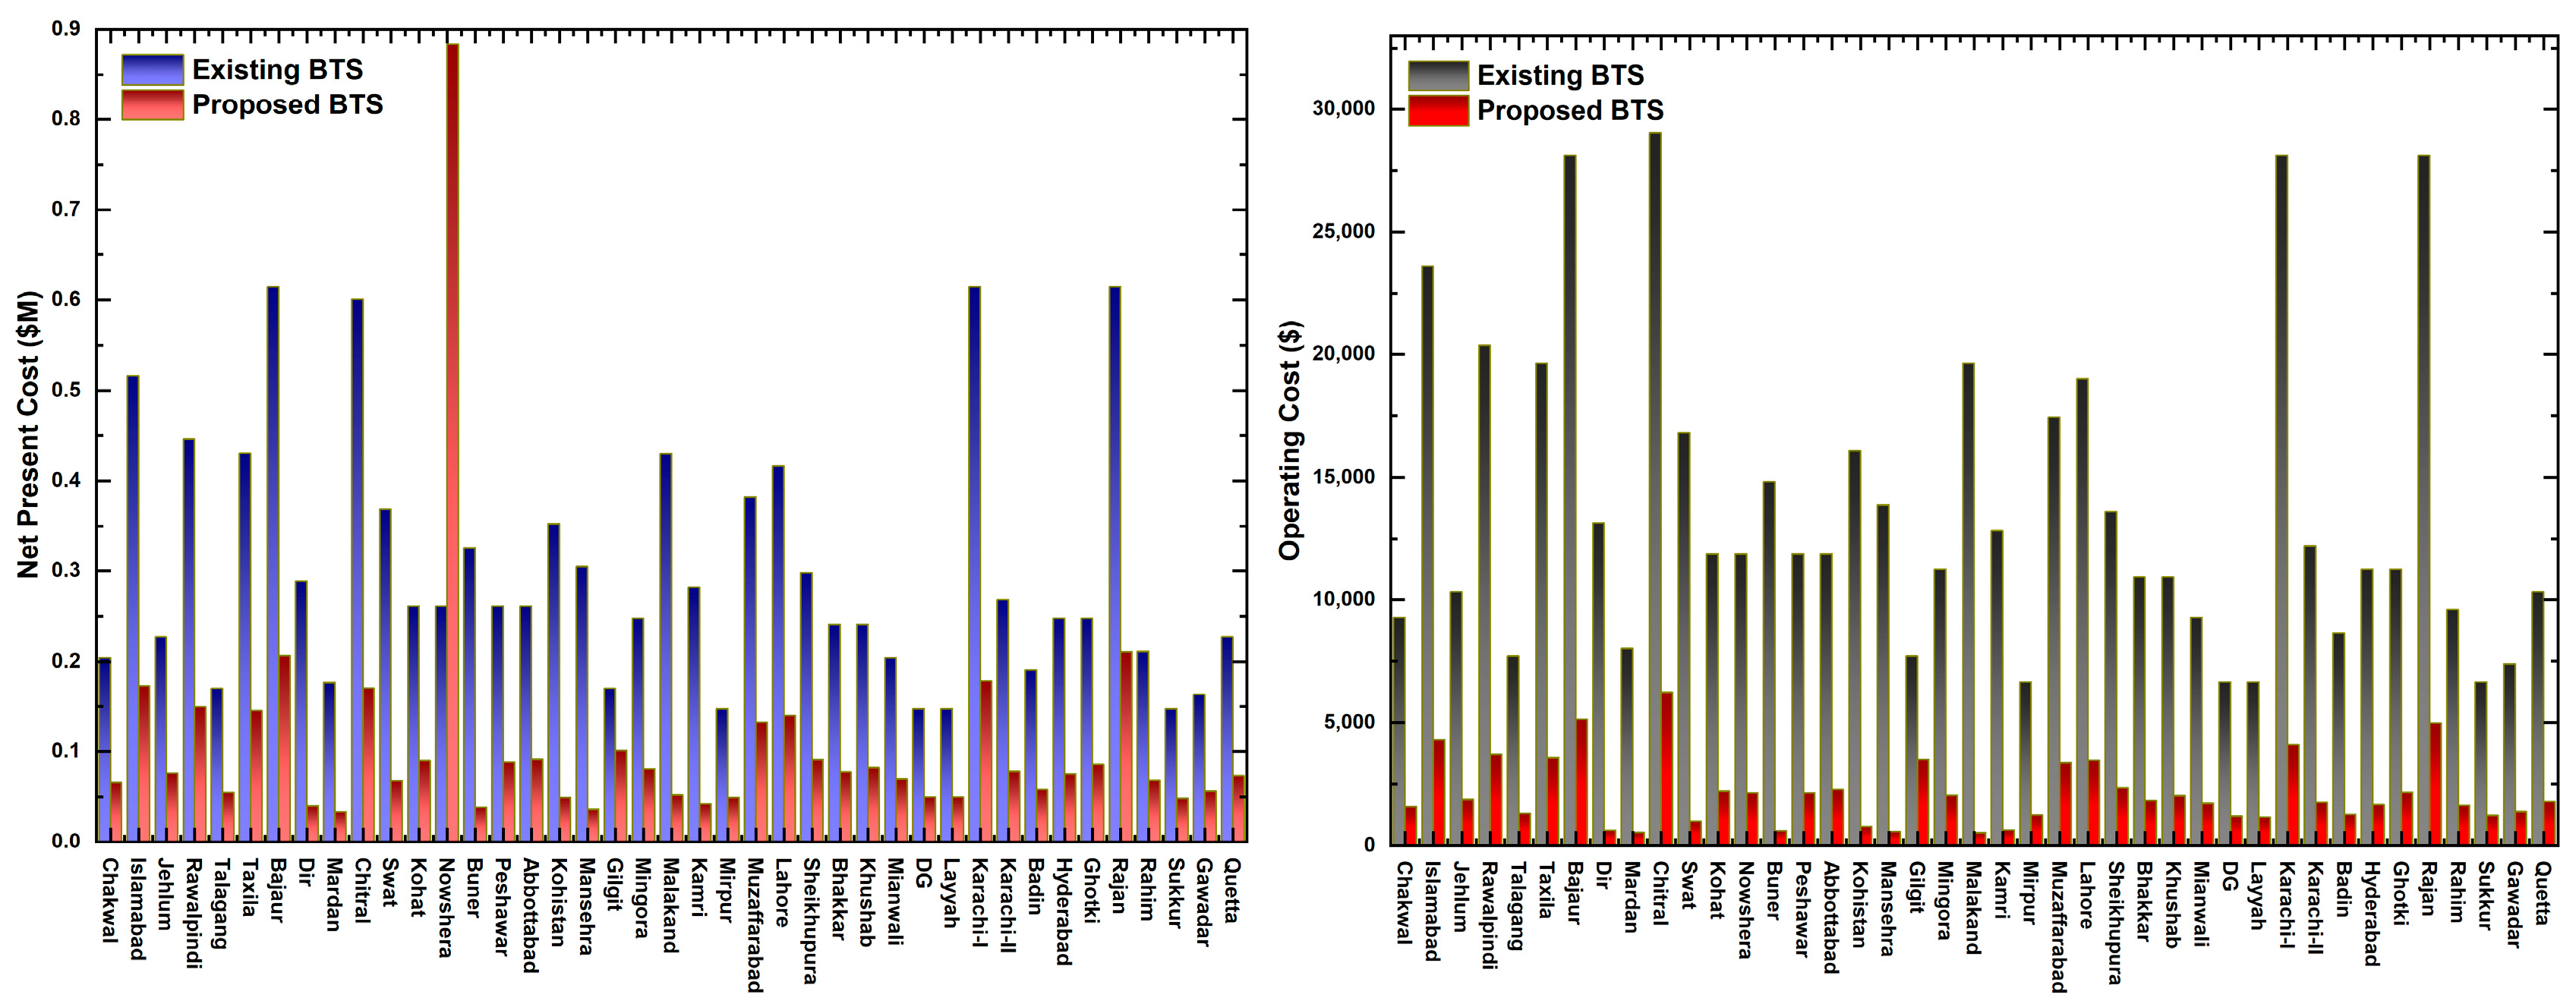
5.2.2. Operating Costs and Net Present Cost
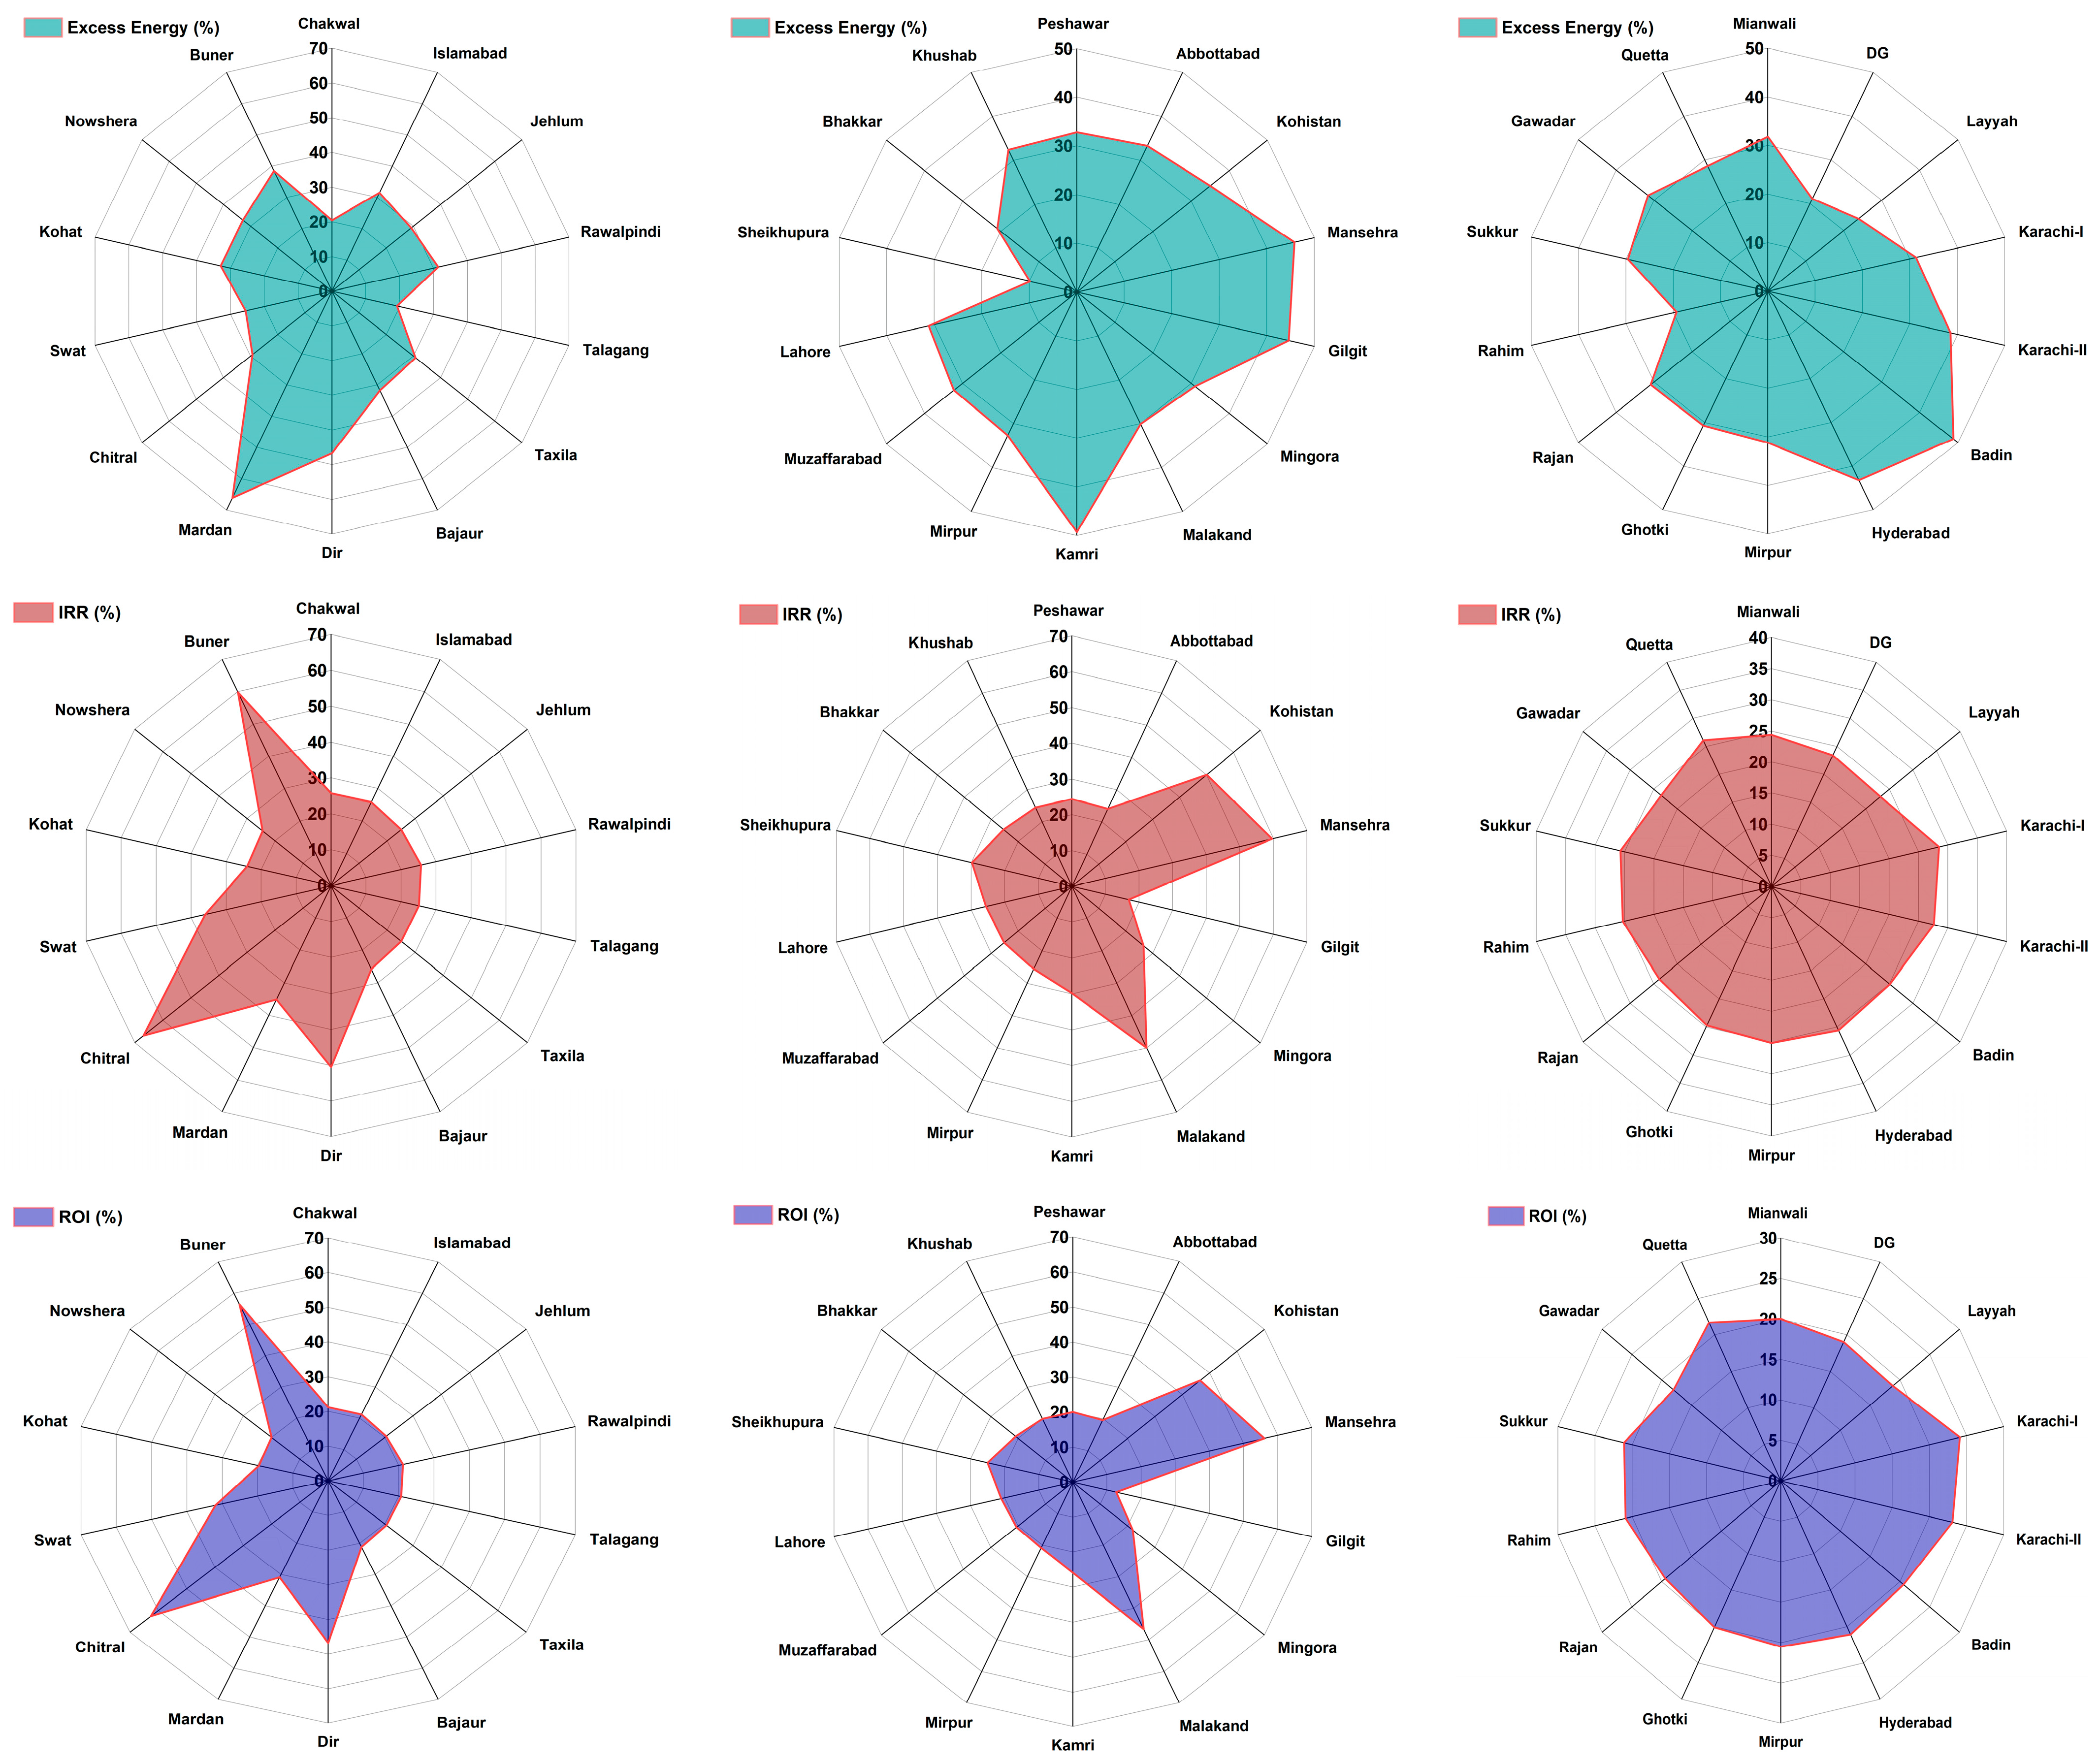
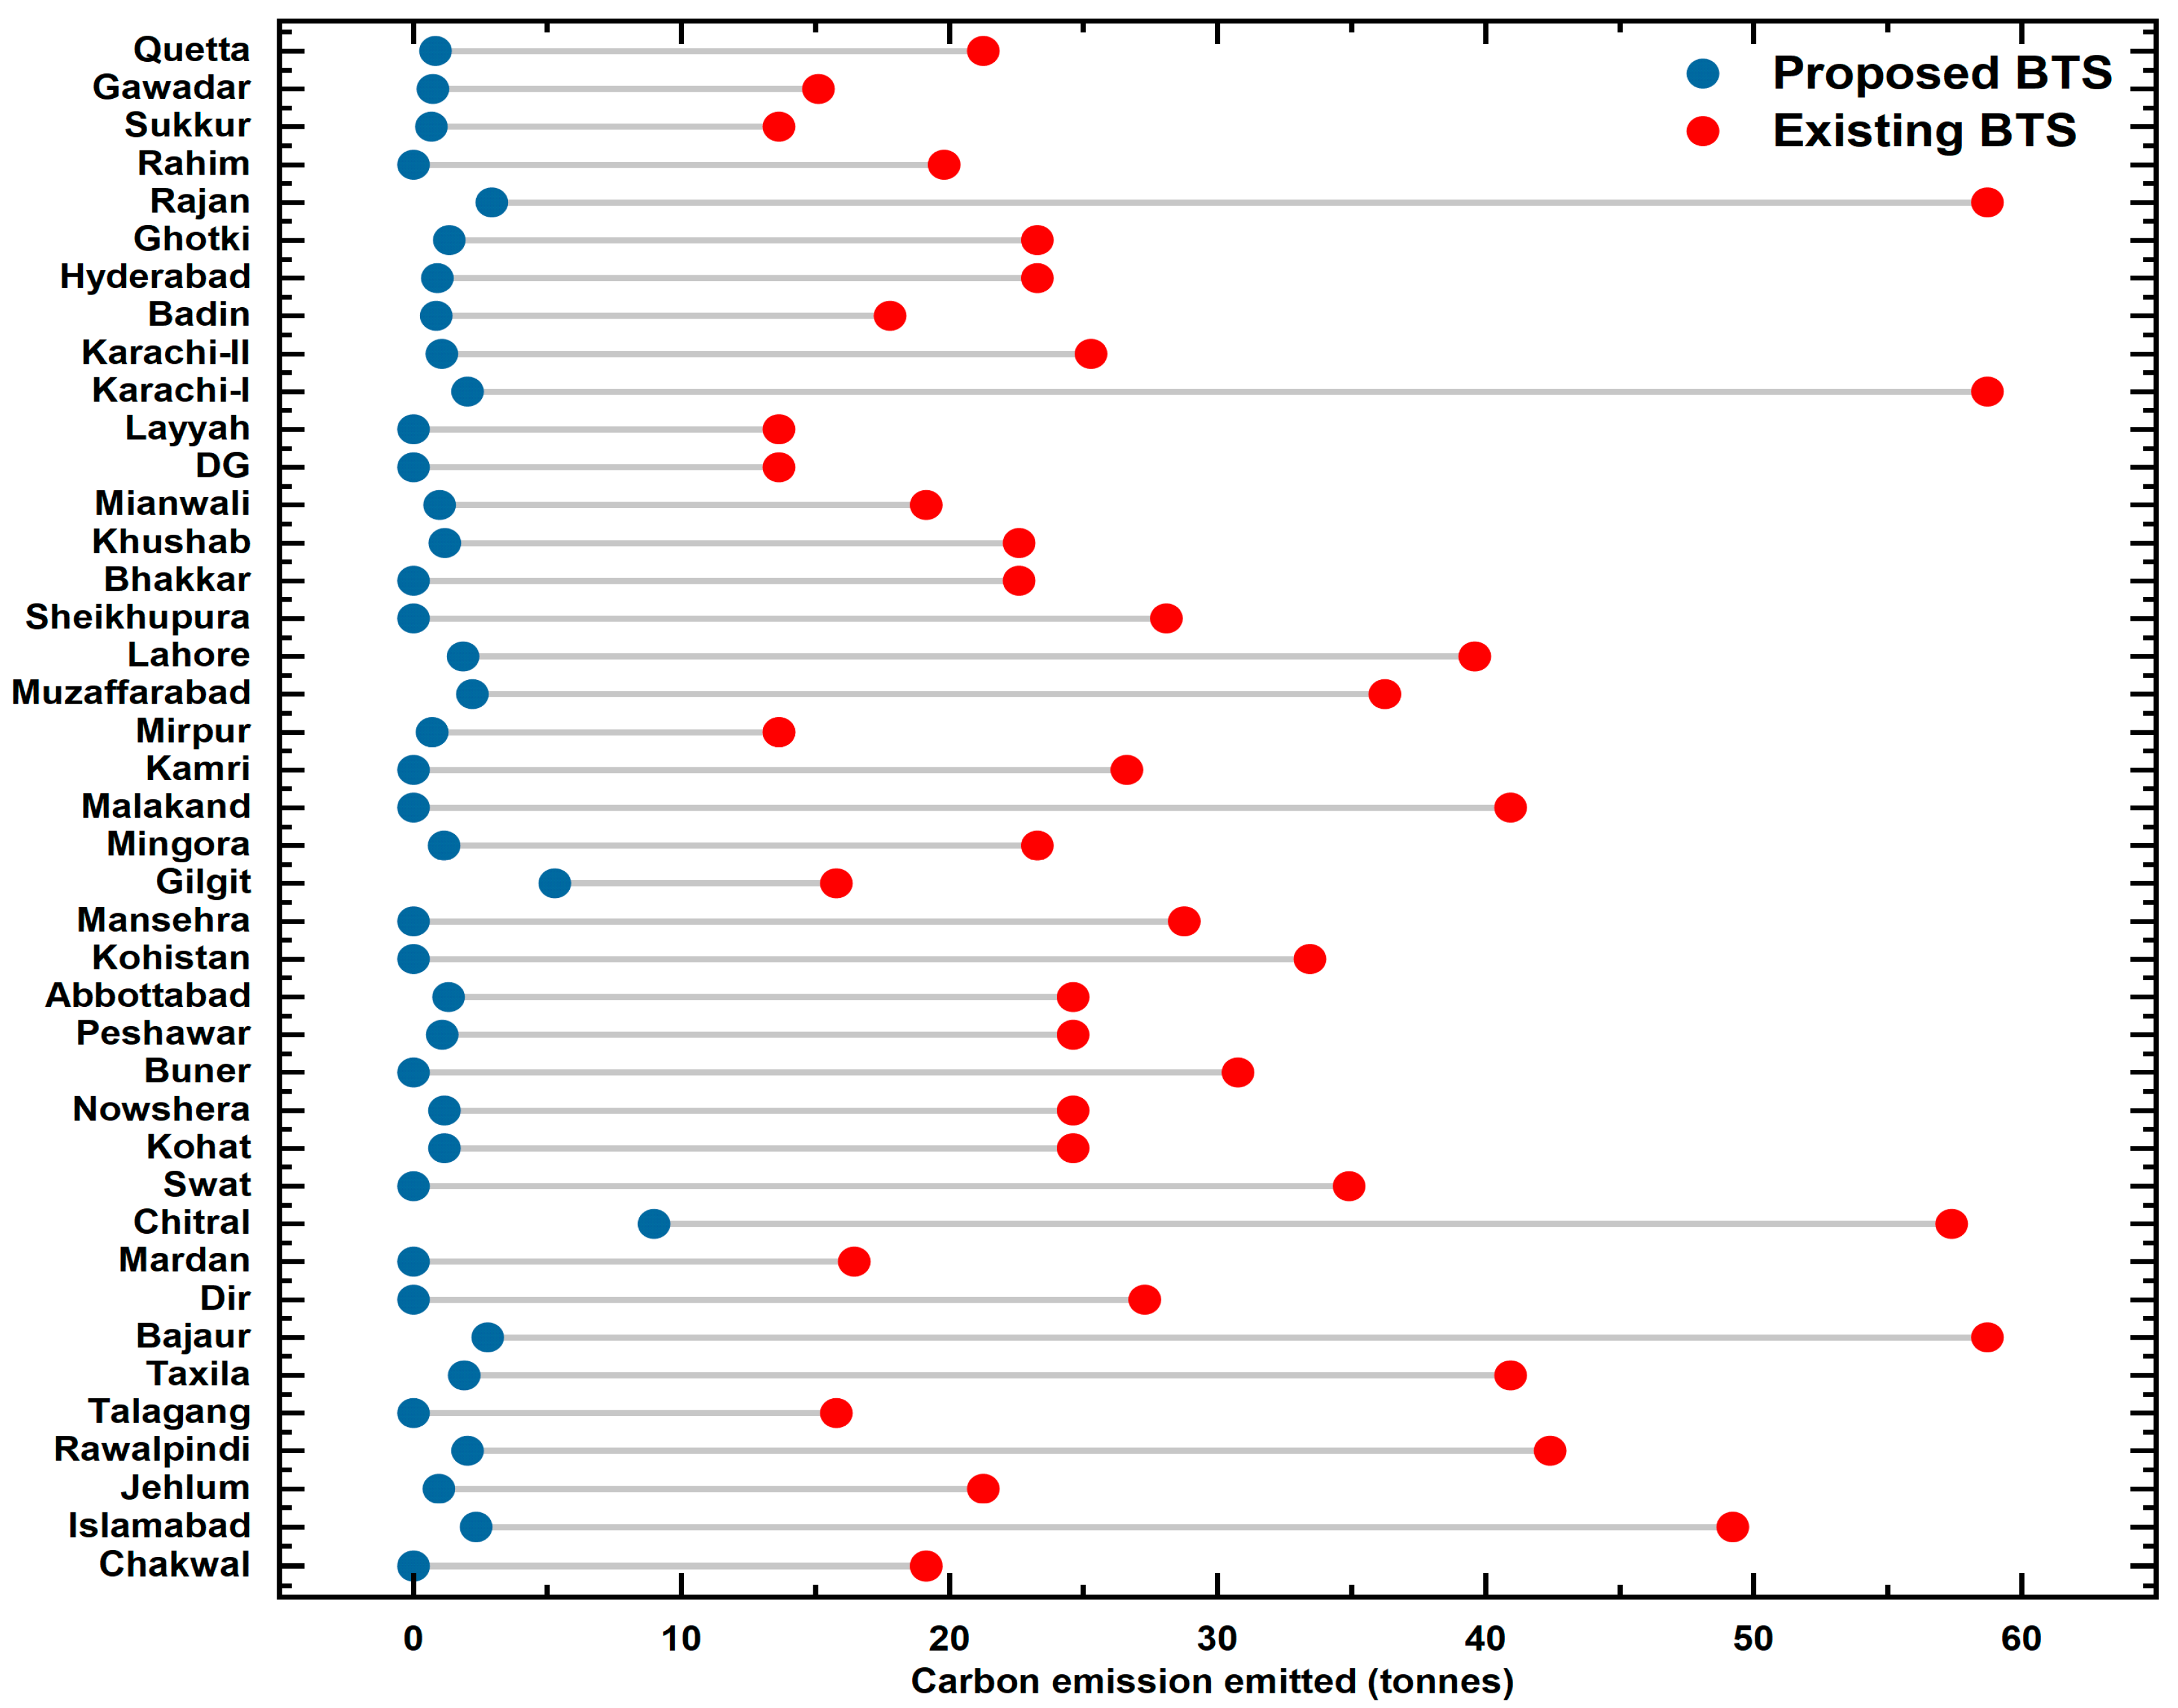
5.3. Environmental Analysis
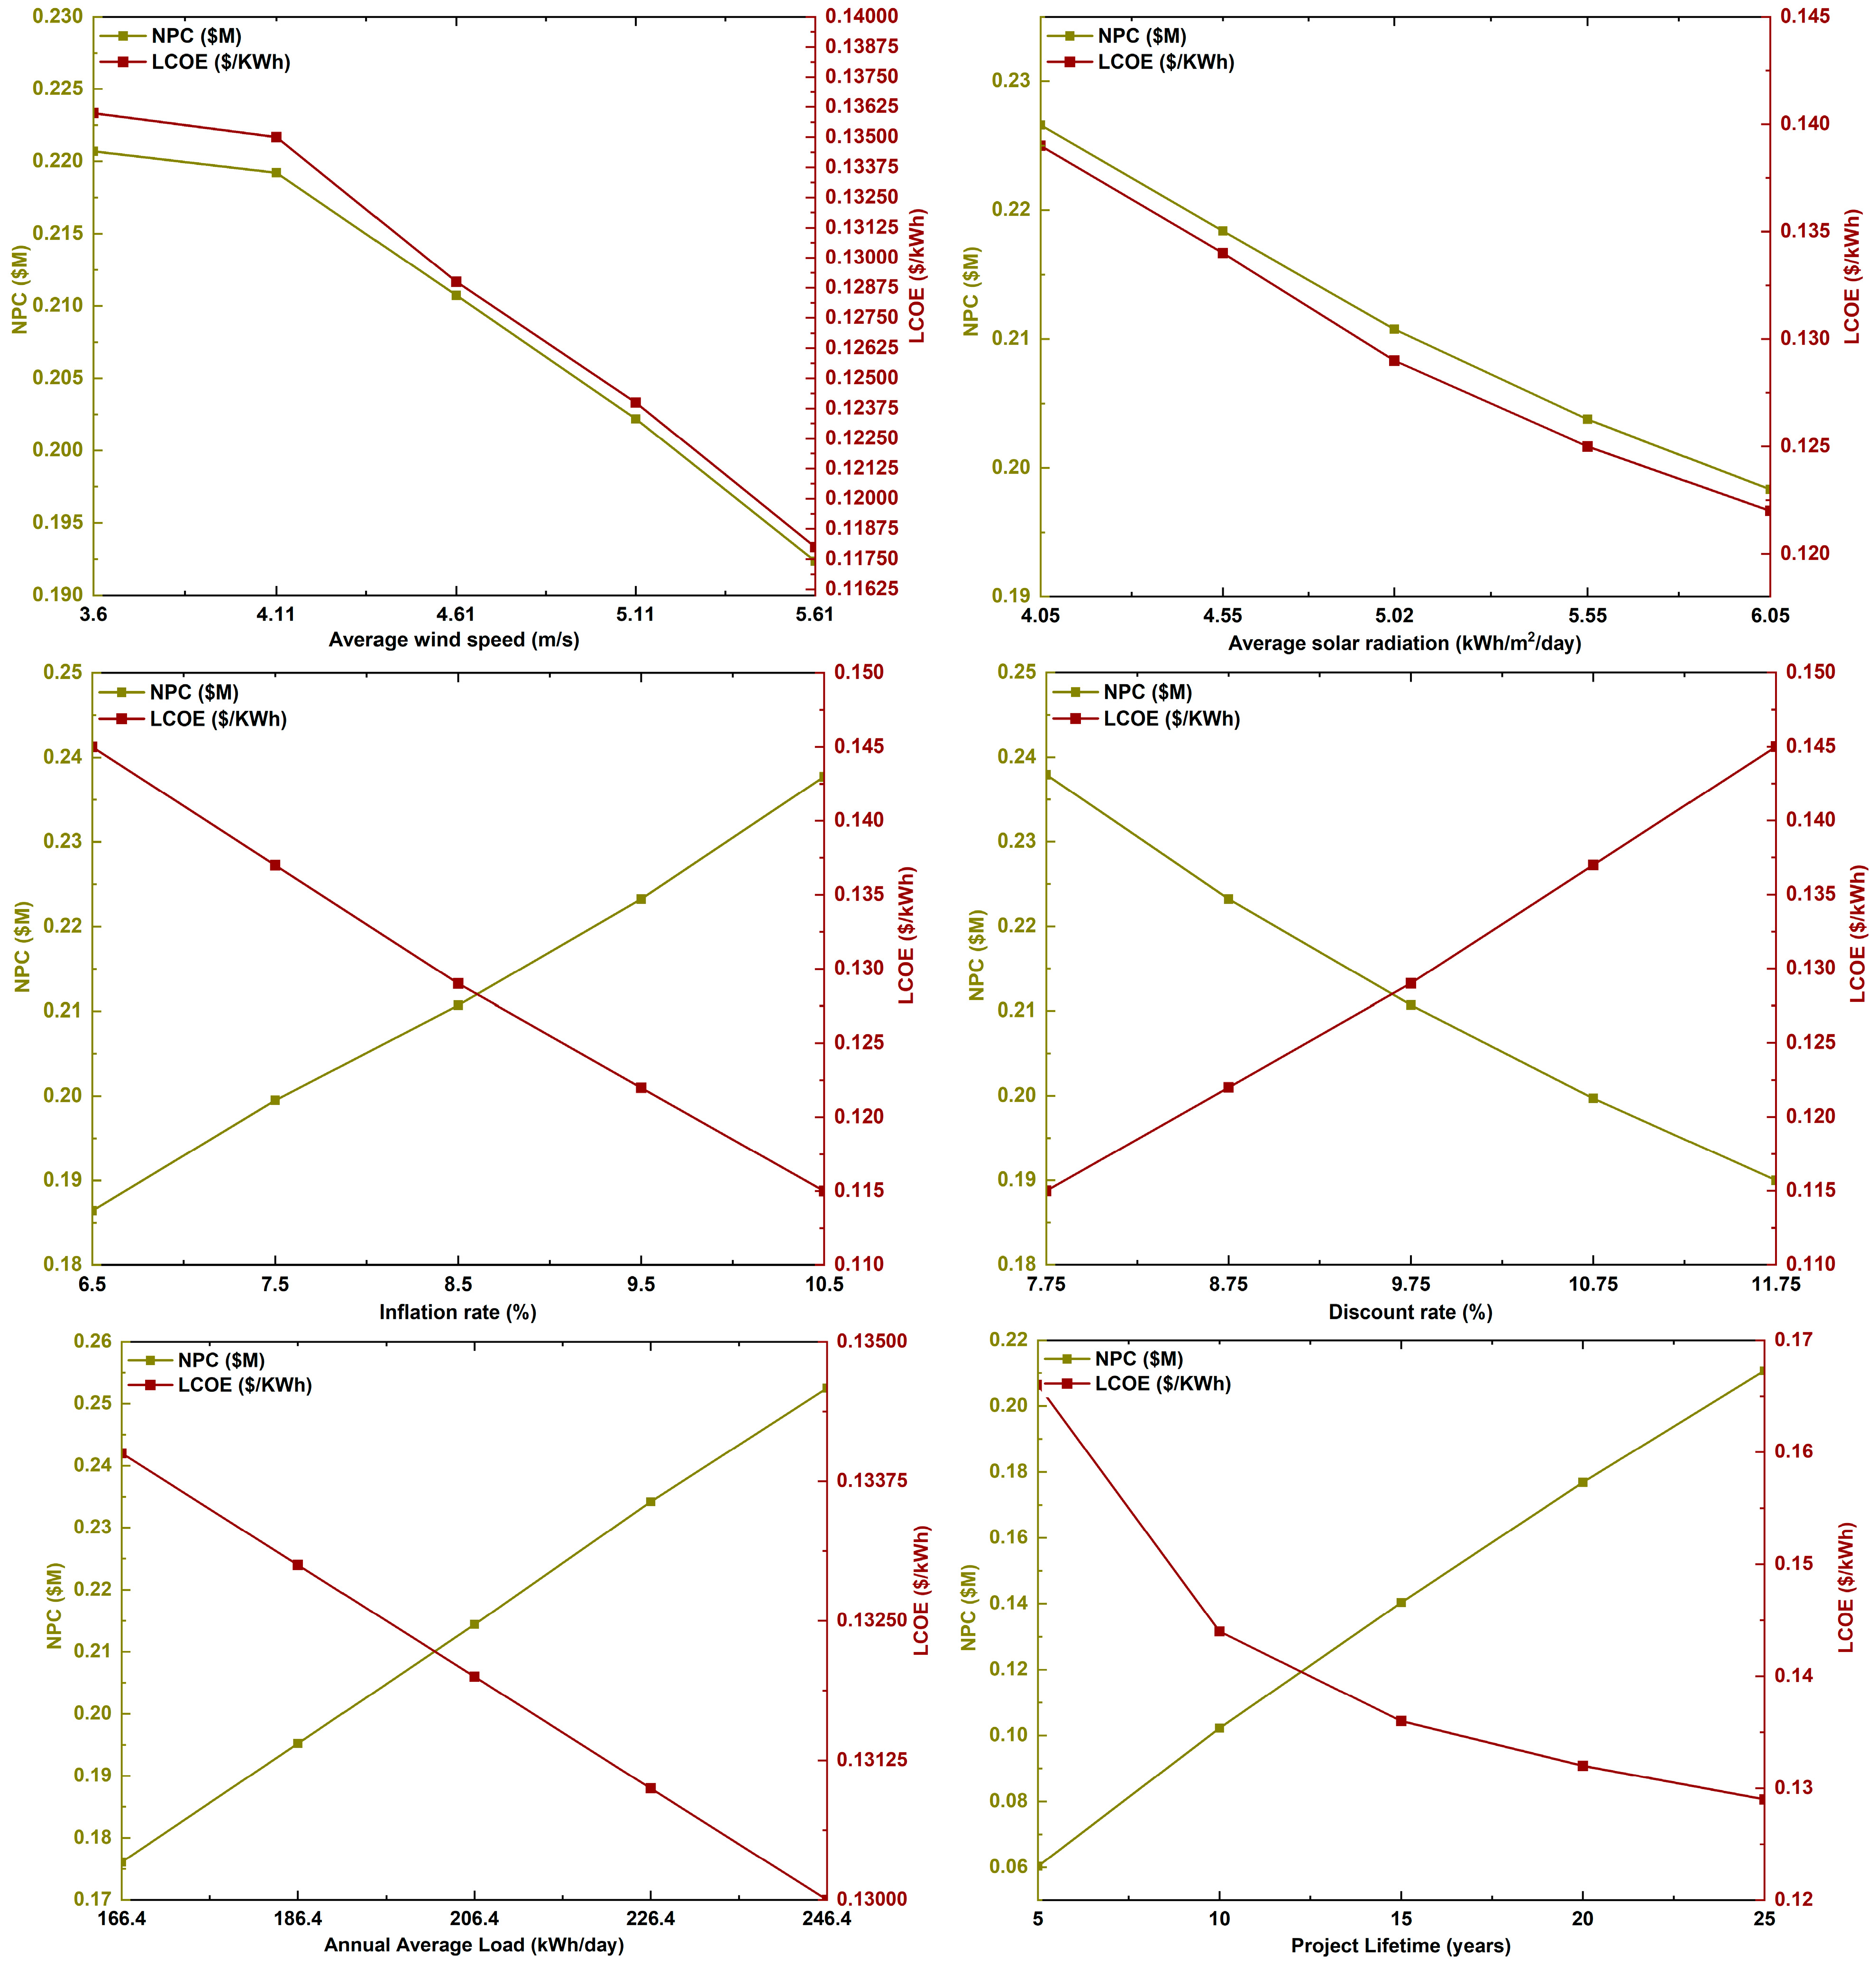
5.4. Sensitivity Analyses
5.4.1. Wind Speed and Solar Irradiance
5.4.2. Inflation and Discount Rates
5.4.3. Load Variation and Project Lifetime
6. Policy Recommendations and Implications for Future Research
- Handling the centralized grid risks, long-term market reservations, and financial support programs related to hybrid BTS installations in Pakistan calls for a comprehensive policy. Effective cost-recovery procedures, bearable procedures, and regulatory obligation management are all required in a regulatory framework.
- To identify loss-making BTS regions and assess the possibility for renewable energy, a simple method called the geospatial analysis methodology should be applied. Additionally, long-term premeditated planning for linking to the national grid can benefit from the use of this research. This information can also serve as a future base point for on-grid hybrid BTS stations, helping to optimize efficiency. It can assist various electricity supply firms and relevant authorities in achieving a consistent addition of renewable energy into Pakistan’s infrastructure and telecommunications sector.
- Lowering the initial capital expenditure from the investor’s perspective should be given priority in financial structures needed for the employment of energy-efficient projects in order to increase energy efficiency. Energy projects aiming to increase energy efficiency should include promising terms for debt financing, tariff control, financial leasing, and public–private and municipal–private collaborations.
- In order to achieve year-round power supply and help achieve Sustainable Development Goal 7 (SDG-7), it is necessary to evaluate the environmental effects in different areas where diesel generators are mixed with renewable energy sources (RESs) in a ratio that prefers RESs.
- An extra comprehensive sensitivity investigation is needed by taking the viewpoints of academics, investors, and customers with respect to the system’s levelized cost of energy (LCOE) and net present cost (NPC). Therefore, it makes sense to begin industry privatization efforts to maintain parameters that will hold for the foreseeable future.
- In further research, BTSs will offer local charging stations, facilitating the conversion of gasoline-powered cars to electric ones. It is necessary to amend policies regarding the duty tax on electric vehicles in order for customers to easily purchase electric cars and have access to BTS locations for charging them.
7. Conclusions
- Scalability: The findings can be scaled up for broader implementation across different telecom networks or regions. The integration of renewable resources like solar, hydro, biomass and wind technologies that are adaptable to varying geographical and operational conditions should be implemented.
- Cost-effectiveness: This proposed study concludes that shifting conventional BTS sites from diesel generators to renewable generation, as well as implementing the proposed hybrid renewable energy solutions, can lead to cost savings over time. The potential financial benefits or cost reductions compared to traditional energy sources can be quantified, showcasing economic feasibility.
- Environmental Impact: The techno-economic-environmental assessment of BTS sites emphasizes the environmental benefits due to lesser carbon emission. Dispensing with diesel generators lead to reducing reliance on fossil fuels, and integrating renewable energy sources can contribute to carbon footprint reduction and environmental sustainability.
- Technological Innovation: The majority of this research focused primarily on techno-economic-environmental analysis; not a single study has used economic resources and provision methodologies to support energy productivity. Accurate sustainability assessment was combined with technological, economic, and environmental optimization in a decision-making paradigm.
- Policy Implications: New regulatory frameworks or policy incentives could facilitate the adoption of hybrid renewable energy solutions in the telecom industry on a larger scale.
- Community and Stakeholder Engagement: Across their networks, telecom operators are essential to the implementation of hybrid renewable energy solutions. They can make investments in modernizing infrastructure and combining conventional energy systems with renewable energy sources like biomass, solar, and wind energy. Operators can lower costs and improve network reliability by managing energy use and implementing energy-efficient devices. By funding the creation of innovative technology for the integration of renewable energy, operators may stimulate innovation. In order to create telecom equipment that is energy-efficient, they might also work with equipment makers. By emphasizing these practical implications and applications, this proposed study effectively conveys the broader significance of research beyond technical and economic analyses, thereby enhancing its impact on both academia and industry stakeholders.
Author Contributions
Funding
Institutional Review Board Statement
Informed Consent Statement
Data Availability Statement
Conflicts of Interest
Abbreviations
| Nomenclature | |||
| ACSF | Annual capacity shortage fraction | LCOE | Levelized cost of energy |
| BTSs | Base transceiver stations | LF | Load following |
| CSF | Capacity shortfall percentage | PEDO | Pakhtunkhwa Energy Develop. Organization |
| CC | Charging cycle | PLC | Pakistan Telecommunication Company |
| CRF | Capital recovery factor | PBP | Payback period |
| DR | Discount rate | PV | Photovoltaic |
| DGs | Diesel Generators | PDFA | Proprietary derivative-free algorithm |
| DHI | Diffuse horizontal irradiance | RE | Renewable Energy |
| DNI | Direct normal irradiance | RERs | Renewable energy resources |
| DPSP | Deficiency of power supply probability | ROI | Return on investment |
| DOD | Depth of discharge | TNPC | Total net present cost |
| EC | Energy cost | MG | Microgrid |
| ESMAP | Energy Sector Management Assistance Program | NPC | Net present cost |
| GDP | Gross domestic product | NASA | National Aeronautics & Space Administration |
| GHGs | Greenhouse gases | OGSA | Original grid search algorithm |
| HOMER | Hybrid optimization model for electric renewable | PDFA | Proprietary derivative-free algorithm |
| HRES | Hybrid renewable energy system | SDGs | Sustainable Development Goals |
| HYD | Hydro energy | SOC | State of charge |
| HPPs | Hydel power plants | NEPRA | National Electric Power Regulatory Authority |
| IGCEP | Indicative Generation Capacity Expansion Plan | NEM | National energy mix |
| ICC | Initial capital cost | OPC | Operating cost |
| IR | Inflation rate | WAPDA | Water and Power Development Authority |
| IRR | Internal rate of return | ||
| List of symbols: | |||
| B | Lapse rate | k | Constant related to conductance |
| c | Storage capacity ratio | Loverall | Overall loss |
| DDB | Depth discharge of the battery | L | Designed flow rate (L/s) |
| Enom | Battery storage nominal capacity (Ah) | Lavail | Hydro turbine flow rate (L/s) |
| E(t) | Initial energy | Lmin, Lmax | Hydro turbine min and max flow rates (L/s) |
| Emax | Maximum storage capacity | P | Pressure (Pa) |
| g | Gravitational acceleration (9.81 m/s2) | R | Gas constant (287 J/kgK) |
Appendix A

| Inputs | Value | Source |
|---|---|---|
| Resource Factors | ||
| Temperature | HOMER NASA data | Location dependent |
| Solar radiations | HOMER NASA data | Location dependent |
| Hydel related parameters | HPPs | PEDO and WAPDA [7] |
| Speed of wind | HOMER NASA data | Location dependent |
| WT losses | LF: 21.02702% | Source: [7] |
| Biomass resources | tons | KPK livestock census 2006 |
| System economics | ||
| DR | 9.75% | Pakistan State Bank [7] |
| IR | 8.50% | Pakistan State Bank [7] |
| ACSF | 0.00% | Not Applicable |
| Project life | 25 yrs. | Not Applicable |
| Minimum renewable fraction | 0.00% | Not Applicable |
| Electrical load | ||
| kWh and kWh/day | Site-dependent | Pakistan Telco |
| Timestep and day-to-day variability | 0–1% | Not Applicable |
| Load profile | Commercial (constant) | HOMER dependent built in |
| Fuel and System costs | ||
| Diesel fuel price | 1.03 USD/L | Market value: Oct 05,2023 |
| Cost parameters | USD/kW | Previous studies |
| Biogas fuel price | 0.00 USD/kg | Not Applicable |
| Optimization settings | ||
| Optimization timestep | 60 min | Not Applicable |
| Focus factor | 50 | Not Applicable |
| NPC precision | 0.0100 | Not Applicable |
| System design precision | 0.0100 | Not Applicable |
| Battery Autonomy | Less than 2 h | Not Applicable |
| Maximum simulation per optimization | 10,000 | Not Applicable |
| Operating reserve | ||
| Load in current time step | 10.00% | Not Applicable |
| Wind power output | 50.00% | Not Applicable |
| Solar power output | 80.00% | Not Applicable |
| Site No. | Selected Areas | Proposed Structure | Existing Infrastructure | ||||||||||||||
|---|---|---|---|---|---|---|---|---|---|---|---|---|---|---|---|---|---|
| Confg. | DG | PV | WT | BM | Hydro | BA | Con. | DGH | DGFC | Confg. | DG | BA | Con. | DGH | DGFC | ||
| (kW) | (kW) | (No.) | (kW) | (kW) | (No.) | (kW) | (No.) | (L/yr.) | (kW) | (No.) | (kW) | (No.) | (L/yr.) | ||||
| Northern Zone | |||||||||||||||||
| BTS-01 | N-Chakwal | PV-BM-B | 0 | 19.3 | 0 | 5 | 0 | 66 | 3.14 | 0 | 0 | DG-B | 3.1 | 11 | 0.104 | 8760 | 7304 |
| BTS-02 | N-Islamabad | DG-PV-B | 8 | 59.6 | 0 | 0 | 0 | 165 | 8.00 | 522 | 895 | DG-B | 8 | 11 | 0.229 | 8760 | 18799 |
| BTS-03 | N-Jhelum | DG-PV-B | 3.5 | 25.5 | 0 | 0 | 0 | 77 | 3.41 | 489 | 366 | DG-B | 3.5 | 11 | 0.104 | 8760 | 8120 |
| BTS-04 | N-Rawalpindi | DG-PV-B | 6.9 | 51.4 | 0 | 0 | 0 | 143 | 6.88 | 523 | 774 | DG-B | 6.9 | 11 | 0.208 | 8760 | 16193 |
| BTS-05 | N-Talagang | PV-BM-B | 0 | 15.5 | 0 | 5 | 0 | 55 | 2.6 | 0 | 0 | DG-B | 2.6 | 11 | 0.083 | 8760 | 6026 |
| BTS-06 | N-Taxila | DG-PV-B | 6.6 | 50.2 | 0 | 0 | 0 | 143 | 6.64 | 507 | 726 | DG-B | 6.6 | 11 | 0.208 | 8760 | 15633 |
| BTS-07 | N-Bajaur | DG-PV-B | 9.5 | 70.9 | 0 | 0 | 0 | 198 | 9.48 | 524 | 1062 | DG-B | 9.5 | 11 | 0.271 | 8760 | 22427 |
| BTS-08 | N-Dir | PV-W-B-HYD | 0 | 2.02 | 1 | 0 | 5.49 | 11 | 0.146 | 0 | 0 | DG-B | 4.4 | 11 | 0.146 | 8760 | 10421 |
| BTS-09 | N-Mardan | PV-W-B-HYD | 0 | 1.21 | 1 | 0 | 5.15 | 11 | 0.083 | 0 | 0 | DG-B | 2.7 | 11 | 0.026 | 8760 | 6281 |
| BTS-10 | N-Chitral | DG-PV-B-HYD | 9.3 | 26.4 | 0 | 0 | 5.15 | 44 | 2.69 | 3210 | 3430 | DG-B | 9.3 | 11 | 0.087 | 8760 | 21916 |
| BTS-11 | N-Swat | W-HYD-B | 0 | 0 | 2 | 0 | 5.15 | 11 | 0.542 | 0 | 0 | DG-B | 5.7 | 11 | 0.053 | 8760 | 13331 |
| BTS-12 | N-Kohat | DG-PV-B | 4 | 31.8 | 0 | 0 | 0 | 88 | 3.96 | 518 | 443 | DG-B | 4 | 11 | 0.125 | 8760 | 9398 |
| BTS-13 | N-Nowshera | DG-PV-B | 4 | 31.0 | 0 | 0 | 0 | 88 | 4.01 | 466 | 407 | DG-B | 4 | 11 | 0.125 | 8760 | 9398 |
| BTS-14 | N-Buner | PV-W-B-HYD | 0 | 2.27 | 1 | 0 | 5.15 | 11 | 0.146 | 0 | 0 | DG-B | 5 | 11 | 0.047 | 8760 | 11748 |
| BTS-15 | N-Peshawar | DG-PV-B | 4 | 31.0 | 0 | 0 | 0 | 88 | 3.98 | 471 | 409 | DG-B | 4 | 11 | 0.125 | 8760 | 9398 |
| BTS-16 | N-Abbottabad | DG-PV-B | 4 | 31.2 | 0 | 0 | 0 | 88 | 4.01 | 581 | 504 | DG-B | 4.1 | 11 | 0.125 | 8760 | 9654 |
| BTS-17 | N-Kohistan | PV-W-B-HYD | 0 | 2.46 | 1 | 0 | 5.49 | 11 | 0.167 | 0 | 0 | DG-B | 5.4 | 11 | 0.053 | 8760 | 12771 |
| BTS-18 | N-Mansehra | PV-W-B-HYD | 0 | 2.1 | 1 | 0 | 5.49 | 11 | 0146 | 0 | 0 | DG-B | 4.7 | 11 | 0.047 | 8760 | 10981 |
| BTS-19 | N-Gilgit | DG-PV-B | 2.59 | 21.3 | 0 | 0 | 0 | 44 | 2.59 | 3687 | 2017 | DG-B | 2.6 | 11 | 0.083 | 8760 | 6026 |
| BTS-20 | N-Mingora | DG-PV-B | 3.8 | 27.1 | 0 | 0 | 0 | 77 | 3.74 | 545 | 436 | DG-B | 3.8 | 11 | 0.040 | 8760 | 8887 |
| BTS-21 | N-Malakand | DG-PV-W-HYD | 6.6 | 5.29 | 2 | 0 | 5.49 | 0 | 0.677 | 0 | 0 | DG-B | 6.6 | 11 | 0.067 | 8760 | 15633 |
| BTS-22 | N-Kamri | DG-PV-W-HYD | 4.3 | 3.43 | 2 | 0 | 5.15 | 0 | 0.406 | 0 | 0 | DG-B | 4.3 | 11 | 0.040 | 8760 | 10165 |
| BTS-23 | N-Mirpur | DG-PV-B | 2.2 | 17.1 | 0 | 0 | 0 | 44 | 2.2 | 268 | 0.734 | DG-B | 2.2 | 11 | 0.016 | 8760 | 5210 |
| BTS-24 | N-Muzaffarabad | DG-PV-B | 5.9 | 44.8 | 0 | 0 | 0 | 121 | 5.84 | 840 | 2.3 | DG-B | 5.9 | 11 | 0.053 | 8760 | 13843 |
| Central Zone | |||||||||||||||||
| BTS-25 | C-Lahore | DG-PV-B | 6.4 | 48.9 | 0 | 0 | 0 | 132 | 6.41 | 511 | 708 | DG-B | 6.4 | 11 | 0.188 | 8760 | 15121 |
| BTS-26 | C-Sheikhupura | PV-BM-B | 0 | 25.4 | 0 | 5 | 0 | 88 | 4.94 | 0 | 0 | DG-B | 4.6 | 11 | 0.146 | 8760 | 10272 |
| BTS-27 | C-Bhakkar | PV-BM-B | 0 | 25.0 | 0 | 5 | 0 | 77 | 3.73 | 0 | 0 | DG-B | 3.7 | 11 | 0.104 | 8760 | 8631 |
| BTS-28 | C-Khushab | DG-PV-B | 3.7 | 29.4 | 0 | 0 | 0 | 77 | 3.64 | 561 | 448 | DG-B | 2.2 | 11 | 0.083 | 8760 | 5210 |
| BTS-29 | C-Mianwali | DG-PV-B | 3.1 | 24.6 | 0 | 0 | 0 | 66 | 3.14 | 552 | 374 | DG-B | 3.1 | 11 | 0.104 | 8760 | 7304 |
| BTS-30 | C-DG Khan | PV-BM-B | 0 | 15.3 | 0 | 5 | 0 | 44 | 2.27 | 0 | 0 | DG-B | 2.2 | 11 | 0.083 | 8760 | 5210 |
| BTS-31 | C-Layyah | PV-BM-B | 0 | 15.8 | 0 | 5 | 0 | 44 | 2.22 | 0 | 0 | DG-B | 2.2 | 11 | 0.083 | 8760 | 5210 |
| Northern Zone | |||||||||||||||||
| BTS-32 | N-Karachi-I | DG-PV-W-B | 9.5 | 54.2 | 1 | 0 | 0 | 154 | 9.47 | 473 | 775 | DG-B | 9.5 | 11 | 0.271 | 8760 | 22427 |
| BTS-33 | N-Karachi-II | DG-PV-W-B | 4.1 | 16.2 | 1 | 0 | 0 | 55 | 4.18 | 589 | 407 | DG-B | 4.1 | 11 | 0.125 | 8760 | 9654 |
| BTS-34 | N-Badin | DG-PV-W-B | 2.9 | 10.4 | 1 | 0 | 0 | 33 | 2.94 | 670 | 329 | DG-B | 2.9 | 11 | 0.083 | 8760 | 6793 |
| BTS-35 | N-Hyderabad | DG-PV-W-B | 3.8 | 15.7 | 1 | 0 | 0 | 55 | 3.75 | 522 | 344 | DG-B | 3.8 | 11 | 0.125 | 8760 | 8887 |
| BTS-36 | N-Mirpur Khas | DG-PV-B | 2.2 | 17.6 | 0 | 0 | 0 | 44 | 2.2 | 561 | 269 | DG-B | 2.2 | 11 | 0.083 | 8760 | 5210 |
| BTS-37 | N-Ghotki | DG-PV-B | 3.8 | 30.1 | 0 | 0 | 0 | 77 | 3.76 | 630 | 513 | DG-B | 3.8 | 11 | 0.125 | 8760 | 8887 |
| BTS-38 | N-Rajan Pur | DG-PV-W-B | 9.5 | 66.8 | 1 | 0 | 0 | 176 | 0.129 | 592 | 1116 | DG-B | 9.5 | 11 | 0.271 | 8760 | 22427 |
| BTS-39 | N-Rahim Yar Khan | PV-BM-B | 0 | 21.4 | 0 | 0 | 0 | 66 | 3.22 | 0 | 0 | DG-B | 3.2 | 11 | 0.104 | 8760 | 7560 |
| BTS-40 | N-Sukkur | DG-PV-B | 2.2 | 17 | 0 | 0 | 0 | 44 | 2.23 | 536 | 257 | DG-B | 2.2 | 11 | 0.083 | 8760 | 5210 |
| BTS-41 | N-Gawadar | DG-PV-B | 2.5 | 20 | 0 | 0 | 0 | 55 | 2.43 | 522 | 277 | DG-B | 2.5 | 11 | 0.083 | 8760 | 5770 |
| BTS-42 | N-Quetta | DG-PV-B | 3.5 | 23.9 | 0 | 0 | 0 | 77 | 3.42 | 425 | 313 | DG-B | 3.5 | 11 | 0.104 | 8760 | 8120 |
References
- Das, B.K.; Hassan, R.; Tushar, M.S.H.; Zaman, F.; Hasan, M.; Das, P. Techno-economic and environmental assessment of a hybrid renewable energy system using multi-objective genetic algorithm: A case study for remote Island in Bangladesh. Energy Convers. Manag. 2021, 230, 113823. [Google Scholar] [CrossRef]
- Abdulmula, A.M.; Sopian, K.; Haw, L.C.; Fazlizan, A. Performance evaluation of standalone double axis solar tracking system with maximum light detection MLD for telecommunication towers in Malaysia. Int. J. Power Electron. Drive Syst. 2019, 10, 444. [Google Scholar]
- Amutha, W.M.; Andrew, H.C.; Shajie, A.D.; Paulraj, J.P.I. Renewable power interface based rural telecom. Int. J. Power Electron. Drive Syst. 2019, 10, 917. [Google Scholar] [CrossRef]
- Oviroh, P.O.; Jen, T.-C. The energy cost analysis of hybrid systems and diesel generators in powering selected base transceiver station locations in Nigeria. Energies 2018, 11, 687. [Google Scholar] [CrossRef]
- Babatunde, O.M.; Denwigwe, I.H.; Babatunde, D.E.; Ayeni, A.O.; Adedoja, T.B.; Adedoja, O.S. Techno-economic assessment of photovoltaic-diesel generator-battery energy system for base transceiver stations loads in Nigeria. Cogent Eng. 2019, 6, 1684805. [Google Scholar] [CrossRef]
- Ali, M.; Wazir, R.; Imran, K.; Ullah, K.; Janjua, A.K.; Ulasyar, A.; Khattak, A.; Guerrero, J.M. Techno-economic assessment and sustainability impact of hybrid energy systems in Gilgit-Baltistan, Pakistan. Energy Rep. 2021, 7, 2546–2562. [Google Scholar] [CrossRef]
- Khan, S.N.; Kazmi, S.A.A. Integrative decision-making framework for techno-economic planning and sustainability assessment of renewable dominated standalone hybrid microgrids infrastructure at provincial scale of Pakistan. Energy Convers. Manag. 2022, 270, 116168. [Google Scholar] [CrossRef]
- Montuori, L.; Alcázar-Ortega, M.; Álvarez-Bel, C.; Domijan, A. Integration of renewable energy in microgrids coordinated with demand response resources: Economic evaluation of a biomass gasification plant by Homer Simulator. Appl. Energy 2014, 132, 15–22. [Google Scholar] [CrossRef]
- Murugaperumal, K.; Raj, P.A.D.V. Feasibility design and techno-economic analysis of hybrid renewable energy system for rural electrification. Sol. Energy 2019, 188, 1068–1083. [Google Scholar] [CrossRef]
- Shahzad, M.K.; Zahid, A.; ur Rashid, T.; Rehan, M.A.; Ali, M.; Ahmad, M. Techno-economic feasibility analysis of a solar-biomass off grid system for the electrification of remote rural areas in Pakistan using HOMER software. Renew. Energy 2017, 106, 264–273. [Google Scholar] [CrossRef]
- Ali, F.; Ahmar, M.; Jiang, Y.; AlAhmad, M. A techno-economic assessment of hybrid energy systems in rural Pakistan. Energy 2021, 215, 119103. [Google Scholar] [CrossRef]
- Goel, S.; Ali, S.M. Hybrid energy systems for off-grid remote telecom tower in Odisha, India. Int. J. Ambient. Energy 2015, 36, 116–122. [Google Scholar] [CrossRef]
- Amara, S.; Toumi, S.; Salah, C.B.; Saidi, A.S. Improvement of techno-economic optimal sizing of a hybrid off-grid micro-grid system. Energy 2021, 233, 121166. [Google Scholar] [CrossRef]
- Shezan, S.A.; Ishraque, M.F.; Muyeen, S.; Arifuzzaman, S.; Paul, L.C.; Das, S.K.; Sarker, S.K. Effective dispatch strategies assortment according to the effect of the operation for an islanded hybrid microgrid. Energy Convers. Manag. X 2022, 14, 100192. [Google Scholar] [CrossRef]
- Alshammari, N.; Asumadu, J. Optimum unit sizing of hybrid renewable energy system utilizing harmony search, Jaya and particle swarm optimization algorithms. Sustain. Cities Soc. 2020, 60, 102255. [Google Scholar] [CrossRef]
- Kumar, A.; Verma, A. Optimal techno-economic sizing of a solar-biomass-battery hybrid system for off-setting dependency on diesel generators for microgrid facilities. J. Energy Storage 2021, 36, 102251. [Google Scholar]
- Naderipour, A.; Ramtin, A.R.; Abdullah, A.; Marzbali, M.H.; Nowdeh, S.A.; Kamyab, H. Hybrid energy system optimization with battery storage for remote area application considering loss of energy probability and economic analysis. Energy 2022, 239, 122303. [Google Scholar] [CrossRef]
- Li, C.; Zhou, D.; Wang, H.; Lu, Y.; Li, D. Techno-economic performance study of stand-alone wind/diesel/battery hybrid system with different battery technologies in the cold region of China. Energy 2020, 192, 116702. [Google Scholar] [CrossRef]
- Okundamiya, M.S.; Wara, S.T.; Obakhena, H.I. Optimization and techno-economic analysis of a mixed power system for sustainable operation of cellular sites in 5G era. Int. J. Hydrogen Energy 2022, 47, 17351–17366. [Google Scholar] [CrossRef]
- Memon, S.A.; Upadhyay, D.S.; Patel, R.N. Optimal configuration of solar and wind-based hybrid renewable energy system with and without energy storage including environmental and social criteria: A case study. J. Energy Storage 2021, 44, 103446. [Google Scholar] [CrossRef]
- Khan, F.A.; Pal, N.; Saeed, S.H. Optimization and sizing of SPV/Wind hybrid renewable energy system: A techno-economic and social perspective. Energy 2021, 233, 121114. [Google Scholar] [CrossRef]
- Diab, A.A.Z.; Sultan, H.M.; Kuznetsov, O.N. Optimal sizing of hybrid solar/wind/hydroelectric pumped storage energy system in Egypt based on different meta-heuristic techniques. Environ. Sci. Pollut. Res. 2020, 27, 32318–32340. [Google Scholar] [CrossRef] [PubMed]
- Das, B.K.; Alotaibi, M.A.; Das, P.; Islam, M.; Das, S.K.; Hossain, M.A. Feasibility and techno-economic analysis of stand-alone and grid-connected PV/Wind/Diesel/Batt hybrid energy system: A case study. Energy Strategy Rev. 2021, 37, 100673. [Google Scholar] [CrossRef]
- Kushwaha, P.K.; Bhattacharjee, C. Integrated techno-economic-enviro-socio design of the hybrid renewable energy system with suitable dispatch strategy for domestic and telecommunication load across India. J. Energy Storage 2022, 55, 105340. [Google Scholar] [CrossRef]
- Kuetche, C.F.M.; Tsuanyo, D.; Fopah-Lele, A. Analysis of Hybrid Energy Systems for Telecommunications Equipment: A Case Study in Buea Cameroon. E3S Web Conf. 2022, 354, 02007. [Google Scholar] [CrossRef]
- Odou, O.D.T.; Bhandari, R.; Adamou, R. Hybrid off-grid renewable power system for sustainable rural electrification in Benin. Renew. Energy 2020, 145, 1266–1279. [Google Scholar] [CrossRef]
- Kumar, J.; Suryakiran, B.; Verma, A.; Bhatti, T. Analysis of techno-economic viability with demand response strategy of a grid-connected microgrid model for enhanced rural electrification in Uttar Pradesh state, India. Energy 2019, 178, 176–185. [Google Scholar] [CrossRef]
- Ramesh, M.; Saini, R.P. Dispatch strategies based performance analysis of a hybrid renewable energy system for a remote rural area in India. J. Clean. Prod. 2020, 259, 120697. [Google Scholar] [CrossRef]
- Mayer, M.J.; Szilágyi, A.; Gróf, G. Environmental and economic multi-objective optimization of a household level hybrid renewable energy system by genetic algorithm. Appl. Energy 2020, 269, 115058. [Google Scholar] [CrossRef]
- Veilleux, G.; Potisat, T.; Pezim, D.; Ribback, C.; Ling, J.; Krysztofiński, A.; Ahmed, A.; Papenheim, J.; Pineda, A.M.; Sembian, S. Techno-economic analysis of microgrid projects for rural electrification: A systematic approach to the redesign of Koh Jik off-grid case study. Energy Sustain. Dev. 2020, 54, 1–13. [Google Scholar] [CrossRef]
- Aziz, A.S.; Tajuddin, M.F.N.; Adzman, M.R.; Mohammed, M.F.; Ramli, M.A. Feasibility analysis of grid-connected and islanded operation of a solar PV microgrid system: A case study of Iraq. Energy 2020, 191, 116591. [Google Scholar] [CrossRef]
- Alharthi, Y.Z.; Siddiki, M.K.; Chaudhry, G.M. Resource assessment and techno-economic analysis of a grid-connected solar PV-wind hybrid system for different locations in Saudi Arabia. Sustainability 2018, 10, 3690. [Google Scholar] [CrossRef]
- Das, B.K.; Zaman, F. Performance analysis of a PV/Diesel hybrid system for a remote area in Bangladesh: Effects of dispatch strategies, batteries, and generator selection. Energy 2019, 169, 263–276. [Google Scholar] [CrossRef]
- Kumar, A.; Singh, A.R.; Deng, Y.; He, X.; Kumar, P.; Bansal, R.C. A novel methodological framework for the design of sustainable rural microgrid for developing nations. IEEE Access 2018, 6, 24925–24951. [Google Scholar] [CrossRef]
- Kim, M.-H.; Kim, D.; Heo, J.; Lee, D.-W. Techno-economic analysis of hybrid renewable energy system with solar district heating for net zero energy community. Energy 2019, 187, 115916. [Google Scholar] [CrossRef]
- Baseer, M.; Alqahtani, A.; Rehman, S. Techno-economic design and evaluation of hybrid energy systems for residential communities: Case study of Jubail industrial city. J. Clean. Prod. 2019, 237, 117806. [Google Scholar] [CrossRef]
- Javed, M.S.; Song, A.; Ma, T. Techno-economic assessment of a stand-alone hybrid solar-wind-battery system for a remote island using genetic algorithm. Energy 2019, 176, 704–717. [Google Scholar] [CrossRef]
- Sawle, Y.; Gupta, S.; Bohre, A.K. Socio-techno-economic design of hybrid renewable energy system using optimization techniques. Renew. Energy 2018, 119, 459–472. [Google Scholar] [CrossRef]
- Ahmad, J.; Imran, M.; Khalid, A.; Iqbal, W.; Ashraf, S.R.; Adnan, M.; Ali, S.F.; Khokhar, K.S. Techno economic analysis of a wind-photovoltaic-biomass hybrid renewable energy system for rural electrification: A case study of Kallar Kahar. Energy 2018, 148, 208–234. [Google Scholar] [CrossRef]
- Duman, A.C.; Güler, Ö. Techno-economic analysis of off-grid PV/wind/fuel cell hybrid system combinations with a comparison of regularly and seasonally occupied households. Sustain. Cities Soc. 2018, 42, 107–126. [Google Scholar] [CrossRef]
- Azimoh, C.L.; Klintenberg, P.; Mbohwa, C.; Wallin, F. Replicability and scalability of mini-grid solution to rural electrification programs in sub-Saharan Africa. Renew. Energy 2017, 106, 222–231. [Google Scholar] [CrossRef]
- Das, H.S.; Tan, C.W.; Yatim, A.; Lau, K.Y. Feasibility analysis of hybrid photovoltaic/battery/fuel cell energy system for an indigenous residence in East Malaysia. Renew. Sustain. Energy Rev. 2017, 76, 1332–1347. [Google Scholar] [CrossRef]
- Vides-Prado, A.; Camargo, E.O.; Vides-Prado, C.; Orozco, I.H.; Chenlo, F.; Candelo, J.E.; Sarmiento, A.B. Techno-economic feasibility analysis of photovoltaic systems in remote areas for indigenous communities in the Colombian Guajira. Renew. Sustain. Energy Rev. 2018, 82, 4245–4255. [Google Scholar] [CrossRef]
- Park, E. Potentiality of renewable resources: Economic feasibility perspectives in South Korea. Renew. Sustain. Energy Rev. 2017, 79, 61–70. [Google Scholar] [CrossRef]
- Yilmaz, S.; Dincer, F. Optimal design of hybrid PV-Diesel-Battery systems for isolated lands: A case study for Kilis, Turkey. Renew. Sustain. Energy Rev. 2017, 77, 344–352. [Google Scholar] [CrossRef]
- Al-Sharafi, A.; Sahin, A.Z.; Ayar, T.; Yilbas, B.S. Techno-economic analysis and optimization of solar and wind energy systems for power generation and hydrogen production in Saudi Arabia. Renew. Sustain. Energy Rev. 2017, 69, 33–49. [Google Scholar] [CrossRef]
- Abdin, Z.; Mérida, W. Hybrid energy systems for off-grid power supply and hydrogen production based on renewable energy: A techno-economic analysis. Energy Convers. Manag. 2019, 196, 1068–1079. [Google Scholar] [CrossRef]
- Jaiswal, A. Lithium-ion battery based renewable energy solution for off-grid electricity: A techno-economic analysis. Renew. Sustain. Energy Rev. 2017, 72, 922–934. [Google Scholar] [CrossRef]
- Becerra, M.; Moran, J.; Jerez, A.; Cepeda, F.; Valenzuela, M. Wind energy potential in Chile: Assessment of a small scale wind farm for residential clients. Energy Convers. Manag. 2017, 140, 71–90. [Google Scholar] [CrossRef]
- Kazmi, S.A.A.; Mushtaq, S.; Anwar, M. An integrated assessment framework of renewable based Microgrid deployment for remote isolated area electrification across different climatic zones and future grid extensions. Sustain. Cities Soc. 2023, 101, 105069. [Google Scholar]
- Eltamaly, A.M.; Mohamed, M.A.; Al-Saud, M.; Alolah, A.I. Load management as a smart grid concept for sizing and designing of hybrid renewable energy systems. Eng. Optim. 2017, 49, 1813–1828. [Google Scholar] [CrossRef]
- Mohamed, M.A.; Eltamaly, A.M.; Alolah, A.I. Swarm intelligence-based optimization of grid-dependent hybrid renewable energy systems. Renew. Sustain. Energy Rev. 2017, 77, 515–524. [Google Scholar] [CrossRef]
- Ajlan, A.; Tan, C.W.; Abdilahi, A.M. Assessment of environmental and economic perspectives for renewable-based hybrid power system in Yemen. Renew. Sustain. Energy Rev. 2017, 75, 559–570. [Google Scholar] [CrossRef]
- Halabi, L.M.; Mekhilef, S.; Olatomiwa, L.; Hazelton, J. Performance analysis of hybrid PV/diesel/battery system using HOMER: A case study Sabah, Malaysia. Energy Convers. Manag. 2017, 144, 322–339. [Google Scholar] [CrossRef]
- Qolipour, M.; Mostafaeipour, A.; Tousi, O.M. Techno-economic feasibility of a photovoltaic-wind power plant construction for electric and hydrogen production: A case study. Renew. Sustain. Energy Rev. 2017, 78, 113–123. [Google Scholar] [CrossRef]
- Yimen, N.; Tchotang, T.; Kanmogne, A.; Abdelkhalikh Idriss, I.; Musa, B.; Aliyu, A.; Okonkwo, E.C.; Abba, S.I.; Tata, D.; Meva’a, L. Optimal sizing and techno-economic analysis of hybrid renewable energy systems—A case study of a photovoltaic/wind/battery/diesel system in Fanisau, Northern Nigeria. Processes 2020, 8, 1381. [Google Scholar] [CrossRef]
- Ali, M.B.; Kazmi, S.A.A.; Altamimi, A.; Khan, Z.A.; Alghassab, M.A. Decarbonizing Telecommunication Sector: Techno-Economic Assessment and Optimization of PV Integration in Base Transceiver Stations in Telecom Sector Spreading across Various Geographically Regions. Energies 2023, 16, 3800. [Google Scholar] [CrossRef]
- Ali, M.B.; Kazmi, S.A.A.; Khan, S.N.; Abbas, M.F. Techno-economic assessment and optimization framework with energy storage for hybrid energy resources in base transceiver stations-based infrastructure across various climatic regions at a country scale. J. Energy Storage 2023, 72, 108036. [Google Scholar] [CrossRef]
- Manmadharao, S.; Chaitanya, S.; Srinivasarao, G. Design and Optimization of Grid Integrated Solar Energy System Using HOMER GRID software. In Proceedings of the 2019 Innovations in Power and Advanced Computing Technologies (i-PACT), Vellore, India, 22–23 March 2019; pp. 1–5. [Google Scholar]
- Ali, M.B.; Kazmi, S.A.A.; Khan, Z.A.; Altamimi, A.; Alghassab, M.A.; Alojaiman, B. Voltage Profile Improvement by Integrating Renewable Resources with Utility Grid. Energies 2022, 15, 8561. [Google Scholar] [CrossRef]
- Akhtari, M.R.; Baneshi, M. Techno-economic assessment and optimization of a hybrid renewable co-supply of electricity, heat and hydrogen system to enhance performance by recovering excess electricity for a large energy consumer. Energy Convers. Manag. 2019, 188, 131–141. [Google Scholar] [CrossRef]
- Mohseni, S.; Brent, A.C.; Burmester, D. Community resilience-oriented optimal micro-grid capacity expansion planning: The case of totarabank eco-village, New Zealand. Energies 2020, 13, 3970. [Google Scholar] [CrossRef]
| Ref. | Location | Analysis Type | OGI | Method | Technical Characteristics Components | Objective Functions and Variables | Load Type | |||||||||
|---|---|---|---|---|---|---|---|---|---|---|---|---|---|---|---|---|
| T | Ec | E | PV | WE | Hyd | BM | BA | LCOE | IRR | ROI | SA | |||||
| [14] | AUS | Y | Y | N | HMR | Y | Y | Y | Y | Y | Y | Y | ILS | |||
| [15] | S.A | N | HS,PSO | Y | Y | Y | Y | Y | Y | Y | DOMS | |||||
| [16] | IND | Y | Y | Y | HMR | Y | Y | Y | RSD | |||||||
| [17] | Iran | Y | Y | N | IGOA | Y | Y | Y | Y | Y | COM | |||||
| [18] | CHI | Y | Y | N | HMR | Y | Y | Y | Y | Y | Y | Y | Y | IND | ||
| [19] | Nigeri | Y | Y | N | HMR | Y | Y | Y | Y | Y | DOMS | |||||
| [20] | IND | Y | Y | N | HMR | Y | Y | Y | Y | Y | AGR | |||||
| [21] | IND | Y | Y | N | HMR | Y | Y | Y | Y | Y | Y | Y | RSD | |||
| [22] | Egypt | Y | Y | N | HMR | Y | Y | Y | COM | |||||||
| [23] | BANG | Y | Y | N | HMR | Y | Y | Y | Y | Y | Y | Y | RSD | |||
| [24] | IND | Y | Y | N | HMR | Y | Y | Y | Y | Y | Y | Y | DOMS | |||
| [25] | CAM | Y | Y | N | HMR | Y | Y | Y | Y | Y | DOMS | |||||
| [26] | S.A | Y | Y | N | HMR | Y | Y | Y | Y | Y | Y | Y | DOMS | |||
| [27] | IND | Y | Y | N | HMR | Y | Y | Y | Y | Y | DOMS | |||||
| [28] | IND | Y | Y | N | HMR | Y | Y | Y | COM | |||||||
| [29] | Europe | Y | Y | N | GA | Y | Y | Y | Y | Y | DOMS | |||||
| [30] | Thailand | Y | Y | N | HMR | Y | Y | Y | Y | Y | Y | Y | ILS | |||
| [31] | Iraq | Y | Y | N | HMR | Y | Y | Y | Y | Y | RESD | |||||
| [32] | S.A | Y | Y | Y | HMR | Y | Y | Y | Y | Y | COM | |||||
| [33] | BANG | Y | Y | N | HMR | Y | Y | Y | Y | Y | Y | Y | DOMS | |||
| [34] | IND | Y | Y | N | HMR | Y | Y | Y | Y | Y | Y | Y | Y | Y | DOMS | |
| [35] | S.K | Y | Y | N | HMR | Y | Y | Y | Y | Y | Y | Y | COM | |||
| [36] | S.A | Y | Y | N | HMR | Y | Y | Y | Y | Y | Y | Y | IND | |||
| [37] | CHI | Y | Y | N | HMR | Y | Y | Y | Y | Y | Y | Y | ILS | |||
| [38] | IND | Y | Y | N | GA | Y | Y | Y | Y | Y | Y | Y | AGR | |||
| [39] | PAK | Y | Y | N | HMR | Y | Y | Y | Y | Y | Y | Y | DOMS | |||
| [40] | Turkey | Y | Y | N | HMR | Y | Y | Y | Y | Y | Y | Y | RESD | |||
| [41] | Namibia | Y | Y | N | HMR | Y | Y | Y | Y | Y | Y | Y | RESD | |||
| [42] | Malaysia | Y | Y | N | HMR | Y | Y | Y | Y | Y | DOMS | |||||
| [43] | Colombia | Y | Y | Y | HMR | Y | Y | Y | Y | Y | Y | Y | DOMS | |||
| [44] | S.K | Y | Y | N | HMR | Y | Y | Y | Y | Y | Y | COM | ||||
| [45] | Turkey | Y | Y | N | HMR | Y | Y | Y | Y | Y | Y | Y | RESD | |||
| [46] | S.A | Y | Y | Y | HMR | Y | Y | Y | Y | Y | Y | Y | DOMS | |||
| [47] | USA | Y | Y | N | HMR | Y | Y | Y | Y | Y | Y | RESD | ||||
| [48] | IND | Y | Y | N | HMR | Y | DOMS | |||||||||
| [49] | Chile | Y | Y | Y | HMR | Y | Y | Y | Y | RESD | ||||||
| [50] | PAK | Y | Y | Y | Y | HMR | Y | Y | Y | Y | Y | Y | RESD | |||
| [51] | S.A | Y | Y | N | PSO | Y | Y | Y | Y | Y | DOMS | |||||
| [52] | AUS | Y | Y | N | PSO | Y | Y | Y | DOMS | |||||||
| [53] | Yamen | Y | Y | N | HMR | Y | Y | Y | Y | Y | Y | Y | DOMS | |||
| [54] | Malaysia | Y | Y | N | HMR | Y | Y | Y | Y | Y | Y | Y | DOMS | |||
| [55] | Iran | N | HMR | Y | Y | Y | Y | Y | Y | Y | Y | Y | IND | |||
| [56] | Nigeria | Y | Y | Y | N | MATLAB | Y | Y | Y | Y | RESD | |||||
| [57] | PAK | Y | Y | Y | HMR | Y | Y | RESD | ||||||||
| [PS] | PAK | Y | Y | Y | Y | HMR | Y | Y | Y | Y | Y | Y | Y | Y | Y | TELEC |
| Sr No. | Zone—Selected Site N: North; C: Central; and S: South | Load of BTS Site | Coordinates | |
|---|---|---|---|---|
| ED (kWh) | ED (kWh/day) | |||
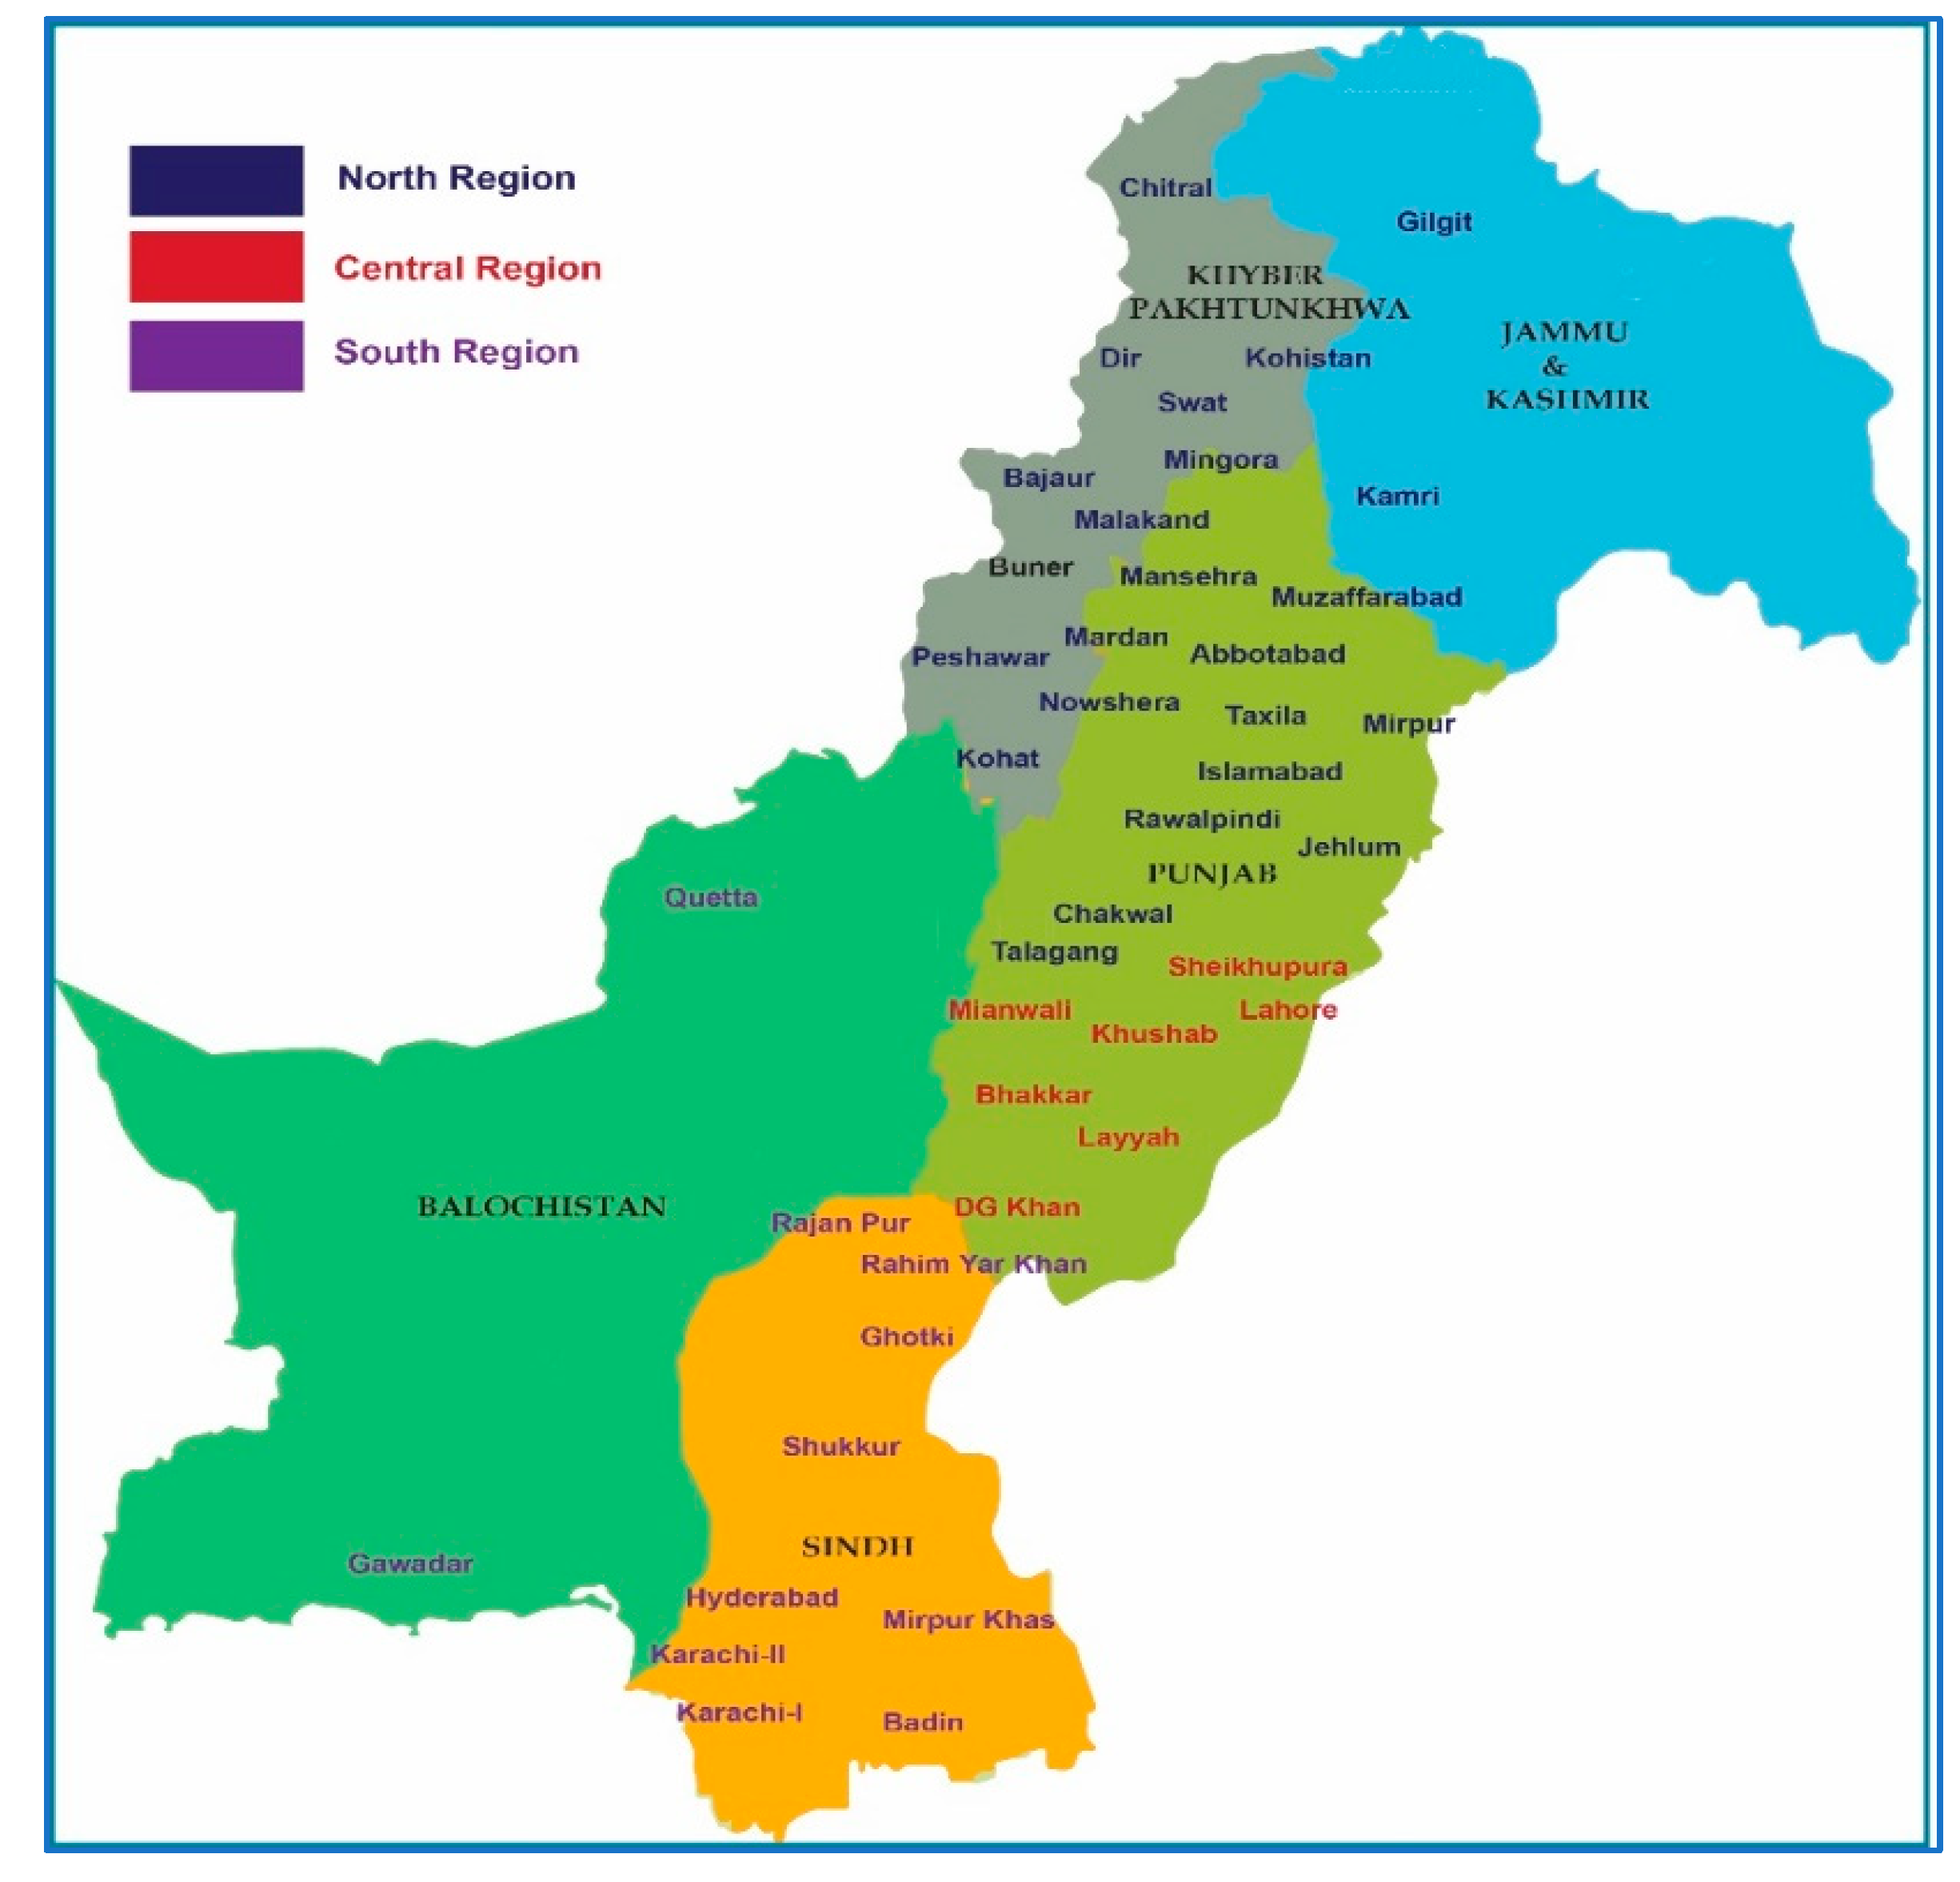
| 01 | N-Chakwal | 2.8 | 67.2 | 32.9328° N, 72.8630° E |
| 02 | N-Islamabad | 7.2 | 172.8 | 33.6844° N, 73.0479° E |
| 03 | N-Jehlum | 3.1 | 74.4 | 32.9425° N, 73.7257° E |
| 04 | N-Rawalpindi | 6.2 | 148.8 | 33.5651° N, 73.0169° E |
| 05 | N-Talagang | 2.3 | 55.2 | 32.9172° N, 72.4081° E |
| 06 | N-Taxila | 6.0 | 144 | 33.7463° N, 72.8397° E |
| 07 | N-Bajaur | 8.6 | 206.4 | 34.7865° N, 71.5249° E |
| 08 | N-Dir | 4.0 | 96 | 35.1977° N, 71.8749° E |
| 09 | N-Mardan | 2.4 | 57.6 | 34.1986° N, 72.0404° E |
| 10 | N-Chitral | 8.4 | 201.6 | 35.7699° N, 71.7741° E |
| 11 | N-Swat | 5.1 | 122.4 | 35.2227° N, 72.4258° E |
| 12 | N-Kohat | 3.6 | 86.4 | 33.5889° N, 71.4429° E |
| 13 | N-Nowshera | 3.6 | 86.4 | 34.0105° N, 71.9876° E |
| 14 | N-Buner | 4.5 | 108 | 34.3943° N, 72.6151° E |
| 15 | N-Peshawar | 3.6 | 86.4 | 34.0151° N, 71.5249° E |
| 16 | N-Abbottabad | 3.7 | 88.8 | 34.1688° N, 73.2215° E |
| 17 | N-Kohistan | 4.9 | 117.6 | 35.2611° N, 73.2765° E |
| 18 | N-Mansehra | 4.2 | 100.8 | 34.3313° N, 73.1980° E |
| 19 | N-Gilgit | 2.3 | 55.2 | 35.8819° N, 74.4643° E |
| 20 | N-Mingora | 3.4 | 81.6 | 34.7717° N, 72.3602° E |
| 21 | N-Malakand | 6.0 | 144 | 34.5030° N, 71.9046° E |
| 22 | N-Kamri | 3.9 | 93.6 | 34.7212° N, 74.9489° E |
| 23 | N-Mirpur | 2.0 | 48 | 33.1480° N, 73.7537° E |
| 24 | N-Muzaffarabad | 5.3 | 127.2 | 34.3551° N, 73.4769° E |
| 25 | C-Lahore | 5.8 | 139.2 | 31.5204° N, 74.3587° E |
| 26 | C-Sheikhupura | 4.1 | 98.4 | 31.7167° N, 73.9850° E |
| 27 | C-Bhakkar | 3.3 | 79.2 | 31.6082° N, 71.0854° E |
| 28 | C-Khushab | 2.0 | 48 | 32.2955° N, 72.3489° E |
| 29 | C-Mianwali | 2.8 | 67.2 | 32.5839° N, 71.5370° E |
| 30 | C-DG Khan | 2.0 | 48 | 30.0489° N, 70.6455° E |
| 31 | C-Layyah | 2.0 | 48 | 30.9693° N, 70.9428° E |
| 32 | S-Karachi-I | 8.6 | 206.4 | 24.9148° N, 66.8888° E |
| 33 | S-Karachi-II | 3.7 | 88.8 | 24.8458° N, 66.9794° E |
| 34 | S-Badin | 2.6 | 62.4 | 24.6459° N, 68.8467° E |
| 35 | S-Hyderabad | 3.4 | 81.6 | 17.3850° N, 78.4867° E |
| 36 | S-Mirpur Khas | 2.0 | 48 | 25.5065° N, 69.0136° E |
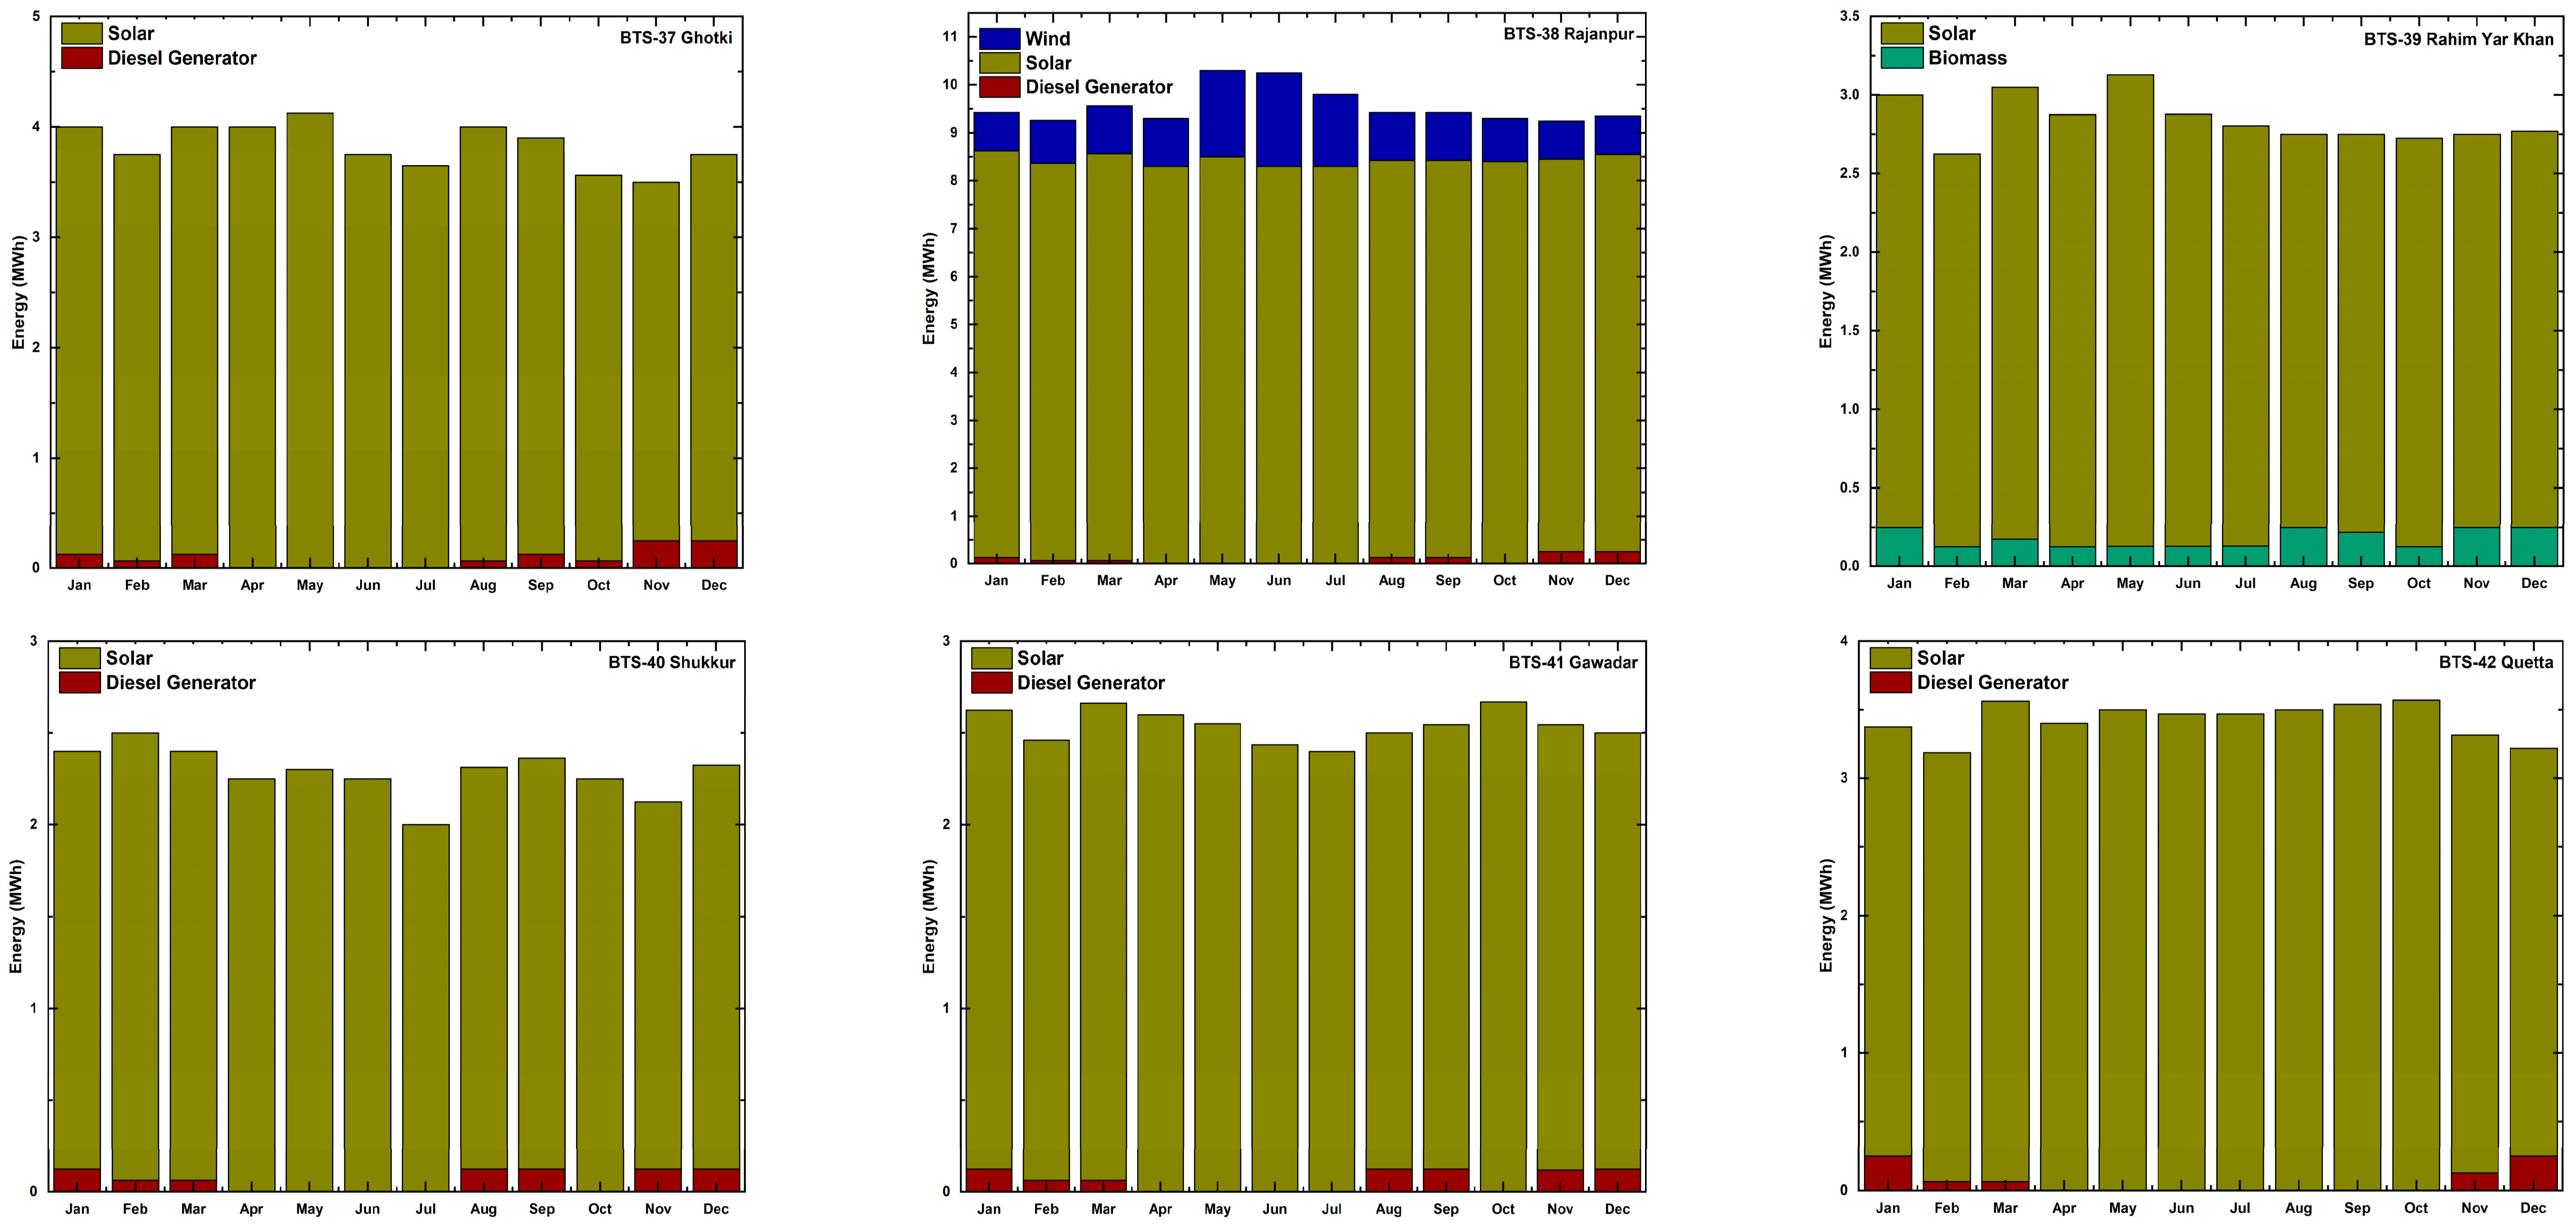
| 37 | S-Ghotki | 3.4 | 81.6 | 28.0271° N, 69.3235° E |
| 38 | S-Rajan Pur | 8.6 | 206.4 | 29.1044° N, 70.3301° E |
| 39 | S-Rahim Yar Khan | 2.9 | 69.6 | 28.4212° N, 70.2989° E |
| 40 | S-Sukkur | 2.0 | 48 | 27.7244° N, 68.8228° E |
| 41 | S-Gawadar | 2.2 | 52.8 | 25.1313° N, 62.3250° E |
| 42 | S-Quetta | 3.1 | 74.4 | 30.1798° N, 66.9750° E |
| Capital Cost | Efficiency | O&M Cost | Replacement Cost | Lifetime | Rated Capacity | Derating Factor | Operating Temperature | Temp. Coefficient | Ground Reflectance |
|---|---|---|---|---|---|---|---|---|---|
| (USD) | (%) | (USD/year) | (USD) | (year) | kWp | (%) | (°C) | (%/°C) | (%) |
| 259.0 | 19.10 | 3.70 | 185.0 | 25.00 | 0.370 | 80.00 | 47.0 | −0.38 | 20.00 |
| Capital Cost | O&M Cost | Minimum State of Charge | Nominal Capacity | Replacement Cost | Ground Reflectance | Degradation Limit | Trip Losses | Initial State of Charge |
|---|---|---|---|---|---|---|---|---|
| (USD) | (USD) | (%) | (kWh) | (USD) | (%) | (%) | (%) | (%) |
| 200.0 | 10.00 | 20.00 | 1.02 | 200.0 | 20.00 | 30.00 | 8.00 | 100.0 |
| Capital Cost | Rated Capacity | (Ta) Effect | O&M Cost | Replacement Cost | Lifetime | Temp. Coefficient |
| (USD/kW) | (kW) | (USD/year) | (USD/kW) | (year) | (%/°C) | |
| 1500 | 10 | Yes | 1250 | 1250 | 20.00 | −0.38 |
| Loss type | Electrical loss | Miscellaneous loss | Availability loss | Balance of plant loss | Wake effect loss | |
| (%) | (%) | (%) | (%) | (%) | ||
| value | 10 | 10.54 | 5.18 | 1.7 | 5.0 |
| Cap. Cost | Rep. Cost | Relative Capacity | Efficiency | Lifetime |
|---|---|---|---|---|
| (USD/kW) | (USD/kWh) | (%) | (%) | (Yrs) |
| 150 | 150 | 100 | 95 | 15 |
| Sr. No | BTS Site | Capital Cost | Replacement Cost | O&M Cost | Design Flow Rate | Net Head | Pipe Head Losses | Lifetime |
|---|---|---|---|---|---|---|---|---|
| (USD/kWh) | (USD/kWh) | (USD/kWh/year) | (m3/s) | (m) | (%) | (yrs.) | ||
| 1 | Dir | 1589 | 1191.75 | 39.726 | 1.250 | 30 | 15 | 25 |
| 2 | Mardan | 863 | 647.25 | 21.576 | 1.950 | 32 | 15 | 25 |
| 3 | Chitral | 801.746 | 601.308 | 20.044 | 1.750 | 39 | 15 | 25 |
| 4 | Swat | 2831 | 2123.25 | 70.776 | 1.850 | 34 | 15 | 25 |
| 5 | Buner | 1387.5 | 1040.626 | 34.688 | 1.760 | 36 | 15 | 25 |
| 6 | Kohistan | 2744 | 2058 | 68.6 | 1.790 | 37 | 15 | 25 |
| 7 | Mansehra | 1104 | 828 | 27.6 | 1.760 | 33 | 15 | 25 |
| 8 | Malakand | 744 | 558 | 18.4 | 1.500 | 35 | 15 | 25 |
| 9 | Kamri | 1580 | 1185 | 39.5 | 1.350 | 35 | 15 | 25 |
| BTS Sites | Village/Area Near BTS Site | No. of Houses Covered by BTS Sites | Variable nh | Total Number of Animal (N) | Total Manure (ton/year) | Biogas Production (m3) KDMc = 0.18 | Energy (kWh) | Estimated Power (kW) |
|---|---|---|---|---|---|---|---|---|
| G.R = 1.13% | KOMc = 0.86 | Thours = 10 | ||||||
| Chakwal | Dhoda | 57 | 3.44 | 196.08 | 751.4766 | 1962 | 42.283 | 7.120 |
| Talagang | Mamdot | 66 | 3.44 | 227.04 | 870.1308 | 2272 | 48.959 | 8.159 |
| Sheikhupura | Bhadroo | 80 | 2.370 | 189.60 | 726.6420 | 1897 | 40.885 | 6.814 |
| Bhakkar | Daryai | 50 | 5.80 | 290.00 | 1111.425 | 2901 | 62.536 | 10.42 |
| DG Khan | Allahabad | 49 | 6.44 | 315.56 | 1209.387 | 3158 | 68.048 | 11.34 |
| Layyah | Noor Abad | 44 | 5.92 | 260.48 | 998.2896 | 2606 | 56.170 | 9.361 |
| R.Y. Khan | Chak 152P | 61 | 4.56 | 278.16 | 1066.048 | 2783 | 59.983 | 9.997 |
| Capital Cost | Replacement Capacity | O&M Cost Per kW | Minimum Load Ratio | Organic Matter Content | Dry Matter Content |
| (USD) | (USD) | (USD/op. hours) | (%) | (KOMc) | (KDMc) |
| 855 | 570 | 0.10 | 50 | 0.86 | 0.18 |
| Lifetime | Lower heating value | Carbon content | Density | Slope | Intercept coefficient |
| (Hours) | (MJ/kg) | (%) | (kg/m3) | (kg/hr./kW output) | (kg/hr./kW output) |
| 20,000 | 5.5 | 5.0 | 0.720 | 2.0000 | 0.10000 |
| BTS Site No. | Project Area | Optimal BTS Configuration | Dispatch Strategy | Cost with Objective Parameters | Financial Parameters | Capacity Shortage | Excess Energy | Unmet Load | |||||
|---|---|---|---|---|---|---|---|---|---|---|---|---|---|
| LCOE | ICC | OPC | NPC | IRR | ROI | PBP | |||||||
| (USD/kWh) | (Million USD) | (USD/yr.) | (Million USD) | (%) | (%) | (yr.) | (%) | (%) | (%) | ||||
| Northern Zone | |||||||||||||
| BTS-01 | Chakwal | PV-BM-B | L.F | 0.1241 | 0.0314 | 1589 | 0.0658 | 25.7 | 21.2 | 3.83 | 0 | 20.4 | 0 |
| BTS-02 | Islamabad | PV-DG-B | L.F | 0.1268 | 0.0798 | 4304 | 0.1728 | 25.8 | 21.2 | 3.81 | 0 | 31.5 | 0 |
| BTS-03 | Jehlum | PV-DG-B | L.F | 0.1296 | 0.0354 | 1878 | 0.0760 | 25.0 | 20.5 | 3.92 | 0 | 29.2 | 0 |
| BTS-04 | Rawalpindi | PV-DG-B | L.F | 0.1270 | 0.0690 | 3704 | 0.1491 | 25.7 | 21.2 | 3.83 | 0 | 31.4 | 0 |
| BTS-05 | Talagang | PV-BM-B | L.F | 0.1263 | 0.0264 | 1320 | 0.0550 | 25.1 | 20.7 | 3.91 | 0 | 19.2 | 0 |
| BTS-06 | Taxila | PV-DG-B | L.F | 0.1278 | 0.0679 | 3573 | 0.1451 | 25.0 | 20.6 | 3.92 | 0 | 30.8 | 0 |
| BTS-07 | Bajaur | PV-DG-B | L.F | 0.1266 | 0.0953 | 5131 | 0.2062 | 25.8 | 21.2 | 3.82 | 0 | 31.8 | 0 |
| BTS-08 | Dir | PV-W-B-HYD | L.F | 0.0529 | 0.0265 | 624 | 0.0400 | 50.4 | 46.7 | 1.96 | 0 | 46.7 | 0 |
| BTS-09 | Mardan | PV-W-B-HYD | L.F | 0.0742 | 0.0223 | 525 | 0.0337 | 35.1 | 30.9 | 2.89 | 0 | 66.1 | 0 |
| BTS-10 | Chitral | DG-PV-B-HYD | L.F | 0.1073 | 0.0369 | 6216 | 0.1706 | 66.9 | 62.6 | 1.49 | 0 | 29.3 | 0 |
| BTS-11 | Swat | W-HYD-B | L.F | 0.0703 | 0.0464 | 995 | 0.0679 | 36.0 | 31.9 | 2.82 | 0 | 25.5 | 0 |
| BTS-12 | Kohat | PV-DG-B | L.F | 0.1322 | 0.0424 | 2206 | 0.0900 | 24.0 | 19.6 | 4.08 | 0 | 32.9 | 0 |
| BTS-13 | Nowshera | PV-DG-B | L.F | 0.1296 | 0.0418 | 2149 | 0.8833 | 24.4 | 20.0 | 4.00 | 0 | 32.8 | 0 |
| BTS-14 | Buner | PV-W-B-HYD | L.F | 0.0454 | 0.0257 | 601 | 0.0387 | 59.8 | 56.4 | 1.67 | 0 | 38.5 | 0 |
| BTS-15 | Peshawar | PV-DG-B | L.F | 0.1297 | 0.0418 | 2152 | 0.0883 | 24.4 | 20.0 | 4.00 | 0 | 32.8 | 0 |
| BTS-16 | Abbottabad | PV-DG-B | L.F | 0.1338 | 0.0420 | 2277 | 0.0912 | 24.0 | 19.6 | 4.07 | 0 | 33.3 | 0 |
| BTS-17 | Kohistan | PV-W-B-HYD | L.F | 0.0532 | 0.0326 | 773 | 0.0493 | 50.1 | 46.5 | 1.97 | 0 | 35.0 | 0 |
| BTS-18 | Mansehra | PV-W-B-HYD | L.F | 0.0457 | 0.0242 | 564 | 0.0364 | 59.6 | 56.1 | 1.68 | 0 | 45.8 | 0 |
| BTS-19 | Gilgit | PV-DG-B | L.F | 0.2325 | 0.0253 | 3511 | 0.1012 | 16.9 | 12.7 | 5.70 | 0 | 44.6 | 0 |
| BTS-20 | Mingora | PV-DG-B | L.F | 0.1258 | 0.0368 | 2043 | 0.0809 | 26.6 | 21.9 | 3.72 | 0 | 31.0 | 0 |
| BTS-21 | Malakand | DG-PV-W-HYD | L.F | 0.0457 | 0.0408 | 516 | 0.0519 | 49.9 | 46.6 | 1.98 | 0 | 30.1 | 0 |
| BTS-22 | Kamri | DG-PV-W-HYD | L.F | 0.0762 | 0.0425 | 636 | 0.0425 | 29.8 | 25.9 | 3.37 | 0 | 49.3 | 0 |
| BTS-23 | Mirpur | PV-DG-B | L.F | 0.1290 | 0.0221 | 1234 | 0.0488 | 25.6 | 20.9 | 3.84 | 0 | 32.7 | 0 |
| BTS-24 | Muzaffarabad | PV-DG-B | L.F | 0.1384 | 0.0593 | 3374 | 0.1323 | 25.2 | 20.6 | 3.90 | 0 | 32.3 | 0 |
| Central Zone | |||||||||||||
| BTS-25 | Lahore | PV-DG-B | L.F | 0.1272 | 0.0647 | 3466 | 0.1396 | 25.6 | 21.0 | 3.84 | 0 | 31.2 | 0 |
| BTS-26 | Sheikhupura | PV-BM-B | L.F | 0.1175 | 0.0403 | 2351 | 0.0911 | 29.8 | 25.0 | 3.36 | 0 | 9.91 | 0 |
| BTS-27 | Bhakkar | PV-BM-B | L.F | 0.1237 | 0.0377 | 1831 | 0.0773 | 25.4 | 20.9 | 3.87 | 0 | 20.9 | 0 |
| BTS-28 | Khushab | PV-DG-B | L.F | 0.1315 | 0.0383 | 2029 | 0.0821 | 24.4 | 20.0 | 4.00 | 0 | 32.4 | 0 |
| BTS-29 | Mianwali | PV-DG-B | L.F | 0.1310 | 0.0324 | 1713 | 0.0695 | 24.4 | 20.0 | 4.01 | 0 | 31.8 | 0 |
| BTS-30 | DG Khan | PV-BM-B | L.F | 0.1318 | 0.0241 | 1194 | 0.0499 | 23.4 | 19.0 | 4.19 | 0 | 21.1 | 0 |
| BTS-31 | Layyah | PV-BM-B | L.F | 0.1308 | 0.0244 | 1159 | 0.0495 | 23.1 | 18.8 | 4.23 | 0 | 23.9 | 0 |
| Southern Zone | |||||||||||||
| BTS-32 | Karachi-I | DG-PV-W-B | L.F | 0.1096 | 0.0898 | 4098 | 0.1783 | 28.5 | 24.1 | 3.50 | 0 | 31.3 | 0 |
| BTS-33 | Karachi-II | DG-PV-W-B | L.F | 0.1111 | 0.0399 | 1754 | 0.0778 | 27.6 | 23.1 | 3.60 | 0 | 38.5 | 0 |
| BTS-34 | Badin | DG-PV-W-B | L.F | 0.1180 | 0.0307 | 1264 | 0.0580 | 25.1 | 20.6 | 3.92 | 0 | 48.8 | 0 |
| BTS-35 | Hyderabad | DG-PV-W-B | L.F | 0.1171 | 0.0394 | 1664 | 0.0754 | 25.6 | 21.1 | 3.85 | 0 | 43.2 | 0 |
| BTS-36 | Mirpur Khas | DG-PV-B | L.F | 0.1303 | 0.0225 | 1240 | 0.0493 | 25.1 | 20.5 | 3.90 | 0 | 31.2 | 0 |
| BTS-37 | Ghotki | DG-PV-B | L.F | 0.1333 | 0.0389 | 2169 | 0.0858 | 24.7 | 20.1 | 3.97 | 0 | 30.7 | 0 |
| BTS-38 | Rajan Pur | DG-PV-W-B | L.F | 0.1294 | 0.1030 | 4979 | 0.2106 | 23.8 | 19.4 | 4.13 | 0 | 30.9 | 0 |
| BTS-39 | Rahim Yar Khan | PV-BM-B | L.F | 0.1245 | 0.0328 | 1641 | 0.0683 | 25.3 | 20.9 | 3.88 | 0 | 19.3 | 0 |
| BTS-40 | Sukkur | DG-PV-B | L.F | 0.1282 | 0.0221 | 1224 | 0.0485 | 25.7 | 21.1 | 3.81 | 0 | 29.6 | 0 |
| BTS-41 | Gawadar | DG-PV-B | L.F | 0.1355 | 0.0266 | 1380 | 0.0564 | 23.4 | 18.0 | 4.18 | 0 | 31.6 | 0 |
| BTS-42 | Quetta | DG-PV-B | L.F | 0.1246 | 0.0343 | 1795 | 0.0731 | 26.1 | 21.7 | 3.77 | 0 | 28.6 | 0 |
| Dispatch Strategy | LCOE | Payback Time | Operating Cost | Excess Electricity |
|---|---|---|---|---|
| (USD/kWh) | (Year) | (USD) | (%) | |
| Load Following (LF) | 0.1246 | 3.77 | 1795 | 28.6 |
| Cycle Charging (CC) | 0.3150 | 8.94 | 7282 | 64.6 |
Disclaimer/Publisher’s Note: The statements, opinions and data contained in all publications are solely those of the individual author(s) and contributor(s) and not of MDPI and/or the editor(s). MDPI and/or the editor(s) disclaim responsibility for any injury to people or property resulting from any ideas, methods, instructions or products referred to in the content. |
© 2024 by the authors. Licensee MDPI, Basel, Switzerland. This article is an open access article distributed under the terms and conditions of the Creative Commons Attribution (CC BY) license (https://creativecommons.org/licenses/by/4.0/).
Share and Cite
Ali, M.B.; Altamimi, A.; Kazmi, S.A.A.; Khan, Z.A.; Alyami, S. Sustainable Growth in the Telecom Industry through Hybrid Renewable Energy Integration: A Technical, Energy, Economic and Environmental (3E) Analysis. Sustainability 2024, 16, 6180. https://doi.org/10.3390/su16146180
Ali MB, Altamimi A, Kazmi SAA, Khan ZA, Alyami S. Sustainable Growth in the Telecom Industry through Hybrid Renewable Energy Integration: A Technical, Energy, Economic and Environmental (3E) Analysis. Sustainability. 2024; 16(14):6180. https://doi.org/10.3390/su16146180
Chicago/Turabian StyleAli, Muhammad Bilal, Abdullah Altamimi, Syed Ali Abbas Kazmi, Zafar A. Khan, and Saeed Alyami. 2024. "Sustainable Growth in the Telecom Industry through Hybrid Renewable Energy Integration: A Technical, Energy, Economic and Environmental (3E) Analysis" Sustainability 16, no. 14: 6180. https://doi.org/10.3390/su16146180
APA StyleAli, M. B., Altamimi, A., Kazmi, S. A. A., Khan, Z. A., & Alyami, S. (2024). Sustainable Growth in the Telecom Industry through Hybrid Renewable Energy Integration: A Technical, Energy, Economic and Environmental (3E) Analysis. Sustainability, 16(14), 6180. https://doi.org/10.3390/su16146180