Article

Smart Manufacturing and Enterprise Breakthrough Innovation: Co-Existence Test of “U-Shaped” and Inverted “U-Shaped” Relationships in Chinese Listed Companies

by
Hui Guang
1,
Ying Liu
1,
Jiao Feng
2,* and
Nan Wang
3
1
Business School, North Minzu University, Yinchuan 750021, China
2
Digital Economy and Smart Management Institute, Ningxia University, Yinchuan 750021, China
3
Labor and Human Resources School, Renmin University of China, Beijing 100872, China
*
Author to whom correspondence should be addressed.
Sustainability 2024, 16(14), 6181; https://doi.org/10.3390/su16146181
Submission received: 17 May 2024 / Revised: 16 July 2024 / Accepted: 17 July 2024 / Published: 19 July 2024
(This article belongs to the Special Issue Advances in Business Model Innovation and Corporate Sustainability)

Abstract

:
This study, using the Technology Acceptance Model and Innovation Diffusion Theory, utilizes datasets from A-share manufacturing companies listed on China’s stock exchange from 2010 to 2022 to examine the impact of smart manufacturing on the dimensions of enterprise breakthrough innovation and the moderating role of service-oriented transformation. The findings reveal a “U-shaped” relationship between smart manufacturing and the width of breakthrough innovation, and an inverted “U-shaped” relationship between smart manufacturing and the depth of breakthrough innovation. Furthermore, enterprises’ service-oriented transformation positively moderates these relationships. This study is limited by its focus on Chinese listed companies, which may restrict the generalizability of the results to other regions. Future research should consider a broader sample, to validate and extend these findings. Nevertheless, the research findings provide a theoretical basis and practical insights for enterprises’ intelligent transformation and service transformation, promoting enterprise breakthrough innovation.

1. Introduction

Amidst the current technological revolution and industrial evolution, smart manufacturing stands as a critical route for the innovative advancement of the manufacturing industry [1]. It is regarded as the main direction for building a strong manufacturing nation. In the realm of smart manufacturing, pursuing breakthrough innovations—characterized by their significance, cutting-edge nature, discontinuity, and revolutionary impact—stands as a vital strategy for manufacturing enterprises aiming to establish a core competitive edge [2]. “Made in China 2025” advocates for the networked, digital, and intelligent transformation of the manufacturing industry [3]. Although achievements have been made in the field of smart manufacturing through measures such as deepening digital transformation, implementing smart manufacturing projects, and promoting industrial internet innovation [4], the development of smart manufacturing in China still faces challenges of imbalance and insufficiency. Many enterprises are still in the early stages of intelligent transformation, and there is certain blindness and one-sidedness in the introduction and application of intelligent technologies, limiting the potential of intelligent technology to enhance the innovation efficiency of the manufacturing industry [5]. Therefore, in-depth research on the impact of smart manufacturing on enterprise breakthrough innovation and its mechanism of action has significant practical significance for accelerating the intelligent process of the manufacturing industry, promoting the enhancement of core technological capabilities of enterprises, and achieving the goal of building a strong manufacturing nation.
Concurrently, China finds itself in a pivotal stage of economic structural transformation and upgrading [6]. Today, engaging in service-oriented transformation within the manufacturing sector is identified as a crucial avenue for forging a formidable manufacturing nation [7]. In that regard, merely relying on the manufacturing industry’s introduction, adaptation, and application of new technologies cannot meet the systemic requirements of smart manufacturing that permeate through all aspects of manufacturing activities, including design, production, management, and services [8]. With the goal to meet those requirements, the development of smart manufacturing is a process of deep integration of new-generation information and communication technologies, such as artificial intelligence, with advanced manufacturing technologies. As smart manufacturing advances, service-oriented transformation plays a supportive role by incorporating modern service elements [9]. This transformation fosters the convergence of manufacturing and services, enabling resource integration along the value chain. Consequently, it enhances the innovation-driven effect of the smart manufacturing system, paving the way for more effective and efficient production processes [10]. The application of smart manufacturing can further promote service-oriented transformation [11]. Therefore, there is a mutually reinforcing relationship between service-oriented transformation and smart manufacturing. In this context, service-oriented transformation plays a significant strategic synergistic role in enabling manufacturing enterprises to achieve intelligent transformation, enhance their innovation efficiency, and increase their enterprise value.
Despite the extensive research conducted by both industry and academia on smart manufacturing and enterprise breakthrough innovation, two aspects require further exploration:
First, while scholars have studied the relationship between smart manufacturing and enterprise breakthrough innovation, the findings are not consistent. On the one hand, some studies suggest an “incentive effect” of smart manufacturing on enterprise breakthrough innovation, showing that smart manufacturing can enhance organizational learning and absorption capacities by improving the organizational learning environment, accelerating knowledge creation, and facilitating technology spillover, thereby driving innovation [12]. On the other hand, a few studies have identified a “crowding-out effect,” indicating that artificial intelligence technology benefits employees with more task experience, but the gains for senior employees from artificial intelligence are lower than those for less experienced employees, which in turn affects their capacity for breakthrough innovation [13]. The reason for these conflicting conclusions might be that current research primarily analyzes the simple linear relationship between smart manufacturing and enterprise breakthrough innovation without differentiating the specific dimensions of breakthrough innovation behavior and its performance, leaving the underlying mechanisms unclear. Building on this, and drawing from Mitchell’s (2024) classification of enterprise innovation motives [14], this study starts with the motives for enterprise breakthrough innovation and divides those into two dimensions: diversity and cross-domain expansion aimed at entering new markets, developing new technologies or services, and implementing new business models across various business domains, which is the width of breakthrough innovation; and significant technological breakthroughs in specific fields aimed at fundamentally improving or completely redesigning specific technologies, products, or services, leading to significant performance improvement, substantial cost reduction, or the creation of completely new user experiences, which is the depth of breakthrough innovation [15]. On the basis of these two distinct motives, this study is dedicated to exploring the influence of smart manufacturing on the performance of enterprise breakthrough innovation.
Second, current research on the factors that modulate the relationship between smart manufacturing and enterprise breakthrough innovation rarely considers the synergistic effects of various transformation strategies of businesses. Existing studies indicate that service chains and innovation chains should develop in synergy [16]. Against that background, given the “double-edged sword” effect of smart manufacturing on the performance of enterprise breakthrough innovation, it is particularly important to identify and validate which factors influence the relationship between the two, and the current research has not yet focused on the impact of service-oriented transformation on that relationship. Breakthrough innovation, characterized by high costs and high risks [13], may not be pursued by enterprises that are conservative in following market changes, limited in resources, or have low risk tolerance, leading these businesses to lose competitive advantages and miss industry-leading opportunities. In that context, the service-oriented transformation of enterprises plays a synergistic role in promoting the relationship between smart manufacturing and breakthrough innovation [17], accelerating the comprehensive development of business models, technological innovation, and customer value creation. Therefore, it seems imperative to investigate the precise impact of service-oriented transformation on that relationship.
To address the gaps identified in the existing research, this study concentrates on addressing the following two critical questions:
  • RQ1. What differential impacts does smart manufacturing have on the width and depth of enterprise breakthrough innovation?
  • RQ2. How does the service-oriented transformation of enterprises affect the relationship between smart manufacturing and both the width and depth of enterprise breakthrough innovation?
The contributions of this study are delineated as follows: Firstly, from a motivational perspective, this study categorizes enterprise breakthrough innovation into two dimensions: the width and depth of breakthrough innovation. It then examines the effects of smart manufacturing on these distinct dimensions, thereby addressing the conflicts present in the current body of research concerning the nexus between smart manufacturing and enterprise breakthrough innovation. Unlike existing studies that primarily focus on the overall level or content of breakthrough innovation, this study, from a motivation-based perspective, further analyzes the differentiated impacts of service-oriented transformation on the width and depth of breakthrough innovation. Secondly, by integrating the Technology Acceptance Model and the Theory of Innovation Diffusion, it thoroughly investigates and validates the differential impacts of smart manufacturing on the width and depth of enterprise breakthrough innovation. The findings clarify the inconsistencies observed in previous research, contributing new theoretical perspectives and practical insights to the literature on the relationship between smart manufacturing and enterprise breakthrough innovation. Finally, from the standpoint of organizational strategic synergy, this study innovatively identifies key conditions that influence the relationship between smart manufacturing and enterprise breakthrough innovation, thereby expanding the application scenarios of the Technology Acceptance Model and the Theory of Innovation Diffusion.

2. Theoretical Analysis and Research Hypotheses

2.1. Theoretical Analysis

Smart manufacturing refers to the process by which the manufacturing industry utilizes advanced manufacturing technology and next-generation information and communication technology to conduct intelligent design, production, management, and services [18]. The core system of smart manufacturing is intelligent technology, with intelligent design, intelligent production, intelligent management, and intelligent services all supported by this technology [19]. Intelligent technology refers to the integration of advanced computing systems and artificial intelligence (AI) to enable machines and systems to perform tasks that typically require human intelligence [20]. Breakthrough innovation is characterized by significant, cutting-edge, discontinuous, and revolutionary advancements that have a substantial impact on markets and industries [21]. The relationship between smart manufacturing, with its core of intelligent technology, and breakthrough innovation can be explained using the Technology Acceptance Model (TAM) and the Diffusion Theory of Innovation.
The Technology Acceptance Model (TAM) posits that the degree to which users accept technology is determined by two primary factors: perceived ease of use and perceived usefulness [22]. In the research context of this study, under the influence of different stages of intelligent technology applications, enterprise breakthrough innovation will be affected by the dual role of perceived usability and perceived usefulness, which will produce heterogeneity. Specifically, according to the Technology Acceptance Model, when enterprises carry out smart manufacturing for breakthrough innovation, on the one hand, in the initial stage of intelligent technology application, the low perceived ease of use leads enterprises to regard this technology as difficult to master, resulting in cautious expansion of the innovation field. Here, the width of breakthrough innovation is narrow. Then, with improvement in the degree of familiarity with and mastery of intelligent technology, enterprises will find that its application in many fields becomes easier, thus expanding the width of the breakthrough innovation field. At the same time, in the initial stage of improving the ease of use of intelligent technology, enterprises will focus on in-depth application and innovation in a certain field [23], thus increasing the depth of breakthrough innovation; however, with further improvement in the ease of use, enterprises will turn to exploring breakthrough innovations in more fields, thus removing investment from furthering the depth of breakthrough innovation in a certain field. On the other hand, a novel perceived usefulness of a piece of intelligent technology may be pursued by enterprises that have not fully determined its range of uses in the initial stage of its application, resulting in a narrow width of breakthrough innovation. With the passage of time, enterprises will recognize the potential benefits of this intelligent technology in multiple fields, thus increasing cross-field breakthrough innovation attempts. Simultaneously, the perceived usefulness enables enterprises to focus their resources on in-depth development in specific fields in the initial stage of intelligent technology application, and the perceived usefulness in this regard is high. Later, with a fuller understanding of the potential of the intelligent technology, enterprises will gradually shift their focus to exploring new fields, resulting in reduced in-depth development in the original field.
According to the Diffusion Theory of Innovation, innovation is affected by the communication channels in the propagation process, the structure of the social system, and the time factor [24]. The impact of new technology on innovation differs at different stages within the enterprise and across the entire social system [25]. In this study, on the one hand, from the perspective of smart manufacturing and breakthrough innovation width, in the knowledge and persuasion stage, enterprises have not fully understood or accepted the full potential of intelligent technology. Therefore, the breakthrough innovation width increases slowly, and enterprises only try to apply intelligent technology in a limited field or a few production lines. In the decision-making and implementation stage, as enterprises deepen their understanding of smart manufacturing, they begin to realize the application potential of intelligent technology in multiple production fields, which will prompt enterprises to decide to adopt intelligent technology more widely, so as to implement breakthrough innovation in multiple fields, gradually increasing the width of breakthrough innovation [26]. In the diffusion stage within the social system, as the number of successful cases of intelligent technology application within the enterprise increases, other enterprises or departments begin to imitate and adopt this technology, further promoting the spread of intelligent technology in the entire industry or market, thus increasing the width of breakthrough innovation. On the other hand, from the perspective of smart manufacturing and innovation depth, in the early concentrated application stage of smart manufacturing, enterprises will focus on specific key areas or processes for in-depth application and improvement, because enterprises are more inclined to invest in the most familiar or see the greatest potential return in the early stage. In the dispersive stage of resources and attention, with the maturing of smart manufacturing technology, enterprises begin to explore the application of intelligent technology in other fields, which will shift the resources and attention of enterprises from the initial focus area to a wider range of applications [27], resulting in a decline in the depth of breakthrough innovation in a specific field. In the exploration stage of market saturation and emerging fields, with the gradual saturation of the market, enterprises will look for new growth points, leading them to shift their focus from the current in-depth application of innovation to new technologies or markets, thus further reducing the depth of breakthrough innovation in specific fields.

2.2. Research Hypothesis

2.2.1. Smart Manufacturing and Enterprise Breakthrough Innovation

Smart Manufacturing and the Width of Enterprise Breakthrough Innovation: In the early stages of breakthrough innovation activities, enterprises often face significant resource investments, high uncertainty, and high risks when expanding the width of breakthrough innovation, leading to a relatively low motivation for expanding innovation width in the early stages. Smart manufacturing, as an advanced technological approach, can provide support by enhancing the perceived ease of use and usefulness of technology [28]. However, enterprises have not yet fully utilized the potential of smart manufacturing. With the deep application of intelligent technologies, according to the Theory of Diffusion of Innovations, the internal dissemination of intelligent technology and the enhancement of enterprises’ familiarity with it will gradually improve innovation activities and performance across multiple business domains [29]. In this transformation stage, enterprises begin to overcome the initial barriers to breakthrough innovation activities and expand their innovation width more actively. Therefore, there is a “U-shaped” relationship between smart manufacturing and the width of enterprise breakthrough innovation: in the early stages of smart manufacturing application, due to the low level of familiarity with new technology and initial resource investment constraints, enterprises may exhibit a cautious and restricted attitude towards innovation width, leading to a narrower width of innovation; however, as enterprises adapt to and deepen their application of smart manufacturing, they gradually expand their innovation width, exploring new application domains and market opportunities, and the benefits of smart manufacturing begin to emerge [30], resulting in a significant increase in innovation width and indicating a positive impact of smart manufacturing on the width of enterprise breakthrough innovation. Based on the above, this study proposes the following:
H1a. 
There is a U-shaped relationship between smart manufacturing and the width of enterprise breakthrough innovation.
Smart Manufacturing and the Depth of Enterprise Breakthrough Innovation: The exploration of the depth of enterprise breakthrough innovation involves conducting further fundamental reforms and innovative activities based on previously expanded technological application domains [15]. The initial introduction of smart manufacturing may lead to technological breakthroughs in specific areas, but as the technology’s application becomes more widespread and deepens, enterprises face new challenges including the efficient distribution of resources and the focused engagement in innovation endeavors. This leads enterprises to gradually shift the focus of significant innovations [31], resulting in a decrease in the depth of breakthrough innovation within specific domains. Therefore, there is an inverted “U-shaped” relationship between smart manufacturing and the depth of enterprise breakthrough innovation: in the early stages of technology application, the depth of innovation gradually increases with the exploration of new domains [32]. However, after reaching a certain level, due to the dispersion of resources and attention, the depth of innovation in these domains decreases [33]. This indicates that although the initial application of smart manufacturing technology has a positive impact on enhancing innovation depth, in later stages, more precise and targeted resource investment and management strategies may be required to maintain and strengthen the depth of breakthrough innovation in specific areas [34]. It also highlights the need for enterprises to balance the relationship between the widespread application of intelligent technology and the development of innovation depth during the transformation process towards smart manufacturing, to fully leverage the potential of smart manufacturing in driving breakthrough innovation. Based on the above, this study proposes the following:
H1b. 
There is an inverse “U”-shaped relationship between smart manufacturing and the depth of enterprise breakthrough innovation.

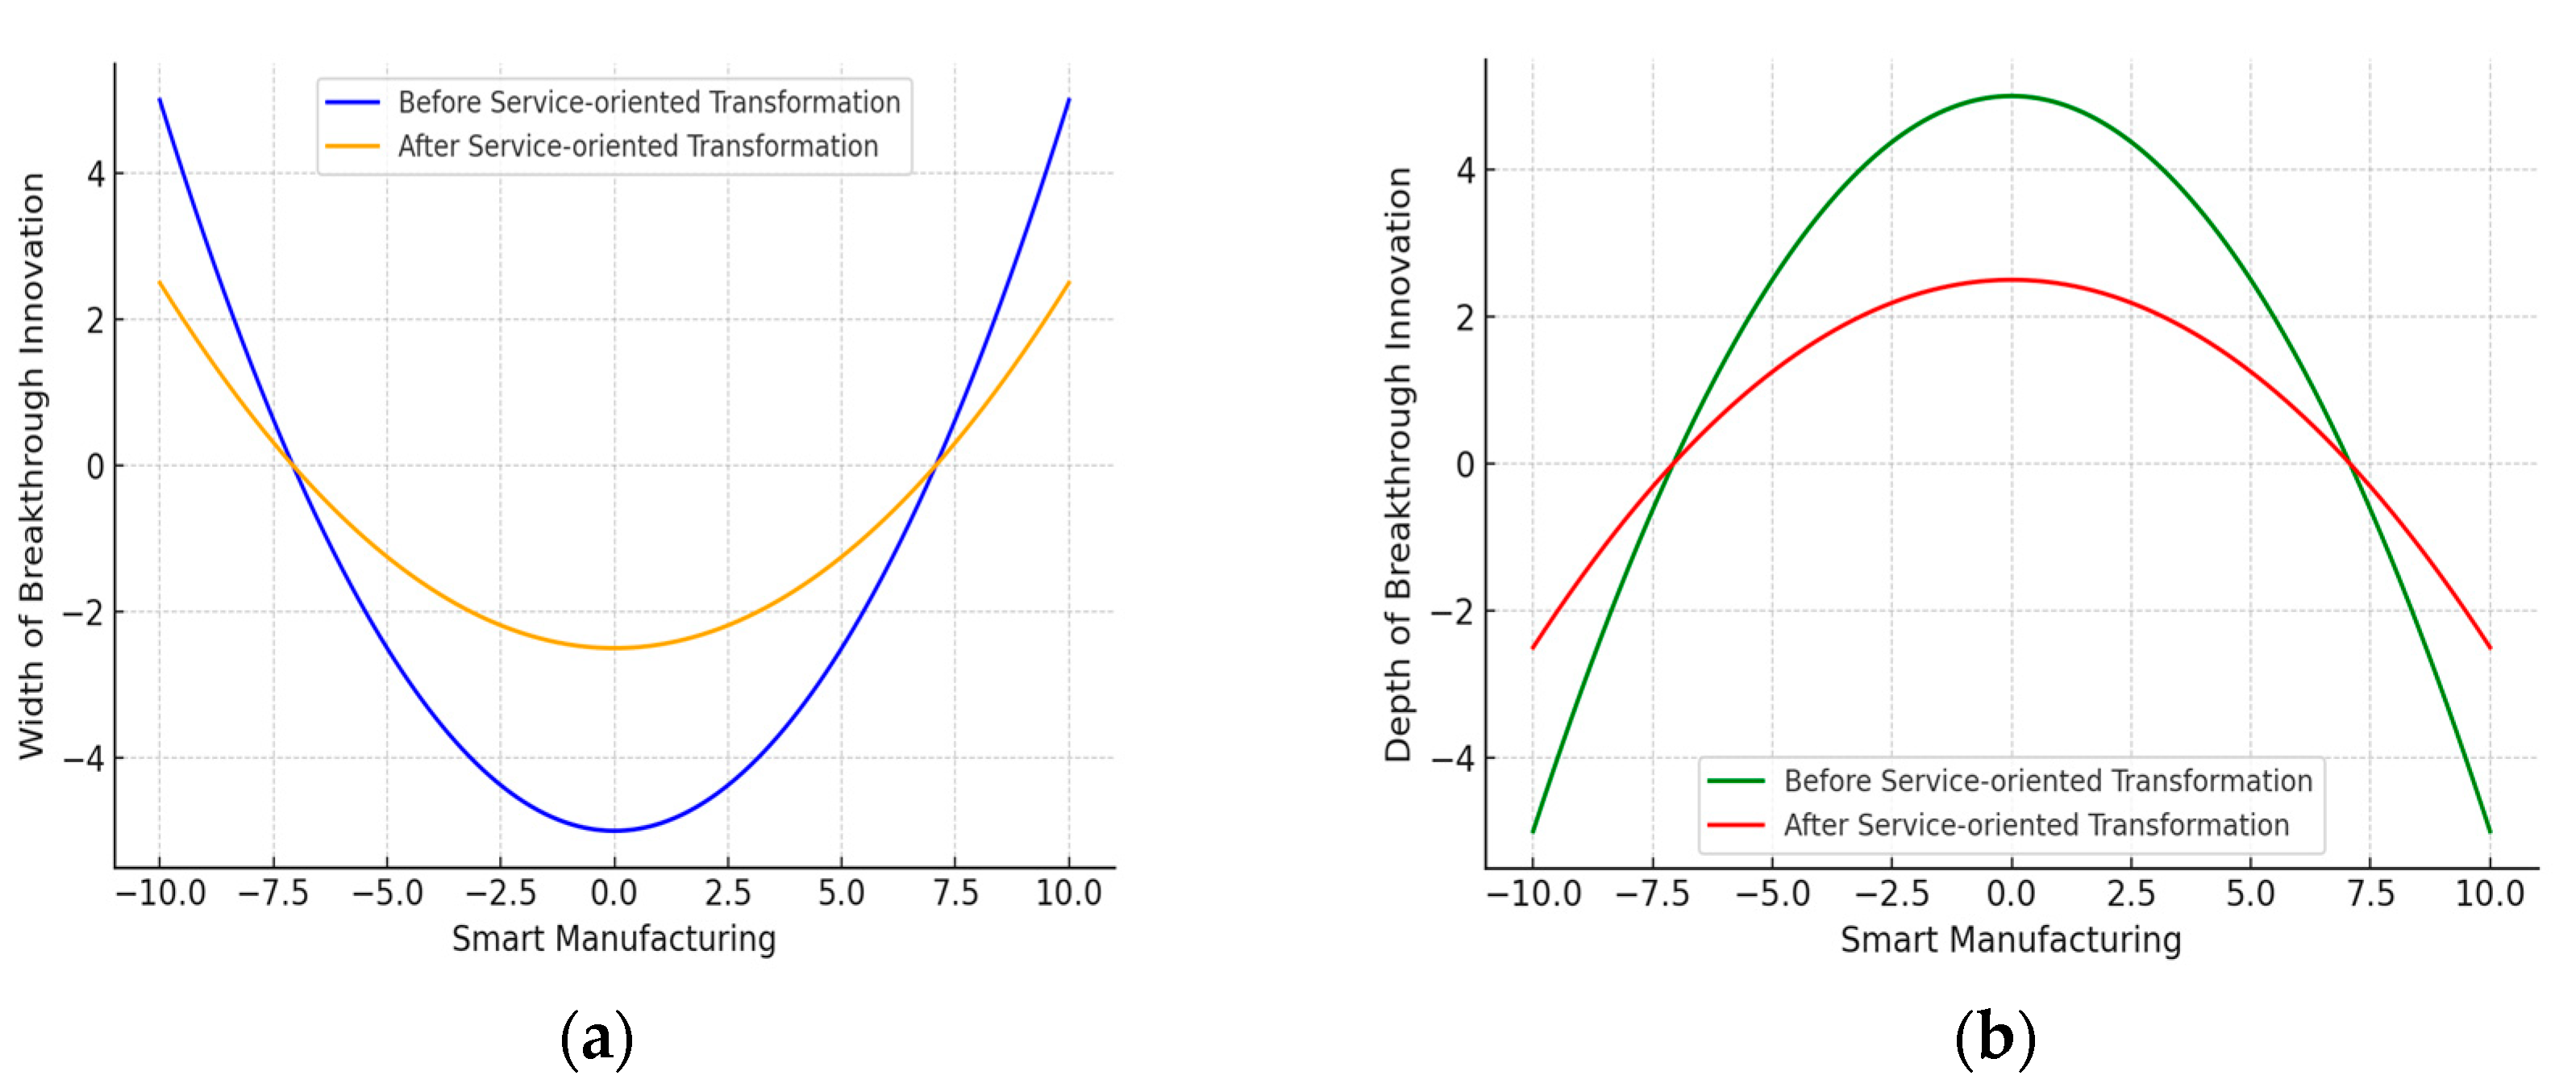
2.2.2. The Moderating Effect of Service-Oriented Transformation

Service-oriented transformation is a critical strategic synergy condition affecting the relationship between smart manufacturing and enterprise breakthrough innovation [35]. In transitioning from a conventional product-centric model to an approach centered around service and customer value, service-oriented transformation not only changes the business model of enterprises but also enhances their adaptability to market changes and deepens their understanding of customer needs [36]. This transformation also impacts the relationship between smart manufacturing and both the width and depth of enterprise breakthrough innovation. This study posits that service-oriented transformation can positively moderate the “U-shaped” relationship between smart manufacturing and the width of enterprise breakthrough innovation, as well as the inverted “U-shaped” relationship between smart manufacturing and the depth of enterprise breakthrough innovation. Specifically, against the backdrop of service-oriented transformation, enterprises place greater emphasis on the diversity and customization of market demands [37], leading to a more proactive exploration of diversified domains in the early stages of smart manufacturing application. This accelerates and accentuates the turning point in the positive “U-shaped” relationship between smart manufacturing and innovation width. Service-oriented transformation deepens the understanding of customer needs [38], promoting rapid expansion in the width of innovation within the application of smart manufacturing technologies. On the other hand, service-oriented transformation also strengthens the in-depth insights into specific market and technological domains [39], leading enterprises to focus more on sustained growth in innovation depth during the deep application of smart manufacturing technologies, thereby avoiding a decrease in innovation depth due to over-application after reaching a certain level. In the mature stages of smart manufacturing application, service-oriented transformation enhances resource integration and market expansion capabilities, which helps mitigate the negative impacts, flattening the inverted U-shaped relationship. Therefore, service-oriented transformation not only enhances the promotional effect of smart manufacturing on the “U-shaped” relationship with enterprise innovation width but also plays a positive moderating role in the inverted “U-shaped” relationship between smart manufacturing and the depth of enterprise breakthrough innovation. Based on the above, this study proposes the following:
H2a. 
Service-oriented transformation positively moderates the “U-shaped” relationship between smart manufacturing and the width of enterprise breakthrough innovation, reducing the negative impacts of smart manufacturing on the width of breakthrough innovation and facilitating sustained growth in innovation width.
H2b. 
Service-oriented transformation positively moderates the inverted “U-shaped” relationship between smart manufacturing and the depth of enterprise breakthrough innovation, reducing the negative impacts of smart manufacturing on the depth of breakthrough innovation and facilitating sustained growth in innovation depth.

3. Research Methodology

3.1. Data Sources

This study selects manufacturing companies listed on the Shanghai and Shenzhen A-share markets in China between 2010 and 2022 as the sample. The data on the level of smart manufacturing are derived from the Industrial Robots Stock Report published by the International Federation of Robotics (IFR). Data related to enterprise innovation come from the CNRDS database, while data on service-oriented transformation are sourced from the Wind database. Data on the return on total assets, asset–liability ratio, capital structure, cash flow level, and equity concentration are obtained from the CSMAR database. Samples with ST, ST*, or PT markers, missing data, or only one year of data are excluded. All continuous variables are subjected to 1% winsorizing at both the top and bottom to control the impact of extreme values, ultimately yielding 22,506 effective sample observations from 2,606 listed companies.

3.2. Measures

3.2.1. Dependent Variable: Breakthrough Innovation

(1) The width of breakthrough innovation. ① Based on patent dispersion. Using Makri’s (2010) method as a reference [40], the dispersion degree of patented technologies applied by companies is measured in a similar way by constructing the Herfindale–Hirschman index as the first measurement index of the width of breakthrough innovation. The formula is B I 1 i = 1 j = 1 n S i j 2 , where S i j denotes the proportion of patents filed by Company i in class j and then n is the total number of classes patented by Company i. ② Based on the number of newly entered patent technology categories. The number of new categories of patented technology entered by an enterprise reflects the key breakthroughs of an enterprise’s existing technological capabilities. Ahuja [41] calculated the number of new patent technology categories entered by an enterprise within five years, taking a logarithm as the second measurement index of the width of enterprise breakthrough innovation. ③ Based on the count of patent filings under new patent classifications. By calculating the logarithmic value of the count of patent filings a company makes in a year under new patent technology classifications, the extent of breakthroughs in existing technological domains is assessed [42], serving as the third measurement indicator for the width of enterprise breakthrough innovation.
(2) The depth of breakthrough innovation. ① The count of patents’ forward citations. This indicator assesses a patent’s capacity to influence subsequent technological developments, where a high number of forward citations indicates that the technological knowledge encapsulated within the patent holds considerable value and exerts influence on future technological trajectories [43,44]. In this study, the count of patents’ forward citations serves as the first type of measurement indicator for the depth of enterprise breakthrough innovation. ② The count of backward citations of patents, that is, the count of patents from other categories that a patent references. Criscuolo (2008) emphasized the novelty of an innovative technology by counting the number of existing patents of other classes cited by a new patent [45], and they found that patented technology relied more on scientific knowledge than on prior art. This study uses the count of patents’ backward citations and takes the logarithm as the second type of measurement index for the depth of enterprises’ breakthrough innovation.

3.2.2. Independent Variable: Smart Manufacturing

This study draws on the research of Acemoglu and the Restrepo (2018) to construct a penetration index of industrial robots of listed manufacturing companies in China, aiming to measure the smart manufacturing level of enterprises [46]. By calculating the penetration of industrial robots at the industry level and mapping these data to the enterprise level, this study quantifies the degree of investment and implementation of enterprises in smart manufacturing.

3.2.3. Moderator Variable: Service-Oriented Transformation

Drawing on the research of Ying (2022) [47], this study measures the level of service orientation in manufacturing enterprises by calculating the proportion of service revenue to main business revenue, thereby assessing the extent of the transition from traditional manufacturing to service-oriented transformation.

3.2.4. Control Variables

Based on Chen (2021) [48], this study selects the return on total assets (ROA), asset–liability ratio (LEV), capital structure (Capital), cash flow level (Cash), capital intensity (Fix), book-to-market ratio (BMR), and equity concentration (Share 10) as the control variables. In addition, this study also sets Year and Firm dummy variables as fixed effects for the control. Table 1 presents the variable measurements and the results of descriptive statistics.

3.3. Empirical Model

This study utilizes an unbalanced panel dataset and conducts the Hausman test to ascertain the suitability of employing a fixed-effects (FE) model as opposed to a random-effects (RE) model. The results of the Hausman test support the selection of the FE model. A fixed-effects regression analysis of the sample data is performed using Stata 16.0 software in this study. The following regression models are constructed in this study:
I n n o v i , t = α 0 + α 1 A I i , t + α 2 C o n t r o l i , t + f i r m + y e a r + ε i , t
In this initial model, Innovi,t represents the levels of various dimensions of breakthrough innovation in listed companies, and AIi,t represents the level of smart manufacturing of listed manufacturing company i in year t. The control variables are included to account for other factors that might affect innovation.
I n n o v i , t = β 0 + β 1 A I i , t + β 2 A I 2 i , t + β 3 C o n t r o l i , t + f i r m + y e a r + ε i , t
In the second model, we extend the initial model by including a quadratic term of AIi,t (AI2i,t) to capture any potential nonlinear relationship between smart manufacturing and breakthrough innovation. This allows us to test the U-shaped or inverted U-shaped relationship.
I n n o v i , t = γ 0 + γ 1 A I i , t + γ 2 A I 2 i , t + γ 3 S e r i , t + γ 4 A I i , t × S e r i , t + γ 4 A I 2 i , t × S e r i , t + γ 5 C o n t r o l i , t + f i r m + y e a r + ε i , t
In the final model, we further extend the second model by introducing the moderating effect of service-oriented transformation (Ser). This model includes interaction terms between AIi,t and Seri,t (AIi,t × Seri,t) and between AI2i,t and Seri,t (AI2i,t × Seri,t), allowing us to examine how service-oriented transformation influences the relationship between smart manufacturing and breakthrough innovation.

4. Results

4.1. Benchmark Regression

Table 2 presents the regression analysis of the impact of smart manufacturing on enterprise breakthrough innovation. Columns (1)–(5) detail the effects of smart manufacturing on both the width and depth of breakthrough innovation. In particular, findings in columns (1)–(3) reveal that the coefficient for smart manufacturing is significantly negative at the 1% level, while the coefficient for its squared term is significantly positive at the same level, affirming hypothesis H1a. Meanwhile, the data in columns (4) and (5) demonstrate that the coefficient for smart manufacturing is significantly positive at the 1% and 5% levels, respectively, and the coefficient for the squared term of smart manufacturing is significantly negative at the 1% level, corroborating hypothesis H1b.
Table 3 delineates the moderating effects of service-oriented transformation on the nonlinear influence of smart manufacturing. Specifically, the regression outcomes from columns (1) to (3) reveal that the interaction between smart manufacturing and service-oriented transformation is significantly negative, whereas the interaction with its squared term is significantly positive. This indicates that with the augmentation of service-oriented transformation, the “U-shaped” relationship curve between smart manufacturing and the width of enterprise breakthrough innovation becomes flatter (see Figure 1a). This implies that an increase in service-oriented transformation reduces the initial negative impacts of smart manufacturing on the width of enterprise breakthrough innovation, thereby promoting an increase in innovation width at lower levels and supporting hypothesis H2a. The results in columns (4) to (5) demonstrate that the interaction between smart manufacturing and service-oriented transformation is significantly positive, while the interaction with its squared term is significantly negative. This signifies that as service-oriented transformation increases, the “inverted-U-shaped” relationship curve between smart manufacturing and the depth of enterprise breakthrough innovation becomes flatter (see Figure 1b). When service-oriented transformation exceeds the critical point of the “inverted-U-shaped” relationship and continues to increase, this mitigates the negative impacts of smart manufacturing on the depth of breakthrough innovation, facilitating sustained growth in innovation depth and supporting hypothesis H2b.
Figure 1 shows the change in the adjustment variable after the transformation of service is added to the benchmark regression.

4.2. Robustness Test

4.2.1. Re-Measuring Key Variables

Re-Measuring Smart Manufacturing. This study selects the degree of artificial intelligence (AI) adoption as a proxy variable for smart manufacturing to re-test the baseline regression. Firstly, following the approach of Pham (2024) [49], this study uses the per capita value of enterprise machinery and equipment as a measure, specifically, the book value of machinery in the enterprise’s fixed assets statement divided by the aggregate number of employees. The regression results, as shown in Table 4 columns (1)–(5), indicate that the squared coefficient of the degree of AI adoption is significant at the 1% level and consistent in sign with the baseline regression. This suggests that the outcomes of the foundational regression analysis maintain their robustness after replacing the measurement method for smart manufacturing.
Re-measuring Breakthrough Innovation. To guarantee the precision and dependability of the findings, this study excludes patent application data related to associated and joint venture companies and their subsidiaries from the sample. It then re-acquires data for the five dimensions of the breakthrough innovation indicator and re-conducts the regression on the entire sample. The regression results, as shown in Table 5 columns (1)–(5), indicate that the squared coefficient of the degree of AI is significant at the 1% level and consistent in sign with the baseline regression. This suggests that the outcomes of the foundational regression analysis maintain their robustness after replacing the measurement method for breakthrough innovation.

4.2.2. Lagging Smart Manufacturing

Considering the potential lagged effect of smart manufacturing on enterprise breakthrough innovation, this study subjects the independent variable “smart manufacturing” to tests with one period. The regression results are presented in Table 6, with all the above robustness test outcomes indicating the stability of the baseline regression results.

4.2.3. Endogeneity Problem Handling

Instrumental Variable Method (IV). To mitigate issues of omitted variables and reverse causality, this study selects policy concerning pilot zones for the innovation development of the new generation of artificial intelligence as an instrumental variable. The purpose of the pilot zone policy is to promote the application and development of artificial intelligence technology. Therefore, enterprises within pilot zones will have higher investments in and practices of smart manufacturing. The impact of the pilot zone policy on enterprise innovation is primarily through the application and optimization of smart manufacturing technology, rather than other unobserved pathways. This study determines whether a manufacturing enterprise’s city is designated as a new-generation artificial intelligence innovation development pilot zone and applies the two-stage least-squares technique for instrumental variable regression. The regression findings displayed in Table 7 column 1 to 6 suggests that, after controlling for potential endogeneity problems, the research conclusions of this study remain robust.
Propensity Score Matching (PSM) Method. Considering that the application of smart manufacturing technology can be influenced by enterprise characteristics such as size, R&D capability, and financial condition, to mitigate the potential endogeneity bias caused by omitted variables, this study employs the Propensity Score Matching (PSM) method for in-depth analysis. Specifically, the sample data are first segmented into two categories according to the mean value of the explanatory variable, smart manufacturing, namely, the high smart manufacturing level group and the low smart manufacturing level group. Then, variables such as enterprise founding time, enterprise size, R&D investment, equity nature, R&D success efficiency, return on net assets, total asset turnover, and revenue growth rate are used as matching variables. The nearest neighbor matching method (1:1 matching) is employed to pair the samples, obtaining a total of 9992 effective sample data after matching. Lastly, based on the matched sample data, the effect of smart manufacturing technology on the width and depth of enterprise breakthrough innovation is re-evaluated. The test results, displayed in column 7 of Table 7, align with the conclusions of the baseline regression analysis, further confirming the robustness of the findings presented in this study.

4.3. Heterogeneity Analysis

Industrial robots, as a quintessential embodiment of smart manufacturing, are widely applied across the manufacturing sector. This study examines the variations in the impact of smart manufacturing on enterprise breakthrough innovation from the perspective of enterprise characteristics, focusing on how changes in certain intrinsic properties of enterprises influence this dynamic.

4.3.1. High-Tech Enterprises vs. Non-High-Tech Enterprises

By classifying listed companies into high-tech and non-high-tech enterprises, the results in Table 8 reveal that among the high-tech enterprise samples, the negative impact of smart manufacturing on enterprise breakthrough innovation significantly diminishes, with its negative impact coefficient substantially lower than that observed in the baseline regression results for the full sample and the analysis outcomes for non-high-tech enterprises. Simultaneously, the positive impact of smart manufacturing on enterprise breakthrough innovation is more pronounced within high-tech enterprises, with its positive impact coefficient greatly exceeding the baseline regression and regression results for the non-high-tech enterprise group.

4.3.2. Larger Market Size vs. Smaller Market Size

By dividing enterprises into two groups based on the median market size, this study finds that in enterprises with a larger market size, the negative impact of smart manufacturing technology is relatively minor, significantly lower than the baseline analysis results for the overall sample. Conversely, in the group of enterprises with a smaller market size, the positive effect of smart manufacturing on enterprise breakthrough innovation is not significant (Table 9).
This observation aligns with the theory of technology progress bias. In high-tech enterprises with better human–machine interaction and higher production efficiency, as well as enterprises with larger market sizes, smart manufacturing significantly enhances the performance of breakthrough innovation. On the other hand, in smaller enterprises facing more severe survival challenges, the introduction of artificial intelligence technology may pose a more evident obstacle to innovation activities.

5. Discussion and Conclusions

5.1. Discussion

This study, utilizing data from Chinese A-share listed manufacturing companies from 2010 to 2022, empirically examines the impact of smart manufacturing on the width and depth of enterprise breakthrough innovation, as well as the moderating role of service-oriented transformation. The results confirm hypotheses H1a, H1b, H2a, and H2b. This research holds significant theoretical implications.
Firstly, previous studies have noted a significant nonlinear relationship between smart manufacturing and enterprise breakthrough innovation, but they mainly focused on overall innovation rather than segmented dimensions. By dividing breakthrough innovation into innovation width and depth, this study finds a “U-shaped” relationship between smart manufacturing and innovation width and an inverted “U-shaped” relationship between smart manufacturing and innovation depth. These findings broaden the existing research, providing a more comprehensive understanding of the differentiated impacts of smart manufacturing on various innovation dimensions.
Secondly, service-oriented transformation serves as a critical factor in strategic synergy, significantly positively moderating the relationship between smart manufacturing and enterprise breakthrough innovation. Previous studies primarily explored the direct relationship between technology and innovation, often neglecting the synergistic effects of strategic transformations. This study finds that service-oriented transformation can alleviate the initial negative impacts of smart manufacturing on innovation width, promoting growth at lower levels, and reduce the negative impacts on innovation depth, facilitating sustained growth. This discovery further enriches the literature on strategic synergy’s effects, emphasizing the importance of service-oriented transformation in driving enterprise innovation.
Lastly, the results indicate that the moderating effect of service-oriented transformation on the relationship between smart manufacturing and innovation varies across different types of enterprises. Specifically, the moderating effect is more significant in high-tech enterprises than in non-high-tech enterprises. This finding reveals the critical impact of the enterprise type on strategic synergy’s effects, expanding the scope of current research.

5.2. Conclusions

The main conclusions are as follows: There is a “U-shaped” relationship between smart manufacturing and the width of enterprise breakthrough innovation. In the early stages of smart manufacturing application, unfamiliarity with technology and initial resource constraints lead to narrower innovation width. As enterprises adapt and deepen their application of smart manufacturing, the innovation width significantly expands. Furthermore, there is an inverted “U-shaped” relationship between smart manufacturing and the depth of enterprise breakthrough innovation. In the early stages of technology application, the innovation depth gradually increases, but as the technology becomes more widely applied, resource dispersion leads to a decrease in innovation depth within specific domains.
Service-oriented transformation positively moderates the “U-shaped” relationship between smart manufacturing and the width of enterprise breakthrough innovation, whereby it mitigates the initial negative impacts of smart manufacturing, promoting an increase in the innovation width. Moreover, service-oriented transformation positively moderates the inverted “U-shaped” relationship between smart manufacturing and the depth of enterprise breakthrough innovation, whereby it reduces the negative impacts of smart manufacturing on the innovation depth, facilitating sustained growth in that depth.

5.3. Management Implications

By empirically testing the relationship between smart manufacturing and both the width and depth of enterprise breakthrough innovation, as well as exploring the moderating role of service-oriented transformation, this study offers managerial insights for governments and enterprises in strategic planning and tactical decision-making under the commencement of smart manufacturing. Based on the findings of this study, insights are offered from both government and enterprise perspectives:
For governments, smart manufacturing has differential impacts on the various dimensions of enterprise breakthrough innovation. When formulating and implementing policies to promote smart manufacturing, governments need to dialectically and comprehensively understand the function of this technology in facilitating the progression of enterprise breakthrough innovation. The conclusions of this study suggest that moderate policy support and guidance can encourage enterprises to better utilize smart manufacturing technology, optimizing the width and depth of breakthrough innovation. Governments should provide customized support and guidance tailored to the needs of enterprises at different stages of intelligent transformation. For enterprises in the early stages, service-oriented transformation can mitigate initial technological challenges and negative impacts. Government agencies can provide subsidies, tax incentives, and grants for adopting service-oriented strategies that enhance customer relationships and market responsiveness. For more mature enterprises, government support should focus on facilitating resource integration and market expansion through funding for research and development, infrastructural investments, and policies that promote collaboration between enterprises and research institutions. This support can ensure there is sustained growth in the innovation depth and prevent a performance decline after reaching a critical point.
For enterprises, the integration of smart manufacturing and service-oriented transformation offers new opportunities for growth and innovation. Enterprises should fully recognize the potential of smart manufacturing technology and make strategic plans based on their technological adaptability and market demands. Specifically, enterprise managers should focus on integrating intelligent technology with existing business processes and corporate culture to promote the exploration of innovation across multiple domains. During the early stages of smart manufacturing implementation, service-oriented transformation can mitigate initial technological challenges by enhancing customer relationships and market responsiveness, thereby promoting an increase in innovation width. As smart manufacturing applications mature, enterprises should emphasize resource integration and market expansion capabilities to ensure a sustained growth in the innovation depth. Strategic investments in service-oriented technologies, such as customer relationship management (CRM) systems and market analytics tools, are essential. Additionally, training and development programs that emphasize the importance of a service orientation and customer value creation can foster an adaptive and innovative culture within organizations. By focusing on these strategies, enterprises can effectively balance and optimize the width and depth of breakthrough innovation, leveraging the moderating role of service-oriented transformation to enhance the positive impacts of smart manufacturing.

5.4. Limitations and Future Research

This study is anchored in data from manufacturing companies listed on China’s A-share market, which might restrict the widespread applicability of its outcomes. Future research should contemplate an expanded sample set that encompasses non-listed entities and manufacturing firms from various global contexts, to validate the robustness and broaden the generalizability of this study’s conclusions. Moreover, while this study zeroes in on service-oriented transformation as a pivotal factor for strategic synergy in augmenting the width and depth of enterprise breakthrough innovation within the realm of smart manufacturing, forthcoming inquiries are encouraged to explore additional strategic synergy factors that could significantly impact this complex interplay.

Supplementary Materials

The following supporting information can be downloaded at: https://www.mdpi.com/article/10.3390/su16146181/s1, Table S1: Raw data.

Author Contributions

Conceptualization, H.G. and Y.L.; methodology, N.W.; validation, N.W.; formal analysis, H.G.; resources, Y.L.; data curation, Y.L.; writing—original draft preparation, H.G.; writing—review and editing, J.F.; supervision, H.G.; project administration, J.F. All authors have read and agreed to the published version of the manuscript.

Funding

This study was funded by the scientific research project of Ningxia Higher Education Institutions, “Research on the Action Path of Ningxia Implementation of Digital Ningxia Quality Upgrading”, grant number NYG2024108; the Key Research and Development Project in the field of social development of Ningxia Autonomous Region, “Research and Application Demonstration of Key Technologies of Digital Marketing in Ningxia Smart Tourism Scenic Spots”, grant number 2023BEG02069; and the Ningxia Hui Autonomous Region cultural tourism logistics industry digital key technology research innovation team series of research results.

Institutional Review Board Statement

Not applicable.

Informed Consent Statement

Not applicable.

Data Availability Statement

The original contributions presented in the study are included in the Supplementary Materials.

Conflicts of Interest

The authors declare no conflicts of interest.

References

  1. Luisa, T.T.; Indiraa, E.S.; Bernardo, G.O. On developing a green and intelligent manufacturing system. Expert Syst. Appl. 2024, 243, 122876. [Google Scholar]
  2. Purusottama, A.; Simatupang, T.M.; Sunitiyoso, Y. The spectrum of blockchain adoption for developing business model innovation. Bus. Process. Manag. J. 2022, 28, 834–855. [Google Scholar] [CrossRef]
  3. Wang, Z.X.; Shou, M.H.; Wang, S.; Dai, R.N.; Wang, K.Q. An Empirical Study on the Key Factors of Intelligent Upgrade of Small and Medium-sized Enterprises in China. Sustainability 2019, 11, 619. [Google Scholar] [CrossRef]
  4. Li, M.F.; Liu, Y.J. The influence of digital innovation ecosystem of high-end equipment manufacturing on the intelligent maturity of enterprise—An empirical study on the configuration of the “three-layer core-periphery” structure. Bus. Process. Manag. J. 2023, 30, 199–221. [Google Scholar] [CrossRef]
  5. Sun, L.P.; Saat, N.A.M. How Does Intelligent Manufacturing Affect the ESG Performance of Manufacturing Firms? Evidence from China. Sustainability 2023, 15, 4. [Google Scholar] [CrossRef]
  6. Ma, Z.Y.; Bai, Y.L.; Zhang, L.X. Sustainable Development of the Rural Labor Market in China from the Perspective of Occupation Structure Transformation. Sustainability 2024, 16, 2938. [Google Scholar] [CrossRef]
  7. Huang, G.C.; Ma, L.L.; Xietian, Z.G. Servitization of manufacturing and China’s power status upgrading of global value network. Struct. Change Econ. Dyn. 2024, 68, 313–328. [Google Scholar] [CrossRef]
  8. Kohtamäki, M. Sustainable servitization in product manufacturing companies: The relationship between firm’s sustainability emphasis and profitability and the moderating role of servitization. Technovation 2024, 129, 102907. [Google Scholar] [CrossRef]
  9. Abudureheman, M.; Jiang, Q.Z.; Gong, J.; Yiming, A. Estimating and Decomposing the TFP Growth of Service-Oriented Manufacturing in China: A Translogarithmic Stochastic Frontier Approach. Sustainability 2023, 15, 6027. [Google Scholar] [CrossRef]
  10. Wang, Y.; Han, P. Digital Transformation, Service-Oriented Manufacturing, and Total Factor Productivity: Evidence from A-Share Listed Companies in China. Sustainability 2023, 15, 9974. [Google Scholar] [CrossRef]
  11. Momeni, B.; Rapaccini, M.; Martinsuo, M. Manufacturers managing complexity during the digital servitization journey. J. Manuf. Technol. Manag. 2024, 35, 51–72. [Google Scholar] [CrossRef]
  12. Liu, J.; Chang, H.H.; Lin, Y.; Yang, B.H. Influence of artificial intelligence on technological innovation: Evidence from the panel data of China’s manufacturing sectors. Technol. Forecast. Soc. Change 2020, 158, 120–142. [Google Scholar] [CrossRef]
  13. Wang, W.G.; Gao, G.D.; Agarwal, R. Friend or Foe? Teaming Between Artificial Intelligence and Workers with Variation in Experience. Manage. Sci. 2023, 10, 1–23. [Google Scholar] [CrossRef]
  14. Mitchell, R. Suspicion, inclusive leadership and team innovation: A motivated information processing approach. J. Bus. Res. 2024, 172, 114399. [Google Scholar] [CrossRef]
  15. Sharma, A. Supply base concentration and firm innovation performance: A contingency study of supply base breadth, depth, dispersion, and collaboration. J. Bus. Res. 2024, 174, 114450. [Google Scholar] [CrossRef]
  16. Liu, H.D.; Zhao, H.F. Upgrading models, evolutionary mechanisms and vertical cases of service-oriented manufacturing in SVC leading enterprises: Product-development and service-innovation for industry 4.0. Hum. Soc. Sci. Commun. 2022, 9, 387. [Google Scholar] [CrossRef]
  17. Gao, J.; Zhang, W.F.; Guan, T. Evolutionary game study on multi-agent collaboration of digital transformation in service-oriented manufacturing value chain. Electron. Commer. Res. 2022, 23, 2217–2238. [Google Scholar] [CrossRef]
  18. Tang, G.H.; Mai, H.X. How Does Manufacturing Intelligentization Influence Innovation in China from a Nonlinear Perspective and Economic Servitization Background? Sustainability 2022, 14, 14032. [Google Scholar] [CrossRef]
  19. Abubakr, M.; Abbas, A.T.; Tomaz, I.; Soliman, M.S.; Luqman, M.; Hegab, H. Sustainable and Smart Manufacturing: An Integrated Approach. Sustainability 2020, 12, 2280. [Google Scholar] [CrossRef]
  20. Sajadieh, S.M.M.; Son, Y.H.; Noh, S.D.A. Conceptual Definition and Future Directions of Urban Smart Factory for Sustainable Manufacturing. Sustainability 2022, 14, 1221. [Google Scholar] [CrossRef]
  21. Zhou, J.; Guo, A.F.; Chen, Y.T.; Chen, J. Original Innovation through Inter-Organizational Collaboration: Empirical Evidence from University-Focused Alliance Portfolio in China. Sustainability 2022, 14, 6162. [Google Scholar] [CrossRef]
  22. Klaic, M.; Fong, J.; Crocher, V.; Davies, K. Application of the extended technology acceptance model to explore clinician likelihood to use robotics in rehabilitation. Disabil. Rehabil. Assist. Technol. 2024, 19, 52–59. [Google Scholar] [CrossRef] [PubMed]
  23. Yu, K.K.; Qian, C.; Chen, J.L. How does intelligent manufacturing reconcile the conflict between process standards and technological innovation? J. Eng. Technol. Manage. 2022, 65, 101698. [Google Scholar] [CrossRef]
  24. Takahashi, C.K. Investigating the diffusion of innovation: A comprehensive study of successive diffusion processes through analysis of search trends, patent records, and academic publications. Technol. Forecast. Soc. Change 2024, 198, 122991. [Google Scholar] [CrossRef]
  25. D’Souza, G.C.; Pinto, C.N.; Exten, C. Understanding factors associated with COVID-19 vaccination among healthcare workers using the diffusion of innovations theory. Am. J. Infect. Control. 2024, 52, 509–516. [Google Scholar] [CrossRef] [PubMed]
  26. Fabra, I.T.; Ghobadian, A.; Troise, C. Antecedents of successful diffusion of breakthrough innovations past the formative phase: Perceptions of innovation-engaged practitioners. Technovation 2023, 127, 102851. [Google Scholar] [CrossRef]
  27. Dwivedi, Y.K.; Hughes, L.; Ismagilova, E. Artificial Intelligence (AI): Multidisciplinary perspectives on emerging challenges, opportunities, and agenda for research, practice and policy. Int. J. Inf. Manage. 2021, 57, 101994. [Google Scholar] [CrossRef]
  28. Wang, Q.L.; Jiang, Q.Q.; Yu, H.X. Analysis of the Influence of Entrepreneurial Apprehension and Entrepreneurial Strategic Sustainability Orientation on Breakthrough Innovation. Sustainability 2023, 15, 7320. [Google Scholar] [CrossRef]
  29. Byun, S.K.; Oh, J.M.; Xia, H. Incremental vs. Breakthrough Innovation: The Role of Technology Spillovers. Manage. Sci. 2021, 67, 1779–1802. [Google Scholar] [CrossRef]
  30. Johnson, P.C.; Laurell, C.; Ots, M. Digital innovation and the effects of artificial intelligence on firms’ research and development–Automation or augmentation, exploration or exploitation? Technol. Forecast. Soc. Change 2022, 179, 121636. [Google Scholar] [CrossRef]
  31. Lee, C.C.; Qin, S.; Li, Y.Y. Does industrial robot application promote green technology innovation in the manufacturing industry? Technol. Forecast. Soc. Change 2022, 183, 121893. [Google Scholar] [CrossRef]
  32. Spencer, L.; Tanner, A.; Lu, K. Using Diffusion of Innovation Theory to Address Health of the Homeless in Hawaii. Healthcare 2023, 11, 2828. [Google Scholar] [CrossRef] [PubMed]
  33. Lee, E.T.; Park, Y.R.; Kwak, J. Knowledge distance and innovation performance: The moderating role of internationalization breadth and depth. Asian Bus. Manag. 2023, 22, 1131–1154. [Google Scholar] [CrossRef]
  34. Su, Y.; Chai, J.H.; Lu, S.C.; Lin, Z.Z. Evaluating Green Technology Innovation Capability in Intelligent Manufacturing Enterprises: A Z-number Based Model. IEEE Trans. Eng. Manage. 2024, 71, 5391–5409. [Google Scholar] [CrossRef]
  35. Ardolino, M.; Rapaccini, M.; Saccani, N. The role of digital technologies for the service transformation of industrial companies. Int. J. Prod. Res. 2018, 56, 2116–2132. [Google Scholar] [CrossRef]
  36. Kauffman, R.J.; Ma, D.; Yoo, B. Guest editorial: Market transformation to an IT-enabled services-oriented economy. Decis. Support Syst. 2015, 78, 65–66. [Google Scholar] [CrossRef]
  37. Mourtzis, D.; Angelopoulos, J.; Panopoulos, N. A Literature Review of the Challenges and Opportunities of the Transition from Industry 4.0 to Society 5.0. Energies 2022, 15, 6276. [Google Scholar] [CrossRef]
  38. Paiola, M.; Gebauer, H. Internet of things technologies, digital servitization and business model innovation in BtoB manufacturing firms. Ind. Mark. Manage. 2020, 89, 245–264. [Google Scholar] [CrossRef]
  39. Tronvoll, B.; Sklyar, A.; Sörhammar, D.; Kowalkowski, C. Transformational shifts through digital servitization. Ind. Mark. Manage. 2020, 89, 293–305. [Google Scholar] [CrossRef]
  40. Makri, M.; Hitt, M.A.; Lane, P.J. Complementary technologies, knowledge relatedness, and invention outcomes in high technology mergers and acquisitions. Strateg. Manage. J. 2010, 31, 602–628. [Google Scholar] [CrossRef]
  41. Ahuja, G. Collaboration Networks, Structural Holes, and Innovation: A Longitudinal Study. Adm. Sci. Q. 2000, 45, 425–455. [Google Scholar] [CrossRef]
  42. Benjamin, B.; Lee, F.; Gustavo, M. Independent Boards and Innovation. J. Financ. Econ. 2017, 123, 536–557. [Google Scholar]
  43. Zhang, Y.; Qian, Y.; Huang, Y.; Guo, Y.; Zhang, G.Q.; Lu, J. An entropy-based indicator system for measuring the potential of patents in technological innovation: Rejecting moderation. Scientometrics 2017, 111, 1925–1946. [Google Scholar] [CrossRef]
  44. Fontana, R. Reassessing patent propensity: Evidence from a dataset of R&D awards, 1977-2004. Res. Policy 2013, 42, 1780–1792. [Google Scholar]
  45. Criscuolo, P.; Verspagen, B. Does it matter where patent citations come from? Inventor vs. examiner citations in European patents. Res. Policy 2008, 37, 1892–1908. [Google Scholar]
  46. Acemoglu, D.; Restrepo, P. Low-skill and high-skill automation. J. Hum. Cap. 2018, 12, 204–232. [Google Scholar] [CrossRef]
  47. Ying, L.M.; Liu, X.J.; Li, M.H.; Sun, L.P.; Xiu, P.S. How does intelligent manufacturing affects enterprise innovation? The mediating role of organisational learning. Enterp. Inf. Syst. 2022, 16, 630–667. [Google Scholar] [CrossRef]
  48. Chen, S.Q.; Zhang, H. Does digital finance promote manufacturing servitization: Micro evidence from China. Int. Rev. Econ. Financ. 2021, 76, 856–869. [Google Scholar] [CrossRef]
  49. Pham, P.; Zhang, H.L.; Gao, W.L. Determinants and performance outcomes of artificial intelligence adoption: Evidence from US Hospitals. J. Bus. Res. 2024, 172, 114402. [Google Scholar] [CrossRef]
Figure 1. Moderating effect of service-oriented transformation: (a) the change in the U-shaped relationship between intelligent manufacturing and the width of breakthrough innovation (before and after adding service-oriented transformation); (b) the change in the inverted U-shaped relationship between intelligent manufacturing and the depth of breakthrough innovation (before and after adding service-oriented transformation).
Sustainability 16 06181 g001
Table 1. Variable measurement and descriptive statistics.
TypeVariable NameSymbolVariable MeasurementMeanStandard Deviation
Independent variableSmart ManufacturingAIIndustrial robot penetration6.8234.035
Dependent variablesBreakthrough innovation width oneinnov-width1Enterprise t annual breakthrough innovation level based on the dispersion of patented technology10
Breakthrough innovation width twoinnov-width2Log (number of new patent technology categories entered by a business in five years)0.4620.248
Breakthrough innovation width threeinnov-width3Log (number of patent applications under the category of newly entered patent technologies in t years of enterprise)1.4340.679
Breakthrough innovation depth oneinnov-depth1Ln (number of citations of a patent by other later categories of patents and take logarithm +1)0.0120.094
Breakthrough innovation depth twoinnov-depth2Ln (number of other categories of patents cited by a patent +1)1.0741.454
Moderator variableServitization transformationSerService business revenue as a percentage of total operating revenue (%)0.3660.891
Control variablesReturn on total assetsROANet profit/total assets0.030.512
Asset–liability ratioLEVTotal liabilities/total assets0.4311.349
Capital structureCapitalTotal liabilities/total assets0.4311.35
Cash flow levelCashRatio of net cash flows from operating activities to total assets0.0480.079
Capital intensityFixLn (ratio of total fixed assets to number of employees +1)1.1340.03
Book-to-market ratioBMRRatio of shareholders’ equity to the company’s market value0.3340.167
Ownership concentrationShare 10Sum of shares held by the top 10 shareholders0.5720.15
Table 2. Benchmark regression results.
VariablesBreakthrough Innovation
Width of Breakthrough Innovation Depth of Breakthrough Innovation
innov-width1innov-width2innov-width3innov-depth1innov-depth2
(1)(2)(3)(4)(5)
AI−0.045 **
(−2.881)
−0.061 **
(−3.463)
−0.044 **
(−2.827)
0.065 **
(2.579)
0.055 *
(2.047)
AI20.078 ** (4.957)0.109 ** (6.189)0.065 **
(4.178)
−0.100 **
(−3.980)
−0.106 **
(−3.928)
ROA0.021 ** (3.765)0.022 ** (3.544)−0.000
(−0.072)
0.032 **
(3.521)
0.033 ** (3.418)
LEV−29.000
(−0.971)
9.473
(0.283)
0.012
(0.000)
−2.630
(−0.055)
−22.860
(−0.444)
Capital29.095
(0.974)
−9.345
(−0.280)
0.043
(0.001)
2.557
(0.053)
22.800 (0.443)
Cash0.015 ** (2.873)0.020 ** (3.460)0.011 *
(2.159)
−0.019 *
(−2.329)
−0.038 **
(−4.175)
Fix0.133 ** (16.723)0.166 ** (18.672)0.083 ** (10.586)−0.141 **
(−11.070)
−0.151 **
(−11.014)
BMR0.056 **
(8.492)
0.090 **
(12.165)
0.039 **
(5.951)
−0.009
(−0.824)
−0.027 *
(−2.396)
Share 10−0.019 *
(−2.359)
−0.062 **
(−7.026)
−0.016*
(−2.108)
0.165 **
(12.967)
0.149 **
(10.867)
Year/FirmControlControlControlControlControl
F 68.943106.86730.32167.33657.951
N 22,09622,09622,09622,09622,096
R20.0310.0470.0140.030.026
Note: ** and * indicate significant at the 1% and 5% levels, respectively; the t value is in parentheses.
Table 3. Regression results of moderating effect.
VariablesBreakthrough Innovation
Width of Breakthrough InnovationDepth of Breakthrough Innovation
innov-width1innov-width2innov-width3innov-depth1innov-depth2
(1)(2)(3)(4)(5)
AI−0.018 **
(−1.205)
−0.061 ** (−3.468)−0.043 ** (−2.794)0.065 **
(2.595)
0.056 * (2.062)
AI20.007 **
(1.467)
0.109 ** (6.190)0.064 **
(4.130)
−0.101 ** (−3.999)−0.107 ** (−3.942)
Ser0.001 **
(1.247)
0.021 ** (3.259)0.013*
(2.220)
0.014*
(1.450)
0.036 ** (3.551)
AI×Ser−0.007 **
(−1.519)
−0.017 **
(−1.015)
−0.009 **
(−1.606)
0.016 **
(1.690)
0.014 ** (1.552)
AI2×Ser0.005 *
(1.361)
0.019 *
(1.164)
0.004 *
(1.265)
−0.021 *
(−2.910)
−0.022 *
(−2.906)
Control variablesYesYesYesYesYes
Year/FirmControlControlControlControlControl
F 7.50081.14123.33550.76244.652
N 22,09622,09622,09622,09622,096
R20.0050.0480.0140.030.027
Note: ** and * indicate significant at the 1% and 5% levels, respectively; the t value is in parentheses.
Table 4. Smart manufacturing and enterprise breakthrough innovation: a measure of replacing AI.
VariablesBreakthrough Innovation
Width of Breakthrough InnovationDepth of Breakthrough Innovation
innov-width1innov-width2innov-width3innov-depth1innov-depth2
(1)(2)(3)(4)(5)
AI adoption−0.093 **
(−3.481)
−0.234 **
(−7.094)
−0.088 **
(−3.136)
0.074 **
(3.491)
0.040 **
(3.125)
AI adoption20.016 **
(3.536)
0.033 **
(5.836)
0.011 *
(2.383)
−0.569 **
(−3.741)
−0.274 **
(−4.008)
Control variablesYesYesYesYesYes
Year/FirmControlControlControlControlControl
F6.77691.54312.01817.47228.240
N13,69813,69813,69813,69813,698
R20.0050.0680.0090.0140.022
Note: ** and * indicate significant at the 1% and 5% levels, respectively; the t value is in parentheses.
Table 5. Smart manufacturing and enterprise breakthrough innovation: a measure of replacing Breakthrough Innovation.
VariablesBreakthrough Innovation (After Sample Change)
Width of Breakthrough Innovation Depth of Breakthrough Innovation
innov-width1innov-width2innov-width3innov-depth1innov-depth2
(1)(2)(3)(4)(5)
AI−0.042 **
(−2.761)
−0.059 **
(−3.327)
−0.041 ** (−2.612)0.063 **
(2.401)
(2.401) (2.401)
AI20.073 **
(4.327)
0.106 **
(6.012)
0.061 **
(3.827)
−0.094 **
(−3.752)
−0.103 **
(−3.721)
Control variablesYesYesYesYesYes
Year/FirmControlControlControlControlControl
F 66.321104.87231.24768.21458.304
N 22,09622,09622,09622,09622,096
R20.0290.0460.0150.0320.027
Note: ** indicates significant at the 1%; the t value is in parentheses.
Table 6. Regression results of moderating effect.
VariablesBreakthrough Innovation
Width of Breakthrough InnovationDepth of Breakthrough Innovation
innov-width1innov-width2innov-width3innov-depth1innov-depth2
(1)(2)(3)(4)(5)
AI lag one year−0.012 *
(−1.849)
−0.004 *
(−1.817)
−0.002 *
(−1.458)
0.028 **
(4.098)
0.015 ** (4.113)
AI2 lag one year0.019 *
(1.292)
0.001 *
(2.373)
0.000 *
(1.624)
−0.003 ** (−5.501)−0.001 ** (−5.451)
Control variablesYesYesYesYesYes
Year/FirmControlControlControlControlControl
F9.45996.32828.33863.66795.585
N22,09622,09622,09622,09622,096
R20.0040.0430.0130.0290.026
Note: ** and * indicate significant at the 1% and 5% levels, respectively; the t value is in parentheses.
Table 7. Test results of instrumental variable method (IV).
VariablesInstrumental Variable First-Stage RegressionInstrumental Variable Second-Stage RegressionPSM-DID
Smart ManufacturingWidth of Breakthrough InnovationDepth of Breakthrough Innovation
AIinnov-width1innov-width2innov-width3innov-depth1innov-depth2
(1)(2)(3)(4)(5)(6)(7)
New generation of artificial intelligence innovation and development pilot zone policy0.104 **
(1.300)
------
AI-−0.001 **
(-1.945)
−0.067 **
(-9.808)
−0.264 **
(-11.549)
0.348 **
(11.147)
0.703 **
(11.986)
0.019 **
(5.300)
AI2-0.115 **
(1.950)
0.004 **
(1.066)
0.015 **
(1.2.92)
−0.020 **
(-1.2.20)
−0.040 **
(-1.3.41)
-
Ser-0.262
(1.897)
0.210
(6.186)
0.281
(7.215)
−0.213
(-6.800)
−0.258
(-6.976)
-
AI×Ser-0.291 **
(1.884)
0.223 **
(5.905)
0.314 **
(6.546)
0.237 **
(6.222)
0.287 **
(6.354)
-
AI2×Ser-0.331
(1.864)
0.248 **
(5.385)
0.359 **
(5.778)
0.269 **
(5.573)
0.326 **
(5.668)
-
Control variablesYesYesYesYesYesYesYes
Year/FirmControlControlControlControlControlControlControl
Exclusivity test-15.101299.784154.38859.03772.790-
Weak instrumental variable test-292.013 **113.791 **167.170 **148.873 **179.854 **-
N22,50622,50622,50622,50622,50622,50619,064
R20.0090.0070.9520.7580.7080.5140.004
Note: ** indicates significant at the 1%; the t value is in parentheses.
Table 8. Heterogeneity analysis based on whether enterprises are high-tech.
VariablesHigh-Tech EnterprisesNon-High-Tech Enterprises
Width of Breakthrough InnovationDepth of Breakthrough InnovationWidth of Breakthrough InnovationDepth of Breakthrough Innovation
innov-width1innov-width2innov-width3innov-depth1innov-depth2innov-breadth1innov-breadth2innov-breadth3innov-depth1innov-depth2
(1)(2)(3)(4)(5)(6)(7)(8)(9)(10)
AI−0.008 * (−1.537)−0.047 * (−2.318)−0.045 ** (−2.664)0.067 * (2.351)0.043 * (1.409)−0.033 (−0.753)−0.104 ** (−2.804)−0.078 * (−2.176)0.070 (1.258)0.019 * (1.982)
AI20.006 * (0.135)0.141 ** (3.774)0.105 ** (2.910)−0.098 ** (−3.431)−0.089 ** (−2.898)0.006 (0.135)0.095 ** (4.671)0.065 ** (3.796)−0.127 * (−2.257)0.017 (1.323)
ControlsYesYesYesYesYesYesYesYesYesYes
Year/FirmControlControlControlControlControlControlControlControlControlControl
N17,18517,18517,18517,18517,18549114911491149114911
R20.0040.0500.0140.0330.0280.0150.0320.0110.0160.011
Note: ** and * indicate significant at the 1% and 5% levels, respectively; the t value is in parentheses.
Table 9. Enterprise size heterogeneity analysis.
VariablesLarger Market SizeSmaller Market Size
Width of Breakthrough InnovationDepth of Breakthrough InnovationWidth of Breakthrough InnovationDepth of Breakthrough Innovation
innov-breadth1innov-breadth2innov-breadth3innov-depth1innov-depth2innov-breadth1innov-breadth2innov-breadth3innov-depth1innov-depth2
(1)(2)(3)(4)(5)(6)(7)(8)(9)(10)
AI−0.035 **
(−1.623)
−0.058 *
(−2.244)
−0.047 *
(−2.213)
0.070 *
(1.805)
0.053 *
(2.364)
−0.010
(−1.612)
−0.031
(−1.089)
−0.035
(−1.315)
−0.033
(−1.303)
0.043
(1.292)
AI20.022 **
(1.013)
0.100 **
(3.829)
0.065 **
(3.015)
−0.091*
(−2.346)
−0.069 **
(−3.052)
0.032
(1.029)
0.044
(1.529)
0.060*
(2.256)
0.034
(1.339)
−0.071 *
(−2.126)
ControlsYesYesYesYesYesYesYesYesYesYes
Year/FirmControlControlControlControlControlControlControlControlControlControl
N9958995899589958995812,13812,13812,13812,13812,138
R20.0090.0490.0220.0280.0160.0080.0070.0180.0170.018
Note: ** and * indicate significant at the 1% and 5% levels, respectively; the t value is in parentheses.
Disclaimer/Publisher’s Note: The statements, opinions and data contained in all publications are solely those of the individual author(s) and contributor(s) and not of MDPI and/or the editor(s). MDPI and/or the editor(s) disclaim responsibility for any injury to people or property resulting from any ideas, methods, instructions or products referred to in the content.

