
The Influence of Innovative Resources on the Comprehensive Carrying Capacity of China’s Urban Agglomerations: A System Dynamics Perspective

Abstract
:1. Introduction
2. Literature Review
2.1. Research on Innovative Resources
2.2. Research on CCC
2.3. Research on the Influence of Innovative Resources on CCC
3. Research Basis
3.1. Theoretical Basis of CCC
3.2. System Dynamics Methodology
4. Research Framework
4.1. Research Scope and Data Sources
4.2. Selection of the Indicators and Calculation Method for Historical CCC Values
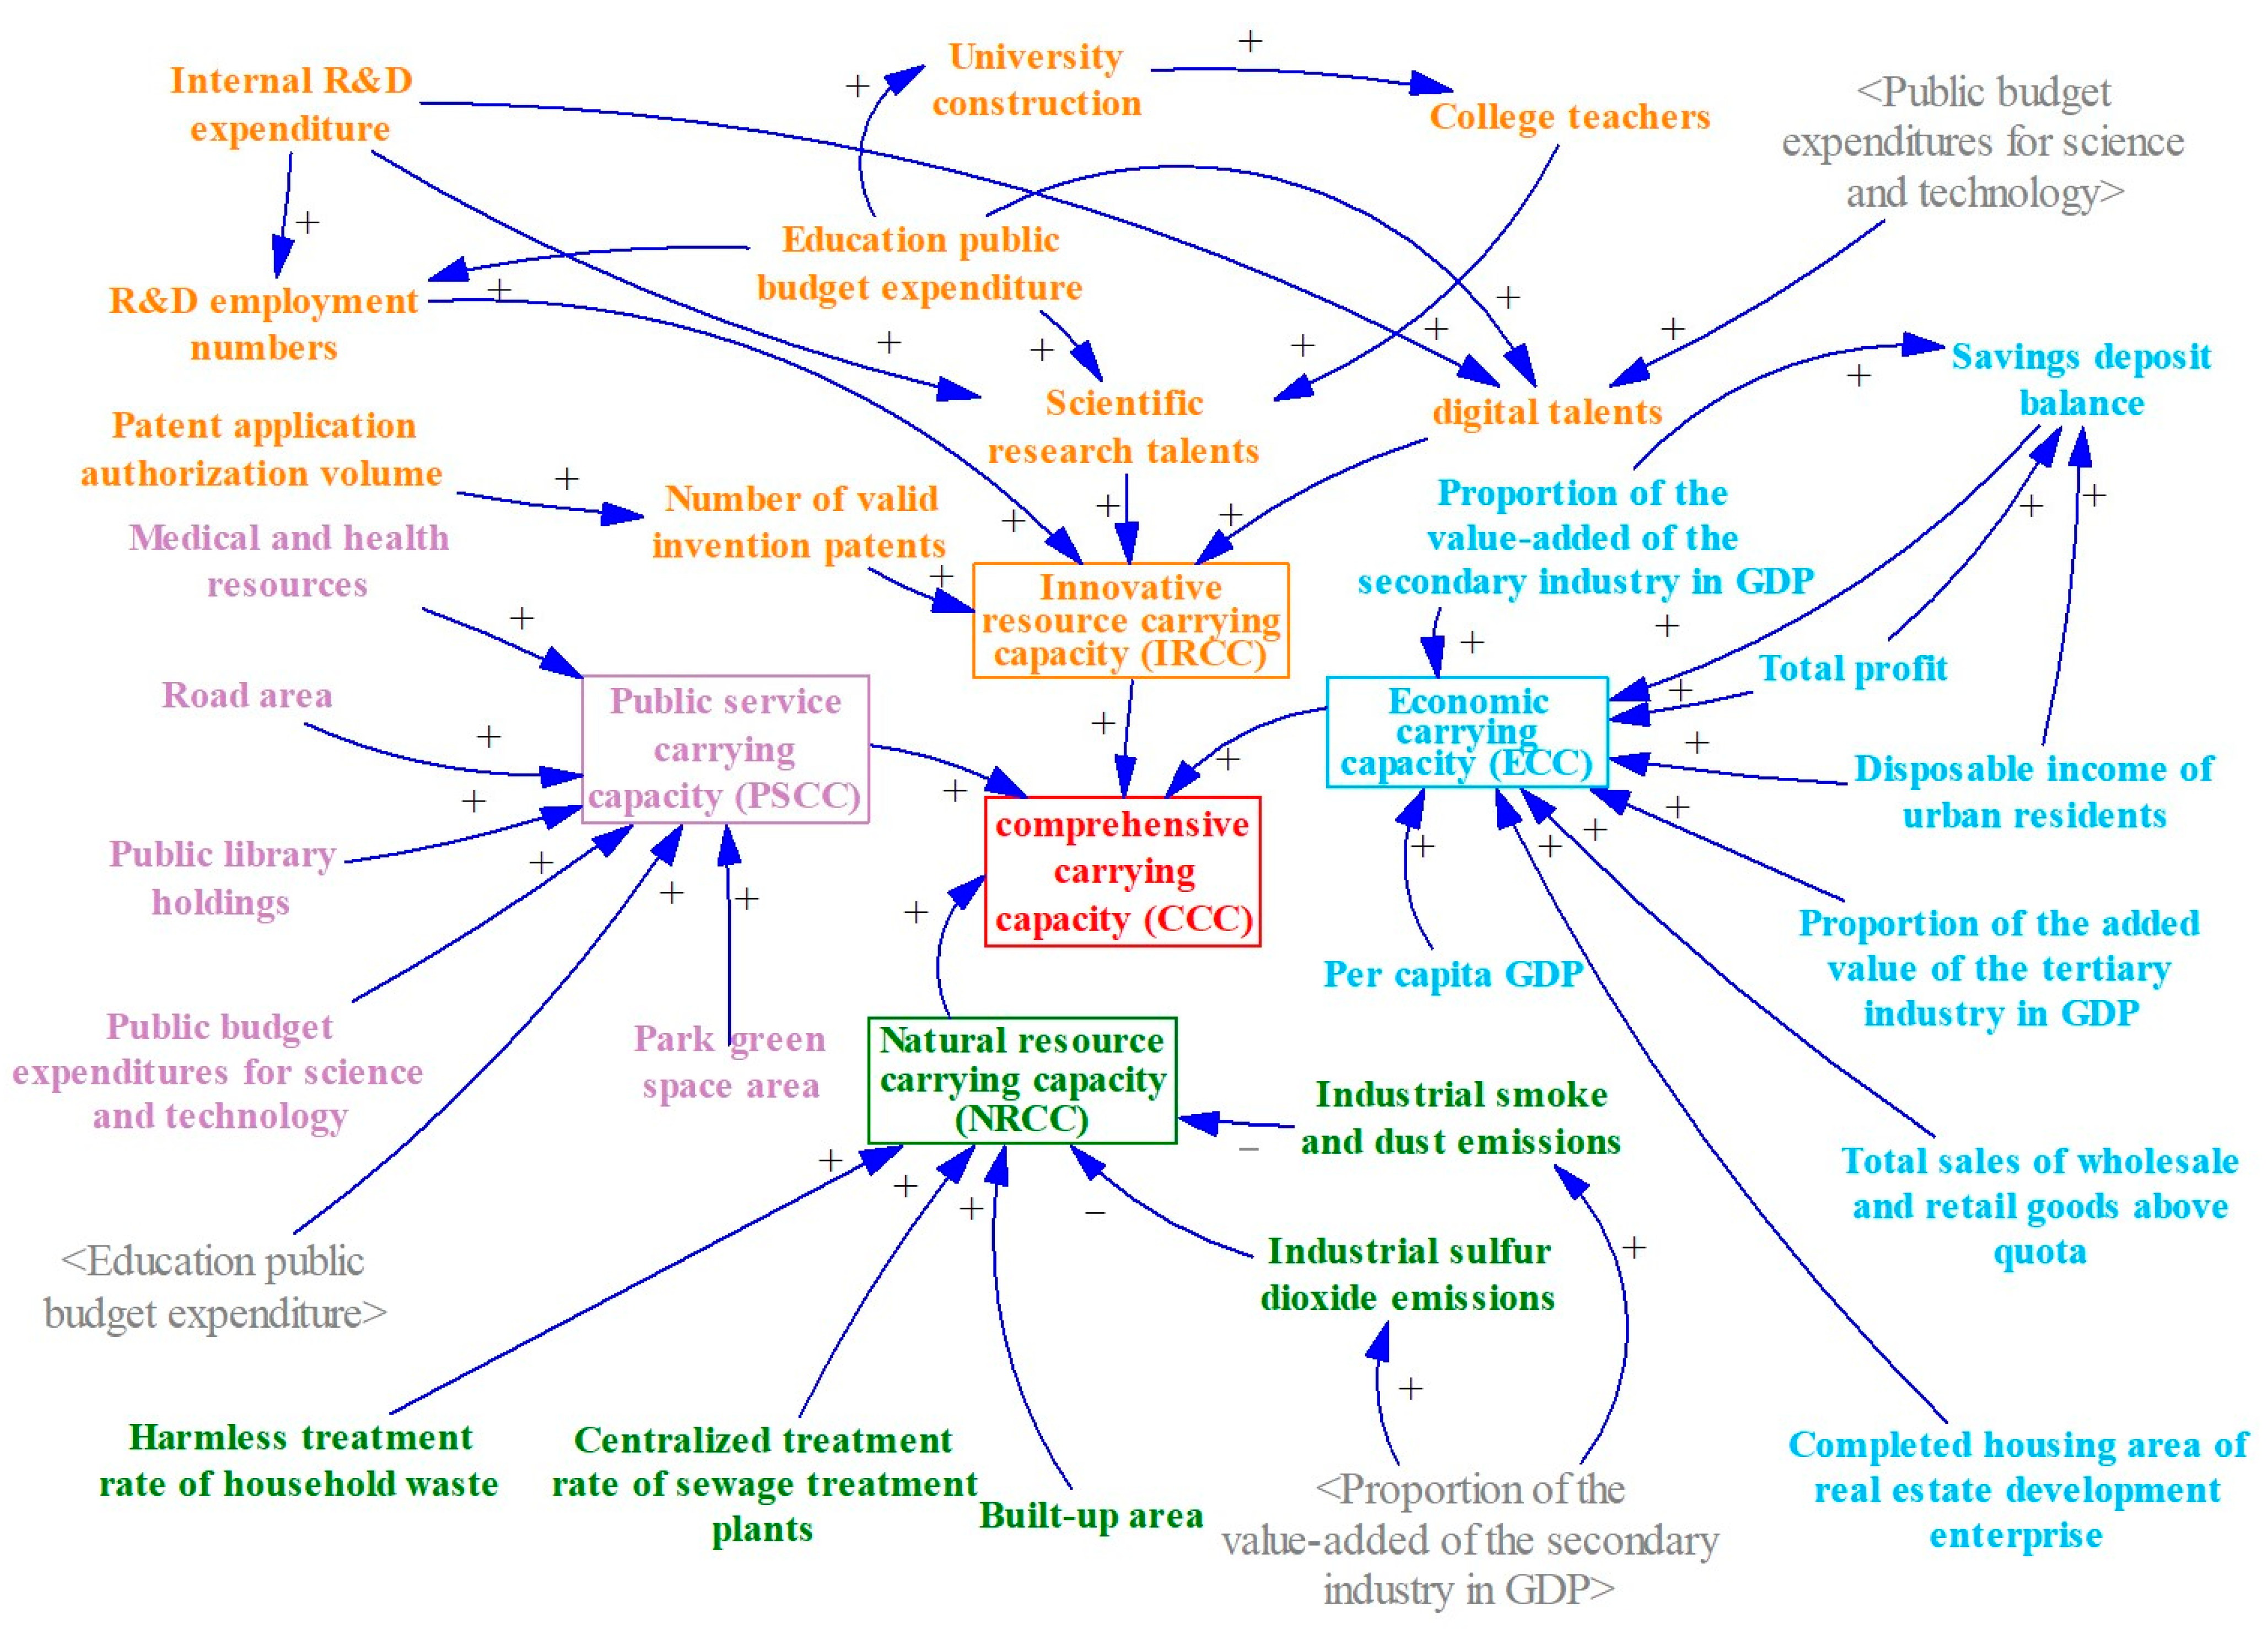
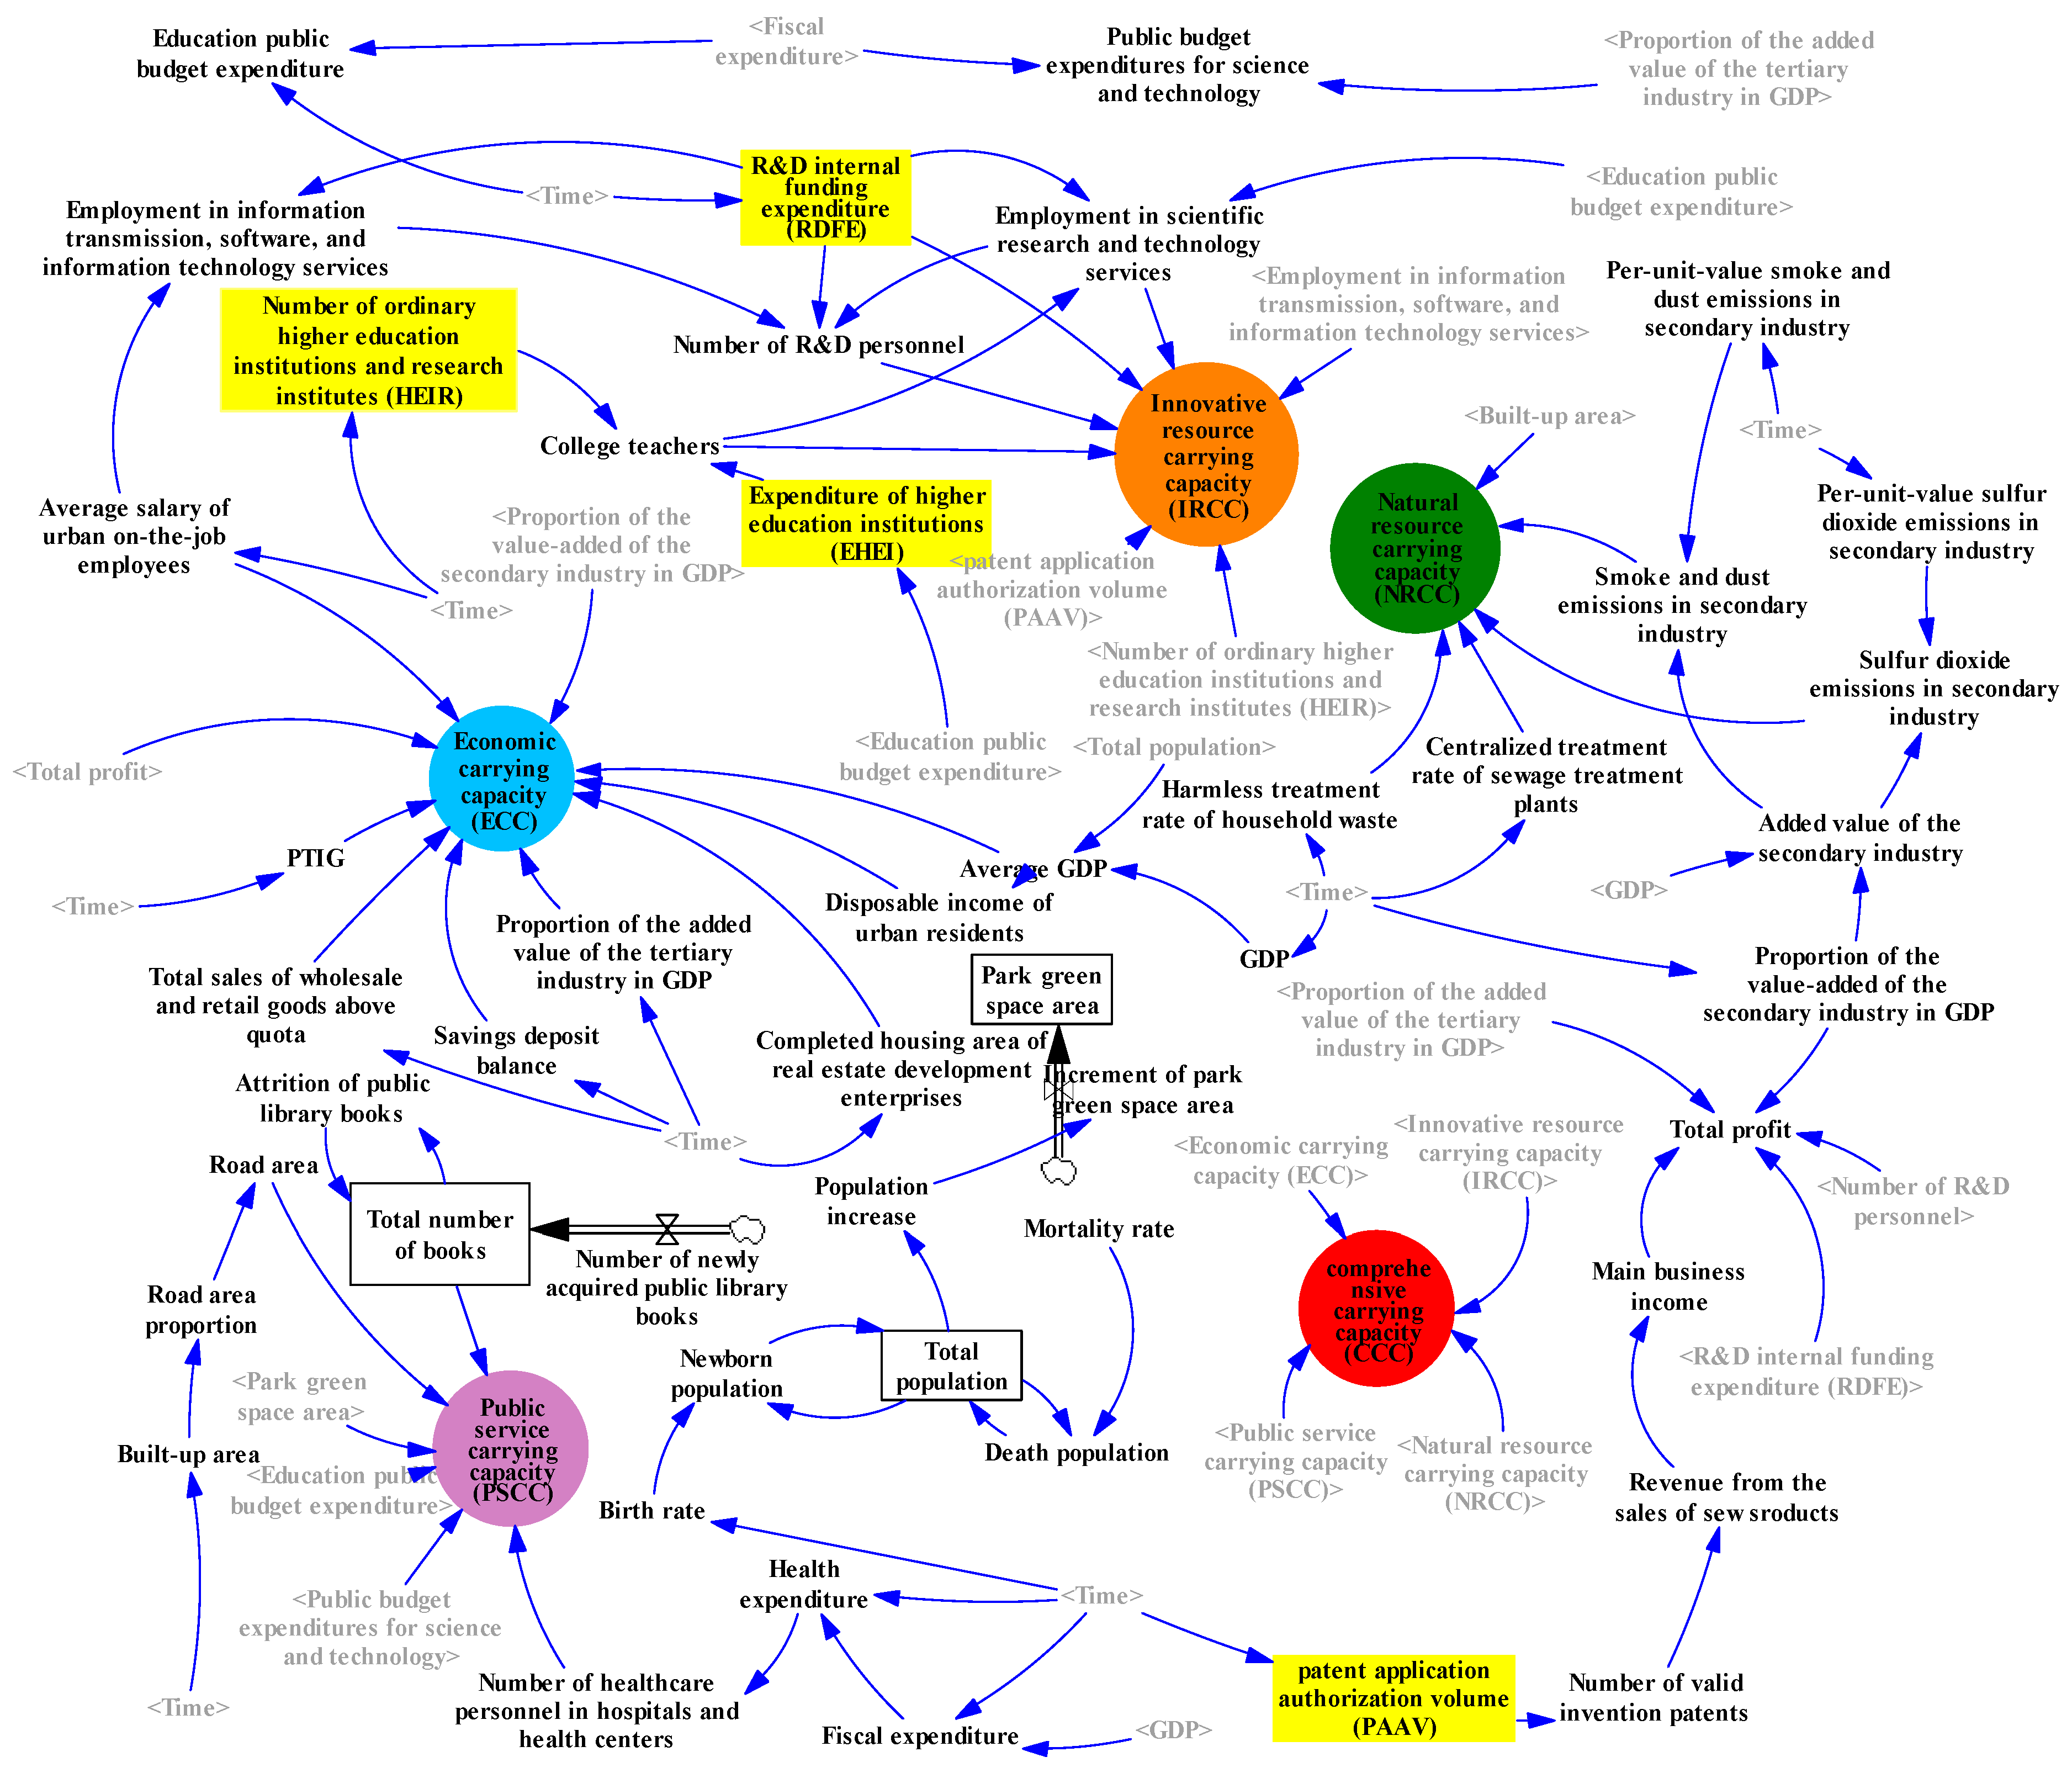
4.3. The Simulation Prediction Framework for IRCC and CCC Based on System Dynamics
4.4. Scenario Simulation Settings
5. Analysis of the Results
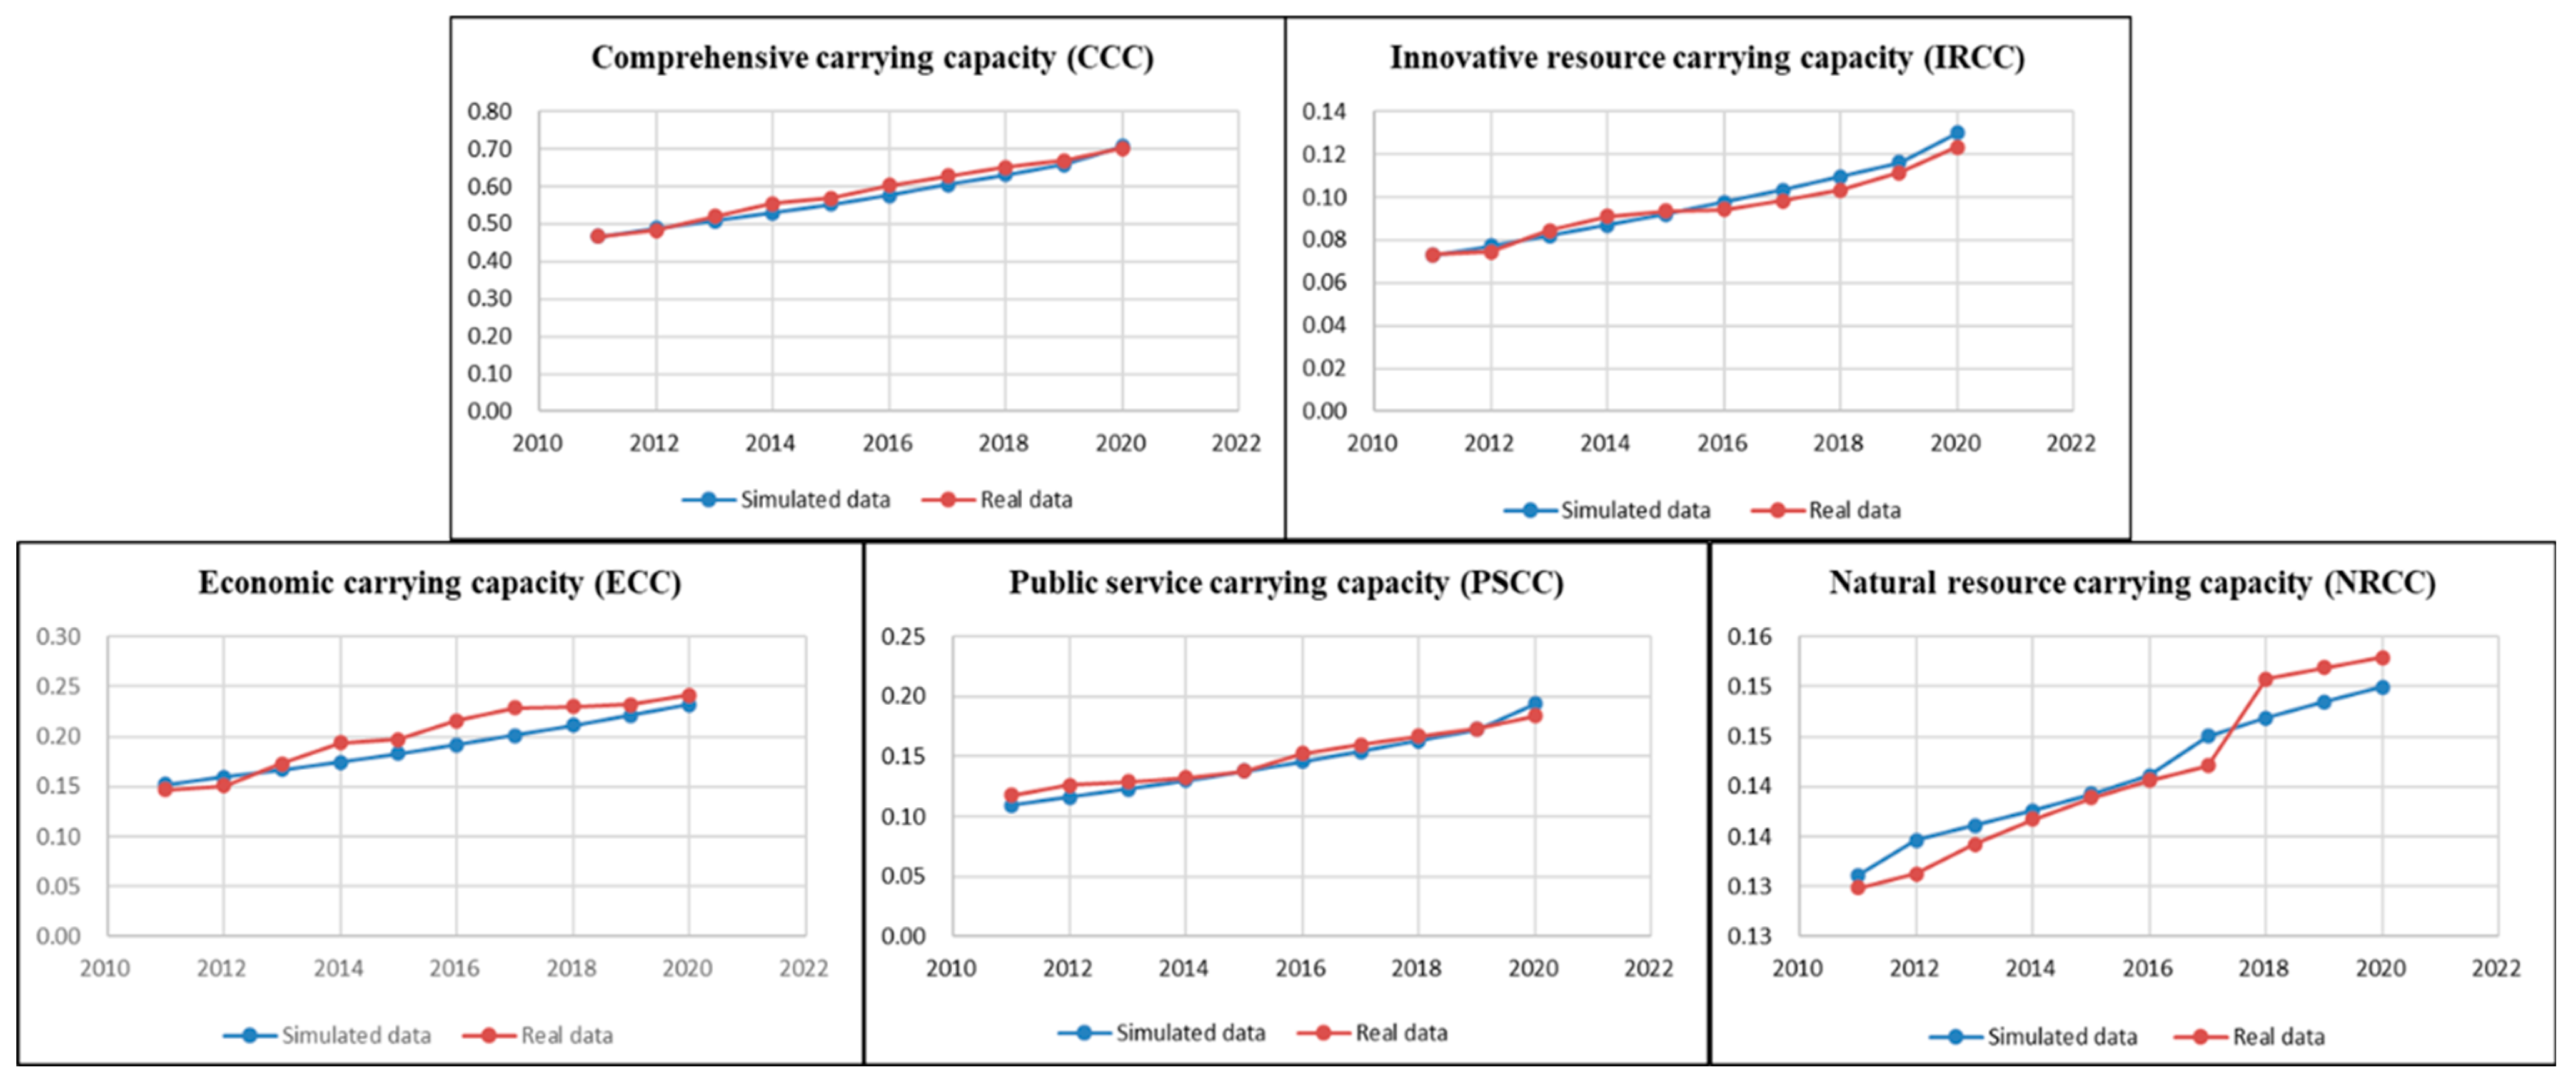
5.1. Analysis of Model Testing Results
5.2. Analysis of Historical Data Revealing Innovative Resources’ Influence
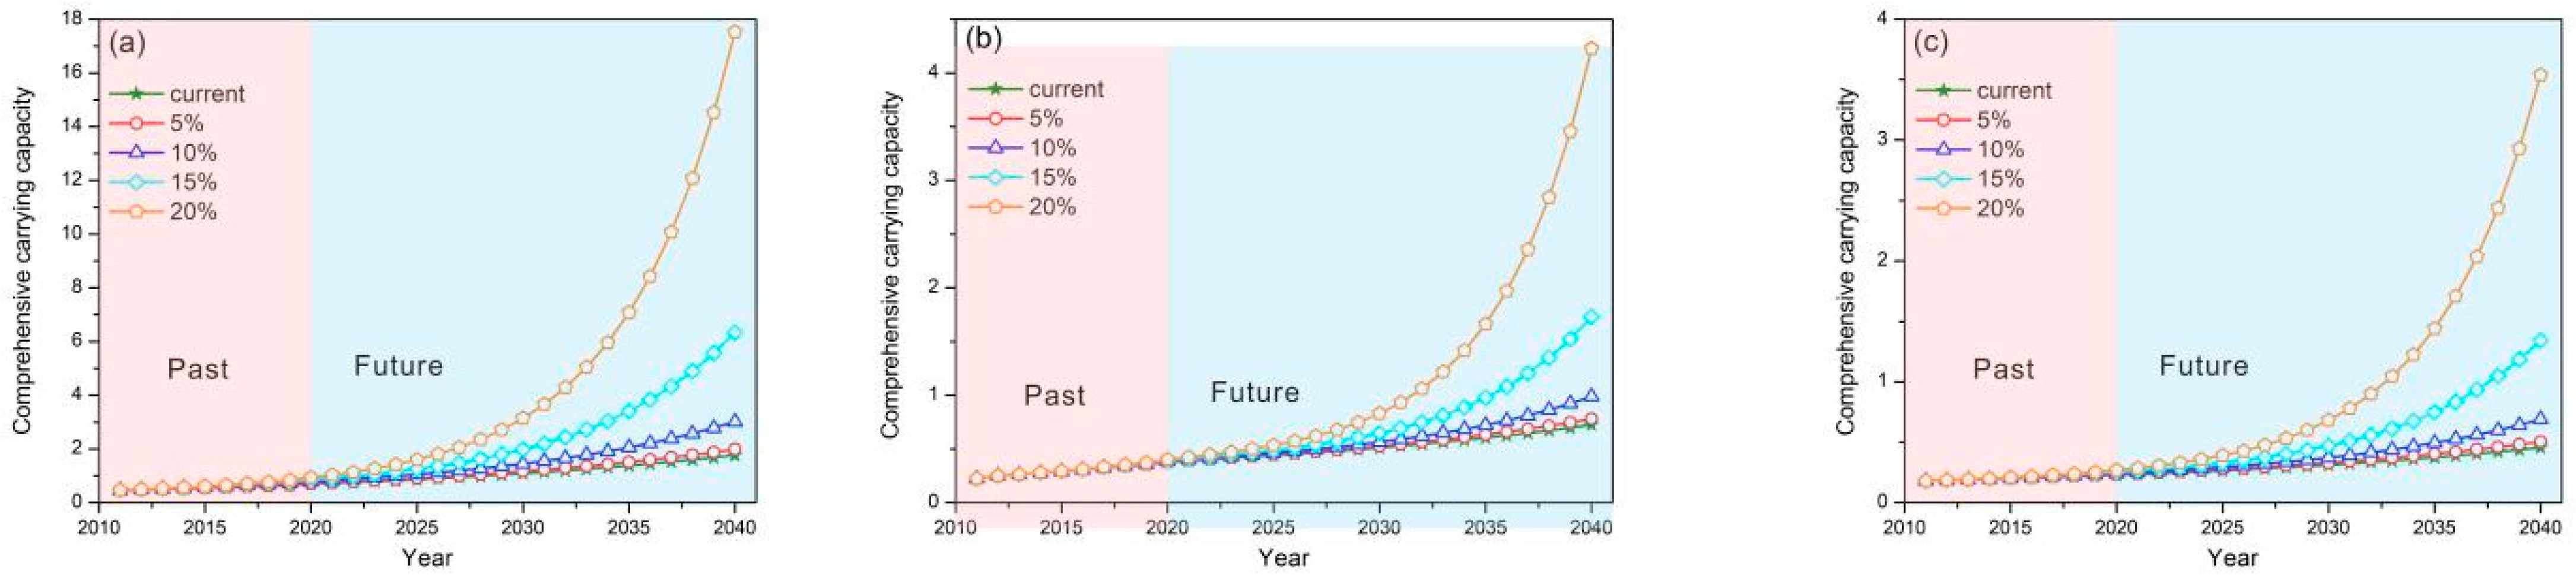
5.3. Analysis of the Predicted Data Revealing the Influence of Innovative Resources on CCC
6. Conclusions and Policy Implications
Author Contributions
Funding
Institutional Review Board Statement
Informed Consent Statement
Data Availability Statement
Conflicts of Interest
Appendix A

| Year | City | IRCC | City | IRCC | City | IRCC | City | IRCC |
|---|---|---|---|---|---|---|---|---|
| 2011 | Dalian | 0.025 | Hangzhou | 0.043 | Qingdao | 0.016 | Xi’an | 0.059 |
| 2012 | Dalian | 0.025 | Hangzhou | 0.045 | Qingdao | 0.017 | Xi’an | 0.060 |
| 2013 | Dalian | 0.028 | Hangzhou | 0.046 | Qingdao | 0.018 | Xi’an | 0.065 |
| 2014 | Dalian | 0.029 | Hangzhou | 0.048 | Qingdao | 0.019 | Xi’an | 0.065 |
| 2015 | Dalian | 0.028 | Hangzhou | 0.050 | Qingdao | 0.020 | Xi’an | 0.067 |
| 2016 | Dalian | 0.029 | Hangzhou | 0.053 | Qingdao | 0.022 | Xi’an | 0.068 |
| 2017 | Dalian | 0.029 | Hangzhou | 0.055 | Qingdao | 0.024 | Xi’an | 0.071 |
| 2018 | Dalian | 0.031 | Hangzhou | 0.058 | Qingdao | 0.026 | Xi’an | 0.073 |
| 2019 | Dalian | 0.032 | Hangzhou | 0.062 | Qingdao | 0.028 | Xi’an | 0.075 |
| 2020 | Dalian | 0.035 | Hangzhou | 0.050 | Qingdao | 0.031 | Xi’an | 0.075 |
| 2011 | Beijing | 0.149 | Harbin | 0.040 | Shanghai | 0.073 | Xining | 0.004 |
| 2012 | Beijing | 0.158 | Harbin | 0.039 | Shanghai | 0.074 | Xining | 0.004 |
| 2013 | Beijing | 0.168 | Harbin | 0.040 | Shanghai | 0.094 | Xining | 0.004 |
| 2014 | Beijing | 0.172 | Harbin | 0.040 | Shanghai | 0.091 | Xining | 0.005 |
| 2015 | Beijing | 0.179 | Harbin | 0.041 | Shanghai | 0.094 | Xining | 0.005 |
| 2016 | Beijing | 0.187 | Harbin | 0.041 | Shanghai | 0.094 | Xining | 0.006 |
| 2017 | Beijing | 0.195 | Harbin | 0.041 | Shanghai | 0.098 | Xining | 0.006 |
| 2018 | Beijing | 0.204 | Harbin | 0.041 | Shanghai | 0.103 | Xining | 0.007 |
| 2019 | Beijing | 0.217 | Harbin | 0.041 | Shanghai | 0.111 | Xining | 0.007 |
| 2020 | Beijing | 0.226 | Harbin | 0.042 | Shanghai | 0.123 | Xining | 0.007 |
| 2011 | Changchun | 0.030 | Hohhot | 0.013 | Shenyang | 0.037 | Yinchuan | 0.009 |
| 2012 | Changchun | 0.032 | Hohhot | 0.013 | Shenyang | 0.041 | Yinchuan | 0.009 |
| 2013 | Changchun | 0.032 | Hohhot | 0.014 | Shenyang | 0.043 | Yinchuan | 0.010 |
| 2014 | Changchun | 0.033 | Hohhot | 0.014 | Shenyang | 0.043 | Yinchuan | 0.010 |
| 2015 | Changchun | 0.034 | Hohhot | 0.015 | Shenyang | 0.044 | Yinchuan | 0.010 |
| 2016 | Changchun | 0.036 | Hohhot | 0.015 | Shenyang | 0.044 | Yinchuan | 0.011 |
| 2017 | Changchun | 0.038 | Hohhot | 0.015 | Shenyang | 0.045 | Yinchuan | 0.012 |
| 2018 | Changchun | 0.039 | Hohhot | 0.015 | Shenyang | 0.048 | Yinchuan | 0.012 |
| 2019 | Changchun | 0.040 | Hohhot | 0.015 | Shenyang | 0.049 | Yinchuan | 0.013 |
| 2020 | Changchun | 0.042 | Hohhot | 0.016 | Shenyang | 0.051 | Yinchuan | 0.013 |
| 2011 | Changsha | 0.040 | Jinan | 0.035 | Shenzhen | 0.031 | Zhengzhou | 0.043 |
| 2012 | Changsha | 0.041 | Jinan | 0.036 | Shenzhen | 0.038 | Zhengzhou | 0.045 |
| 2013 | Changsha | 0.042 | Jinan | 0.040 | Shenzhen | 0.042 | Zhengzhou | 0.050 |
| 2014 | Changsha | 0.043 | Jinan | 0.039 | Shenzhen | 0.042 | Zhengzhou | 0.057 |
| 2015 | Changsha | 0.044 | Jinan | 0.040 | Shenzhen | 0.047 | Zhengzhou | 0.058 |
| 2016 | Changsha | 0.045 | Jinan | 0.041 | Shenzhen | 0.054 | Zhengzhou | 0.058 |
| 2017 | Changsha | 0.046 | Jinan | 0.041 | Shenzhen | 0.062 | Zhengzhou | 0.061 |
| 2018 | Changsha | 0.048 | Jinan | 0.042 | Shenzhen | 0.080 | Zhengzhou | 0.065 |
| 2019 | Changsha | 0.050 | Jinan | 0.045 | Shenzhen | 0.088 | Zhengzhou | 0.072 |
| 2020 | Changsha | 0.053 | Jinan | 0.046 | Shenzhen | 0.104 | Zhengzhou | 0.080 |
| 2011 | Chengdu | 0.050 | Kunming | 0.031 | Taiyuan | 0.030 | ||
| 2012 | Chengdu | 0.056 | Kunming | 0.032 | Taiyuan | 0.030 | ||
| 2013 | Chengdu | 0.065 | Kunming | 0.033 | Taiyuan | 0.031 | ||
| 2014 | Chengdu | 0.066 | Kunming | 0.033 | Taiyuan | 0.031 | ||
| 2015 | Chengdu | 0.063 | Kunming | 0.034 | Taiyuan | 0.032 | ||
| 2016 | Chengdu | 0.065 | Kunming | 0.035 | Taiyuan | 0.032 | ||
| 2017 | Chengdu | 0.067 | Kunming | 0.036 | Taiyuan | 0.032 | ||
| 2018 | Chengdu | 0.072 | Kunming | 0.037 | Taiyuan | 0.034 | ||
| 2019 | Chengdu | 0.074 | Kunming | 0.037 | Taiyuan | 0.035 | ||
| 2020 | Chengdu | 0.078 | Kunming | 0.037 | Taiyuan | 0.035 | ||
| 2011 | Chongqing | 0.050 | Lanzhou | 0.017 | Tianjin | 0.050 | ||
| 2012 | Chongqing | 0.053 | Lanzhou | 0.018 | Tianjin | 0.054 | ||
| 2013 | Chongqing | 0.060 | Lanzhou | 0.019 | Tianjin | 0.057 | ||
| 2014 | Chongqing | 0.061 | Lanzhou | 0.021 | Tianjin | 0.059 | ||
| 2015 | Chongqing | 0.061 | Lanzhou | 0.021 | Tianjin | 0.062 | ||
| 2016 | Chongqing | 0.066 | Lanzhou | 0.022 | Tianjin | 0.064 | ||
| 2017 | Chongqing | 0.069 | Lanzhou | 0.024 | Tianjin | 0.063 | ||
| 2018 | Chongqing | 0.072 | Lanzhou | 0.027 | Tianjin | 0.064 | ||
| 2019 | Chongqing | 0.075 | Lanzhou | 0.024 | Tianjin | 0.066 | ||
| 2020 | Chongqing | 0.086 | Lanzhou | 0.024 | Tianjin | 0.068 | ||
| 2011 | Fuzhou | 0.038 | Nanchang | 0.041 | Urumqi | 0.010 | ||
| 2012 | Fuzhou | 0.044 | Nanchang | 0.041 | Urumqi | 0.011 | ||
| 2013 | Fuzhou | 0.046 | Nanchang | 0.041 | Urumqi | 0.013 | ||
| 2014 | Fuzhou | 0.051 | Nanchang | 0.043 | Urumqi | 0.014 | ||
| 2015 | Fuzhou | 0.054 | Nanchang | 0.042 | Urumqi | 0.014 | ||
| 2016 | Fuzhou | 0.058 | Nanchang | 0.042 | Urumqi | 0.014 | ||
| 2017 | Fuzhou | 0.060 | Nanchang | 0.043 | Urumqi | 0.015 | ||
| 2018 | Fuzhou | 0.069 | Nanchang | 0.044 | Urumqi | 0.015 | ||
| 2019 | Fuzhou | 0.076 | Nanchang | 0.045 | Urumqi | 0.017 | ||
| 2020 | Fuzhou | 0.084 | Nanchang | 0.045 | Urumqi | 0.017 | ||
| 2011 | Guangzhou | 0.083 | Nanjing | 0.049 | Wuhan | 0.077 | ||
| 2012 | Guangzhou | 0.086 | Nanjing | 0.052 | Wuhan | 0.079 | ||
| 2013 | Guangzhou | 0.094 | Nanjing | 0.057 | Wuhan | 0.080 | ||
| 2014 | Guangzhou | 0.097 | Nanjing | 0.058 | Wuhan | 0.081 | ||
| 2015 | Guangzhou | 0.103 | Nanjing | 0.060 | Wuhan | 0.083 | ||
| 2016 | Guangzhou | 0.105 | Nanjing | 0.062 | Wuhan | 0.084 | ||
| 2017 | Guangzhou | 0.112 | Nanjing | 0.065 | Wuhan | 0.085 | ||
| 2018 | Guangzhou | 0.116 | Nanjing | 0.074 | Wuhan | 0.089 | ||
| 2019 | Guangzhou | 0.121 | Nanjing | 0.080 | Wuhan | 0.091 | ||
| 2020 | Guangzhou | 0.132 | Nanjing | 0.084 | Wuhan | 0.094 | ||
| 2011 | Guiyang | 0.031 | Nanning | 0.019 | Xiamen | 0.013 | ||
| 2012 | Guiyang | 0.031 | Nanning | 0.019 | Xiamen | 0.014 | ||
| 2013 | Guiyang | 0.032 | Nanning | 0.020 | Xiamen | 0.015 | ||
| 2014 | Guiyang | 0.033 | Nanning | 0.021 | Xiamen | 0.017 | ||
| 2015 | Guiyang | 0.034 | Nanning | 0.022 | Xiamen | 0.017 | ||
| 2016 | Guiyang | 0.034 | Nanning | 0.022 | Xiamen | 0.018 | ||
| 2017 | Guiyang | 0.035 | Nanning | 0.024 | Xiamen | 0.020 | ||
| 2018 | Guiyang | 0.036 | Nanning | 0.025 | Xiamen | 0.020 | ||
| 2019 | Guiyang | 0.037 | Nanning | 0.025 | Xiamen | 0.021 | ||
| 2020 | Guiyang | 0.038 | Nanning | 0.027 | Xiamen | 0.022 |
Appendix B
| Year | City | ECC | City | ECC | City | ECC | City | ECC |
|---|---|---|---|---|---|---|---|---|
| 2011 | Dalian | 0.059 | Hangzhou | 0.073 | Qingdao | 0.066 | Xi’an | 0.063 |
| 2012 | Dalian | 0.064 | Hangzhou | 0.078 | Qingdao | 0.074 | Xi’an | 0.071 |
| 2013 | Dalian | 0.074 | Hangzhou | 0.091 | Qingdao | 0.080 | Xi’an | 0.073 |
| 2014 | Dalian | 0.056 | Hangzhou | 0.099 | Qingdao | 0.096 | Xi’an | 0.084 |
| 2015 | Dalian | 0.059 | Hangzhou | 0.108 | Qingdao | 0.105 | Xi’an | 0.086 |
| 2016 | Dalian | 0.058 | Hangzhou | 0.121 | Qingdao | 0.113 | Xi’an | 0.097 |
| 2017 | Dalian | 0.088 | Hangzhou | 0.137 | Qingdao | 0.109 | Xi’an | 0.106 |
| 2018 | Dalian | 0.092 | Hangzhou | 0.143 | Qingdao | 0.117 | Xi’an | 0.105 |
| 2019 | Dalian | 0.095 | Hangzhou | 0.157 | Qingdao | 0.128 | Xi’an | 0.113 |
| 2020 | Dalian | 0.098 | Hangzhou | 0.171 | Qingdao | 0.135 | Xi’an | 0.117 |
| 2011 | Beijing | 0.157 | Harbin | 0.055 | Shanghai | 0.147 | Xining | 0.047 |
| 2012 | Beijing | 0.168 | Harbin | 0.067 | Shanghai | 0.151 | Xining | 0.053 |
| 2013 | Beijing | 0.176 | Harbin | 0.072 | Shanghai | 0.173 | Xining | 0.054 |
| 2014 | Beijing | 0.190 | Harbin | 0.079 | Shanghai | 0.194 | Xining | 0.061 |
| 2015 | Beijing | 0.198 | Harbin | 0.085 | Shanghai | 0.197 | Xining | 0.063 |
| 2016 | Beijing | 0.204 | Harbin | 0.093 | Shanghai | 0.216 | Xining | 0.065 |
| 2017 | Beijing | 0.212 | Harbin | 0.094 | Shanghai | 0.229 | Xining | 0.076 |
| 2018 | Beijing | 0.223 | Harbin | 0.100 | Shanghai | 0.240 | Xining | 0.096 |
| 2019 | Beijing | 0.241 | Harbin | 0.112 | Shanghai | 0.252 | Xining | 0.108 |
| 2020 | Beijing | 0.256 | Harbin | 0.114 | Shanghai | 0.263 | Xining | 0.103 |
| 2011 | Changchun | 0.033 | Hohhot | 0.099 | Shenyang | 0.066 | Yinchuan | 0.063 |
| 2012 | Changchun | 0.040 | Hohhot | 0.107 | Shenyang | 0.070 | Yinchuan | 0.067 |
| 2013 | Changchun | 0.040 | Hohhot | 0.111 | Shenyang | 0.063 | Yinchuan | 0.071 |
| 2014 | Changchun | 0.039 | Hohhot | 0.120 | Shenyang | 0.067 | Yinchuan | 0.086 |
| 2015 | Changchun | 0.046 | Hohhot | 0.121 | Shenyang | 0.069 | Yinchuan | 0.095 |
| 2016 | Changchun | 0.050 | Hohhot | 0.126 | Shenyang | 0.078 | Yinchuan | 0.096 |
| 2017 | Changchun | 0.057 | Hohhot | 0.124 | Shenyang | 0.085 | Yinchuan | 0.101 |
| 2018 | Changchun | 0.063 | Hohhot | 0.131 | Shenyang | 0.089 | Yinchuan | 0.109 |
| 2019 | Changchun | 0.078 | Hohhot | 0.132 | Shenyang | 0.101 | Yinchuan | 0.121 |
| 2020 | Changchun | 0.080 | Hohhot | 0.140 | Shenyang | 0.107 | Yinchuan | 0.129 |
| 2011 | Changsha | 0.069 | Jinan | 0.075 | Shenzhen | 0.106 | Zhengzhou | 0.076 |
| 2012 | Changsha | 0.075 | Jinan | 0.078 | Shenzhen | 0.110 | Zhengzhou | 0.071 |
| 2013 | Changsha | 0.082 | Jinan | 0.088 | Shenzhen | 0.116 | Zhengzhou | 0.071 |
| 2014 | Changsha | 0.088 | Jinan | 0.092 | Shenzhen | 0.119 | Zhengzhou | 0.084 |
| 2015 | Changsha | 0.095 | Jinan | 0.100 | Shenzhen | 0.129 | Zhengzhou | 0.083 |
| 2016 | Changsha | 0.110 | Jinan | 0.106 | Shenzhen | 0.138 | Zhengzhou | 0.093 |
| 2017 | Changsha | 0.117 | Jinan | 0.109 | Shenzhen | 0.141 | Zhengzhou | 0.104 |
| 2018 | Changsha | 0.128 | Jinan | 0.110 | Shenzhen | 0.148 | Zhengzhou | 0.106 |
| 2019 | Changsha | 0.138 | Jinan | 0.112 | Shenzhen | 0.164 | Zhengzhou | 0.119 |
| 2020 | Changsha | 0.144 | Jinan | 0.122 | Shenzhen | 0.183 | Zhengzhou | 0.119 |
| 2011 | Chengdu | 0.062 | Kunming | 0.062 | Taiyuan | 0.046 | ||
| 2012 | Chengdu | 0.075 | Kunming | 0.066 | Taiyuan | 0.048 | ||
| 2013 | Chengdu | 0.085 | Kunming | 0.074 | Taiyuan | 0.052 | ||
| 2014 | Chengdu | 0.088 | Kunming | 0.075 | Taiyuan | 0.066 | ||
| 2015 | Chengdu | 0.083 | Kunming | 0.083 | Taiyuan | 0.072 | ||
| 2016 | Chengdu | 0.101 | Kunming | 0.085 | Taiyuan | 0.078 | ||
| 2017 | Chengdu | 0.098 | Kunming | 0.092 | Taiyuan | 0.078 | ||
| 2018 | Chengdu | 0.100 | Kunming | 0.093 | Taiyuan | 0.085 | ||
| 2019 | Chengdu | 0.135 | Kunming | 0.118 | Taiyuan | 0.087 | ||
| 2020 | Chengdu | 0.137 | Kunming | 0.126 | Taiyuan | 0.092 | ||
| 2011 | Chongqing | 0.048 | Lanzhou | 0.040 | Tianjin | 0.074 | ||
| 2012 | Chongqing | 0.085 | Lanzhou | 0.039 | Tianjin | 0.092 | ||
| 2013 | Chongqing | 0.092 | Lanzhou | 0.047 | Tianjin | 0.102 | ||
| 2014 | Chongqing | 0.084 | Lanzhou | 0.062 | Tianjin | 0.113 | ||
| 2015 | Chongqing | 0.097 | Lanzhou | 0.071 | Tianjin | 0.118 | ||
| 2016 | Chongqing | 0.099 | Lanzhou | 0.079 | Tianjin | 0.131 | ||
| 2017 | Chongqing | 0.115 | Lanzhou | 0.080 | Tianjin | 0.125 | ||
| 2018 | Chongqing | 0.107 | Lanzhou | 0.092 | Tianjin | 0.132 | ||
| 2019 | Chongqing | 0.123 | Lanzhou | 0.093 | Tianjin | 0.136 | ||
| 2020 | Chongqing | 0.131 | Lanzhou | 0.099 | Tianjin | 0.143 | ||
| 2011 | Fuzhou | 0.066 | Nanchang | 0.027 | Urumqi | 0.069 | ||
| 2012 | Fuzhou | 0.071 | Nanchang | 0.041 | Urumqi | 0.080 | ||
| 2013 | Fuzhou | 0.078 | Nanchang | 0.044 | Urumqi | 0.066 | ||
| 2014 | Fuzhou | 0.081 | Nanchang | 0.049 | Urumqi | 0.078 | ||
| 2015 | Fuzhou | 0.090 | Nanchang | 0.051 | Urumqi | 0.092 | ||
| 2016 | Fuzhou | 0.096 | Nanchang | 0.057 | Urumqi | 0.098 | ||
| 2017 | Fuzhou | 0.094 | Nanchang | 0.063 | Urumqi | 0.102 | ||
| 2018 | Fuzhou | 0.101 | Nanchang | 0.072 | Urumqi | 0.108 | ||
| 2019 | Fuzhou | 0.102 | Nanchang | 0.084 | Urumqi | 0.119 | ||
| 2020 | Fuzhou | 0.117 | Nanchang | 0.091 | Urumqi | 0.116 | ||
| 2011 | Guangzhou | 0.101 | Nanjing | 0.071 | Wuhan | 0.059 | ||
| 2012 | Guangzhou | 0.111 | Nanjing | 0.083 | Wuhan | 0.063 | ||
| 2013 | Guangzhou | 0.122 | Nanjing | 0.081 | Wuhan | 0.064 | ||
| 2014 | Guangzhou | 0.129 | Nanjing | 0.092 | Wuhan | 0.071 | ||
| 2015 | Guangzhou | 0.132 | Nanjing | 0.100 | Wuhan | 0.078 | ||
| 2016 | Guangzhou | 0.141 | Nanjing | 0.110 | Wuhan | 0.088 | ||
| 2017 | Guangzhou | 0.151 | Nanjing | 0.115 | Wuhan | 0.084 | ||
| 2018 | Guangzhou | 0.162 | Nanjing | 0.125 | Wuhan | 0.091 | ||
| 2019 | Guangzhou | 0.182 | Nanjing | 0.139 | Wuhan | 0.107 | ||
| 2020 | Guangzhou | 0.184 | Nanjing | 0.152 | Wuhan | 0.112 | ||
| 2011 | Guiyang | 0.053 | Nanning | 0.061 | Xiamen | 0.044 | ||
| 2012 | Guiyang | 0.056 | Nanning | 0.065 | Xiamen | 0.052 | ||
| 2013 | Guiyang | 0.065 | Nanning | 0.061 | Xiamen | 0.058 | ||
| 2014 | Guiyang | 0.071 | Nanning | 0.061 | Xiamen | 0.067 | ||
| 2015 | Guiyang | 0.079 | Nanning | 0.067 | Xiamen | 0.072 | ||
| 2016 | Guiyang | 0.079 | Nanning | 0.064 | Xiamen | 0.081 | ||
| 2017 | Guiyang | 0.077 | Nanning | 0.069 | Xiamen | 0.085 | ||
| 2018 | Guiyang | 0.084 | Nanning | 0.103 | Xiamen | 0.093 | ||
| 2019 | Guiyang | 0.086 | Nanning | 0.107 | Xiamen | 0.103 | ||
| 2020 | Guiyang | 0.094 | Nanning | 0.110 | Xiamen | 0.119 |
Appendix C
| Year | City | PSCC | City | PSCC | City | PSCC | City | PSCC |
|---|---|---|---|---|---|---|---|---|
| 2011 | Dalian | 0.022 | Hangzhou | 0.030 | Qingdao | 0.021 | Xi’an | 0.020 |
| 2012 | Dalian | 0.024 | Hangzhou | 0.034 | Qingdao | 0.026 | Xi’an | 0.024 |
| 2013 | Dalian | 0.025 | Hangzhou | 0.036 | Qingdao | 0.029 | Xi’an | 0.028 |
| 2014 | Dalian | 0.026 | Hangzhou | 0.040 | Qingdao | 0.030 | Xi’an | 0.028 |
| 2015 | Dalian | 0.025 | Hangzhou | 0.047 | Qingdao | 0.031 | Xi’an | 0.031 |
| 2016 | Dalian | 0.029 | Hangzhou | 0.051 | Qingdao | 0.037 | Xi’an | 0.030 |
| 2017 | Dalian | 0.032 | Hangzhou | 0.059 | Qingdao | 0.041 | Xi’an | 0.040 |
| 2018 | Dalian | 0.035 | Hangzhou | 0.065 | Qingdao | 0.046 | Xi’an | 0.043 |
| 2019 | Dalian | 0.027 | Hangzhou | 0.071 | Qingdao | 0.050 | Xi’an | 0.048 |
| 2020 | Dalian | 0.030 | Hangzhou | 0.075 | Qingdao | 0.053 | Xi’an | 0.090 |
| 2011 | Beijing | 0.115 | Harbin | 0.020 | Shanghai | 0.118 | Xining | 0.003 |
| 2012 | Beijing | 0.136 | Harbin | 0.022 | Shanghai | 0.126 | Xining | 0.004 |
| 2013 | Beijing | 0.142 | Harbin | 0.024 | Shanghai | 0.129 | Xining | 0.002 |
| 2014 | Beijing | 0.150 | Harbin | 0.024 | Shanghai | 0.132 | Xining | 0.002 |
| 2015 | Beijing | 0.170 | Harbin | 0.025 | Shanghai | 0.138 | Xining | 0.002 |
| 2016 | Beijing | 0.172 | Harbin | 0.027 | Shanghai | 0.152 | Xining | 0.002 |
| 2017 | Beijing | 0.162 | Harbin | 0.028 | Shanghai | 0.160 | Xining | 0.003 |
| 2018 | Beijing | 0.197 | Harbin | 0.031 | Shanghai | 0.167 | Xining | 0.004 |
| 2019 | Beijing | 0.208 | Harbin | 0.032 | Shanghai | 0.133 | Xining | 0.004 |
| 2020 | Beijing | 0.210 | Harbin | 0.029 | Shanghai | 0.174 | Xining | 0.006 |
| 2011 | Changchun | 0.023 | Hohhot | 0.006 | Shenyang | 0.032 | Yinchuan | 0.004 |
| 2012 | Changchun | 0.026 | Hohhot | 0.006 | Shenyang | 0.035 | Yinchuan | 0.004 |
| 2013 | Changchun | 0.026 | Hohhot | 0.007 | Shenyang | 0.038 | Yinchuan | 0.005 |
| 2014 | Changchun | 0.026 | Hohhot | 0.007 | Shenyang | 0.038 | Yinchuan | 0.005 |
| 2015 | Changchun | 0.028 | Hohhot | 0.010 | Shenyang | 0.036 | Yinchuan | 0.007 |
| 2016 | Changchun | 0.029 | Hohhot | 0.012 | Shenyang | 0.033 | Yinchuan | 0.008 |
| 2017 | Changchun | 0.026 | Hohhot | 0.013 | Shenyang | 0.037 | Yinchuan | 0.009 |
| 2018 | Changchun | 0.030 | Hohhot | 0.011 | Shenyang | 0.039 | Yinchuan | 0.009 |
| 2019 | Changchun | 0.029 | Hohhot | 0.012 | Shenyang | 0.043 | Yinchuan | 0.010 |
| 2020 | Changchun | 0.035 | Hohhot | 0.012 | Shenyang | 0.044 | Yinchuan | 0.010 |
| 2011 | Changsha | 0.018 | Jinan | 0.023 | Shenzhen | 0.068 | Zhengzhou | 0.015 |
| 2012 | Changsha | 0.020 | Jinan | 0.026 | Shenzhen | 0.075 | Zhengzhou | 0.017 |
| 2013 | Changsha | 0.021 | Jinan | 0.027 | Shenzhen | 0.083 | Zhengzhou | 0.019 |
| 2014 | Changsha | 0.022 | Jinan | 0.029 | Shenzhen | 0.084 | Zhengzhou | 0.022 |
| 2015 | Changsha | 0.029 | Jinan | 0.033 | Shenzhen | 0.094 | Zhengzhou | 0.023 |
| 2016 | Changsha | 0.027 | Jinan | 0.037 | Shenzhen | 0.113 | Zhengzhou | 0.025 |
| 2017 | Changsha | 0.027 | Jinan | 0.039 | Shenzhen | 0.117 | Zhengzhou | 0.035 |
| 2018 | Changsha | 0.028 | Jinan | 0.043 | Shenzhen | 0.116 | Zhengzhou | 0.039 |
| 2019 | Changsha | 0.030 | Jinan | 0.053 | Shenzhen | 0.140 | Zhengzhou | 0.043 |
| 2020 | Changsha | 0.040 | Jinan | 0.058 | Shenzhen | 0.136 | Zhengzhou | 0.048 |
| 2011 | Chengdu | 0.032 | Kunming | 0.014 | Taiyuan | 0.013 | ||
| 2012 | Chengdu | 0.034 | Kunming | 0.015 | Taiyuan | 0.015 | ||
| 2013 | Chengdu | 0.036 | Kunming | 0.014 | Taiyuan | 0.018 | ||
| 2014 | Chengdu | 0.038 | Kunming | 0.021 | Taiyuan | 0.019 | ||
| 2015 | Chengdu | 0.043 | Kunming | 0.018 | Taiyuan | 0.020 | ||
| 2016 | Chengdu | 0.052 | Kunming | 0.021 | Taiyuan | 0.020 | ||
| 2017 | Chengdu | 0.057 | Kunming | 0.018 | Taiyuan | 0.022 | ||
| 2018 | Chengdu | 0.062 | Kunming | 0.020 | Taiyuan | 0.024 | ||
| 2019 | Chengdu | 0.067 | Kunming | 0.022 | Taiyuan | 0.025 | ||
| 2020 | Chengdu | 0.077 | Kunming | 0.025 | Taiyuan | 0.026 | ||
| 2011 | Chongqing | 0.062 | Lanzhou | 0.008 | Tianjin | 0.052 | ||
| 2012 | Chongqing | 0.070 | Lanzhou | 0.009 | Tianjin | 0.059 | ||
| 2013 | Chongqing | 0.072 | Lanzhou | 0.008 | Tianjin | 0.057 | ||
| 2014 | Chongqing | 0.079 | Lanzhou | 0.010 | Tianjin | 0.062 | ||
| 2015 | Chongqing | 0.087 | Lanzhou | 0.012 | Tianjin | 0.078 | ||
| 2016 | Chongqing | 0.097 | Lanzhou | 0.014 | Tianjin | 0.081 | ||
| 2017 | Chongqing | 0.103 | Lanzhou | 0.014 | Tianjin | 0.082 | ||
| 2018 | Chongqing | 0.111 | Lanzhou | 0.016 | Tianjin | 0.085 | ||
| 2019 | Chongqing | 0.119 | Lanzhou | 0.017 | Tianjin | 0.091 | ||
| 2020 | Chongqing | 0.126 | Lanzhou | 0.017 | Tianjin | 0.093 | ||
| 2011 | Fuzhou | 0.009 | Nanchang | 0.007 | Urumqi | 0.010 | ||
| 2012 | Fuzhou | 0.010 | Nanchang | 0.010 | Urumqi | 0.011 | ||
| 2013 | Fuzhou | 0.010 | Nanchang | 0.011 | Urumqi | 0.013 | ||
| 2014 | Fuzhou | 0.011 | Nanchang | 0.012 | Urumqi | 0.014 | ||
| 2015 | Fuzhou | 0.012 | Nanchang | 0.014 | Urumqi | 0.014 | ||
| 2016 | Fuzhou | 0.014 | Nanchang | 0.012 | Urumqi | 0.015 | ||
| 2017 | Fuzhou | 0.019 | Nanchang | 0.015 | Urumqi | 0.015 | ||
| 2018 | Fuzhou | 0.021 | Nanchang | 0.016 | Urumqi | 0.016 | ||
| 2019 | Fuzhou | 0.023 | Nanchang | 0.016 | Urumqi | 0.023 | ||
| 2020 | Fuzhou | 0.025 | Nanchang | 0.018 | Urumqi | 0.024 | ||
| 2011 | Guangzhou | 0.064 | Nanjing | 0.042 | Wuhan | 0.033 | ||
| 2012 | Guangzhou | 0.071 | Nanjing | 0.047 | Wuhan | 0.038 | ||
| 2013 | Guangzhou | 0.075 | Nanjing | 0.052 | Wuhan | 0.038 | ||
| 2014 | Guangzhou | 0.078 | Nanjing | 0.055 | Wuhan | 0.042 | ||
| 2015 | Guangzhou | 0.094 | Nanjing | 0.061 | Wuhan | 0.041 | ||
| 2016 | Guangzhou | 0.103 | Nanjing | 0.064 | Wuhan | 0.047 | ||
| 2017 | Guangzhou | 0.110 | Nanjing | 0.067 | Wuhan | 0.057 | ||
| 2018 | Guangzhou | 0.129 | Nanjing | 0.072 | Wuhan | 0.064 | ||
| 2019 | Guangzhou | 0.145 | Nanjing | 0.079 | Wuhan | 0.069 | ||
| 2020 | Guangzhou | 0.148 | Nanjing | 0.083 | Wuhan | 0.079 | ||
| 2011 | Guiyang | 0.006 | Nanning | 0.013 | Xiamen | 0.013 | ||
| 2012 | Guiyang | 0.009 | Nanning | 0.014 | Xiamen | 0.015 | ||
| 2013 | Guiyang | 0.013 | Nanning | 0.016 | Xiamen | 0.014 | ||
| 2014 | Guiyang | 0.014 | Nanning | 0.018 | Xiamen | 0.015 | ||
| 2015 | Guiyang | 0.013 | Nanning | 0.018 | Xiamen | 0.017 | ||
| 2016 | Guiyang | 0.014 | Nanning | 0.020 | Xiamen | 0.016 | ||
| 2017 | Guiyang | 0.016 | Nanning | 0.022 | Xiamen | 0.022 | ||
| 2018 | Guiyang | 0.018 | Nanning | 0.025 | Xiamen | 0.031 | ||
| 2019 | Guiyang | 0.019 | Nanning | 0.027 | Xiamen | 0.033 | ||
| 2020 | Guiyang | 0.022 | Nanning | 0.029 | Xiamen | 0.029 |
Appendix D
| Year | City | NRCC | City | NRCC | City | NRCC | City | NRCC |
|---|---|---|---|---|---|---|---|---|
| 2011 | Dalian | 0.092 | Hangzhou | 0.128 | Qingdao | 0.126 | Xi’an | 0.125 |
| 2012 | Dalian | 0.100 | Hangzhou | 0.130 | Qingdao | 0.129 | Xi’an | 0.128 |
| 2013 | Dalian | 0.102 | Hangzhou | 0.129 | Qingdao | 0.133 | Xi’an | 0.130 |
| 2014 | Dalian | 0.081 | Hangzhou | 0.130 | Qingdao | 0.133 | Xi’an | 0.132 |
| 2015 | Dalian | 0.124 | Hangzhou | 0.130 | Qingdao | 0.136 | Xi’an | 0.135 |
| 2016 | Dalian | 0.130 | Hangzhou | 0.137 | Qingdao | 0.140 | Xi’an | 0.138 |
| 2017 | Dalian | 0.131 | Hangzhou | 0.140 | Qingdao | 0.142 | Xi’an | 0.142 |
| 2018 | Dalian | 0.131 | Hangzhou | 0.142 | Qingdao | 0.145 | Xi’an | 0.144 |
| 2019 | Dalian | 0.137 | Hangzhou | 0.143 | Qingdao | 0.147 | Xi’an | 0.144 |
| 2020 | Dalian | 0.138 | Hangzhou | 0.144 | Qingdao | 0.147 | Xi’an | 0.145 |
| 2011 | Beijing | 0.136 | Harbin | 0.051 | Shanghai | 0.130 | Xining | 0.107 |
| 2012 | Beijing | 0.139 | Harbin | 0.060 | Shanghai | 0.131 | Xining | 0.109 |
| 2013 | Beijing | 0.144 | Harbin | 0.065 | Shanghai | 0.134 | Xining | 0.111 |
| 2014 | Beijing | 0.148 | Harbin | 0.064 | Shanghai | 0.137 | Xining | 0.112 |
| 2015 | Beijing | 0.152 | Harbin | 0.081 | Shanghai | 0.139 | Xining | 0.113 |
| 2016 | Beijing | 0.158 | Harbin | 0.089 | Shanghai | 0.141 | Xining | 0.115 |
| 2017 | Beijing | 0.163 | Harbin | 0.098 | Shanghai | 0.142 | Xining | 0.115 |
| 2018 | Beijing | 0.166 | Harbin | 0.126 | Shanghai | 0.151 | Xining | 0.116 |
| 2019 | Beijing | 0.168 | Harbin | 0.133 | Shanghai | 0.152 | Xining | 0.117 |
| 2020 | Beijing | 0.168 | Harbin | 0.117 | Shanghai | 0.153 | Xining | 0.120 |
| 2011 | Changchun | 0.093 | Hohhot | 0.109 | Shenyang | 0.110 | Yinchuan | 0.118 |
| 2012 | Changchun | 0.092 | Hohhot | 0.112 | Shenyang | 0.115 | Yinchuan | 0.117 |
| 2013 | Changchun | 0.098 | Hohhot | 0.115 | Shenyang | 0.122 | Yinchuan | 0.119 |
| 2014 | Changchun | 0.103 | Hohhot | 0.116 | Shenyang | 0.123 | Yinchuan | 0.121 |
| 2015 | Changchun | 0.106 | Hohhot | 0.118 | Shenyang | 0.122 | Yinchuan | 0.122 |
| 2016 | Changchun | 0.113 | Hohhot | 0.118 | Shenyang | 0.123 | Yinchuan | 0.124 |
| 2017 | Changchun | 0.113 | Hohhot | 0.119 | Shenyang | 0.120 | Yinchuan | 0.126 |
| 2018 | Changchun | 0.120 | Hohhot | 0.119 | Shenyang | 0.116 | Yinchuan | 0.126 |
| 2019 | Changchun | 0.125 | Hohhot | 0.119 | Shenyang | 0.112 | Yinchuan | 0.127 |
| 2020 | Changchun | 0.130 | Hohhot | 0.123 | Shenyang | 0.108 | Yinchuan | 0.127 |
| 2011 | Changsha | 0.131 | Jinan | 0.122 | Shenzhen | 0.135 | Zhengzhou | 0.082 |
| 2012 | Changsha | 0.132 | Jinan | 0.124 | Shenzhen | 0.137 | Zhengzhou | 0.087 |
| 2013 | Changsha | 0.130 | Jinan | 0.126 | Shenzhen | 0.145 | Zhengzhou | 0.090 |
| 2014 | Changsha | 0.132 | Jinan | 0.128 | Shenzhen | 0.152 | Zhengzhou | 0.089 |
| 2015 | Changsha | 0.136 | Jinan | 0.130 | Shenzhen | 0.153 | Zhengzhou | 0.088 |
| 2016 | Changsha | 0.137 | Jinan | 0.133 | Shenzhen | 0.154 | Zhengzhou | 0.098 |
| 2017 | Changsha | 0.138 | Jinan | 0.135 | Shenzhen | 0.155 | Zhengzhou | 0.103 |
| 2018 | Changsha | 0.137 | Jinan | 0.138 | Shenzhen | 0.155 | Zhengzhou | 0.106 |
| 2019 | Changsha | 0.140 | Jinan | 0.146 | Shenzhen | 0.156 | Zhengzhou | 0.111 |
| 2020 | Changsha | 0.144 | Jinan | 0.150 | Shenzhen | 0.156 | Zhengzhou | 0.121 |
| 2011 | Chengdu | 0.130 | Kunming | 0.129 | Taiyuan | 0.125 | ||
| 2012 | Chengdu | 0.132 | Kunming | 0.130 | Taiyuan | 0.126 | ||
| 2013 | Chengdu | 0.131 | Kunming | 0.133 | Taiyuan | 0.127 | ||
| 2014 | Chengdu | 0.136 | Kunming | 0.136 | Taiyuan | 0.128 | ||
| 2015 | Chengdu | 0.139 | Kunming | 0.134 | Taiyuan | 0.129 | ||
| 2016 | Chengdu | 0.147 | Kunming | 0.136 | Taiyuan | 0.129 | ||
| 2017 | Chengdu | 0.149 | Kunming | 0.137 | Taiyuan | 0.130 | ||
| 2018 | Chengdu | 0.151 | Kunming | 0.137 | Taiyuan | 0.130 | ||
| 2019 | Chengdu | 0.153 | Kunming | 0.139 | Taiyuan | 0.131 | ||
| 2020 | Chengdu | 0.155 | Kunming | 0.141 | Taiyuan | 0.131 | ||
| 2011 | Chongqing | 0.102 | Lanzhou | 0.099 | Tianjin | 0.124 | ||
| 2012 | Chongqing | 0.102 | Lanzhou | 0.103 | Tianjin | 0.120 | ||
| 2013 | Chongqing | 0.105 | Lanzhou | 0.104 | Tianjin | 0.121 | ||
| 2014 | Chongqing | 0.103 | Lanzhou | 0.105 | Tianjin | 0.116 | ||
| 2015 | Chongqing | 0.111 | Lanzhou | 0.111 | Tianjin | 0.123 | ||
| 2016 | Chongqing | 0.134 | Lanzhou | 0.120 | Tianjin | 0.128 | ||
| 2017 | Chongqing | 0.138 | Lanzhou | 0.122 | Tianjin | 0.132 | ||
| 2018 | Chongqing | 0.129 | Lanzhou | 0.123 | Tianjin | 0.143 | ||
| 2019 | Chongqing | 0.123 | Lanzhou | 0.125 | Tianjin | 0.146 | ||
| 2020 | Chongqing | 0.151 | Lanzhou | 0.131 | Tianjin | 0.148 | ||
| 2011 | Fuzhou | 0.120 | Nanchang | 0.120 | Urumqi | 0.104 | ||
| 2012 | Fuzhou | 0.121 | Nanchang | 0.120 | Urumqi | 0.106 | ||
| 2013 | Fuzhou | 0.123 | Nanchang | 0.122 | Urumqi | 0.108 | ||
| 2014 | Fuzhou | 0.124 | Nanchang | 0.124 | Urumqi | 0.110 | ||
| 2015 | Fuzhou | 0.126 | Nanchang | 0.126 | Urumqi | 0.107 | ||
| 2016 | Fuzhou | 0.127 | Nanchang | 0.128 | Urumqi | 0.112 | ||
| 2017 | Fuzhou | 0.129 | Nanchang | 0.132 | Urumqi | 0.116 | ||
| 2018 | Fuzhou | 0.129 | Nanchang | 0.132 | Urumqi | 0.121 | ||
| 2019 | Fuzhou | 0.130 | Nanchang | 0.130 | Urumqi | 0.125 | ||
| 2020 | Fuzhou | 0.130 | Nanchang | 0.134 | Urumqi | 0.134 | ||
| 2011 | Guangzhou | 0.104 | Nanjing | 0.120 | Wuhan | 0.111 | ||
| 2012 | Guangzhou | 0.105 | Nanjing | 0.122 | Wuhan | 0.121 | ||
| 2013 | Guangzhou | 0.123 | Nanjing | 0.125 | Wuhan | 0.132 | ||
| 2014 | Guangzhou | 0.127 | Nanjing | 0.127 | Wuhan | 0.134 | ||
| 2015 | Guangzhou | 0.148 | Nanjing | 0.129 | Wuhan | 0.135 | ||
| 2016 | Guangzhou | 0.151 | Nanjing | 0.131 | Wuhan | 0.136 | ||
| 2017 | Guangzhou | 0.153 | Nanjing | 0.133 | Wuhan | 0.137 | ||
| 2018 | Guangzhou | 0.161 | Nanjing | 0.135 | Wuhan | 0.141 | ||
| 2019 | Guangzhou | 0.153 | Nanjing | 0.136 | Wuhan | 0.144 | ||
| 2020 | Guangzhou | 0.154 | Nanjing | 0.139 | Wuhan | 0.146 | ||
| 2011 | Guiyang | 0.101 | Nanning | 0.101 | Xiamen | 0.131 | ||
| 2012 | Guiyang | 0.105 | Nanning | 0.113 | Xiamen | 0.133 | ||
| 2013 | Guiyang | 0.109 | Nanning | 0.113 | Xiamen | 0.133 | ||
| 2014 | Guiyang | 0.113 | Nanning | 0.116 | Xiamen | 0.134 | ||
| 2015 | Guiyang | 0.112 | Nanning | 0.118 | Xiamen | 0.135 | ||
| 2016 | Guiyang | 0.116 | Nanning | 0.119 | Xiamen | 0.135 | ||
| 2017 | Guiyang | 0.122 | Nanning | 0.123 | Xiamen | 0.136 | ||
| 2018 | Guiyang | 0.125 | Nanning | 0.125 | Xiamen | 0.137 | ||
| 2019 | Guiyang | 0.127 | Nanning | 0.134 | Xiamen | 0.138 | ||
| 2020 | Guiyang | 0.132 | Nanning | 0.131 | Xiamen | 0.138 |
Appendix E
| Year | City | CCC | City | CCC | City | CCC | City | CCC |
|---|---|---|---|---|---|---|---|---|
| 2011 | Dalian | 0.198 | Hangzhou | 0.273 | Qingdao | 0.229 | Xi’an | 0.268 |
| 2012 | Dalian | 0.213 | Hangzhou | 0.287 | Qingdao | 0.247 | Xi’an | 0.283 |
| 2013 | Dalian | 0.229 | Hangzhou | 0.302 | Qingdao | 0.260 | Xi’an | 0.296 |
| 2014 | Dalian | 0.191 | Hangzhou | 0.317 | Qingdao | 0.278 | Xi’an | 0.308 |
| 2015 | Dalian | 0.236 | Hangzhou | 0.334 | Qingdao | 0.293 | Xi’an | 0.318 |
| 2016 | Dalian | 0.246 | Hangzhou | 0.362 | Qingdao | 0.312 | Xi’an | 0.334 |
| 2017 | Dalian | 0.280 | Hangzhou | 0.391 | Qingdao | 0.317 | Xi’an | 0.359 |
| 2018 | Dalian | 0.289 | Hangzhou | 0.408 | Qingdao | 0.335 | Xi’an | 0.366 |
| 2019 | Dalian | 0.292 | Hangzhou | 0.434 | Qingdao | 0.353 | Xi’an | 0.379 |
| 2020 | Dalian | 0.301 | Hangzhou | 0.441 | Qingdao | 0.366 | Xi’an | 0.427 |
| 2011 | Beijing | 0.557 | Harbin | 0.166 | Shanghai | 0.467 | Xining | 0.161 |
| 2012 | Beijing | 0.601 | Harbin | 0.187 | Shanghai | 0.483 | Xining | 0.170 |
| 2013 | Beijing | 0.630 | Harbin | 0.200 | Shanghai | 0.531 | Xining | 0.172 |
| 2014 | Beijing | 0.660 | Harbin | 0.207 | Shanghai | 0.554 | Xining | 0.180 |
| 2015 | Beijing | 0.699 | Harbin | 0.232 | Shanghai | 0.568 | Xining | 0.183 |
| 2016 | Beijing | 0.721 | Harbin | 0.249 | Shanghai | 0.603 | Xining | 0.188 |
| 2017 | Beijing | 0.732 | Harbin | 0.261 | Shanghai | 0.628 | Xining | 0.201 |
| 2018 | Beijing | 0.789 | Harbin | 0.299 | Shanghai | 0.661 | Xining | 0.222 |
| 2019 | Beijing | 0.834 | Harbin | 0.319 | Shanghai | 0.649 | Xining | 0.236 |
| 2020 | Beijing | 0.860 | Harbin | 0.301 | Shanghai | 0.713 | Xining | 0.236 |
| 2011 | Changchun | 0.178 | Hohhot | 0.228 | Shenyang | 0.245 | Yinchuan | 0.195 |
| 2012 | Changchun | 0.190 | Hohhot | 0.238 | Shenyang | 0.260 | Yinchuan | 0.198 |
| 2013 | Changchun | 0.196 | Hohhot | 0.247 | Shenyang | 0.265 | Yinchuan | 0.205 |
| 2014 | Changchun | 0.201 | Hohhot | 0.256 | Shenyang | 0.272 | Yinchuan | 0.222 |
| 2015 | Changchun | 0.214 | Hohhot | 0.264 | Shenyang | 0.271 | Yinchuan | 0.234 |
| 2016 | Changchun | 0.228 | Hohhot | 0.270 | Shenyang | 0.279 | Yinchuan | 0.239 |
| 2017 | Changchun | 0.233 | Hohhot | 0.270 | Shenyang | 0.287 | Yinchuan | 0.248 |
| 2018 | Changchun | 0.252 | Hohhot | 0.276 | Shenyang | 0.293 | Yinchuan | 0.257 |
| 2019 | Changchun | 0.272 | Hohhot | 0.278 | Shenyang | 0.305 | Yinchuan | 0.270 |
| 2020 | Changchun | 0.287 | Hohhot | 0.291 | Shenyang | 0.310 | Yinchuan | 0.279 |
| 2011 | Changsha | 0.259 | Jinan | 0.255 | Shenzhen | 0.339 | Zhengzhou | 0.215 |
| 2012 | Changsha | 0.268 | Jinan | 0.264 | Shenzhen | 0.360 | Zhengzhou | 0.220 |
| 2013 | Changsha | 0.275 | Jinan | 0.281 | Shenzhen | 0.386 | Zhengzhou | 0.230 |
| 2014 | Changsha | 0.286 | Jinan | 0.288 | Shenzhen | 0.398 | Zhengzhou | 0.252 |
| 2015 | Changsha | 0.304 | Jinan | 0.302 | Shenzhen | 0.423 | Zhengzhou | 0.252 |
| 2016 | Changsha | 0.318 | Jinan | 0.317 | Shenzhen | 0.459 | Zhengzhou | 0.274 |
| 2017 | Changsha | 0.328 | Jinan | 0.324 | Shenzhen | 0.475 | Zhengzhou | 0.303 |
| 2018 | Changsha | 0.341 | Jinan | 0.333 | Shenzhen | 0.500 | Zhengzhou | 0.316 |
| 2019 | Changsha | 0.358 | Jinan | 0.356 | Shenzhen | 0.548 | Zhengzhou | 0.346 |
| 2020 | Changsha | 0.382 | Jinan | 0.376 | Shenzhen | 0.579 | Zhengzhou | 0.367 |
| 2011 | Chengdu | 0.274 | Kunming | 0.237 | Taiyuan | 0.213 | ||
| 2012 | Chengdu | 0.297 | Kunming | 0.242 | Taiyuan | 0.219 | ||
| 2013 | Chengdu | 0.318 | Kunming | 0.254 | Taiyuan | 0.227 | ||
| 2014 | Chengdu | 0.329 | Kunming | 0.265 | Taiyuan | 0.243 | ||
| 2015 | Chengdu | 0.328 | Kunming | 0.270 | Taiyuan | 0.251 | ||
| 2016 | Chengdu | 0.365 | Kunming | 0.277 | Taiyuan | 0.259 | ||
| 2017 | Chengdu | 0.372 | Kunming | 0.283 | Taiyuan | 0.262 | ||
| 2018 | Chengdu | 0.385 | Kunming | 0.287 | Taiyuan | 0.273 | ||
| 2019 | Chengdu | 0.429 | Kunming | 0.316 | Taiyuan | 0.277 | ||
| 2020 | Chengdu | 0.447 | Kunming | 0.329 | Taiyuan | 0.284 | ||
| 2011 | Chongqing | 0.263 | Lanzhou | 0.164 | Tianjin | 0.300 | ||
| 2012 | Chongqing | 0.310 | Lanzhou | 0.169 | Tianjin | 0.324 | ||
| 2013 | Chongqing | 0.329 | Lanzhou | 0.178 | Tianjin | 0.337 | ||
| 2014 | Chongqing | 0.327 | Lanzhou | 0.197 | Tianjin | 0.351 | ||
| 2015 | Chongqing | 0.356 | Lanzhou | 0.215 | Tianjin | 0.381 | ||
| 2016 | Chongqing | 0.396 | Lanzhou | 0.235 | Tianjin | 0.404 | ||
| 2017 | Chongqing | 0.425 | Lanzhou | 0.241 | Tianjin | 0.402 | ||
| 2018 | Chongqing | 0.419 | Lanzhou | 0.259 | Tianjin | 0.423 | ||
| 2019 | Chongqing | 0.439 | Lanzhou | 0.260 | Tianjin | 0.438 | ||
| 2020 | Chongqing | 0.494 | Lanzhou | 0.272 | Tianjin | 0.452 | ||
| 2011 | Fuzhou | 0.233 | Nanchang | 0.195 | Urumqi | 0.193 | ||
| 2012 | Fuzhou | 0.245 | Nanchang | 0.212 | Urumqi | 0.208 | ||
| 2013 | Fuzhou | 0.258 | Nanchang | 0.219 | Urumqi | 0.199 | ||
| 2014 | Fuzhou | 0.267 | Nanchang | 0.227 | Urumqi | 0.216 | ||
| 2015 | Fuzhou | 0.282 | Nanchang | 0.233 | Urumqi | 0.228 | ||
| 2016 | Fuzhou | 0.295 | Nanchang | 0.240 | Urumqi | 0.240 | ||
| 2017 | Fuzhou | 0.302 | Nanchang | 0.253 | Urumqi | 0.249 | ||
| 2018 | Fuzhou | 0.321 | Nanchang | 0.265 | Urumqi | 0.261 | ||
| 2019 | Fuzhou | 0.331 | Nanchang | 0.275 | Urumqi | 0.284 | ||
| 2020 | Fuzhou | 0.356 | Nanchang | 0.289 | Urumqi | 0.291 | ||
| 2011 | Guangzhou | 0.351 | Nanjing | 0.282 | Wuhan | 0.280 | ||
| 2012 | Guangzhou | 0.373 | Nanjing | 0.303 | Wuhan | 0.300 | ||
| 2013 | Guangzhou | 0.414 | Nanjing | 0.314 | Wuhan | 0.314 | ||
| 2014 | Guangzhou | 0.431 | Nanjing | 0.333 | Wuhan | 0.328 | ||
| 2015 | Guangzhou | 0.477 | Nanjing | 0.350 | Wuhan | 0.337 | ||
| 2016 | Guangzhou | 0.500 | Nanjing | 0.367 | Wuhan | 0.354 | ||
| 2017 | Guangzhou | 0.526 | Nanjing | 0.380 | Wuhan | 0.364 | ||
| 2018 | Guangzhou | 0.568 | Nanjing | 0.406 | Wuhan | 0.384 | ||
| 2019 | Guangzhou | 0.599 | Nanjing | 0.435 | Wuhan | 0.410 | ||
| 2020 | Guangzhou | 0.618 | Nanjing | 0.458 | Wuhan | 0.431 | ||
| 2011 | Guiyang | 0.192 | Nanning | 0.195 | Xiamen | 0.201 | ||
| 2012 | Guiyang | 0.201 | Nanning | 0.212 | Xiamen | 0.213 | ||
| 2013 | Guiyang | 0.219 | Nanning | 0.211 | Xiamen | 0.221 | ||
| 2014 | Guiyang | 0.231 | Nanning | 0.217 | Xiamen | 0.233 | ||
| 2015 | Guiyang | 0.238 | Nanning | 0.224 | Xiamen | 0.241 | ||
| 2016 | Guiyang | 0.243 | Nanning | 0.224 | Xiamen | 0.251 | ||
| 2017 | Guiyang | 0.250 | Nanning | 0.237 | Xiamen | 0.263 | ||
| 2018 | Guiyang | 0.262 | Nanning | 0.277 | Xiamen | 0.282 | ||
| 2019 | Guiyang | 0.269 | Nanning | 0.293 | Xiamen | 0.295 | ||
| 2020 | Guiyang | 0.286 | Nanning | 0.298 | Xiamen | 0.308 |
Appendix F
| Abbreviations | Corresponding Full Forms | Abbreviations | Corresponding Full Forms |
|---|---|---|---|
| CCC | Comprehensive carrying capacity | APLB | Attrition of public library books |
| IRCC | Innovative resource carrying capacity | NAPL | Number of newly acquired public library books |
| ECC | Economic carrying capacity | NHPH | Number of healthcare personnel in hospitals and health centers |
| PSCC | Public service carrying capacity | HE | Health expenditure |
| NRCC | Natural resource carrying capacity | FE | Fiscal expenditure |
| GDP | GDP | EPBE | Education public budget expenditure |
| TP | Total population | PBSD | Public budget expenditures for science and technology |
| BR | Birth rate | BUA | Built-up area |
| MR | Mortality rate | HTHW | Harmless treatment rate of household waste |
| PSIG | The proportion of the added value of the secondary industry in GDP | CTST | Centralized treatment rate of sewage treatment plants |
| PTIG | The proportion of the added value of the tertiary industry in GDP | SDES | Per-unit-value sulfur dioxide emissions in secondary industry |
| DIUR | Disposable income of urban residents | ESDS | Per-unit-value smoke and dust emissions in secondary industry |
| CHRE | Completed housing area of real estate development enterprises | NFTH | College teachers |
| TP | Total profit | EST | Employment in scientific research and technology services |
| SDB | Savings deposit balance | EISI | Employment in information transmission, software, and information technology services |
| TSWR | Total sales of wholesale and retail goods above quota | NRDP | Number of R&D personnel |
| ASIE | Average salary of urban on-the-job employees | NVIP | The number of valid invention patents |
| RAP | Road area proportion | RSNP | Revenue from the sales of new products |
| IPGS | Increment of park green space area | MBI | Main business income |
References
- Gupta, V.; Santosh, K.C.; Arora, R.; Ciano, T.; Kalid, K.S.; Mohan, S. Socioeconomic impact due to COVID-19: An empirical assessment. Inf. Process. Manag. 2022, 59, 1028. [Google Scholar] [CrossRef] [PubMed]
- Chaaben, N.; Elleuch, Z.; Hamdi, B.; Kahouli, B. Green economy performance and sustainable development achievement: Empirical evidence from Saudi Arabia. Environ. Dev. Sustain. 2024, 26, 549–564. [Google Scholar] [CrossRef] [PubMed]
- The World Bank. Urban Population. 2022. Available online: https://data.worldbank.org/indicator/SP.URB.TOTL.IN.ZS (accessed on 15 July 2024).
- Rosenthal, S.S.; Strange, W.C. How close is close? The spatial reach of agglomeration economies. J. Econ. Perspect. 2020, 34, 27–49. [Google Scholar] [CrossRef]
- Fang, C.; Yu, D.; Fang, C.; Yu, D. Overview of the fundamental connotation and strategic position of China’s urban agglomerations. China’s Urban Agglom. 2020, 1–63. [Google Scholar] [CrossRef]
- Shen, L.; Cheng, G.; Du, X.; Meng, C.; Ren, Y.; Wang, J. Can urban agglomeration bring “1+ 1> 2 Effect”? A perspective of land resource carrying capacity. Land Use Policy 2022, 117, 106094. [Google Scholar] [CrossRef]
- Bonsu, N.O.; TyreeHageman, J.; Kele, J. Beyond agenda 2030: Future-oriented mechanisms in localising the sustainable development goals (SDGs). Sustainability 2020, 12, 9797. [Google Scholar] [CrossRef]
- Lengyel, J.; Roux, S.; Alvanides, S. Multivariate analysis of socioeconomic profiles in the Ruhr area, Germany. J. Maps 2022, 18, 576–584. [Google Scholar] [CrossRef]
- Shao, M.; Tang, X.; Zhang, Y.; Li, W. City clusters in China: Air and surface water pollution. Front. Ecol. Environ. 2006, 4, 353–361. [Google Scholar] [CrossRef]
- Lu, J.; Li, B.; Li, H.; Al-Barakani, A. Expansion of city scale, traffic modes, traffic congestion, and air pollution. Cities 2020, 108, 102974. [Google Scholar] [CrossRef]
- Wu, L.; Li, N.; Yang, Y. Prediction of air quality indicators for the Beijing-Tianjin-Hebei region. J. Clean. Prod. 2018, 196, 682–687. [Google Scholar] [CrossRef]
- Zheng, L. Job creation or job relocation? Identifying the impact of China’s special economic zones on local employment and industrial agglomeration. China Econ. Rev. 2021, 69, 101651. [Google Scholar] [CrossRef]
- Kong, Q.; Kong, H.; Miao, S.; Zhang, Q.; Shi, J. Spatial coupling coordination evaluation between population growth, land use and housing supply of urban agglomeration in China. Land 2022, 11, 1396. [Google Scholar] [CrossRef]
- Yang, Y.; Zhang, Y.; Yang, H.; Yang, F. Horizontal ecological compensation as a tool for sustainable development of urban agglomerations: Exploration of the realization mechanism of Guanzhong Plain urban agglomeration in China. Environ. Sci. Policy 2022, 137, 301–313. [Google Scholar] [CrossRef]
- Giachetti, C.; Marchi, G. Successive changes in leadership in the worldwide mobile phone industry: The role of windows of opportunity and firms’ competitive action. Res. Policy 2017, 46, 352–364. [Google Scholar] [CrossRef]
- Cheshmehzangi, A.; Li, H.M.A. Innovation through urban diversity and achieving comprehensive sustainable urbanism from a community-oriented approach. Curr. Urban Stud. 2020, 8, 222. [Google Scholar] [CrossRef]
- Fan, P.; Urs, N.; Hamlin, R.E. Rising innovative city-regions in a transitional economy: A case study of ICT industry in cluj-napoca, romania. Technol. Soc. 2019, 58, 101139. [Google Scholar] [CrossRef]
- Romer, P.M. Increasing returns and long-run growth. J. Political Econ. 1986, 94, 1002–1037. [Google Scholar] [CrossRef]
- Herstad, S.J.; Ebersberger, B. Urban agglomerations, knowledge-intensive services and innovation: Establishing the core connections. Entrep. Reg. Dev. 2014, 26, 211–233. [Google Scholar] [CrossRef]
- Ning, L.; Wang, F.; Li, J. Urban innovation, regional externalities of foreign direct investment and industrial agglomeration: Evidence from Chinese cities. Res. Policy 2016, 45, 830–843. [Google Scholar] [CrossRef]
- Liu, Y.; Zhang, X.; Pan, X.; Ma, X.; Tang, M. The spatial integration and coordinated industrial development of urban agglomerations in the Yangtze River Economic Belt, China. Cities 2020, 104, 102801. [Google Scholar] [CrossRef]
- Tang, J.; Cui, W. Does urban agglomeration affect innovation convergence: Evidence from China. Econ. Innov. New Technol. 2023, 32, 563–578. [Google Scholar] [CrossRef]
- Yu, H.; Ke, H.; Ye, Y.; Fan, F. Agglomeration and flow of innovation elements and the impact on regional innovation efficiency. Int. J. Technol. Manag. 2023, 92, 229–254. [Google Scholar] [CrossRef]
- Leopold, A. Wildlife in American culture. J. Wildl. Manag. 1943, 7, 1–6. [Google Scholar] [CrossRef]
- Seidl, I.; Tisdell, C.A. Carrying capacity reconsidered: From Malthus’ population theory to cultural carrying capacity. Ecol. Econ. 1999, 31, 395–408. [Google Scholar] [CrossRef]
- Liu, J.; Dong, S.; Mao, Q. Comprehensive evaluation of the water resource carrying capacity for China. Geogr. Nat. Resour. 2012, 33, 92–99. [Google Scholar] [CrossRef]
- Zhao, Y.; Wang, Y.; Wang, Y. Comprehensive evaluation and influencing factors of urban agglomeration water resources carrying capacity. J. Clean. Prod. 2021, 288, 125097. [Google Scholar] [CrossRef]
- Kong, Q. Analysis of Traffic Carrying Capacity of Rail Transit TOD: A Case Study of Chongqing Bishan TOD Project. Acad. J. Sci. Technol. 2022, 3, 1–4. [Google Scholar] [CrossRef]
- Arrow, K.; Bolin, B.; Costanza, R.; Dasgupta, P.; Folke, C.; Holling, C.S.; Pimentel, D. Economic growth, carrying capacity, and the environment. Ecol. Econ. 1995, 15, 91–95. [Google Scholar] [CrossRef]
- Peng, T.; Deng, H. Comprehensive evaluation for sustainable development based on relative resource carrying capacity—A case study of Guiyang, Southwest China. Environ. Sci. Pollut. Res. 2020, 27, 20090–20103. [Google Scholar] [CrossRef]
- Su, Y.; Xue, H.; Liang, H. An evaluation model for urban comprehensive carrying capacity: An empirical case from Harbin city. Int. J. Environ. Res. Public Health 2019, 16, 367. [Google Scholar] [CrossRef]
- Bao, C.; Wang, H.; Sun, S. Comprehensive simulation of resources and environment carrying capacity for urban agglomeration: A system dynamics approach. Ecol. Indic. 2022, 138, 108874. [Google Scholar] [CrossRef]
- Tan, F.; Wang, F.; Niu, Z. Multiscale disparity and spatial pattern of comprehensive carrying capacity in the Yangtze River Economic Belt, China. Ecol. Indic. 2023, 148, 110119. [Google Scholar] [CrossRef]
- Zameer, H.; Yasmeen, H.; Zafar, M.W.; Waheed, A.; Sinha, A. Analyzing the association between innovation, economic growth, and environment: Divulging the importance of FDI and trade openness in India. Environ. Sci. Pollut. Res. 2020, 27, 29539–29553. [Google Scholar] [CrossRef] [PubMed]
- Shen, F.; Liu, B.; Luo, F.; Wu, C.; Chen, H.; Wei, W. The effect of economic growth target constraints on green technology innovation. J. Environ. Manag. 2021, 292, 112765. [Google Scholar] [CrossRef] [PubMed]
- Sun, H.; Edziah, B.K.; Kporsu, A.K.; Sarkodie, S.A.; Taghizadeh-Hesary, F. Energy efficiency: The role of technological innovation and knowledge spillover. Technol. Forecast. Soc. Change 2021, 167, 120659. [Google Scholar] [CrossRef]
- Downing, P.B.; White, L.J. Innovation in pollution control. J. Environ. Econ. Manag. 1986, 13, 18–29. [Google Scholar] [CrossRef]
- Goyal, N.; Howlett, M. Technology and instrument constituencies as agents of innovation: Sustainability transitions and the governance of urban transport. Energies 2018, 11, 1198. [Google Scholar] [CrossRef]
- Chien, F.; Pantamee, A.A.; Hussain, M.S.; Chupradit, S.; Nawaz, M.A.; Mohsin, M. Nexus between financial innovation and bankruptcy: Evidence from information, communication and technology (ict) sector. Singap. Econ. Rev. 2021, 1–22. [Google Scholar] [CrossRef]
- Tang, C.; Xu, Y.; Hao, Y.; Wu, H.; Xue, Y. What is the role of telecommunications infrastructure construction in green technology innovation? A firm-level analysis for China. Energy Econ. 2021, 103, 105576. [Google Scholar] [CrossRef]
- Li, X.; Hui, E.C.M.; Lang, W.; Zheng, S.; Qin, X. Transition from factor-driven to innovation-driven urbanization in China: A study of manufacturing industry automation in Dongguan City. China Econ. Rev. 2020, 59, 101382. [Google Scholar] [CrossRef]
- Muhamad, G.M.; Heshmati, A.; Khayyat, N.T. How to reduce the degree of dependency on natural resources? Resour. Policy 2021, 72, 102047. [Google Scholar] [CrossRef]
- Sun, T.Q.; Medaglia, R. Mapping the challenges of Artificial Intelligence in the public sector: Evidence from public healthcare. Gov. Inf. Q. 2019, 36, 368–383. [Google Scholar] [CrossRef]
- Jahanger, A.; Usman, M.; Murshed, M.; Mahmood, H.; Balsalobre-Lorente, D. The linkages between natural resources, human capital, globalization, economic growth, financial development, and ecological footprint: The moderating role of technological innovations. Resour. Policy 2022, 76, 102569. [Google Scholar] [CrossRef]
- Löfsten, H.; Klofsten, M.; Cadorin, E. Science Parks and talent attraction management: University students as a strategic resource for innovation and entrepreneurship. Eur. Plan. Stud. 2020, 28, 2465–2488. [Google Scholar] [CrossRef]
- Forrester, J.W. Industrial dynamics: A major breakthrough for decision makers. Harv. Bus. Rev. 1958, 36, 37–66. [Google Scholar] [CrossRef]
- Bala, B.K.; Arshad, F.M.; Noh, K.M. System dynamics. Model. Simul. 2017, 274. [Google Scholar] [CrossRef]
- Guo, R.; Sun, Y.; Fan, J. Policies on Categorized Governance of China’s Urban Agglomerations in 14th Five-Year Plan. Bull. Chin. Acad. Sci. Chin. Version 2020, 35, 844–854. [Google Scholar] [CrossRef]
- Velasco-Muñoz, J.F.; Mendoza, J.M.F.; Aznar-Sánchez, J.A.; Gallego-Schmid, A. Circular economy implementation in the agricultural sector: Definition, strategies and indicators. Resour. Conserv. Recycl. 2021, 170, 105618. [Google Scholar] [CrossRef]
- Schumpeter, J.A. The theory of economic development, translated by Redvers Opie. Harv. Econ. Stud. 1934, 46, 0404. [Google Scholar]
- Ou, M.; Lai, X.; Gong, J. Territorial pattern evolution and its comprehensive carrying capacity evaluation in the coastal area of Beibu Gulf, China. Int. J. Environ. Res. Public Health 2022, 19, 10469. [Google Scholar] [CrossRef]
- Wu, M.; Wu, J.; Zang, C. A comprehensive evaluation of the eco-carrying capacity and green economy in the Guangdong-Hong Kong-Macao Greater Bay Area, China. J. Clean. Prod. 2021, 281, 124945. [Google Scholar] [CrossRef]
- Liu, J.; Tian, Y.; Huang, K.; Yi, T. Spatial-temporal differentiation of the coupling coordinated development of regional energy-economy-ecology system: A case study of the Yangtze River Economic Belt. Ecol. Indic. 2021, 124, 107394. [Google Scholar] [CrossRef]
- Sok, P.; O‘Cass, A. Achieving superior innovation-based performance outcomes in SMEs through innovation resource-capability complementarity. Ind. Mark. Manag. 2011, 40, 1285–1293. [Google Scholar] [CrossRef]
- Chen, T.; Yu, J.T. How the innovation resources developed when a city became an innovative city. Appl. Mech. Mater. 2013, 295, 2500–2504. [Google Scholar] [CrossRef]
- Papageorgiou, K.; Brotherton, I. A management planning framework based on ecological, perceptual and economic carrying capacity: The case study of Vikos-Aoos National Park. Greece 1999, 271–284. [Google Scholar] [CrossRef]
- Tian, Y.; Sun, C. Comprehensive carrying capacity, economic growth and the sustainable development of urban areas: A case study of the Yangtze River Economic Belt. J. Clean. Prod. 2018, 195, 486–496. [Google Scholar] [CrossRef]
- Liao, S.; Du, X.; Shen, L.; Lv, M. Evaluation method for urban public service carrying capacity (UPSCC): A qualitative–quantitative bi-dimensional perspective. Int. J. Environ. Res. Public Health 2021, 18, 12539. [Google Scholar] [CrossRef] [PubMed]
- Yang, N.; Liao, X.; Meng, C. A load-carrier perspective method for investigating urban public service carrying capacity. Singap. Springer Singap. 2019, 365–380. [Google Scholar] [CrossRef]
- Zhang, Z.; Hu, B.; Qiu, H. Comprehensive evaluation of resource and environmental carrying capacity based on SDGs perspective and Three-dimensional Balance Model. Ecol. Indic. 2022, 138, 108788. [Google Scholar] [CrossRef]
- Wang, J.; Zhang, F.; Tan, M.L.; Shi, J.; Johnoson, V.C.; Kung, H.T. Remote sensing evaluation of Chinese mainland’s comprehensive natural resources carrying capacity and its spatial-temporal variation characteristics. Environ. Impact Assess. Rev. 2023, 101, 107104. [Google Scholar] [CrossRef]
- Konar, M.; Todd, M.J.; Muneepeerakul, R.; Rinaldo, A.; Rodriguez-Iturbe, I. Hydrology as a driver of biodiversity: Controls on carrying capacity, niche formation, and dispersal. Adv. Water Resour. 2013, 51, 317–325. [Google Scholar] [CrossRef]
- Yu, C.; Li, Z.; Yang, Z.; Chen, X.; Su, M. A feedforward neural network based on normalization and error correction for predicting water resources carrying capacity of a city. Ecol. Indic. 2020, 118, 106724. [Google Scholar] [CrossRef]
- Liu, G.; Xu, Y.; Ge, W.; Yang, X.; Su, X.; Shen, B.; Ran, Q. How can marine fishery enable low carbon development in China? Based on system dynamics simulation analysis. Ocean Coast. Manag. 2023, 231, 106382. [Google Scholar] [CrossRef]
- Roozkhosh, P.; Pooya, A.; Agarwal, R. Blockchain acceptance rate prediction in the resilient supply chain with hybrid system dynamics and machine learning approach. Oper. Manag. Res. 2023, 16, 705–725. [Google Scholar] [CrossRef]
- Wang, Y.; Song, C.; Cheng, C.; Wang, H.; Wang, X.; Gao, P. Modelling and evaluating the economy-resource-ecological environment system of a third-polar city using system dynamics and ranked weights-based coupling coordination degree model. Cities 2023, 133, 104151. [Google Scholar] [CrossRef]
- Jiang, C. Analysis of Factors Influencing Profit Growth in State-Owned Industrial Enterprises: A Comparative Study with Private and Joint-Venture Enterprises; Soochow University of China: Suzhou, China, 2012. [Google Scholar]
- Wang, Z. Scale, Density, and Area Ratio: Insights from China’s Urban Road Planning and Construction Indicators. In Proceedings of the 9th Urban Development and Planning Conference—S04 Green Transportation, Public Transport Priority, and Integrated Transportation System. Organized by China Urban Sciences Research Association and Tianjin Binhai New Area People’s Government; Research Center for Sustainable Transportation: Yuheng, China, 2014. (In Chinese) [Google Scholar]
- Du, Y.; Liu, K. A Review of the Concepts, Research, and Methods of Chinese Park Green Space Planning Based on the Spatial Attributes of Community Life Circles. Gardens 2022, 39, 93–98. (In Chinese) [Google Scholar]
- Alhemdi, A.; Gu, M. Method to account for natural fracture induced elastic anisotropy in geomechanical characterization of shale gas reservoirs. J. Nat. Gas Sci. Eng. 2022, 101, 104478. [Google Scholar] [CrossRef]


| Criterion Layer | Criteria Weights | Indicator Layer | Indicator Weight | Basis for Selection |
|---|---|---|---|---|
| Innovative resource carrying capacity (IRCC) | 0.2464 | Number of ordinary higher education institutions and research institutes | 0.0493 | Research on innovative resources from the perspective of enterprises [54] and city [55] |
| College teachers | 0.0376 | |||
| Employment in scientific research and technology services | 0.0320 | |||
| Employment in information transmission, software, and information technology services | 0.0312 | |||
| R&D employment numbers | 0.0381 | |||
| Internal R&D expenditure | 0.0306 | |||
| Patent application authorization volume | 0.0276 | |||
| Economic carrying capacity (ECC) | 0.3482 | Per capita GDP | 0.0331 | Indicators of ECC and the impact of economic development on CCC [56,57] |
| Proportion of the added value of the secondary industry in GDP | 0.0383 | |||
| Proportion of the added value of the tertiary industry in GDP | 0.0365 | |||
| Proportion of employment in the tertiary industry | 0.0314 | |||
| Disposable income of urban residents | 0.0397 | |||
| Completed housing area of real estate development enterprises | 0.036 | |||
| Total profit | 0.0348 | |||
| Savings deposit balance | 0.0381 | |||
| Total sales of wholesale and retail goods above quota | 0.0277 | |||
| Average salary of urban on-the-job employees | 0.0326 | |||
| Public service carrying capacity (PSCC) | 0.2398 | Road area | 0.0416 | Evaluation method for urban PSCC [58,59] |
| Park green space- area | 0.049 | |||
| Total collection of books in public libraries | 0.0448 | |||
| Number of healthcare personnel in hospitals and health centers | 0.0304 | |||
| Education public budget expenditure | 0.0402 | |||
| Public budget expenditures for science and technology | 0.0338 | |||
| Natural resource carrying capacity (NRCC) | 0.1769 | Built-up area | 0.0456 | Comprehensive evaluation of resource and environmental carrying capacity [60,61] |
| Harmless treatment rate of household waste | 0.0409 | |||
| Centralized treatment rate of sewage treatment plants | 0.0267 | |||
| Industrial sulfur dioxide emissions | 0.0294 | |||
| Industrial smoke and dust emissions | 0.0343 |
| Category | Variables |
|---|---|
| Patent applications authorized Loop 1 | Patent application authorization volume → number of valid invention patents → IRCC → CCC |
| Education public budget expenditure Loop 1 | Education public budget expenditure → university construction → college teachers → scientific research talents → IRCC → CCC |
| Education public budget expenditure Loop 2 | Education public budget expenditure → digital talents → IRCC → CCC |
| Education public budget expenditure Loop 3 | Education public budget expenditure → R&D employment numbers → IRCC → CCC |
| Education public budget expenditure Loop 4 | Education public budget expenditure → scientific research talents → IRCC → CCC |
| Education public budget expenditure Loop 5 | Education public budget expenditure → PSCC → CCC |
| Public budget expenditure for science and technology Loop 1 | Public budget expenditure for science and technology→ digital talents → IRCC → CCC |
| Public budget expenditure for science and technology Loop 2 | Public budget expenditure for science and technology→ PSCC → CCC |
| Internal R&D expenditure Loop 1 | Internal R&D expenditure → R&D employment numbers → IRCC → CCC |
| Internal R&D expenditure Loop 2 | Internal R&D expenditure → scientific research talents → IRCC → CCC |
| Internal R&D expenditure Loop 3 | Internal R&D expenditure → digital talents → IRCC → CCC |
| Variable | Abbreviations | Unit | Equation | Basis |
|---|---|---|---|---|
| GDP | GDP | 108 yuan | Ramp function | 14th Five-Year Plan |
| Total population | TP | 104 person | General equation | |
| Birth rate | BR | ‰ | Select the function with the highest goodness of fit by region | |
| Mortality rate | MR | ‰ | Regional average | The level within the region is relatively stable. |
| The proportion of added value of the secondary industry in GDP | PSIG | % | Select the function with the highest goodness of fit by region | |
| The proportion of added value of the tertiary industry in GDP | PTIG | % | Select the function with the highest goodness of fit by region | |
| Disposable income of urban residents | DIUR | yuan | The results of linear regression based on historical data | |
| Completed housing area of real estate development enterprises | CHRE | 104 m2 | After 2020, a 5% decrease annually | The positioning of “housing is for living in, not for speculation” in the 14th Five−Year Plan and the current situation for China’s population |
| Total profit | TP | 108 yuan | Linear regression, with independent variables referencing existing literature (Jiang, 2012) [67] | |
| Savings deposit balance | SDB | 108 yuan | Select the function with the highest goodness of fit by region | |
| Total sales of wholesale and retail goods above quota | TSWR | 108 yuan | The annual growth rate is 8% | 14th Five-Year Plan and historical data |
| Average salary of urban on-the-job employees | ASIE | yuan | The annual growth rate is 8% | 14th Five-Year Plan and historical data |
| Road area proportion | RAP | Cities with a population under 2 million: 0.115; cities with a population over 2 million: 0.175 | Referencing existing literature (Wang, 2014) [68] | |
| Increment of park green space area | IPGS | km2 | Setting multipliers based on regions for population growth | Referencing existing literature (Du and Liu, 2022) [69] |
| Attrition of public library books | APLB | 104 copies | Survey results of multiple libraries | |
| Number of newly acquired public library books | NAPL | 104 copies | Calculating the average value by region | Regional historical data |
| Number of healthcare personnel in hospitals and health centers | NHPH | person | The results of linear regression based on historical data | |
| Health expenditure | HE | 104 yuan | Historical data and IF function by regions | |
| Fiscal expenditure | FE | 104 yuan | Historical data and IF function by regions | |
| Education public budget expenditure | EPBE | 104 yuan | Historical data and IF function by regions | |
| Public budget expenditures for science and technology | PBSD | 104 yuan | The results of linear regression based on historical data | |
| Built-up area | BUA | km2 | The results of linear regression based on historical data | |
| Harmless treatment rate of household waste | HTHW | % | Historical data and IF function by regions | |
| Centralized treatment rate of sewage treatment plants | CTST | % | The results of linear regression based on historical data | |
| Per-unit-value sulfur dioxide emissions in secondary industry | SDES | ton | 0.98 times the value of the previous year | Historical data trend |
| Per-unit-value smoke and dust emissions in secondary industry | ESDS | ton | 0.007 | The fluctuation range of the data is small, so take the average value |
| College teachers | NFTH | person | The results of linear regression based on historical data | |
| Employment in scientific research and technology services | EST | 104 people | The results of linear regression based on historical data | |
| Employment in information transmission, software, and information technology services | EISI | 104 people | The results of linear regression based on historical data | |
| Number of R&D personnel | NRDP | person | The results of linear regression based on historical data | |
| The number of valid invention patents | NVIP | term | The results of linear regression based on historical data | |
| Revenue from the sales of new products | RSNP | 104 yuan | The results of linear regression based on historical data | |
| Main business income | MBI | 104 yuan | The results of linear regression based on historical data |
| Research Contents | Time Frame of the Section | Research Methods | Conclusions |
|---|---|---|---|
| Section 2.3 | References within the most recent years | literature analysis | Innovative resources positively influence economic growth, pollution control, transportation, communication, infrastructure, and enterprise operations |
| Table 3: Main parameters in equations for the CCC system | 2011–2040 | Refer to14th Five-Year Plan, historical data, linear regression, existing literature, the highest goodness function, etc. | There exists a correlation between the parameters of innovative resources and other parameters related to CCC |
| Section 5.2 | 2020 | Statistical methods | IRCC significantly positively influences CCC |
| Section 5.3 | System dynamics | System dynamics methods | Optimizing the allocation of innovative resources is an effective means for China’s urban agglomerations to achieve positive changes in their CCC structure |
Disclaimer/Publisher’s Note: The statements, opinions and data contained in all publications are solely those of the individual author(s) and contributor(s) and not of MDPI and/or the editor(s). MDPI and/or the editor(s) disclaim responsibility for any injury to people or property resulting from any ideas, methods, instructions or products referred to in the content. |
© 2024 by the authors. Licensee MDPI, Basel, Switzerland. This article is an open access article distributed under the terms and conditions of the Creative Commons Attribution (CC BY) license (https://creativecommons.org/licenses/by/4.0/).
Share and Cite
Yan, L.; Ye, W.; Long, H.; Zhang, Q. The Influence of Innovative Resources on the Comprehensive Carrying Capacity of China’s Urban Agglomerations: A System Dynamics Perspective. Sustainability 2024, 16, 6191. https://doi.org/10.3390/su16146191
Yan L, Ye W, Long H, Zhang Q. The Influence of Innovative Resources on the Comprehensive Carrying Capacity of China’s Urban Agglomerations: A System Dynamics Perspective. Sustainability. 2024; 16(14):6191. https://doi.org/10.3390/su16146191
Chicago/Turabian StyleYan, Lifang, Wenzhong Ye, Hui Long, and Qiong Zhang. 2024. "The Influence of Innovative Resources on the Comprehensive Carrying Capacity of China’s Urban Agglomerations: A System Dynamics Perspective" Sustainability 16, no. 14: 6191. https://doi.org/10.3390/su16146191