Article

Optimal Design of Air Treatment for an Adsorption Water-Harvesting System

School of Thermal Engineering, Shandong Jianzhu University, Jinan 250101, China
*
Author to whom correspondence should be addressed.
Sustainability 2024, 16(14), 6193; https://doi.org/10.3390/su16146193
Submission received: 4 June 2024 / Revised: 18 July 2024 / Accepted: 18 July 2024 / Published: 19 July 2024

Abstract

:
In some areas where access to water is difficult, such as arid regions, it is a feasible measure to acquire water from the air. In this context, a system for water harvesting from the air was designed and manufactured. In order to find the optimal operation parameters of the system, the humidity–enthalpy diagram and the dehumidifier computation software (V2.0, Win7) were adopted for the optimization work. The air treatment process of the system was analyzed and calculated by using the professional software provided by the dehumidifier company. Operation modes of ‘powerful mode’ and ‘economic mode’ were defined in the computation work, which are represented by the water production amount and efficiency (water production per power consumption), respectively. According to computation analysis, the relationships between the main performance indicators and the system design/operation parameters were obtained. By considering the heating power limitation of the system, the wheel dehumidifier rotation speed of 8 rph (revolutions per hour), zonal area ratio of Ap/Ar = 2, and the optimal airflow ratios in different relative humidity (RH) environments, together with the outlet air parameter settings of the surface cooler, were finally defined.

1. Introduction

Water is a necessity for all life in the world. With the increase of the population and aggravation of global warming problems, water shortage has become a global challenge, especially in the arid regions. People attempt to acquire freshwater from the natural world [1]. There are mainly three common ways to obtain freshwater, i.e., sea water desalination [2], wastewater purification [3], and atmospheric water harvesting [4]. As is well known, the air contains water. Even in the arid regions, the water content in the air is considerable. Since the air is everywhere, atmospheric water harvesting would be a reliable way for acquiring freshwater [5]. The research on atmospheric water harvesting has been around for a long while, especially in recent years. High-performance atmospheric water harvesters have attracted huge attention for their zero emissions and environmental friendliness [6]. Currently, several methods of atmospheric water harvesting have been developed, such as fog harvesting, dew harvesting, radiative cooling, solar regenerated desiccant, and active cooling condensation [7].
Active cooling condensation is conducted according to the principle of the vapor compressed refrigeration system, i.e., the air is dehumidified, accompanied by an artificial cooling process. For this method, the compressor needs to be electrically driven by power consumption. In some systems, a high-powered electrical heater is also needed. If solar energy is utilized to provide the power for driving the system operation, it would be very economic and sustainable [8]. Even in low-humidity and high-temperature environments, freshwater could be produced in this way. However, this technology is more suitable for high-temperature and high-humidity environments, in which the water production efficiency would be higher [9]. On the basis of the refrigeration system, the addition of a wheel dehumidifier could improve the water production effectively. In addition, some water-harvesting methods are based on the absorption refrigeration cycle, rather than the vapor compressed refrigeration cycle; for example, solar-powered water-harvesting systems [10] and gas-engine-based atmospheric water-harvesting systems [11]. As shown in Figure 1a, the dehumidifier wheel includes a processing area, regeneration area, and cooling area. The processing area is used for dehumidification, i.e., to harvest water from the air. By contacting with the adsorption material, the separation of water from the air is driven by the partial pressure difference of the water vapor [12]. In order to ensure the sustainable operation of the system, the vapor adsorbed by the material must be dissipated so as to restore the absorption capability in the next cycle [13].
Based on their proposed water-harvesting device, Wang et al. [14,15,16] conducted a series of studies on the water production efficiency in different relative humidity (RH) environments, including theoretical analysis, simulation, and experimental work. The analysis results demonstrated the fact that their proposed device can harvest freshwater universally. Kim et al. [17] integrated the radiative cooling strategy in SAWH (solar-assisted water harvesting) so as to be applicable in arid environments under low RH conditions. A passive radiative cooling pattern was also introduced by them to decrease the surrounding temperature by dissipating thermal radiation to the universe. In their other study [18], they proposed a theoretical framework to optimize the energetic performance of the water-harvesting system with different adsorption materials, which could identify the optimal operation parameters of the system.
Since the relevant studies about this topic were abundant in past years, there have been several review papers published in recent years. For example, Entezari [19] and Zhou [20] reviewed the studies about atmospheric water harvesting from the perspectives of materials, components, systems, and applications, respectively. In this study, a water-harvesting system is designed based on the vapor compressed refrigeration cycle, correlating with a wheel dehumidifier. The design and operation parameters of the system are optimized based on a series of computation work.

2. Material and Methods

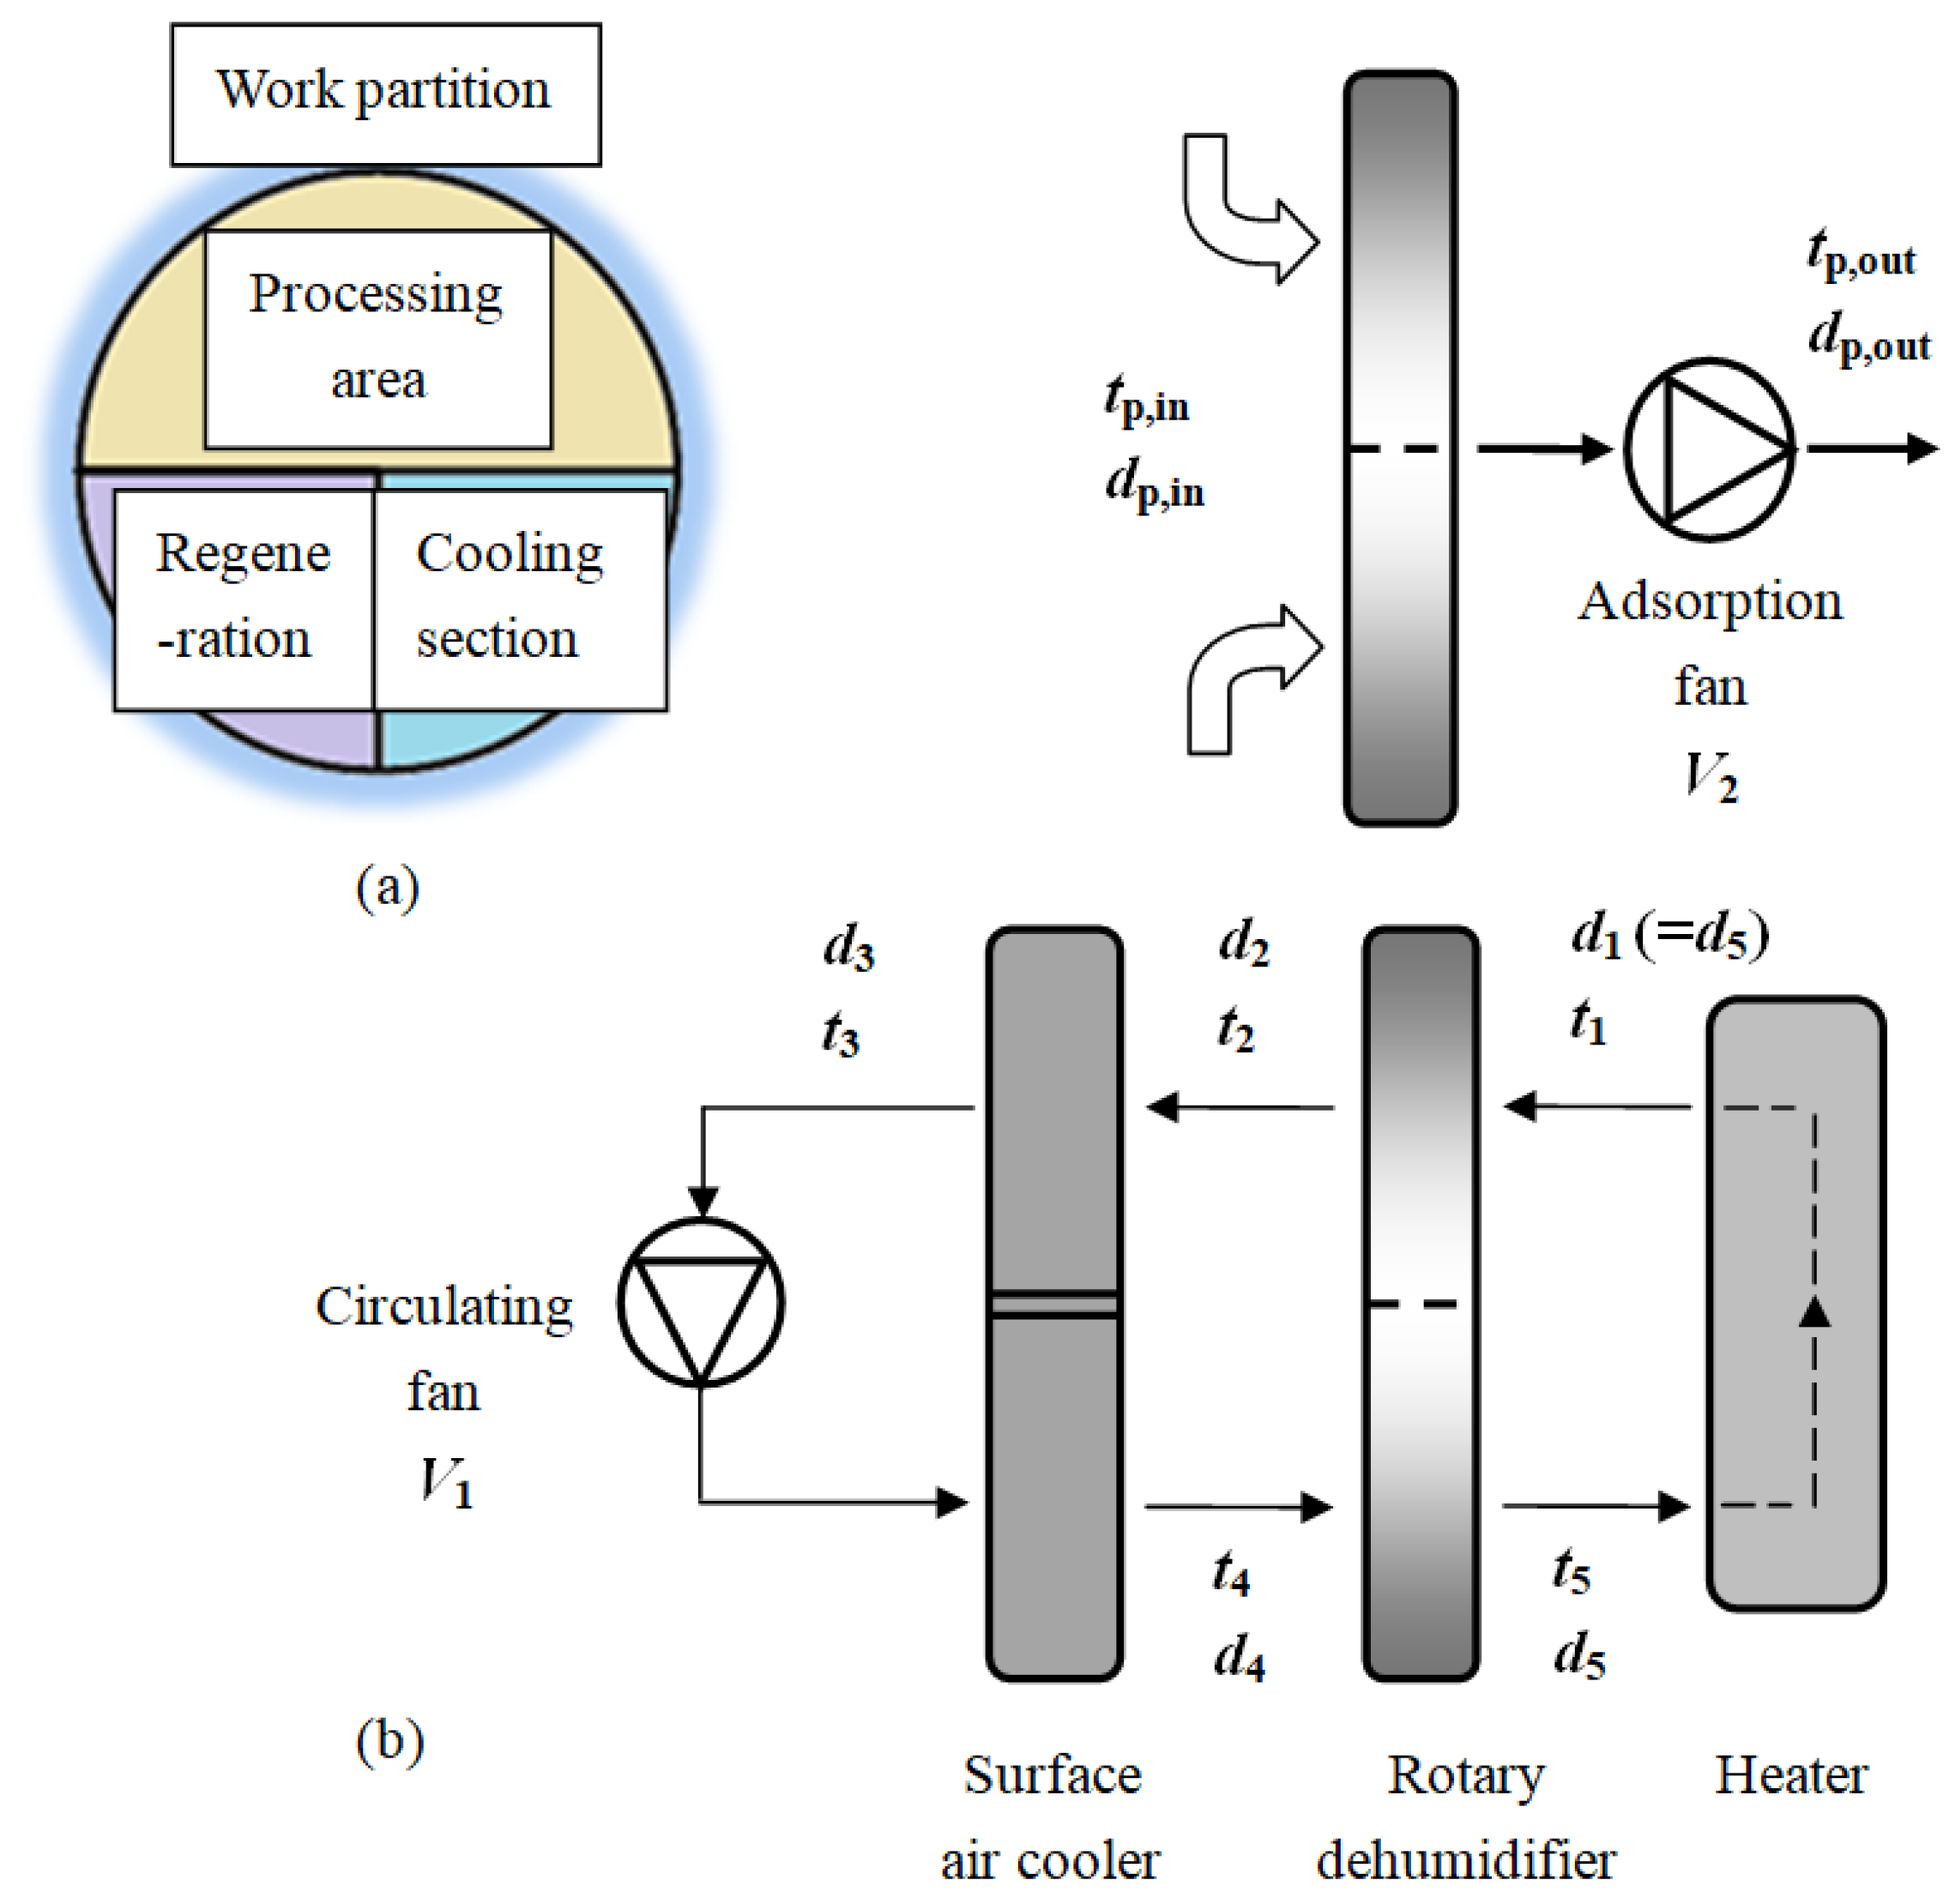
2.1. Working Principle of the System

The working principle of the air treatment and water-harvesting system is shown in Figure 1. The air in the environment (tp,in and dp,in) is firstly pumped through the upper part of the rotary dehumidifier by the fan. The water vapor in the air is adsorbed by the dehumidifier, and the dry air (tp,out and dp,out) is then discharged to the environment. After the water adsorption process, the dehumidifier rotates to the regeneration area. The air with high temperature and low humidity (t1 and d1) that is heated by the heater flows through the regeneration area. The water previously adsorbed by the dehumidifier is heated by the air and evaporates into the circulating airflow, which is defined as the ‘regeneration process’. The regenerated air (t2 and d2) with higher temperature and humidity then flows through the two-stage surface cooler (evaporator) successively (t3 and d3). The vapor in the air is condensed into water during the cooling process (t4 and d4).
The low-temperature and low-humidity air departing from the surface cooler enters the cooling section of the dehumidifier to improve its ability of reabsorbing moisture from the air. The air (t5 and d5) flowing through the cooling section enters the heater zone and then is heated to a certain temperature before entering the regeneration area. At the same time, the dehumidifier rotates at a certain speed so as to ensure each part of the dehumidifier goes through the processes of adsorption, regeneration, and cooling, in turn.
The product of this system is the water removed from the regenerated air by the surface cooler. The maximization of the water amount produced by the system is the most important performance target for this system. The water is derived from the moisture contained in the air that is drawn from the environment by the fans. The moisture content in the air is decided by the temperature and relative humidity of the air. Figure 2 presents an enthalpy–moisture diagram that is commonly used for the depiction of the air-handling process. The horizontal coordinate of the graph is the dry-bulb temperature of the air, and the vertical coordinate is the moisture content of the air, i.e., the amount of water vapor mixed with each kilogram of dry air, i.e., ‘absolute humidity’.
The state of variation of the air in the system can be depicted on the enthalpy–humidity diagram, as shown in Figure 2. In the diagram, the state point of ‘in’ indicates the inlet air state of the dehumidifier, i.e., the state of the ambient air, while the point of ‘out’ is the state of the air after adsorption. In this process, the moisture in the air is absorbed by the dehumidifier and, therefore, its absolute moisture content decreases. Since the adsorption process is accompanied by ‘adsorption heat’ caused by the phase change of water, i.e., latent heat of vaporization, the temperature of the air and the dehumidifier will increase simultaneously. This process is approximated as an ‘iso-enthalpy process’.
State 1 is the exiting air state of the heater. Circulating air with a low moisture content is heated to a higher temperature state and then enters the regeneration area of the dehumidifier. In the regeneration process, the water that was previously adsorbed from the ambient air absorbs the heat from the circulating air and then vaporizes, so the air state after the regeneration process is that of lower temperature and higher moisture content, i.e., state 2. Then, the air enters the ‘surface cooler’ to undergo the ‘refrigeration dehumidifying’ process, during which both the temperature and moisture content of the air are reduced to state 4. During this process, state 3 is the air between the two stages of the surface cooler. Next, the circulating air enters the ‘cooling zone’ of the dehumidifier. Due to the moisture content difference between the air and the dehumidifier, the moisture content of the air exiting the cooling zone (state 5) may increase or decrease, while its temperature definitely increases. This is because the temperature of the regenerated dehumidifier is much higher than the temperature of the air exiting the surface cooler. Finally, the circulating air at state 5 is heated to state 1 by the heater, with no variation in moisture content.

2.2. Overview of the Processing Parameters

According to the analysis of the working process and principles of the water-harvesting system, it was found that the performance of the system was mainly affected by two kinds of parameters.
One was the inlet air parameters at the adsorption side, i.e., the dry-bulb temperature and moisture content of the air (tp,in and dp,in) and its flow rate (V2). The moisture content of the inlet air is the source of the water, meaning that the maximum water production of the system is the complete removal amount of the moisture from the inlet air, in theory. However, the water-harvesting efficiency is limited to various factors, such as the moisture absorption rate of the dehumidifier, the regeneration rate, and the dehumidification rate of the surface cooler. The actual water production of the water-harvesting system is subjected to the performance of the wheel dehumidifier and the cooling dehumidification system.
The second was the system processing parameters, including the rotor speed (rph), the regeneration temperature (t1), the area ratio of the adsorption zone to the regeneration zone (Ap/Ar), and the flow ratio of the inlet air to the circulating air (V2/V1). The duration that each stage of the air stays in the respective working area is determined by the rotary speed of the dehumidifier. A low rotary speed means a long enough regeneration process. However, if the rotary speed is too slow, the dehumidifier would absorb water until it is saturated, with no more potential to absorb water. The efficiency of the dehumidifier would be correspondingly reduced. In general, higher regeneration temperatures could improve the regeneration rates, but also increase the energy consumption. Besides, the operation parameters of the refrigeration system may also have an impact on the performance of the water-harvesting system. The objective of the system is to obtain water from the air, which is finally realized by the cooling process of the regenerated air via the surface cooler. Therefore, the state of the regenerated air (t2 and d2) and the evaporation temperature (te) of the refrigeration system have an impact on the amount of water condensed by the surface cooler.
The objectives of this optimization include both the water production efficiency and the energy consumption of the system, which mainly includes the power consumption of the regenerative heater and the refrigeration compressor.

2.3. Determination of the Basic Parameters

Due to the limitations of the measurement conditions, some key parameters were not previously available, such as the actual power of the heater and the actual flow rate of the circulating air. These parameters are inferred below with the aid of limited test data.

2.3.1. Heating Power

There are two groups of heaters, which are powered separately. The outlet air temperature from the heater could be moderated by the on/off state of one group of heaters. The electric current in each phase of the two heater supply circuits was measured to be around 56 A, so the total power of the heaters can be calculated as follows:
W = 2 × 3 U l I l = 2 × 1.732 × 380 × 56 = 73.8   kW
Here, Ul means the tested voltage, and Il means the tested electric current.
Accordingly, the heating power was controlled below 75 kW in the following calculations for the optimization of the operation parameters.

2.3.2. Definition of the Circulating Airflow Rate

To determine the circulating airflow volume, it is necessary to assume the surface cooler outlet conditions on the basis of the available test data. The measurement was conducted in the test conditions, as shown in Table 1.
The test results showed that the outlet air temperature of the primary surface cooler was approximately 10 °C when the system ran in the stable state. It can be further assumed that the outlet air temperature of the secondary surface cooler was 8 °C, while the relative humidity was 100%. The test results showed that the inlet airflow rate was 12,000 m3/h, while the flow rate of the circulating air was 2500 m3/h. Under this condition, the calculated power of the heater was 73.8 kW, and the water production was 62.1 kg/h, which is in good agreement with the measured average water production of 61.5 kg/h. Further calculations were conducted under other operating conditions. It was found that the circulating airflow rate range of 2000~2500 m3/h could ensure that the heating power did not exceed 75 kW. Therefore, the circulating airflow rate was defined as 2300 m3/h, while the inlet airflow rate was defined as 12,000 m3/h in the following calculations.

2.3.3. Surface Cooler Outlet Air Status

The surface cooler could reduce the temperature and the moisture content of the air simultaneously. Due to the condense layer adhering to the surface of the cooler tube bundle, the relative humidity of the air could be over 90% if heat and moisture were transferred adequately. It has been proven that well-designed surface coolers could promote the outlet air relative humidity up to almost 100%. Therefore, in the determination of the circulating airflow volume covered in Section 2.3.2, it was assumed that the relative humidity of the air at the outlet of the surface cooler was 100%. The air temperature at the outlet of the surface cooler had an effect on the amount of water production. For example, with a relative humidity of 100% from surface cooler, the system water production was calculated to be 62.1 kg/h, 60.9 kg/h, and 59.5 kg/h, respectively, when the temperature was 8 °C, 10 °C, and 12 °C, respectively. This means that an increase in the outlet temperature of the surface cooler will result in a slight decrease in water production.

2.3.4. Calculation Formulas of Performance Indicators

In this section, the performance of the system will be optimized by analyzing some operation parameters. Correlating with Figure 1, the formulas for the calculation of each performance indicator are shown below.
Water production (M) is calculated in Equation (2) as:
M = ρ 2 Q 2 d 2 d 4 / 3600 ,   kg / h
Heating power (Qh) is calculated in Equation (3) as:
Q h = ρ 5 Q 5 h 1 h 5 / 3600 ,   kW
Cooling capacity (Qc) is calculated in Equation (4) as:
Q c = ρ 2 Q 2 h 2 h 4 / 3600 ,   kW
Compressor power (Pc) is calculated in Equation (5) as:
P c = Q c / C O P ,   kW
Water production per unit of energy (m) is calculated in Equation (6) as:
m = M / Q h + P c ,   kg / kWh
For the above equations,   ρ i denotes the density of the air at point i, kg/m3; Q i is the airflow rate at point i, m3/h; d i is the moisture content of the air at point i, g/kg; h i represents the enthalpy of the air at point i, kJ/kg; COP is the performance coefficient of the compressor, and i represents the points in Figure 2.

3. Results and Discussion

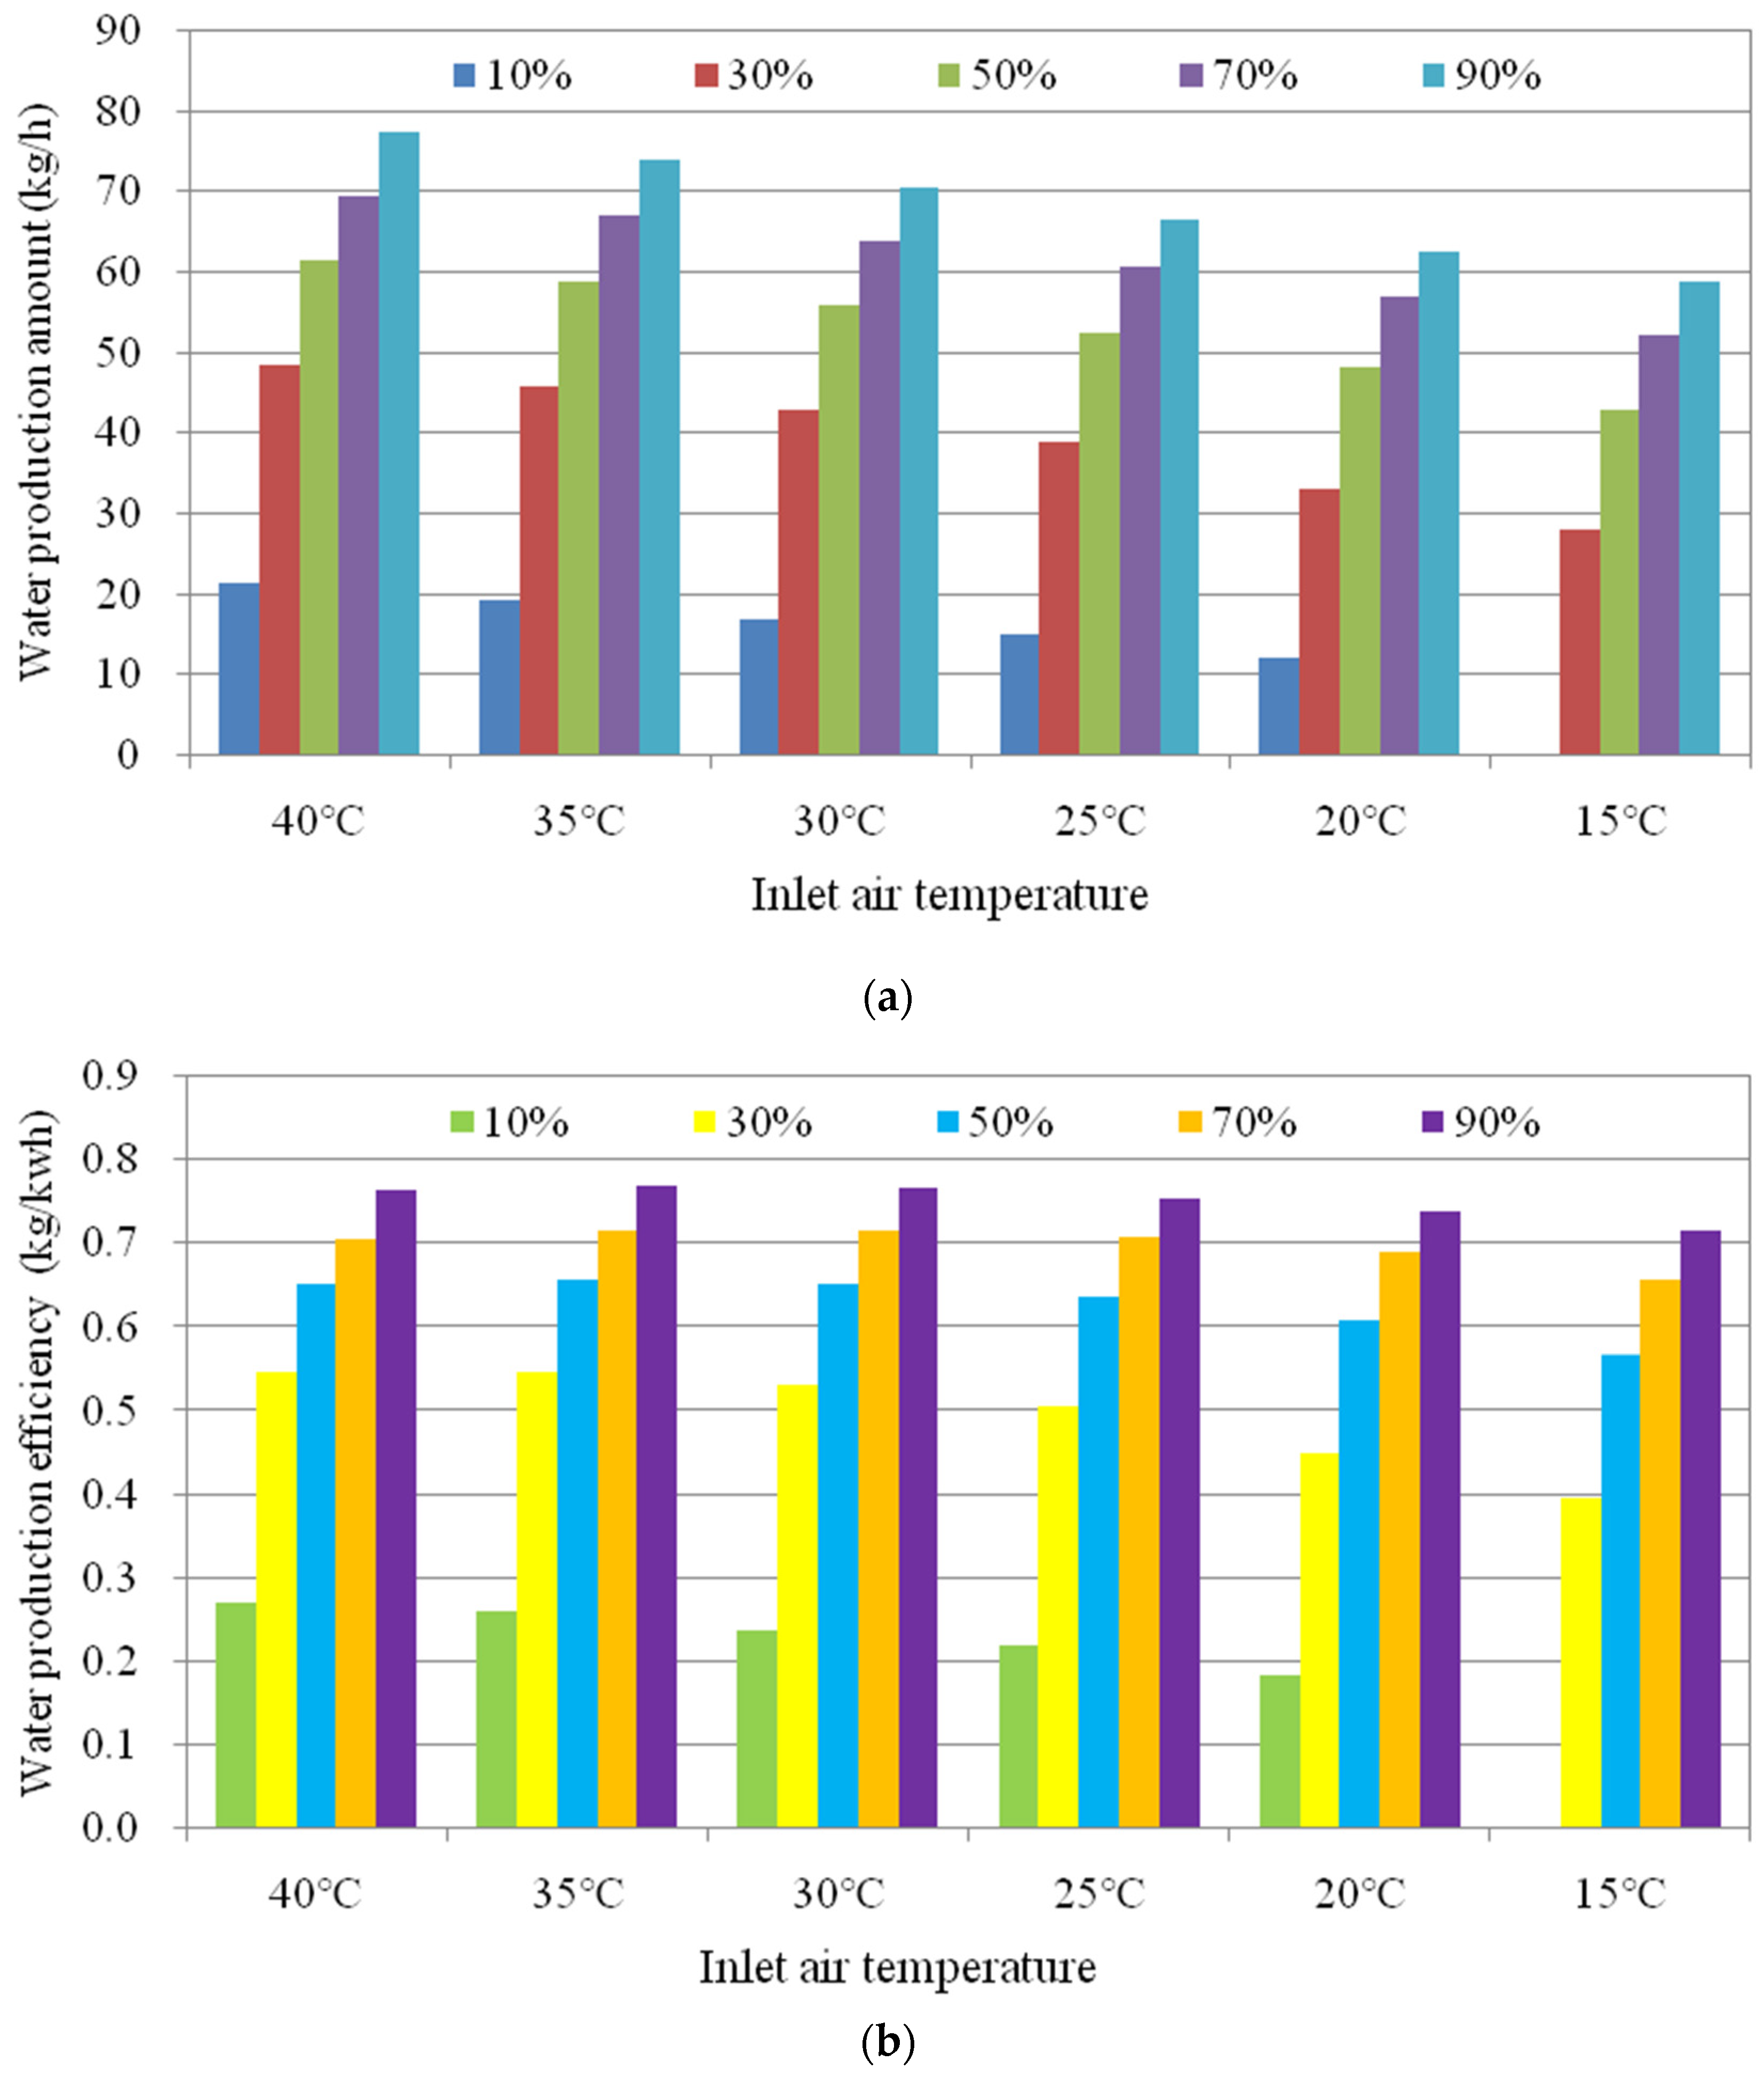
3.1. Impact of the Environmental Conditions

Firstly, the water production amount (kg/h) and the water production efficiency (kg/kWh) were calculated at different ambient temperature and humidity conditions (dry-bulb temperature range of 15~40 °C and relative humidity range of 10~90%). The two series of results can be used as reference indicators for the ‘powerful mode’ and ‘economic mode’, respectively. Figure 3 shows a comparative analysis of the calculated results under different conditions, which shows that the higher ambient temperature and relative humidity led to more water production. This is mainly due to the fact that the absolute moisture content of the ambient air increased with the dry-bulb temperature and relative humidity.
The water production efficiency (per unit of energy consumption) showed roughly the same trend as that of the water production amount, but its variation was very small. There was basically no difference in the water production per unit energy consumption at different dry-bulb temperatures in the temperature range of 30~40 °C with relative humidity above 50%. It can be concluded that the higher the ambient dry-bulb temperature and relative humidity were, the higher the water production amount and efficiency were, i.e., the operation of the system was more economic.
Since the ambient air parameters were objectively variable, they were deemed as the operating environment of the system rather than the operation parameters. The above calculation results were, therefore, only used as reference values for the operation characteristics of the system in different environments, such as desert or forest with different air conditions. In the following sections, the operation parameters of the system will be optimized, mainly including the rotational speed, partition area ratio, regeneration temperature, airflow ratio, and evaporation parameters.

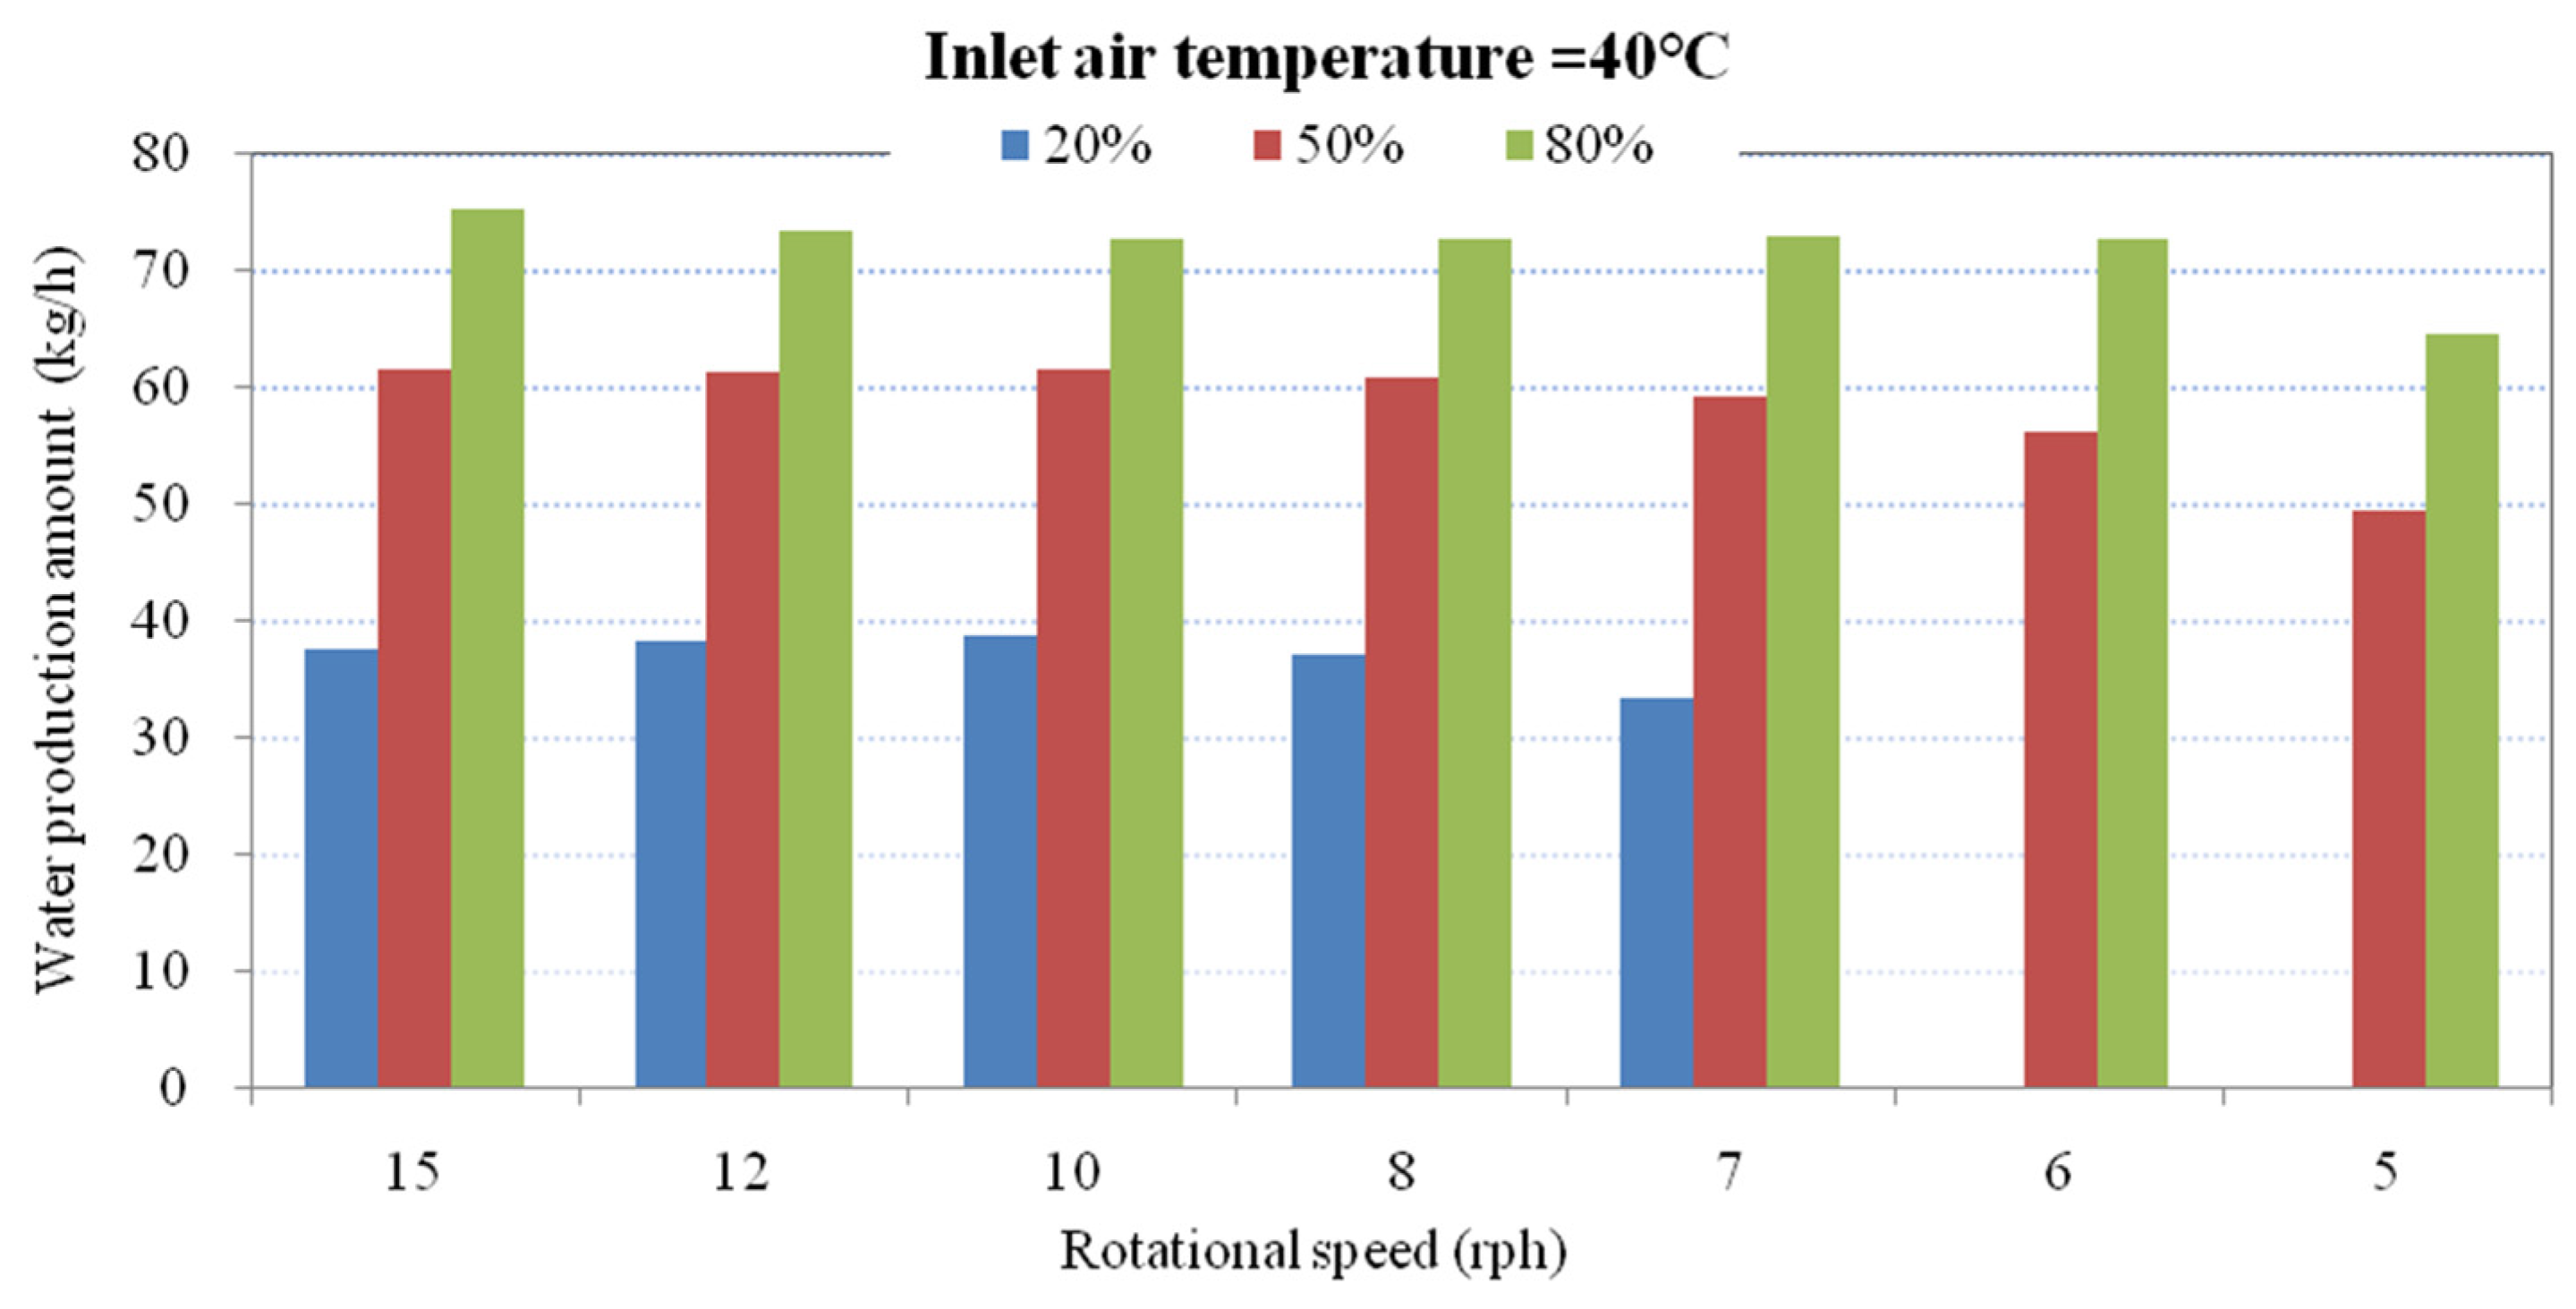
3.2. Optimization of Rotational Speed (rph)

Based on the operational parameters of the system, the parameters listed in Table 2 were identified as fixed conditions for researching the effect of rotational speed. The results of the calculations at different speeds for these operation parameter conditions are shown in Figure 4, Figure 5 and Figure 6.
The graph below shows a comparative analysis of the rotational speed results. At an inlet air temperature of 40 °C, it can be seen that the effect of the rotational speed on water production was small, especially at high rotational speeds (8~15 rph), where there was almost no difference in the water production amount. In low- and medium-humidity conditions (20% and 50%), there was a more pronounced drop in water production at rotational speeds below 8 rph, especially at 5 rph, which also happens in high humidity (80%). This means the absorption ability of the rotor could be ensured at higher rotation speeds. However, lower rotation speeds will reduce the water production rate. The water production efficiency followed the same trend as the water production variation with rotational speed, but its variation was much smaller. The calculation results at the inlet air temperatures of 30 °C and 20 °C also showed similar characteristics, which can be found in the tables in Appendix B.
Overall, the speed should not be too low, but high speeds consume more power. In order to find out the optimal rotational speed, the frequencies of the highest water production amount and water production efficiency corresponding to each speed were counted based on the analysis of the computed data, which can be found in detail in Appendix B. As shown in Figure 6, it can be seen that the frequency of the optimum water production efficiency was equivalent for speeds of 15, 8, and 6 rph. However, the frequency of the optimum water production amount was highest at a speed of 8 rph. In conclusion, a rotational speed of 8 rph could be deemed as the optimum rotational speed.

3.3. Optimization of Zonal Area Ratio (Ap/Ar)

Different area ratios could be set by adjusting the occupied angles of the dehumidifier zone, the regeneration zone, and the cooling zone. The water production results were calculated based on the parameters listed in Table 3.
The graphs in Figure 7 are comparisons based on the calculation results at the regeneration temperature of 120 °C. It can be seen that both the water production amount and the efficiency were almost at the same level in higher-humidity conditions (50% and 80%), while there existed little difference in low-humidity conditions (20%), especially for the water production efficiency.
Since the water production difference in higher-humidity conditions at different area ratios was small, only the low-humidity condition was analyzed for comparison. It can be seen that area ratio of 3 was the best, while the area ratio of 2 took second place, being slightly inferior. In terms of the system structure design, it is much more convenient to equip an area ratio of 2 than an area ratio of 3. By taking into account both the manufacturing and performance aspects of the system, an area ratio of 2 is preferable, as shown in Figure 1a. The variation trends of the results for different area ratios at regeneration temperatures of 90 °C and 70 °C were similar to the analysis above, which can be found in Appendix C.

3.4. Optimization of Regeneration Temperature (t1)

From the above analysis, it is clear that the area ratio of 3 was the optimum area ratio from the perspective of water production, but the area ratio of 2 had advantages in the structural layout. Therefore, the system performance for an area ratio of 2 was further analyzed in this section. The calculation work was conducted for three regeneration temperatures (70 °C, 90 °C, and 120 °C) based on the following parameters listed in Table 4.
The comparative analysis is shown in Figure 8. It can be clearly seen that the higher the regeneration temperature was, the higher the water production was. However, a higher regeneration temperature means a higher operational power of the heater, which may affect the economy of the system operation. The comparison of the water production efficiency showed that the results for the three regeneration temperatures did not differ significantly. However, there was still a tendency that the higher the regeneration temperature was, the higher the water production efficiency was, especially at a lower relative humidity. The results under other environmental conditions could be found in Appendix D and Appendix E. Therefore, a higher regeneration temperature should be adopted when power conditions permit, since a higher regeneration temperature could improve the adsorption ability of the system.

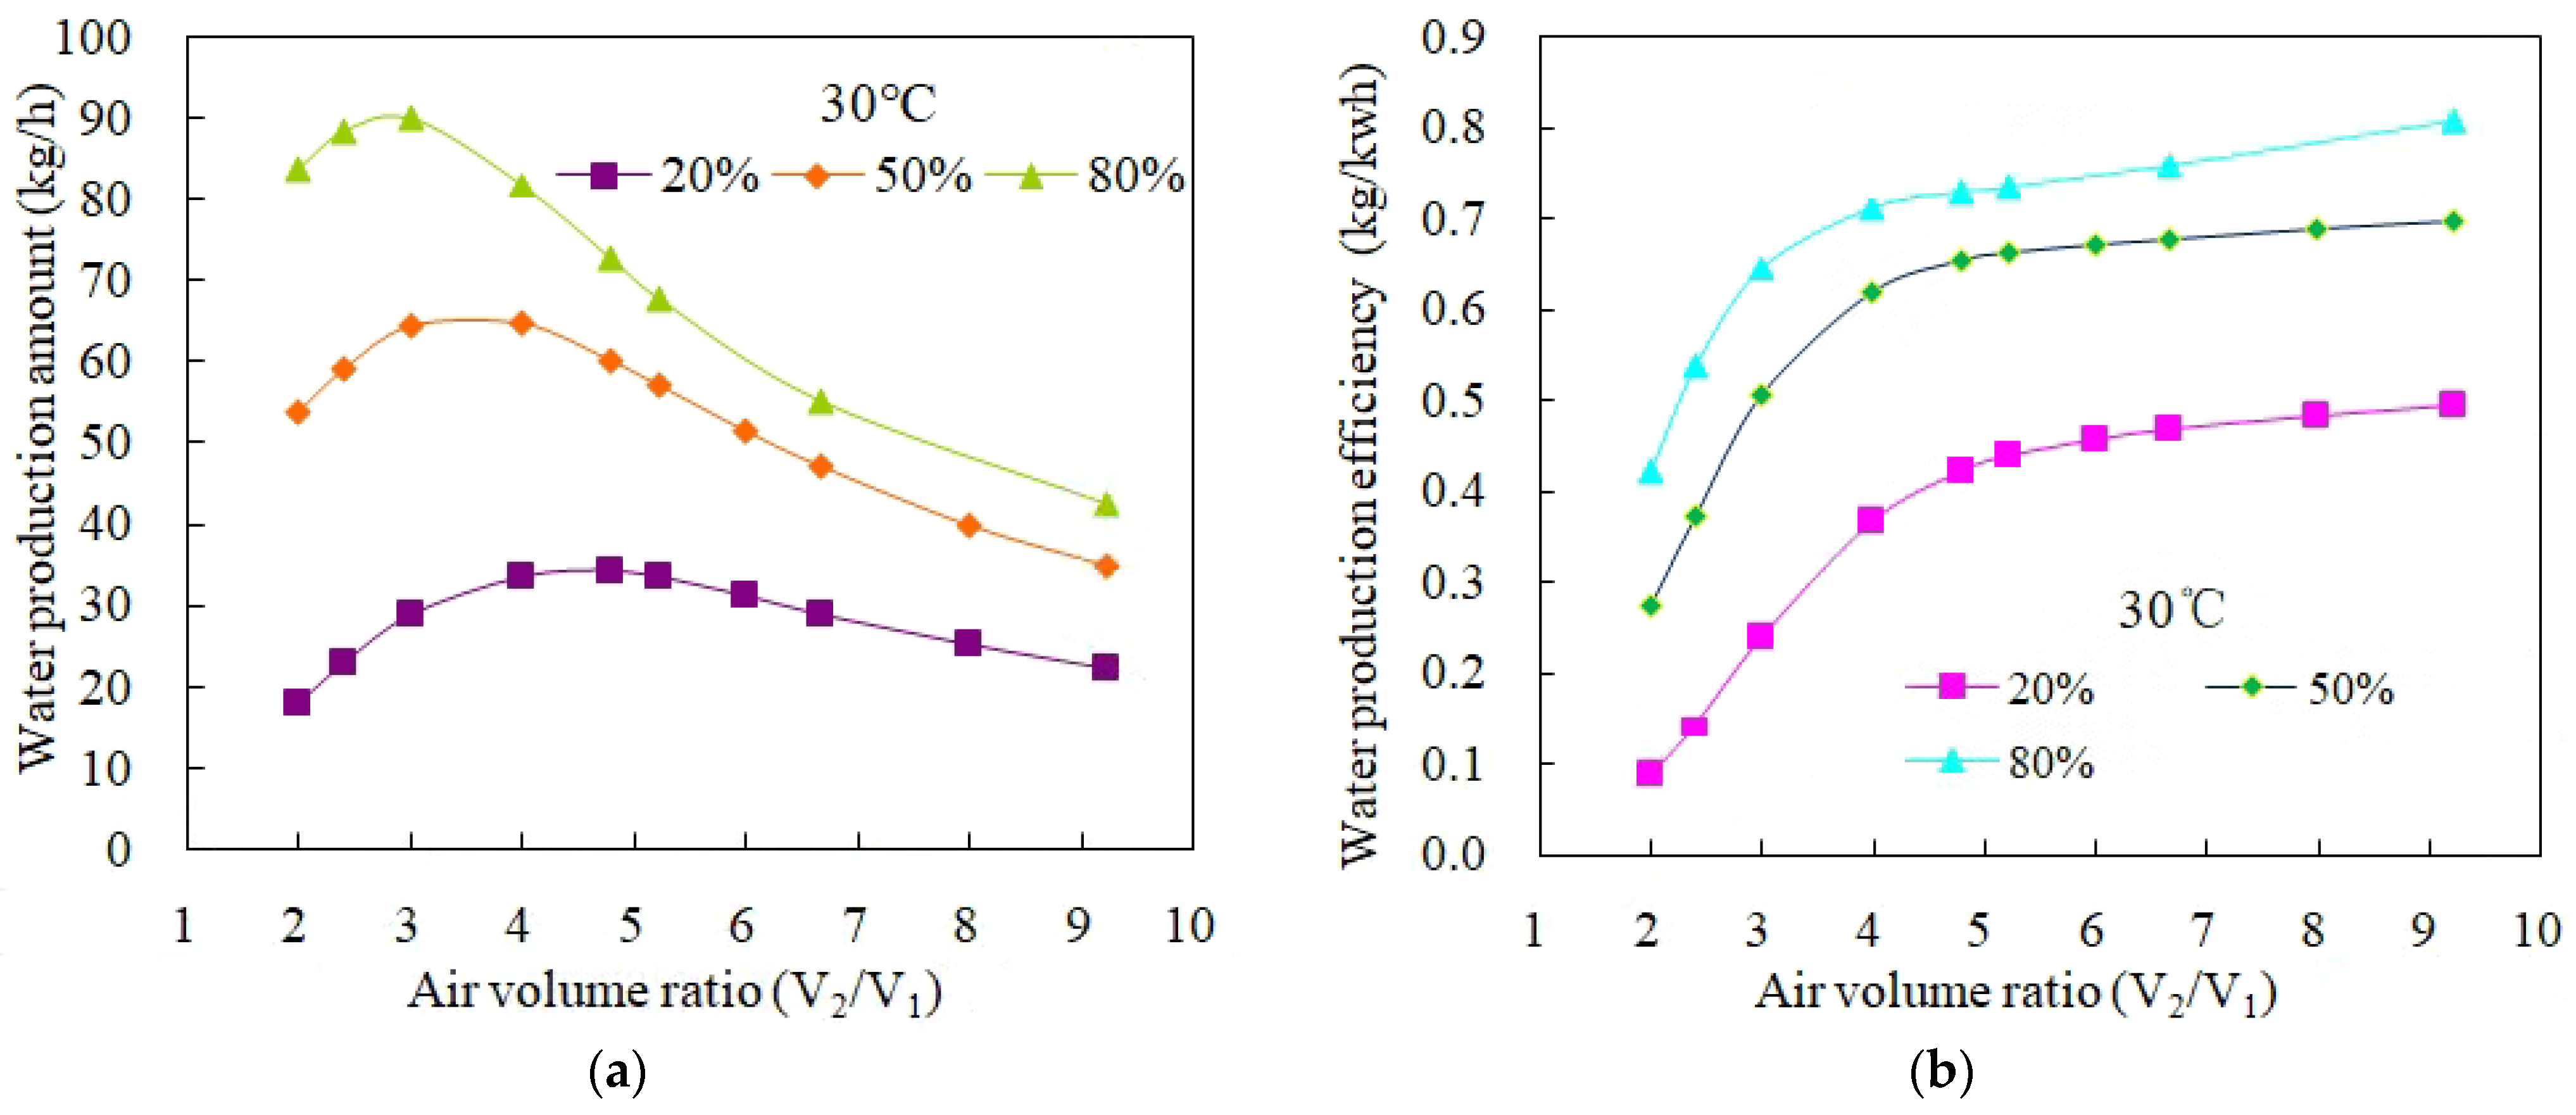
3.5. Optimization of the Ratio of Adsorption to Circulation Airflow Rate (V2/V1)

Based on the previous optimization results, the performance of the system was calculated according to the following operation conditions listed in Table 5, while the ratio of the adsorption airflow rate to the circulation airflow rate varied.
The circulating air volume was varied, with a fixed-adsorption air volume of 12,000 m3/h. The calculation results for the ratio of V2/V1 ranging from 2 to 9.23 were obtained, as shown in Figure 9. The graph includes results for three operating conditions, with an inlet air temperature of 30 °C and relative humidity of 20%, 50%, and 80%, respectively.
From the perspective of the water production amount, it can be seen that there existed an optimum value of the airflow ratio (V2/V1) when the adsorption air volume was fixed, which could produce the maximum water amount. For medium (RH of 50%) and high (RH of 80%) humidity conditions, the optimum ratio was 3, meaning that the circulating air volume was 4000 m3/h. For the low-humidity condition (RH of 20%), the optimum ratio was 4 or 5. The results reflect that the lower circulation air volume deteriorated the water production. The water production efficiency always increased with the increase in the airflow ratio, since the lower circulation air volume consumed less power for heating. However, the rising tendency became indistinct at a higher ratio. For example, the increasing rate decreased significantly when the airflow ratio exceeded 4 in medium- or high-humidity conditions. From the perspective of the water production amount, the airflow ratio should be set as 3 in medium- and high-humidity conditions, while in low-humidity conditions, the airflow ratio should be set as 5, in theory. If water production efficiency is preferred, the airflow ratio of 5 is suitable for each humidity condition.
Figure 10 shows the variations in the water production amount and the water production efficiency with the airflow ratio at different air temperatures, while the relative humidity was fixed at 50%. As can be seen from the two graphs, the amount of water production, especially the water production efficiency, was not as sensitive to the changes in ambient dry-bulb temperature as it was to the changes in humidity. This is because the driving force of the adsorption process of the rotor was the difference between the moisture content of the air and the dehumidifier. It is important to note that the above conclusions were derived without consideration of heating power. The variations in the heating power with the airflow ratio for the inlet air of different relative humidities are shown in Figure 11.
It can be seen that the heating power decreased rapidly as the airflow ratio increased (the circulating airflow decreased with the fixed-adsorption airflow). It can also be seen that the heating power had little to do with the inlet air temperature when the relative humidity remained constant. Since the heating power of the system was capped at 75 kW, it can be seen that the airflow ratio should be more than 5 in high- and medium-humidity conditions (RH of 80% and 50%), while it should be more than 4 in low-humidity conditions (RH of 20%). On the other hand, if the circulating air volume was fixed at 2300 m3/h while the air volume on the adsorption side varied, the relationship between the water production and the airflow ratio could also be obtained, as shown in Figure 12.
Unlike the situation of the adsorption air volume being fixed, when the circulating air volume was fixed at 2300 m3/h, there was a monotonic increase in the system water production amount and efficiency as the airflow ratio increased (i.e., the adsorption air volume increased). This is because the circulating air volume of 2300 m3/h had enough regeneration capacity. When the adsorption air volume was relatively small, the dehumidifier could not adsorb enough water from the inlet air, and the regeneration capacity of the circulating air was not fully utilized. Therefore, as the airflow ratio increased (i.e., the adsorption air volume increased), the regeneration capacity of the circulating air was further exerted, and the water production amount gradually increased. However, it can also be observed that when the airflow ratio increased to a certain level, both of the increasing rates in water production amount and efficiency decreased.
In the above figures, the adsorption airflow was 12,000 m3/h with an airflow ratio of 5.22, which is close to the measurement operating conditions of the system. When the adsorption air volume is further increased, the airflow speed in the adsorption zone will be further increased, which is more favorable to the adsorption process of the dehumidifier. From this perspective, the diameter of the rotary dehumidifier should be further enlarged.

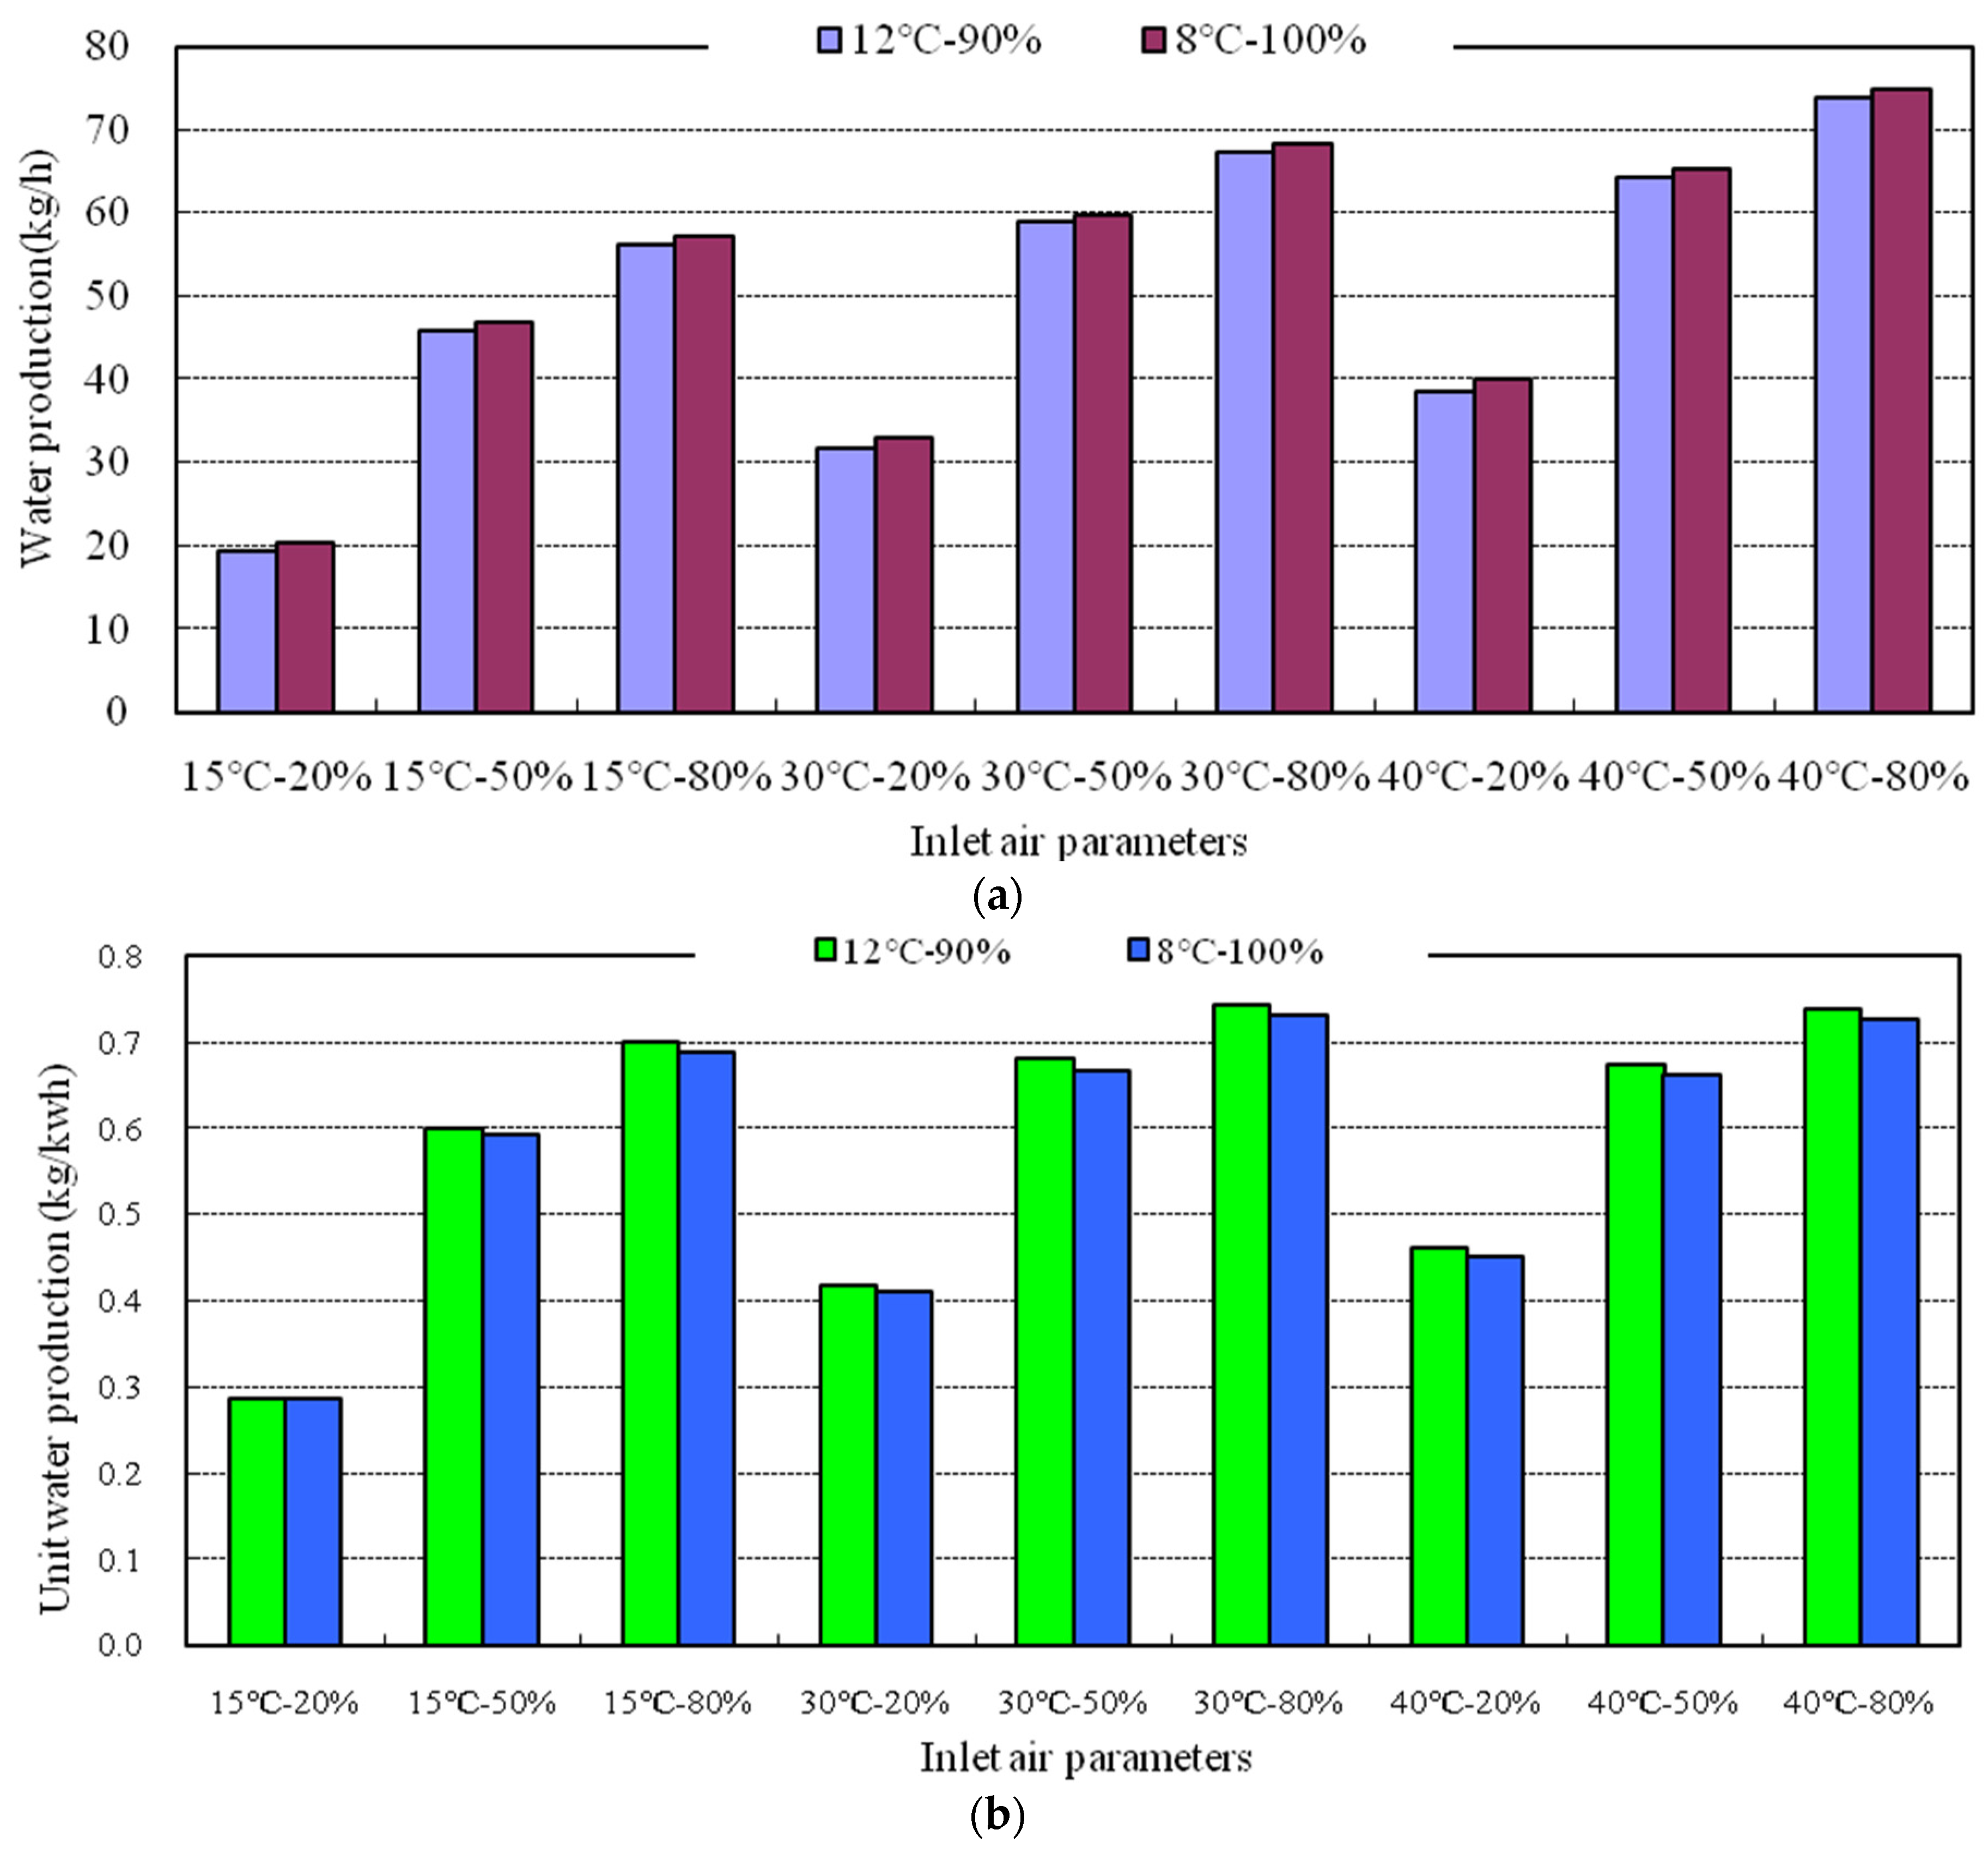
3.6. Optimization of Outlet Parameters of the Surface Cooler

The outlet parameters of the surface cooler include the outlet air temperature and the relative humidity (or moisture content), which are mainly determined by the design of the surface cooler. The larger the surface cooler area is, the lower its outlet air temperature and the higher the relative humidity would be. These parameters also affect the system’s operation performance. In this section, two operating conditions of surface cooler outlet parameter were compared, i.e., 12 °C-90% and 8 °C-100%. Other operation parameters for the calculations were set as shown in Table 6.
Figure 13 shows a comparative analysis of the calculated results based on the parameters listed in Table 6. It can be seen that the performance of the two parameters was almost the same for both operation conditions at all inlet parameters. The water production amount of the 12 °C-90% working condition was slightly lower than that of the 8 °C-100% working condition, while the water production efficiency of the 12 °C-90% working condition was slightly higher than that of the 8 °C-100% working condition. The reason for this is that the working condition of 8 °C-100% showed a stronger cooling and dehumidifying capacity, as shown in the process of ‘2→4’ in Figure 2. However, it also had a higher cooling power consumption than that of the working condition of 12 °C-90%.
Therefore, for the ‘powerful mode’, i.e., when the focus is on the water production amount, the outlet parameters of the surface cooler should be designed as 8 °C-100%. For the ‘economic mode’, i.e., when the focus is on the water production efficiency, the working condition of 12 °C-90% should be designed.

4. Conclusions

According to the operation parameters of the system, the water production amount (kg/h) and the water production efficiency (kg/kWh) under different ambient conditions (temperature and humidity) were firstly computed with the wheel dehumidifier computation software. These two results can be used as reference indicators for the ‘powerful mode’ and ‘economic mode’, respectively. The computation results indicated that the two values increased with the increase of the ambient dry-bulb temperature and the relative humidity, meaning the economical operation of the system was better. After the computation analysis, the optimized operation parameters of the system were obtained, as follows:
(1)
The rotation speed of the wheel dehumidifier should be set as 8 rph considering the water production efficiency and the power consumption.
(2)
The zonal area ratio of Ap/Ar = 2 was the best from the perspectives of the manufacturing and performance aspects of the system.
(3)
A higher regeneration temperature should be adopted when conditions permit, since a higher regeneration temperature means a higher water production amount and efficiency.
(4)
Considering the theoretical calculation results and the actual heating power configuration of the system, the acceptable lower limit of the airflow ratio was 5 under the higher-humidity environment (RH of 80% and 50%), while it was 4 under the low-humidity environment (RH of 20%).
Finally, the outlet air parameter settings of the surface cooler were optimized. Design parameters of 8 °C-100% and 12 °C-90% were suitable for the ‘powerful mode’ and ‘economic mode’, respectively. Due to the lack of an artificial chamber, the system could not be tested under various environmental conditions. Therefore, the computation work was firstly conducted in theory so as to provide a reference for the future test work.

Author Contributions

Conceptualization, S.Z. and J.L.; methodology, S.Z.; investigation, X.W. and H.J.; formal analysis, S.Z.; resources, X.W.; data curation, H.J.; writing—original draft preparation, S.Z.; writing—review and editing, S.Z. All authors have read and agreed to the published version of the manuscript.

Funding

This work was supported by the Plan of Introduction and Cultivation for Young Innovative Talents in Colleges and Universities of Shandong Province (Lu Jiao Ke Han [2021] No. 51).

Institutional Review Board Statement

Not applicable.

Informed Consent Statement

Not applicable.

Data Availability Statement

Data are contained within the article and Appendix A, Appendix B, Appendix C, Appendix D, Appendix E and Appendix F.

Acknowledgments

This work acknowledges the technology support from Wenzhi Cui, Kaimin Yang and Yudong Mao.

Conflicts of Interest

The authors declare no conflicts of interest.

Appendix A. Outdoor Parameter Variation

Regeneration temperature = 120 °C; area ratio = 2; intake air volume = 12,000 m3; circulating air volume = 2300 m3.
TRHMmQhQcPcTRHMmQhQcPc
40 °C10%21.20 0.27 58.83 55.20 19.64 35 °C10%19.30 0.26 58.42 53.81 16.26
30%48.36 0.55 65.54 64.82 23.07 30%45.91 0.54 65.21 63.05 19.05
50%61.43 0.65 69.24 70.72 25.17 50%58.93 0.66 69.07 68.76 20.77
70%69.54 0.71 71.70 75.40 26.83 70%66.98 0.72 71.39 73.31 22.15
90%77.59 0.76 73.38 79.28 28.21 90%74.01 0.77 73.21 76.63 23.15
30 °C10%16.90 0.24 57.93 52.31 13.55 25 °C10%15.03 0.22 57.37 51.10 11.41
30%42.79 0.53 64.79 61.05 15.82 30%38.85 0.50 63.81 58.85 13.14
50%55.92 0.65 68.64 66.68 17.28 50%52.39 0.63 68.16 64.31 14.35
70%63.94 0.71 71.21 70.73 18.32 70%60.80 0.71 70.71 68.15 15.21
90%70.48 0.77 72.72 74.02 19.18 90%66.48 0.75 72.37 71.16 15.88
20 °C10%11.94 0.18 56.40 49.41 9.56 15 °C
30%33.03 0.45 62.57 56.02 10.84 30%27.93 0.39 61.66 53.69 9.05
50%48.14 0.61 67.25 61.75 11.94 50%42.88 0.57 65.76 58.53 9.87
70%57.00 0.69 69.96 65.34 12.64 70%52.09 0.66 68.73 62.39 10.52
90%62.65 0.74 71.72 68.41 13.23 90%58.82 0.72 71.12 65.34 11.02
T—Dry-bulb temperature (°C); RH—relative humidity (%); M—water production amount (kg/h); m—water production efficiency (kg/kWh); Qh—heating power (kW); Qc—cooling capacity (kW); Pc—cooling power (kW).

Appendix B. The Optimal Rotation Speed Computation

Regeneration temperature = 120 °C; area ratio = 2; intake air volume = 12,000 m3; circulating air volume = 2300 m3.
Speed
(rph)
MQhQcmSpeed
(rph)
MQhQcmSpeed
(rph)
MQhQcm
40 °C-20%40 °C-50%40 °C-80%
1537.56 61.26 21.87 0.45 1561.52 67.98 25.63 0.66 1575.33 71.46 28.19 0.76
1238.22 62.67 21.67 0.45 1261.43 69.24 25.17 0.65 1273.46 72.55 27.51 0.73
1038.74 63.07 21.32 0.46 1061.46 69.80 24.77 0.65 1072.82 73.28 27.11 0.73
837.09 61.75 20.38 0.45 860.88 69.86 24.21 0.65 872.82 74.32 26.70 0.72
733.42 58.87 19.38 0.43 759.26 68.89 23.48 0.64 773.04 74.68 26.41 0.72
6 656.31 66.30 22.38 0.63 672.80 74.45 25.94 0.73
5 549.41 61.03 20.54 0.61 564.50 67.31 23.01 0.71
30 °C-20%30 °C-50%30 °C-80%
1530.39 60.52 14.74 0.40 1555.07 67.40 17.35 0.65 1567.56 70.88 18.95 0.75
1231.49 61.85 14.91 0.41 1255.95 68.58 17.28 0.65 1267.00 71.89 18.76 0.74
1032.73 62.65 14.87 0.42 1056.80 69.38 17.14 0.66 1067.09 72.78 18.65 0.73
833.81 61.83 14.49 0.44 856.94 69.36 16.81 0.66 867.89 73.75 18.50 0.74
627.35 55.30 13.08 0.40 653.71 66.29 15.79 0.65 668.71 73.87 18.13 0.75
5 547.90 61.35 14.61 0.63 566.92 71.74 17.43 0.75
4 4 460.75 66.16 16.02 0.74
20 °C-20%20 °C-50%20 °C-80%
1522.36 58.93 9.99 0.32 1547.18 65.90 11.81 0.61 1559.70 69.87 12.90 0.72
1223.24 60.36 10.32 0.33 1248.14 67.25 11.94 0.61 1260.14 71.04 12.95 0.72
1024.10 61.25 10.48 0.34 1049.47 67.90 12.00 0.62 1060.88 71.78 13.02 0.72
825.40 61.01 10.40 0.36 850.76 67.96 11.88 0.64 861.88 72.66 13.01 0.72
623.30 55.46 9.55 0.36 649.41 64.87 11.27 0.65 662.73 72.38 12.79 0.74
5 544.53 60.86 10.54 0.62 561.24 69.84 12.28 0.75
4 455.34 63.96 11.23 0.74
M—Water production amount (kg/h); m—water production efficiency (kg/kWh); Qh—heating power (kW); Qc—cooling capacity (kW).

Appendix C. The Optimal Area Ratio Computation

Intake air temperature = 30 °C; speed = 8 rph; intake air volume = 12,000 m3; circulating air volume = 2300 m3.
20%-70 °CMQhmQcPc50%-70 °CMQhmQcPc80%-70 °CMQhmQcPc
610.53 30.67 0.27 31.32 8.11 627.27 36.32 0.59 38.04 9.86 634.99 38.74 0.71 41.22 10.68
411.08 30.40 0.29 31.09 8.05 427.41 36.56 0.59 37.98 9.84 435.24 38.91 0.71 41.40 10.72
311.44 30.32 0.30 31.26 8.10 327.41 36.56 0.59 37.98 9.84 335.32 38.91 0.71 41.45 10.74
211.39 30.76 0.29 31.07 8.05 227.22 36.65 0.59 37.76 9.78 235.21 38.99 0.71 41.30 10.70
111.11 30.72 0.29 31.26 8.10 127.16 36.57 0.59 37.88 9.81 135.05 38.92 0.71 41.10 10.65
20%-90 °CMQhmQcPc50%-90 °CMQhmQcPc80%-90 °CMQhmQcPc
620.16 42.61 0.38 42.27 10.95 639.38 49.77 0.63 49.81 12.90 648.23 52.70 0.72 53.95 13.98
420.90 42.86 0.39 42.01 10.88 439.98 50.19 0.63 50.00 12.95 447.92 52.87 0.72 53.49 13.86
321.12 43.10 0.39 41.93 10.86 340.12 50.29 0.63 50.10 12.98 348.03 52.88 0.72 53.65 13.90
221.12 43.50 0.39 42.01 10.88 240.07 50.46 0.63 50.22 13.01 247.84 53.20 0.71 53.52 13.86
120.21 43.90 0.37 41.83 10.84 139.35 50.38 0.62 49.87 12.92 147.43 52.75 0.71 53.30 13.81
20%-120 °CMQhmQcPc50%-120 °CMQhmQcPc80%-120 °CMQhmQcPc
632.68 61.10 0.43 57.20 14.82 657.68 68.43 0.67 66.24 17.16 667.47 72.90 0.74 71.62 18.55
433.67 61.19 0.44 56.48 14.63 458.90 69.39 0.68 66.21 17.15 468.16 73.29 0.74 71.62 18.55
333.94 61.59 0.45 56.19 14.56 359.34 69.97 0.68 66.37 17.19 368.25 73.56 0.74 71.60 18.55
233.81 61.83 0.44 55.93 14.49 259.26 70.44 0.68 66.39 17.20 267.80 73.82 0.73 71.37 18.49
131.99 62.30 0.42 55.66 14.42 157.99 70.67 0.66 65.81 17.05 166.45 73.75 0.72 70.64 18.30
M—Water production amount (kg/h); m—water production efficiency (kg/kWh); Qh—heating power (kW); Qc—cooling capacity (kW); Pc—cooling power (kW).

Appendix D. Comparative Analysis of Regeneration Temperatures

Speed = 8 rph; area ratio = 3; intake air volume = 12,000 m3; circulating air volume = 2300 m3.
Regeneration temperature = 70 °CRegeneration temperature = 90 °CRegeneration temperature = 120 °C
Ambient conditionsMQhmQcPcMQhmQcPcMQhmQcPc
15 °C-20%8.35 30.32 0.24 27.79 4.69 13.57 42.13 0.28 38.40 6.48 21.04 59.63 0.31 52.53 8.86
15 °C-50%21.87 35.84 0.53 33.23 5.60 33.42 48.74 0.59 44.75 7.55 48.23 67.21 0.62 60.19 10.15
15 °C-80%28.62 38.18 0.65 35.81 6.04 39.73 51.42 0.67 47.89 8.08 58.29 71.08 0.71 64.80 10.93
30 °C-20%11.44 30.32 0.30 31.26 8.10 21.12 43.10 0.39 41.93 10.86 33.94 61.59 0.45 56.19 14.56
30 °C-50%27.41 36.56 0.59 37.98 9.84 40.12 50.29 0.63 50.10 12.98 59.34 69.97 0.68 66.37 17.19
30°C-80%35.32 38.91 0.71 41.45 10.74 48.03 52.88 0.72 53.65 13.90 68.25 73.56 0.74 71.60 18.55
40 °C-20%11.77 29.92 0.28 32.53 11.58 22.56 42.86 0.39 43.60 15.52 36.73 61.27 0.45 57.56 20.48
40 °C-50%30.47 36.80 0.59 40.72 14.49 43.59 50.53 0.63 53.07 18.89 63.23 70.36 0.66 69.48 24.73
40 °C-80%39.49 39.15 0.72 44.98 16.01 52.36 53.21 0.71 57.07 20.31 73.26 73.98 0.73 75.27 26.79
Area ratio = 2
15 °C-20%8.24 30.40 0.24 27.79 4.69 13.35 42.37 0.27 38.17 6.44 20.76 59.95 0.30 52.33 8.82
15 °C-50%21.89 35.84 0.53 33.33 5.62 33.42 48.91 0.59 44.91 7.57 47.87 67.62 0.62 60.09 10.13
15 °C-80%28.65 38.10 0.65 35.91 6.06 39.60 51.50 0.66 47.88 8.07 57.99 71.50 0.70 64.67 10.90
30°C-20%11.39 30.76 0.29 31.07 8.05 21.12 43.50 0.39 42.01 10.88 33.81 61.83 0.44 55.93 14.49
30 °C-50%27.22 36.65 0.59 37.76 9.78 40.07 50.46 0.63 50.22 13.01 59.26 70.44 0.68 66.39 17.20
30 °C-80%35.21 38.99 0.71 41.30 10.70 47.84 53.20 0.71 53.52 13.86 67.80 73.82 0.73 71.37 18.49
40 °C-20%12.08 30.08 0.29 32.75 11.65 22.80 43.34 0.39 43.62 15.52 37.09 61.75 0.45 57.26 20.38
40 °C-50%30.30 36.81 0.59 40.60 14.45 43.29 50.70 0.62 52.85 18.81 63.25 71.02 0.66 69.50 24.73
40 °C-80%39.29 39.32 0.71 44.76 15.93 52.20 53.22 0.71 56.95 20.27 72.82 74.32 0.72 75.04 26.70

Appendix E. Comparative Analysis of Regeneration Temperatures

Speed = 12 rph; intake air volume = 12,000 m3; circulating air volume = 2300 m3.
Regeneration temperature = 70 °CRegeneration temperature = 90 °CRegeneration temperature = 120 °C
Ambient conditionsMQhmQcPcMQhmQcPcMQhmQcPc
Area ratio = 3
15 °C-20%7.329.40.2226.354.4412.540.80.2736.506.1619.459.00.2951.298.65
15 °C-50%20.834.70.5232.195.4331.747.80.5743.737.3745.966.50.6059.9610.11
15 °C-80%28.236.90.6635.335.9638.850.20.6747.127.9556.369.80.7064.2110.83
30 °C-20%11.029.50.2931.448.1520.442.30.3842.3710.9831.961.50.4257.7714.97
30 °C-50%27.735.50.6138.6210.0039.849.00.6450.8513.1759.069.10.6868.0517.63
30 °C-80%36.737.80.7542.8211.0948.851.60.7454.8914.2267.471.90.7472.8118.86
40 °C-20%12.529.30.3033.8112.0323.242.30.4045.4116.1638.662.10.4661.0821.74
40 °C-50%32.235.50.6342.9015.2744.149.30.6454.8419.5164.369.60.6772.1925.69
40 °C-80%42.838.00.7848.1217.1354.752.00.7559.6821.2473.972.50.7477.6827.64
Area ratio = 2
15 °C-20%7.329.50.2126.294.4312.340.70.2635.996.0719.359.20.2851.098.62
15 °C-50%20.834.60.5232.075.4131.547.70.5743.637.3645.366.60.5959.5610.04
15 °C-80%27.937.10.6534.965.9038.550.20.6646.817.8955.970.00.6963.9010.78
30 °C-20%10.829.70.2931.118.0620.142.60.3842.2510.9531.4961.850.4157.5514.91
30 °C-50%27.735.50.6138.589.9939.848.90.6450.8913.1855.9568.580.6566.7017.28
30 °C-80%36.737.90.7542.8411.1048.651.60.7454.7014.1767.0071.890.7472.4318.76
40 °C-20%12.629.30.3034.2312.1822.942.70.3945.2916.1238.2262.670.4560.8921.67
40 °C-50%32.135.60.6342.8415.2544.249.20.6455.0419.5961.4369.240.6570.7225.17
40 °C-80%42.538.20.7747.8517.0354.551.90.7559.5421.1973.4672.550.7377.3027.51
M—Water production amount (kg/h); m—water production efficiency (kg/kWh); Qh—heating power (kW); Qc—cooling capacity (kW); Pc—cooling power (kW).

Appendix F. Comparison of Condensation Parameters

Speed = 12 rph; regeneration temperature = 120 °C; area ratio = 3; intake air volume = 12,000 m3; circulating air volume = 2300 m3.
Surface cooler outlet air temperature = 12 °C, relative humidity = 90%Surface cooler outlet air temperature = 8 °C, relative humidity = 100%
TRHMQhQcPcmTRHMQhQcPcm
15 °C20%19.44 58.97 51.29 8.65 0.29 15 °C20%20.43 61.93 55.37 9.34 0.29
50%45.88 66.49 59.96 10.11 0.60 50%46.96 68.64 63.64 10.73 0.59
80%56.33 69.78 64.21 10.83 0.70 80%57.30 71.92 67.66 11.41 0.69
30 °C20%31.90 61.52 57.77 14.97 0.42 30 °C20%33.01 64.55 61.77 16.00 0.41
50%58.95 69.14 68.05 17.63 0.68 50%59.89 71.43 71.46 18.51 0.67
80%67.42 71.94 72.81 18.86 0.74 80%68.47 73.91 76.31 19.77 0.73
40 °C20%38.60 62.11 61.08 21.74 0.46 40 °C20%40.01 65.30 65.15 23.19 0.45
50%64.28 69.64 72.19 25.69 0.67 50%65.38 71.77 75.73 26.95 0.66
80%73.87 72.52 77.68 27.64 0.74 80%75.03 74.49 81.17 28.89 0.73
T—Dry-bulb temperature (°C); RH—relative humidity (%); M—water production amount (kg/h); m—water production efficiency (kg/kWh); Qh—heating power (kW); Qc—cooling capacity (kW); Pc—cooling power (kW).

References

  1. Lord, J.; Thomas, A.; Treat, N.; Forkin, M.; Bain, R.; Dulac, P.; Behroozi, C.H.; Mamutov, T.; Fongheiser, J.; Kobilansky, N.; et al. Global potential for harvesting drinking waterfrom air using solar energy. Nature 2021, 598, 611. [Google Scholar] [CrossRef] [PubMed]
  2. Li, C.W.; Jiang, D.G.; Huo, B.B.; Ding, M.C.; Huang, C.C.; Jia, D.D.; Li, H.X.; Liu, C.Y.; Liu, J.Q. Scalable and robust bilayer polymer foams for highly efficient and stable solar desalination. Nano Energy 2019, 60, 841–849. [Google Scholar] [CrossRef]
  3. Jaspal, D.; Malviya, A. Composites for wastewater purification: A review. Chemosphere 2020, 246, 11. [Google Scholar] [CrossRef]
  4. Xu, H. Water Harvesting in Ambient Air; University of California: Irvine, CA, USA, 2018. [Google Scholar]
  5. Fathieh, F.; Kalmutzki, M.J.; Kapustin, E.A.; Waller, P.J.; Yang, J.J.; Yaghi, O.M. Practical water production from desert air. Sci. Adv. 2018, 4, 9. [Google Scholar] [CrossRef] [PubMed]
  6. Tu, Y.D.; Wang, R.Z.; Zhang, Y.N.; Wang, J.Y. Progress and expectation of atmospheric water harvesting. Joule 2018, 2, 1452–1475. [Google Scholar] [CrossRef]
  7. Humphrey, J.H.; Brown, J.; Cumming, O.; Evans, B.; Howard, G.; Kulabako, R.N.; Lamontagne, J.; Pickering, A.J.; Wang, E.N. The potential for atmospheric water harvesting to accelerate household access to safe water. Lancet Planet. Health 2020, 4, E91–E92. [Google Scholar] [CrossRef]
  8. Tashtoush, B.; Alshoubaki, A. Atmospheric water harvesting: A review of techniques, performance, renewable energy solutions, and feasibility. Energy 2023, 280, 22. [Google Scholar] [CrossRef]
  9. Peeters, R.; Vanderschaeghe, H.; Rongé, J.; Martens, J.A. Fresh water production from atmospheric air: Technology and innovation outlook. iScience 2021, 24, 21. [Google Scholar] [CrossRef]
  10. Sudarshan, E.; Korra, S.; Rajasekharaiah, K.; Venkatesulu, S.; Harshavardhan, A. IoT based smart solar atmospheric water harvesting system. IOP Conf. Ser. Mater. Sci. Eng. 2020, 981, 042004. [Google Scholar] [CrossRef]
  11. Wikramanayake, E.D.; Bahadur, V. Flared natural gas-based onsite atmospheric water harvesting (AWH) for oilfield operations. Environ. Res. Lett. 2016, 11, 9. [Google Scholar] [CrossRef]
  12. Niu, C.; Zhang, T.; Zhou, Y.; Zhang, K.; Hu, Z.; Wang, Q. Research progress of rotary desiccant air conditioning systems and desiccant materials regenerative performance. Refrig. Air-Cond. 2014, 14, 36–41. [Google Scholar]
  13. Rady, M.A.; Huzayyin, A.S.; Arquis, E.; Monneyron, P.; Lebot, C.; Palomo, E. Study of heat and mass transfer in a dehumidifying desiccant bed with macro encapsulated phase change materials. Renew. Energy 2009, 34, 718–726. [Google Scholar] [CrossRef]
  14. Wang, J.Y.; Wang, R.Z.; Wang, L.W.; Liu, J.Y. A high efficient semi-open system for fresh water production from atmosphere. Energy 2017, 138, 542–551. [Google Scholar] [CrossRef]
  15. Wang, J.Y.; Liu, J.Y.; Wang, R.Z.; Wang, L.W. Experimental investigation on two solar-driven sorption based devices to extract fresh water from atmosphere. Appl. Therm. Eng. 2017, 127, 1608–1616. [Google Scholar] [CrossRef]
  16. Wang, J.Y.; Wang, R.Z.; Tu, Y.D.; Wang, L.W. Universal scalable sorption-based atmosphere water harvesting. Energy 2018, 165, 387–395. [Google Scholar] [CrossRef]
  17. Kim, H.; Rao, S.R.; Kapustin, E.A.; Zhao, L.; Yang, S.; Yaghi, O.M.; Wang, E.N. Adsorption-based atmospheric water harvesting device for arid climates. Nat. Commun. 2018, 9, 8. [Google Scholar] [CrossRef] [PubMed]
  18. Kim, H.; Rao, S.R.; La Potin, M.; Lee, S.; Wang, E.N. Thermodynamic analysis and optimization of adsorption-based atmospheric water harvesting. Int. J. Heat Mass Transf. 2020, 161, 7. [Google Scholar] [CrossRef]
  19. Entezari, A.; Esan, O.C.; Yan, X.H.; Wang, R.Z.; An, L. Sorption-based atmospheric water harvesting: Materials, components, systems, and applications. Adv. Mater. 2023, 35, 60. [Google Scholar] [CrossRef]
  20. Zhou, X.Y.; Lu, H.Y.; Zhao, F.; Yu, G.H. Atmospheric Water Harvesting: A Review of Material and Structural Designs. ACS Mater. Lett. 2020, 2, 671–684. [Google Scholar] [CrossRef]
Figure 1. Working principle of the system. (a) work partition of rotary dehumidifier; (b) air handling process in the system.
Sustainability 16 06193 g001
Figure 2. Air-handling process in the enthalpy–humidity diagram.
Sustainability 16 06193 g002
Figure 3. Computation results under different parameters of inlet air to evaluate (a) the water production amount and (b) the efficiency (details in Appendix A).
Sustainability 16 06193 g003
Figure 4. Water production amount at an inlet air temperature of 40 °C.
Sustainability 16 06193 g004
Figure 5. Water production per unit of energy consumption at an inlet air temperature of 40 °C (details in Appendix B).
Sustainability 16 06193 g005
Figure 6. Calculation results at different rotational speeds.
Sustainability 16 06193 g006
Figure 7. Calculation results at different area ratios to evaluate (a) the water production amount and (b) the efficiency (details in Appendix C).
Sustainability 16 06193 g007
Figure 8. Calculation results at different regeneration temperatures to evaluate (a) the water production amount and (b) the efficiency (details in Appendix D and Appendix E).
Sustainability 16 06193 g008
Figure 9. Calculation results at different airflow ratios to evaluate (a) the water production amount and (b) the efficiency.
Sustainability 16 06193 g009
Figure 10. Calculation results at different airflow ratios with the relative humidity of 50% to evaluate (a) the water production amount and (b) the efficiency.
Sustainability 16 06193 g010
Figure 11. The required heating power at different airflow ratios with different inlet (adsorption) air parameters. (a) RH of 20%, (b) RH of 50%, and (c) RH of 80%.
Sustainability 16 06193 g011
Figure 12. Calculation results at different airflow ratios with the fixed circulating air volume of 2300 m3/h to evaluate (a) the water production amount and (b) the efficiency.
Sustainability 16 06193 g012
Figure 13. Calculation results under various environmental conditions (inlet air parameters) for different surface cooler outlet parameters to evaluate (a) the water production amount and (b) the efficiency (details in Appendix F).
Sustainability 16 06193 g013
Table 1. Test conditions.
ParametersValue
Inlet air temperature23.9 °C
Inlet air relative humidity75%
Outlet temperature from heater112.8 °C
Speed15 rph
Table 2. Operation parameters under different rotational speeds.
Inlet Air Volume
(m3/h)
Circulating Air
Volume (m3/h)
Area Ratio
(Ap/Ar)
Regeneration
Temperature (°C)
Temperature of
State 4 (°C)
Moisture Content of State 4
(g/kg)
12,00023002:1120127.9
Table 3. Operation parameters under different zonal area ratios.
Inlet Air VolumeCirculating Air VolumeRotational SpeedRegeneration TemperatureInlet Air TemperatureTemperature of State 4Moisture Content of State 4
(m3/h)(m3/h)(rph)(°C)(°C)(°C)(g/kg)
12,0002300812030127.9
Table 4. Operation parameters under different regeneration temperatures.
Inlet Air VolumeCirculating Air
Volume
Rotational
Speed
Area RatioTemperature of
State 4
Moisture Content of
State 4
(m3/h)(m3/h)(rph)(Ap/Ar)(°C)(g/kg)
12,000230082:1127.9
Table 5. Operation parameters under different airflow ratios.
Speed
(rph)
Area Ratio
(Ap/Ar)
Regeneration Temperature (°C)Temperature of
State 4 (°C)
Moisture Content of
State 4 (g/kg)
82:1120127.9
Table 6. Operation parameters for the calculations.
Inlet Air VolumeCirculating Air VolumeSpeedArea RatioRegeneration Temperature
(m3/h)(m3/h)(rph)(Ap/Ar)(°C)
12,000230082:1120
Disclaimer/Publisher’s Note: The statements, opinions and data contained in all publications are solely those of the individual author(s) and contributor(s) and not of MDPI and/or the editor(s). MDPI and/or the editor(s) disclaim responsibility for any injury to people or property resulting from any ideas, methods, instructions or products referred to in the content.

