Article

Bibliometric Analysis of Remote Sensing over Marine Areas for Sustainable Development: Global Trends and Worldwide Collaboration

by
Ljerka Vrdoljak
1,*,
Ivana Racetin
2 and
Mladen Zrinjski
3
1
Hydrographic Institute of the Republic of Croatia, 21000 Split, Croatia
2
Faculty of Civil Engineering, Architecture and Geodesy, University of Split, 21000 Split, Croatia
3
Faculty of Geodesy, University of Zagreb, 10000 Zagreb, Croatia
*
Author to whom correspondence should be addressed.
Sustainability 2024, 16(14), 6211; https://doi.org/10.3390/su16146211 (registering DOI)
Submission received: 5 June 2024 / Revised: 14 July 2024 / Accepted: 17 July 2024 / Published: 20 July 2024
(This article belongs to the Special Issue Pollution, Toxicology and Sustainable Solutions in Aquatic System)

Abstract

:
More than two-thirds of the Earth’s surface is covered by oceans and yet only a small portion of these oceans has been directly explored in detail, highlighting the need for powerful tools like remote sensing (RS) technology to bridge this gap. International frameworks, the 2030 Agenda for Sustainable Development, and Ocean Decade point out the significance of marine areas for achieving sustainable growth. This study conducts a bibliometric analysis of RS over marine areas for sustainable development to identify key contributors, collaboration networks, and evolving research themes from the beginning of the 21st century until last year. Using the Web of Science Core Collection database, 499 relevant articles published between 2000 and 2023 were identified. The bibliometric analysis showed a significant increase in scientific productivity related to the field. On an international level, China emerges as the most productive country, but international collaboration has played a crucial role, with 36.87% of articles resulting from international co-authorship, pointing to the global nature of research in this field. RS technology has continuously evolved from airborne sensors to the augmentation of Earth Observation missions. Our findings reveal a shift towards automated analysis and processing of RS data using machine learning techniques to integrate large datasets and develop robust scientific solutions.

1. Introduction

The Earth is often referred to as the “blue planet” due to the oceans and seas covering over 70% of the planet’s surface [1]. Yet, only a fraction, less than 25%, of these expansive marine areas have been directly mapped with high resolution [2]. Compared to terrestrial landscapes that are mainly visible, the world below the ocean surface presents unique challenges for mapping and exploration [3].
The international community, led by the United Nations (UN), has recognized the importance of oceans for sustainable development (SD). The United Nations Convention on the Law of the Sea (UNCLOS) [4], dating from 1982, is today accepted by more than 160 nations worldwide. Apart from clearly defining maritime zones and boundaries, UNCLOS outlines national rights and responsibilities regarding the exploitation of marine resources. This includes protection and preservation of the marine environment and marine spatial planning, which underpins the concept of blue growth [5,6].
In 2015, the UN adopted the 2030 Agenda for Sustainable Development [7]. This plan aims to eliminate poverty and hunger and protect the planet through the sustainable use of resources. The agenda encourages strong cooperation between countries under the umbrella of 17 Sustainable Development Goals (SDGs). The UN SDGs succeeded the Millennium Development Goals. The Millennium Development Goals were established in 2000 and remained in effect until 2015, when the Agenda took their place [8]. Overall, the SDGs provide a framework for addressing global challenges and promoting SD across various sectors, including the marine environment.
In 2021, we entered the United Nations Decade of Ocean Science for Sustainable Development, focused on leveraging ocean science to develop innovative solutions contributing to SD (referred to as the Ocean Decade) [9]. Currently, ten active challenges aim to enhance our understanding of ocean ecosystems, model the impacts of rapid climate change on marine and coastal areas, reduce ocean pollution and acidification, mitigate hazard risks, promote the sustainable use of oceans, and support the development of coastal areas. These challenges complement the UN SDGs, particularly SDG 14: Life Below Water, and SDG 13: Climate Action.
The International Hydrographic Organization (IHO) plays a crucial role in ensuring the safety of navigation and promoting SD in marine areas. Through initiatives such as the S-100 Universal Hydrographic Data Model, which provides a standardized framework for hydrographic data exchange and interoperability, the IHO facilitates data and knowledge sharing [10].
Remote sensing (RS) technology has become a powerful tool for exploring and monitoring ocean and coastal areas [11,12]. Satellites and other platforms enable discoveries over vast ocean regions that would otherwise remain unrevealed [13]. Compared to in situ measurements, RS offers numerous advantages. RS technology, especially when using satellites as platforms (Earth Observation, EO), is cost-effective, providing extensive spatial data coverage at low costs and continuous performance, which is of great importance for remote and hard-to-reach areas [14].
Despite the advantages of and the progress made in RS technology and techniques [15], our knowledge of marine areas is limited. For instance, some extraterrestrial bodies are mapped with greater detail and resolution than Earth’s oceans [16]. While outer-space research and programs receive substantial funding and international attention, the importance of funding marine research should be even more recognized. Oceans play a crucial role in regulating Earth’s climate, provide habitat for marine life, contribute to global biodiversity, and are a source of numerous resources for human society, including food, minerals, and energy.
With the digitization of scientific publications and the development of large databases like Web of Science, Scopus, and Google Scholar, there are more digital data available for analysis than ever before [17]. Bibliometric analysis is an increasingly popular method for exploring and analyzing large collections of data by systematically analyzing publication metadata [18]. Using quantitative techniques, researchers can identify various statistics related to research constituents and perform science mapping. A significant number of user-friendly programs or applications, such as VOSviewer [19] or Bibliometrix [20], have contributed to the rapid growth of bibliometric analyses in all scientific fields. Several studies have performed bibliometric analyses related to different uses of RS: in general [21], over marine areas [22,23], for achieving UN SDGs [24], or for achieving specific targets related to the SDGs established in 2015 [25,26].
Despite the advancements in RS technology and techniques applied to marine areas as well as the importance of oceans for SD, a comprehensive bibliometric analysis in this domain remains absent. In this paper, we present a bibliometric analysis of RS research over marine areas for SD, focusing on key contributors, collaboration networks, and the development of research themes over time. The objective of this study was to identify emerging trends, potential barriers, and research gaps in achieving global SD based on ocean RS research.
To achieve this goal, we addressed the following research questions:
  • How have trends and challenges in RS research of marine areas for SD evolved?
  • Who are the key contributors to this research field?
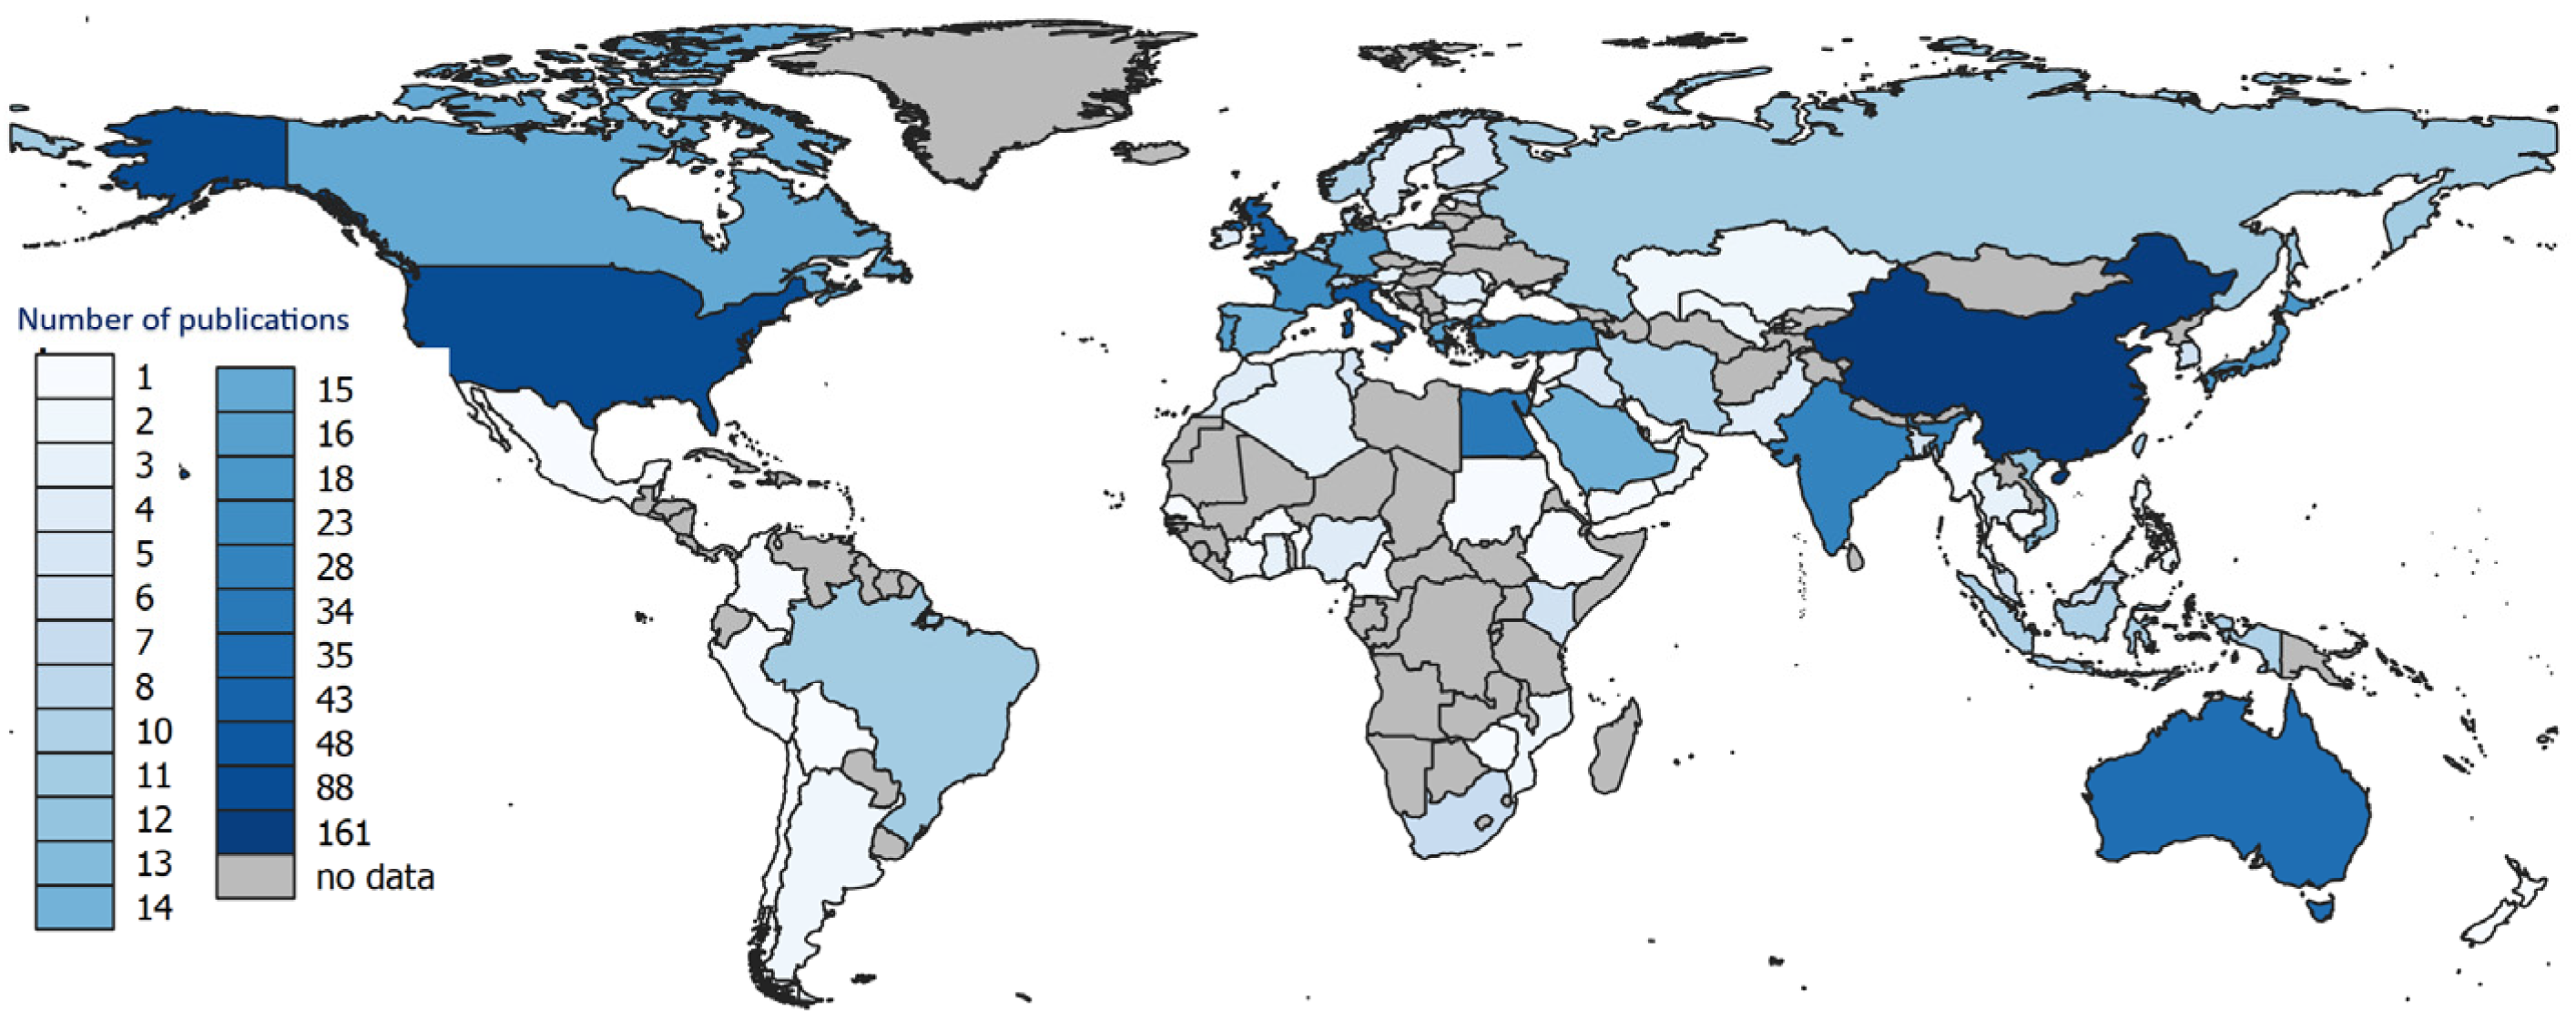
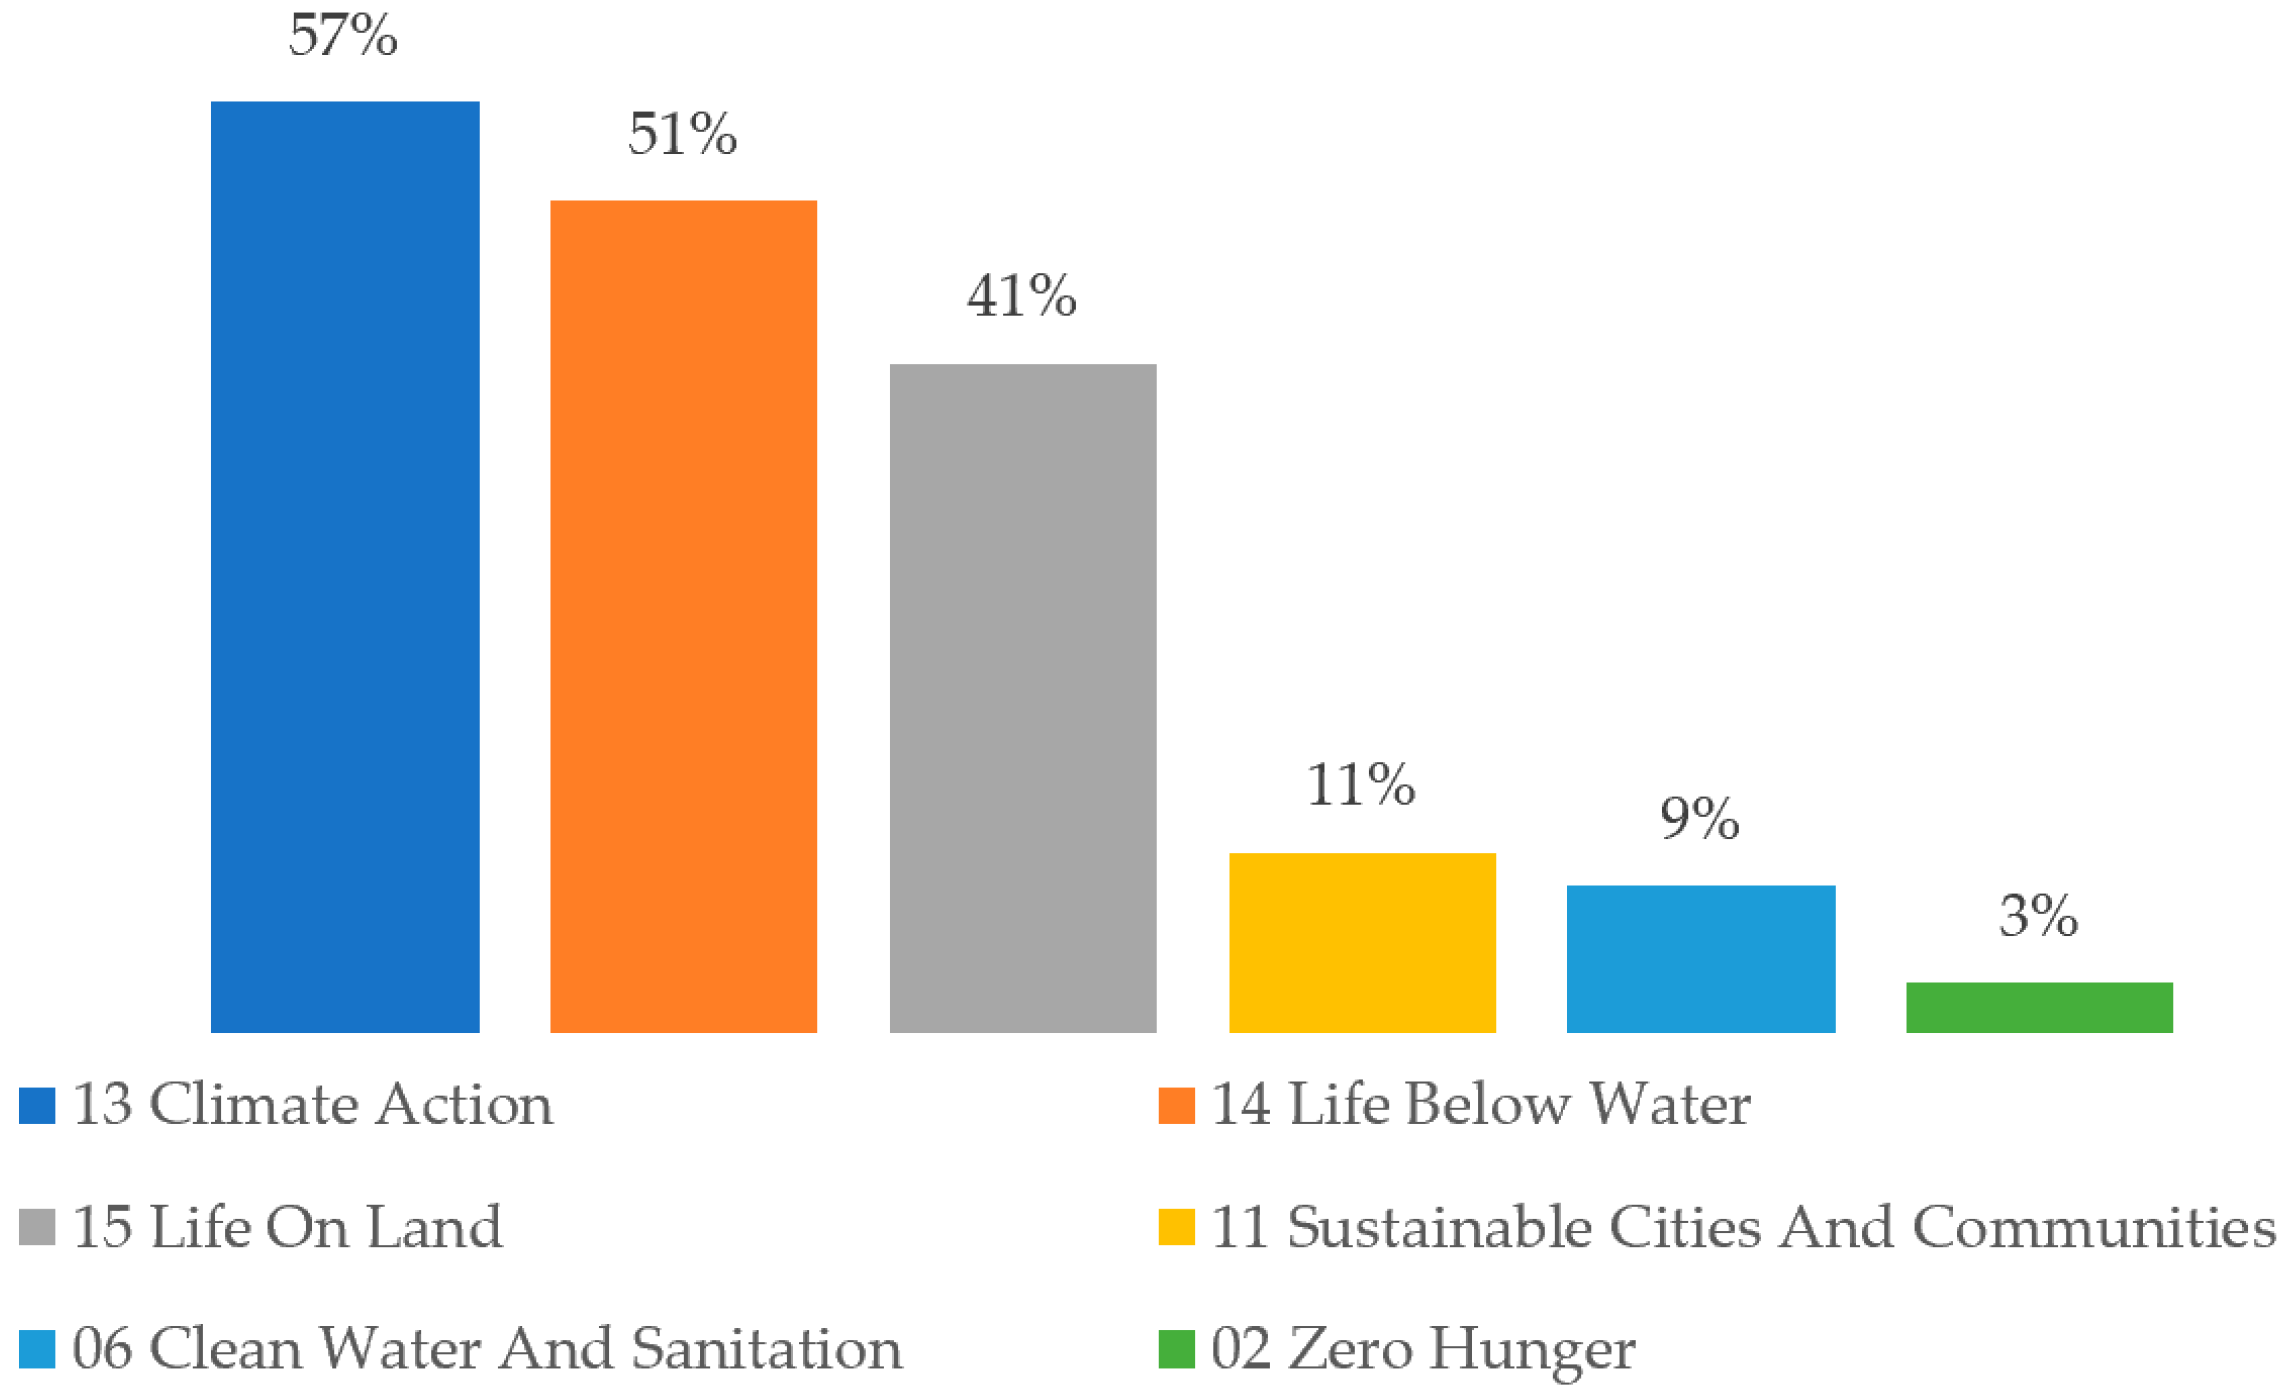
  • Does the geographic distribution of RS research in marine areas influence the global achievement of the goal of SD?

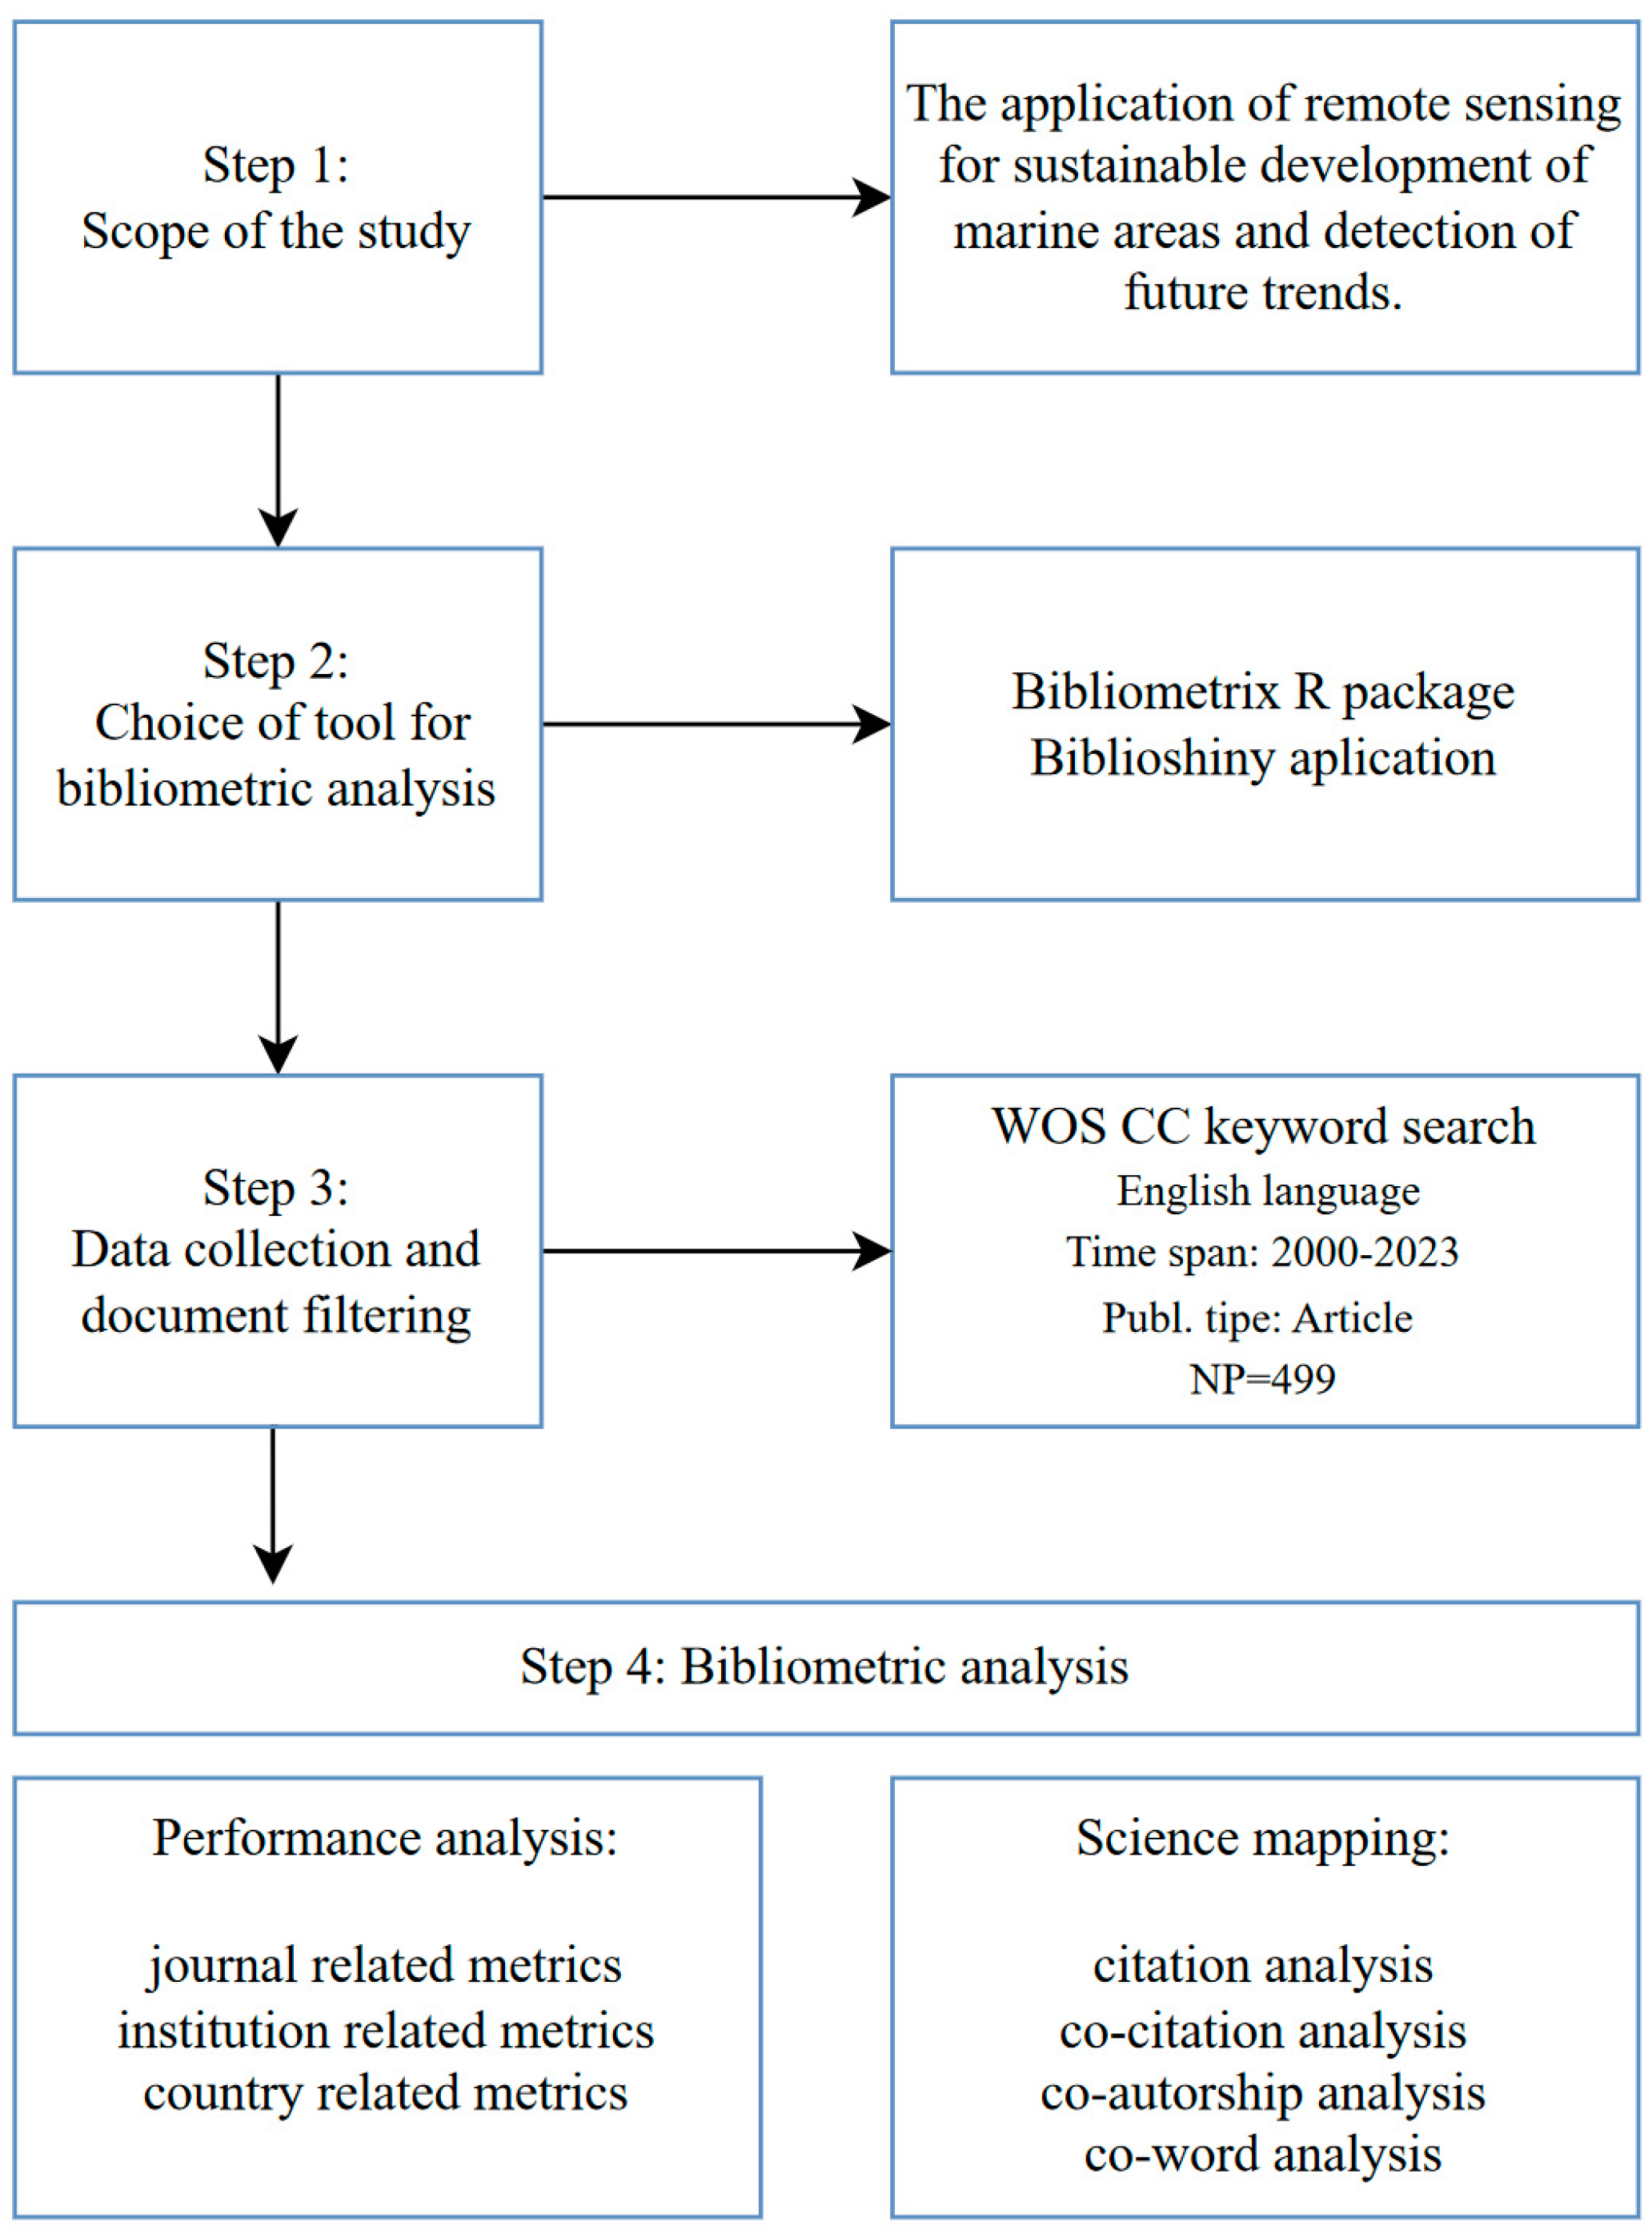
2. Materials and Methods

In this study, a bibliometric analysis was conducted, which encompassed a systematic analysis of metadata from a large volume of scientific publications related to the use of RS over marine areas for SD. This analysis aimed to explore the development of scientific themes, identify key contributors to the field, and analyze worldwide collaboration patterns. Bibliometric methodologies and techniques for performance analysis and scientific mapping, which apply quantitative methods to bibliometric data, were adopted [18]. A procedure proposed by Donthu et al., 2021 [18], was adopted (Figure 1).
Firstly, the scope of the study was defined as the use of RS over marine areas for SD, the detection of research themes and future trends, and cooperation networks.
There is a variety of publicly available software for bibliometric analyses today [27]. In the second step, the open-source software Bibliometrix R-package, version 4.3.0 [20] and the practical web application Biblioshiny [28] were chosen to perform the analysis. Our analysis included metrics related to sources, authors, and documents, as well as an analysis of the conceptual, intellectual, and social structure of knowledge.
The third step involved choosing relevant publications related to the use of RS techniques over marine areas for SD.
Thomson Reuters’ Web of Science (WoS) and Elsevier’s Scopus are considered the two main bibliographic databases [29,30]. To avoid any difficulties in merging two databases for bibliometric analysis, we opted for a single database, following the recommendation given in [18]. WoS is considered to have a better journal classification system [31], and many authors dealing with bibliometric analyses find WoS to be preeminent, e.g., [25,32].
The WoS Core Collection (WoS CC) database was selected as the data source for analysis. For the topic search (TS), keywords related to research about RS over marine areas for SD were chosen. The following query was employed: [TS = ((“remote sensing” OR “Earth Observation”) AND (“sustainab*”) AND (“marine” OR “ocean” OR “sea”))].
RS and EO are frequently used as synonyms. However, EO usually refers to RS employing satellites as observing platforms [33]. To encompass all terms related to sustainable solutions, the term “sustain*” with an asterisk (*) was used, to represent none or one or more characters in the search query.
The initial query yielded 662 publications. A check of the results from WoS CC revealed that only one article was relevant to our research topic before the year 2000. Consequently, the search was focused on publications from the period between 2000 and 2023. Initial results were filtered, with the time range defined from 2000 to 2023. Only articles written in English were considered. A total of 499 articles were identified for bibliometric analysis, and metadata were downloaded on 2 May 2024. The main information about the collected data is summarized in Table 1.
The fourth and final step was the bibliometric analysis, which was performed using the Bibliometrix application called Biblioshiny. In a performance analysis, the performance of research constituents was analyzed using journal, institution, and country-related metrics. Science mapping was performed by applying science mapping techniques, including citation analysis, co-citation analysis, co-authorship analysis, and co-word analysis. Citation analysis and co-citation analysis are bibliometric techniques used to analyze the intellectual structure of knowledge. Citation analysis identifies the most influential works in a research field, with the number of citations reflecting their impact. Co-citation analysis focuses on publications that are cited together, assuming them to be thematically similar. This enables the discovery of thematic clusters. Co-word analysis examines the content of publications, often focusing on the author’s keywords, and helps reveal the conceptual structure of knowledge. Changes in the frequency of different terms or concepts can indicate research trends. Co-authorship analysis, on the other hand, examines the social structure and collaboration patterns between research constituents.

3. Results

The results of the bibliometric analysis conducted on the data collected from the WoS CC query using keywords related to RS, marine areas, and SD are presented in the following chapter.

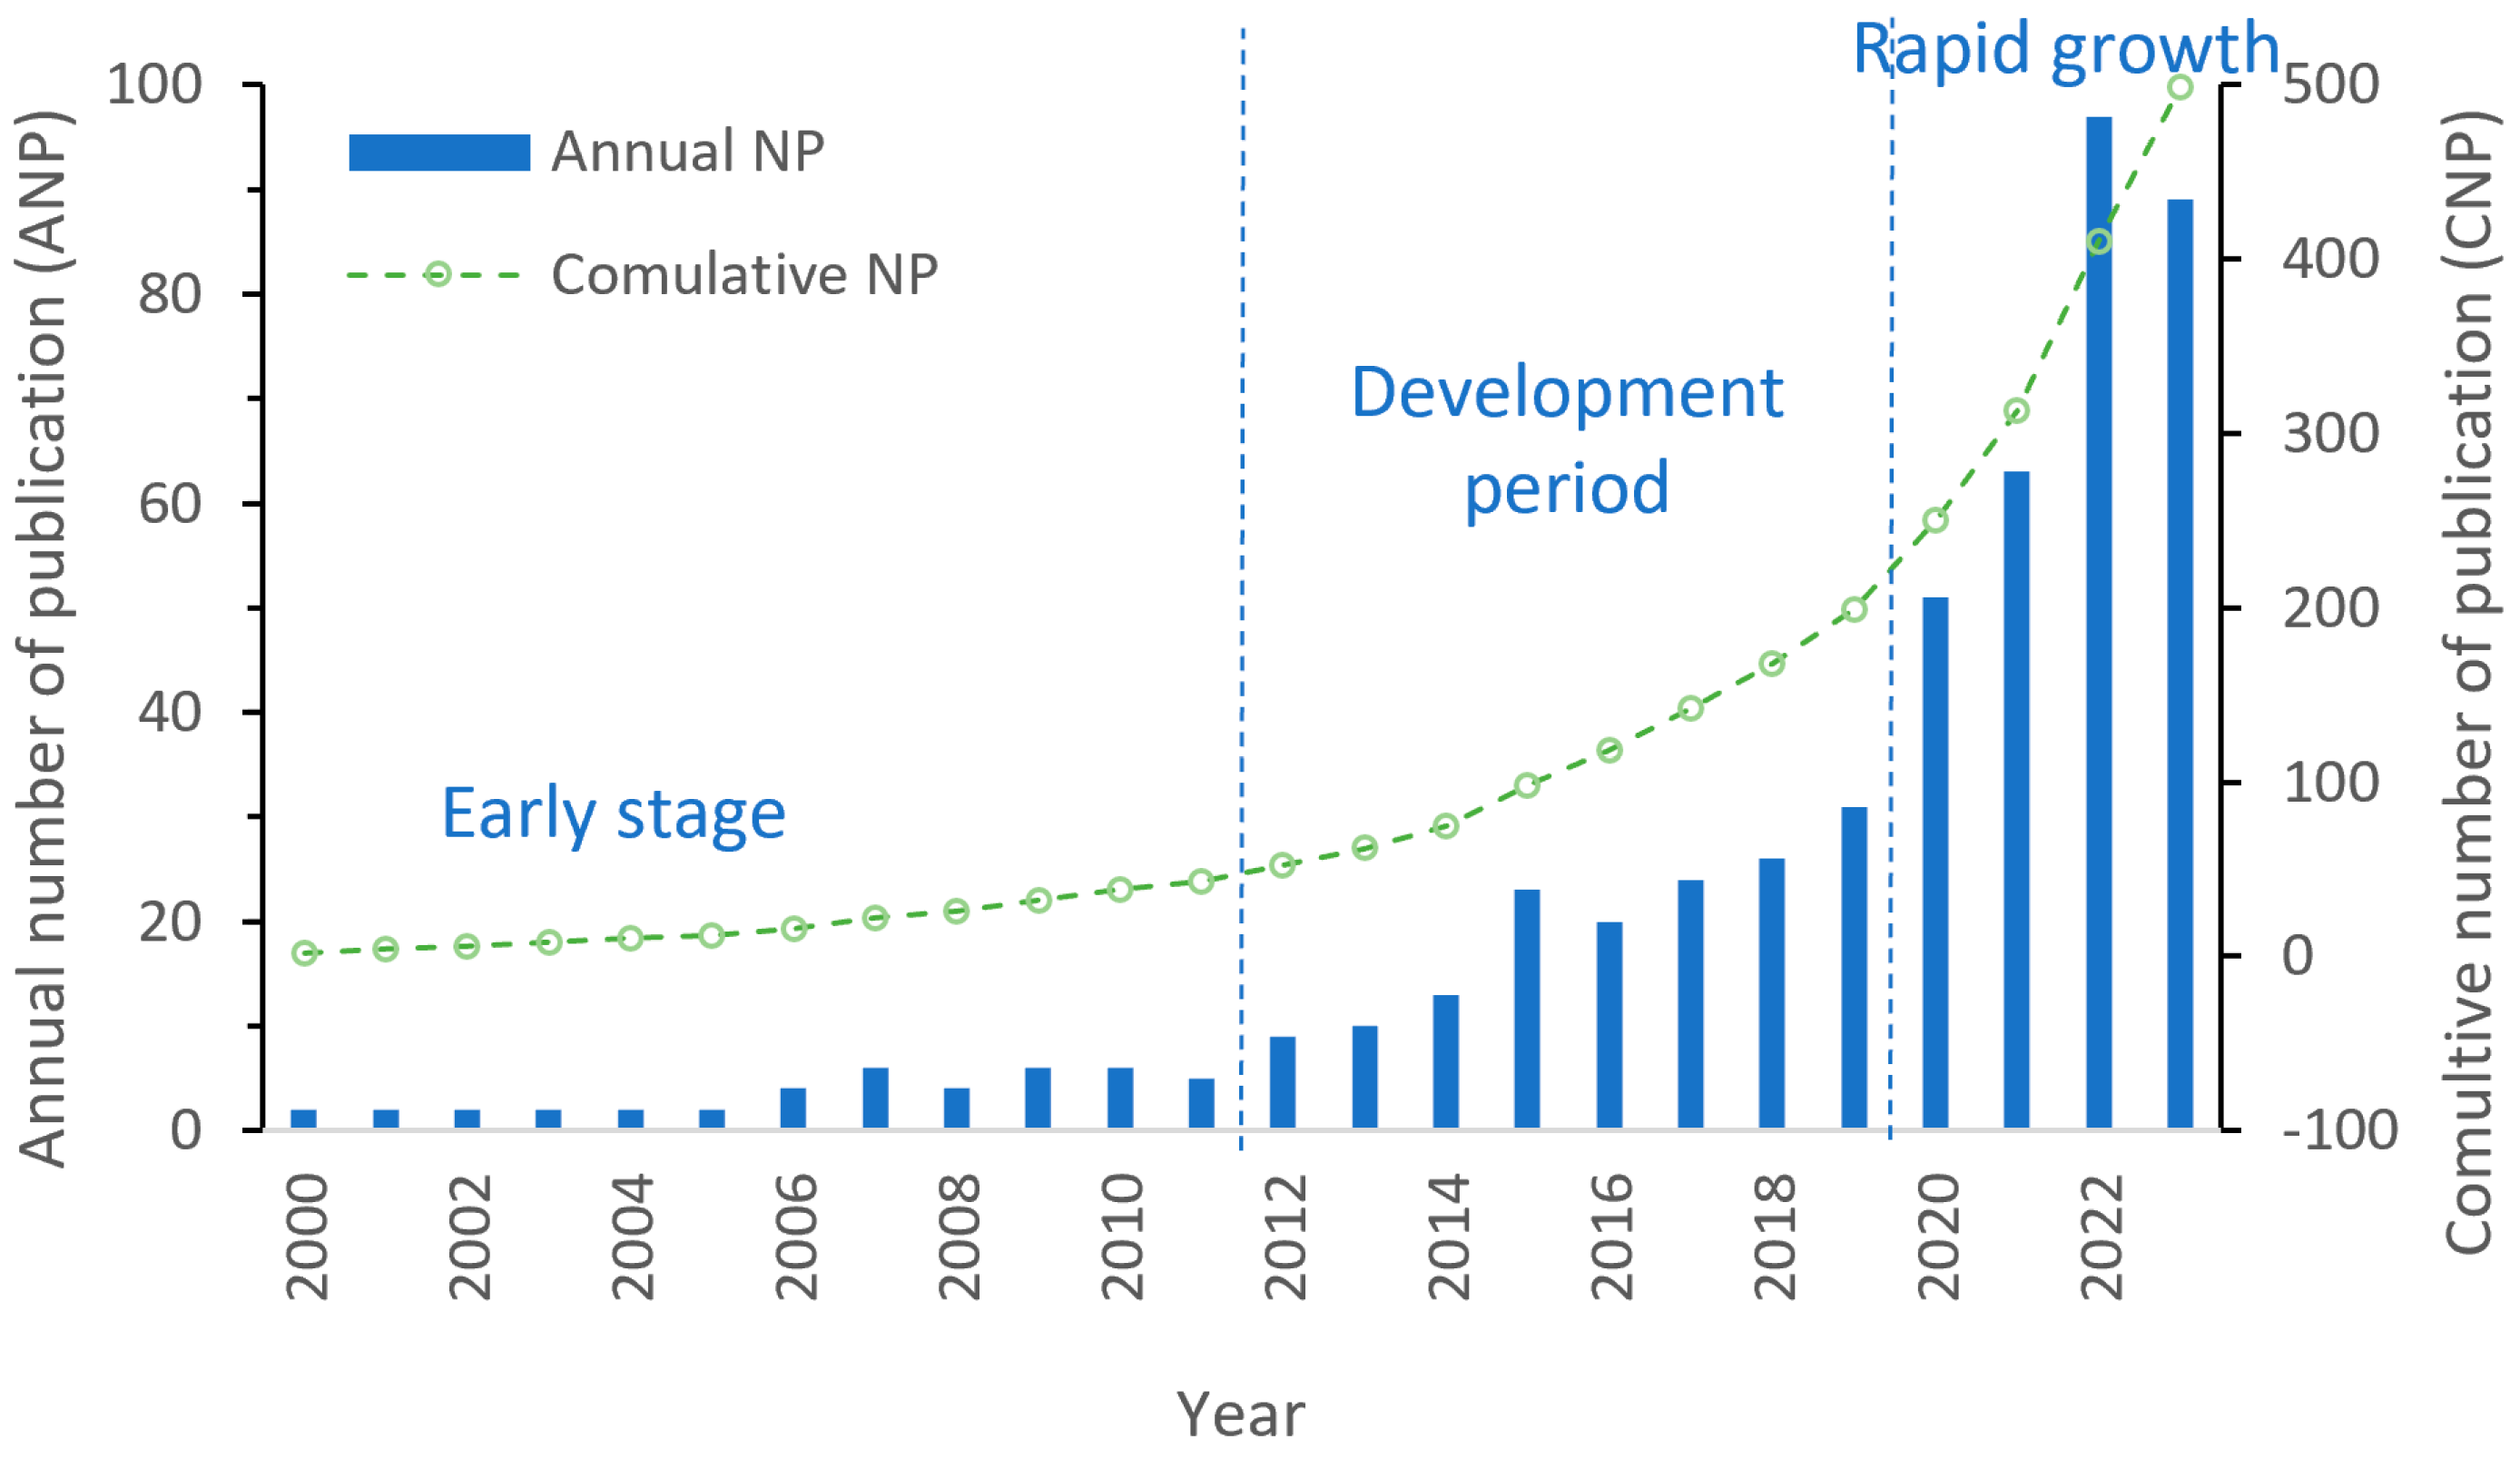
3.1. Scientific Productivity Trends

A simple quantitative measure of publication productivity reflects the level of academic interest and activity in a specific field over time [34]. According to the WoS CC database, there was only one article related to our TS published before 2000: Kozoderov, 1995 [35], which emphasizes the necessity for enhancing or making EO systems more cost-effective. Consequently, the WoS CC data collection was filtered to include only original research articles published within the time range of 2000 to 2023 and written in English. The cumulative number of publications obtained for this period amounted to 499. The annual growth rate of published articles, at 17.94%, indicates a growing interest from the scientific community in this subject. The publication trends are illustrated in Figure 2.
From 2000 to 2011, during the Early Stage, an average of 3.5 articles were published per year, with little interest from the scientific community in the subject. From 2012 to 2019, an average of 19.5 articles were published per year. This period is noted as the Development Period, as scientists gained interest in ocean RS for SD. From 2020 to 2023, in just four years, a total of 300 articles were published, which is more than 60% of the overall number of articles, denoting RS as an important, state-of-the-art technique for monitoring and exploring the oceans and seas to achieve sustainable growth and use.
Here, the productivity of different research constituents (journals, institutions, countries) is analyzed by employing related metrics.
The WoS CC data collection of 499 articles is published in 215 journals, but 64% of journals have published only 1 paper on the subject in a 24-year period. The top 10 journals that published 27% of the total number of publications are listed in Table 2. Remote Sensing published the most articles on the subject (44), followed by Sustainability in second place with 24 published articles, then Ocean & Coastal Management, Science of the Total Environment (16), Environmental Monitoring and Assessment (14), etc. It was to be expected that journals Remote Sensing and Sustainability would publish the most publications and be the most productive as their focus targets are remote sensing techniques and challenges relating to sustainability. Although Remote Sensing of Environment ranks 10th in terms of total publications, it has the highest impact factor (13.5) and the second-highest number of citations (508), just behind Remote Sensing with 518 citations. Remote Sensing of Environment, Science of the Total Environment, and Ocean & Coastal Management, all published by Elsevier Science, emerge as the top three most influential journals in the field of RS of marine areas for SD based on impact factor.
The bibliometric analysis revealed that 1148 institutions worldwide have published papers related to ocean RS for SD, with the top 10 most productive institutions accounting for 50% of the articles. Among these top 10 institutions, only one, the National Authority for Remote Sensing and Space Sciences (Egypt), is not from China. The most productive institution publishing papers on the defined research subject is the University of the Chinese Academy of Sciences, with 42 published articles, followed by Nanjing University (33), the Institute of Geographic Sciences and Natural Resources Research (31), etc. (Table 3).
While the performance analysis of institutions suggested significant interest and productivity among Chinese researchers in utilizing RS techniques over marine areas for SD, the distribution of published articles across different countries allows for a quick assessment of each country’s contribution (see Figure 3).
Worldwide, countries have published a cumulative sum of 885 articles. However, the contribution of different countries is uneven, with 31% of countries publishing only one research paper, while the top 10 countries published an average of 44.5% of articles over 24 years (see Table 4). China emerges as the most active and productive country, accounting for the highest number of published papers (19%), followed by the USA (10%), Italy (5%), the UK (5%), and Australia (4%).

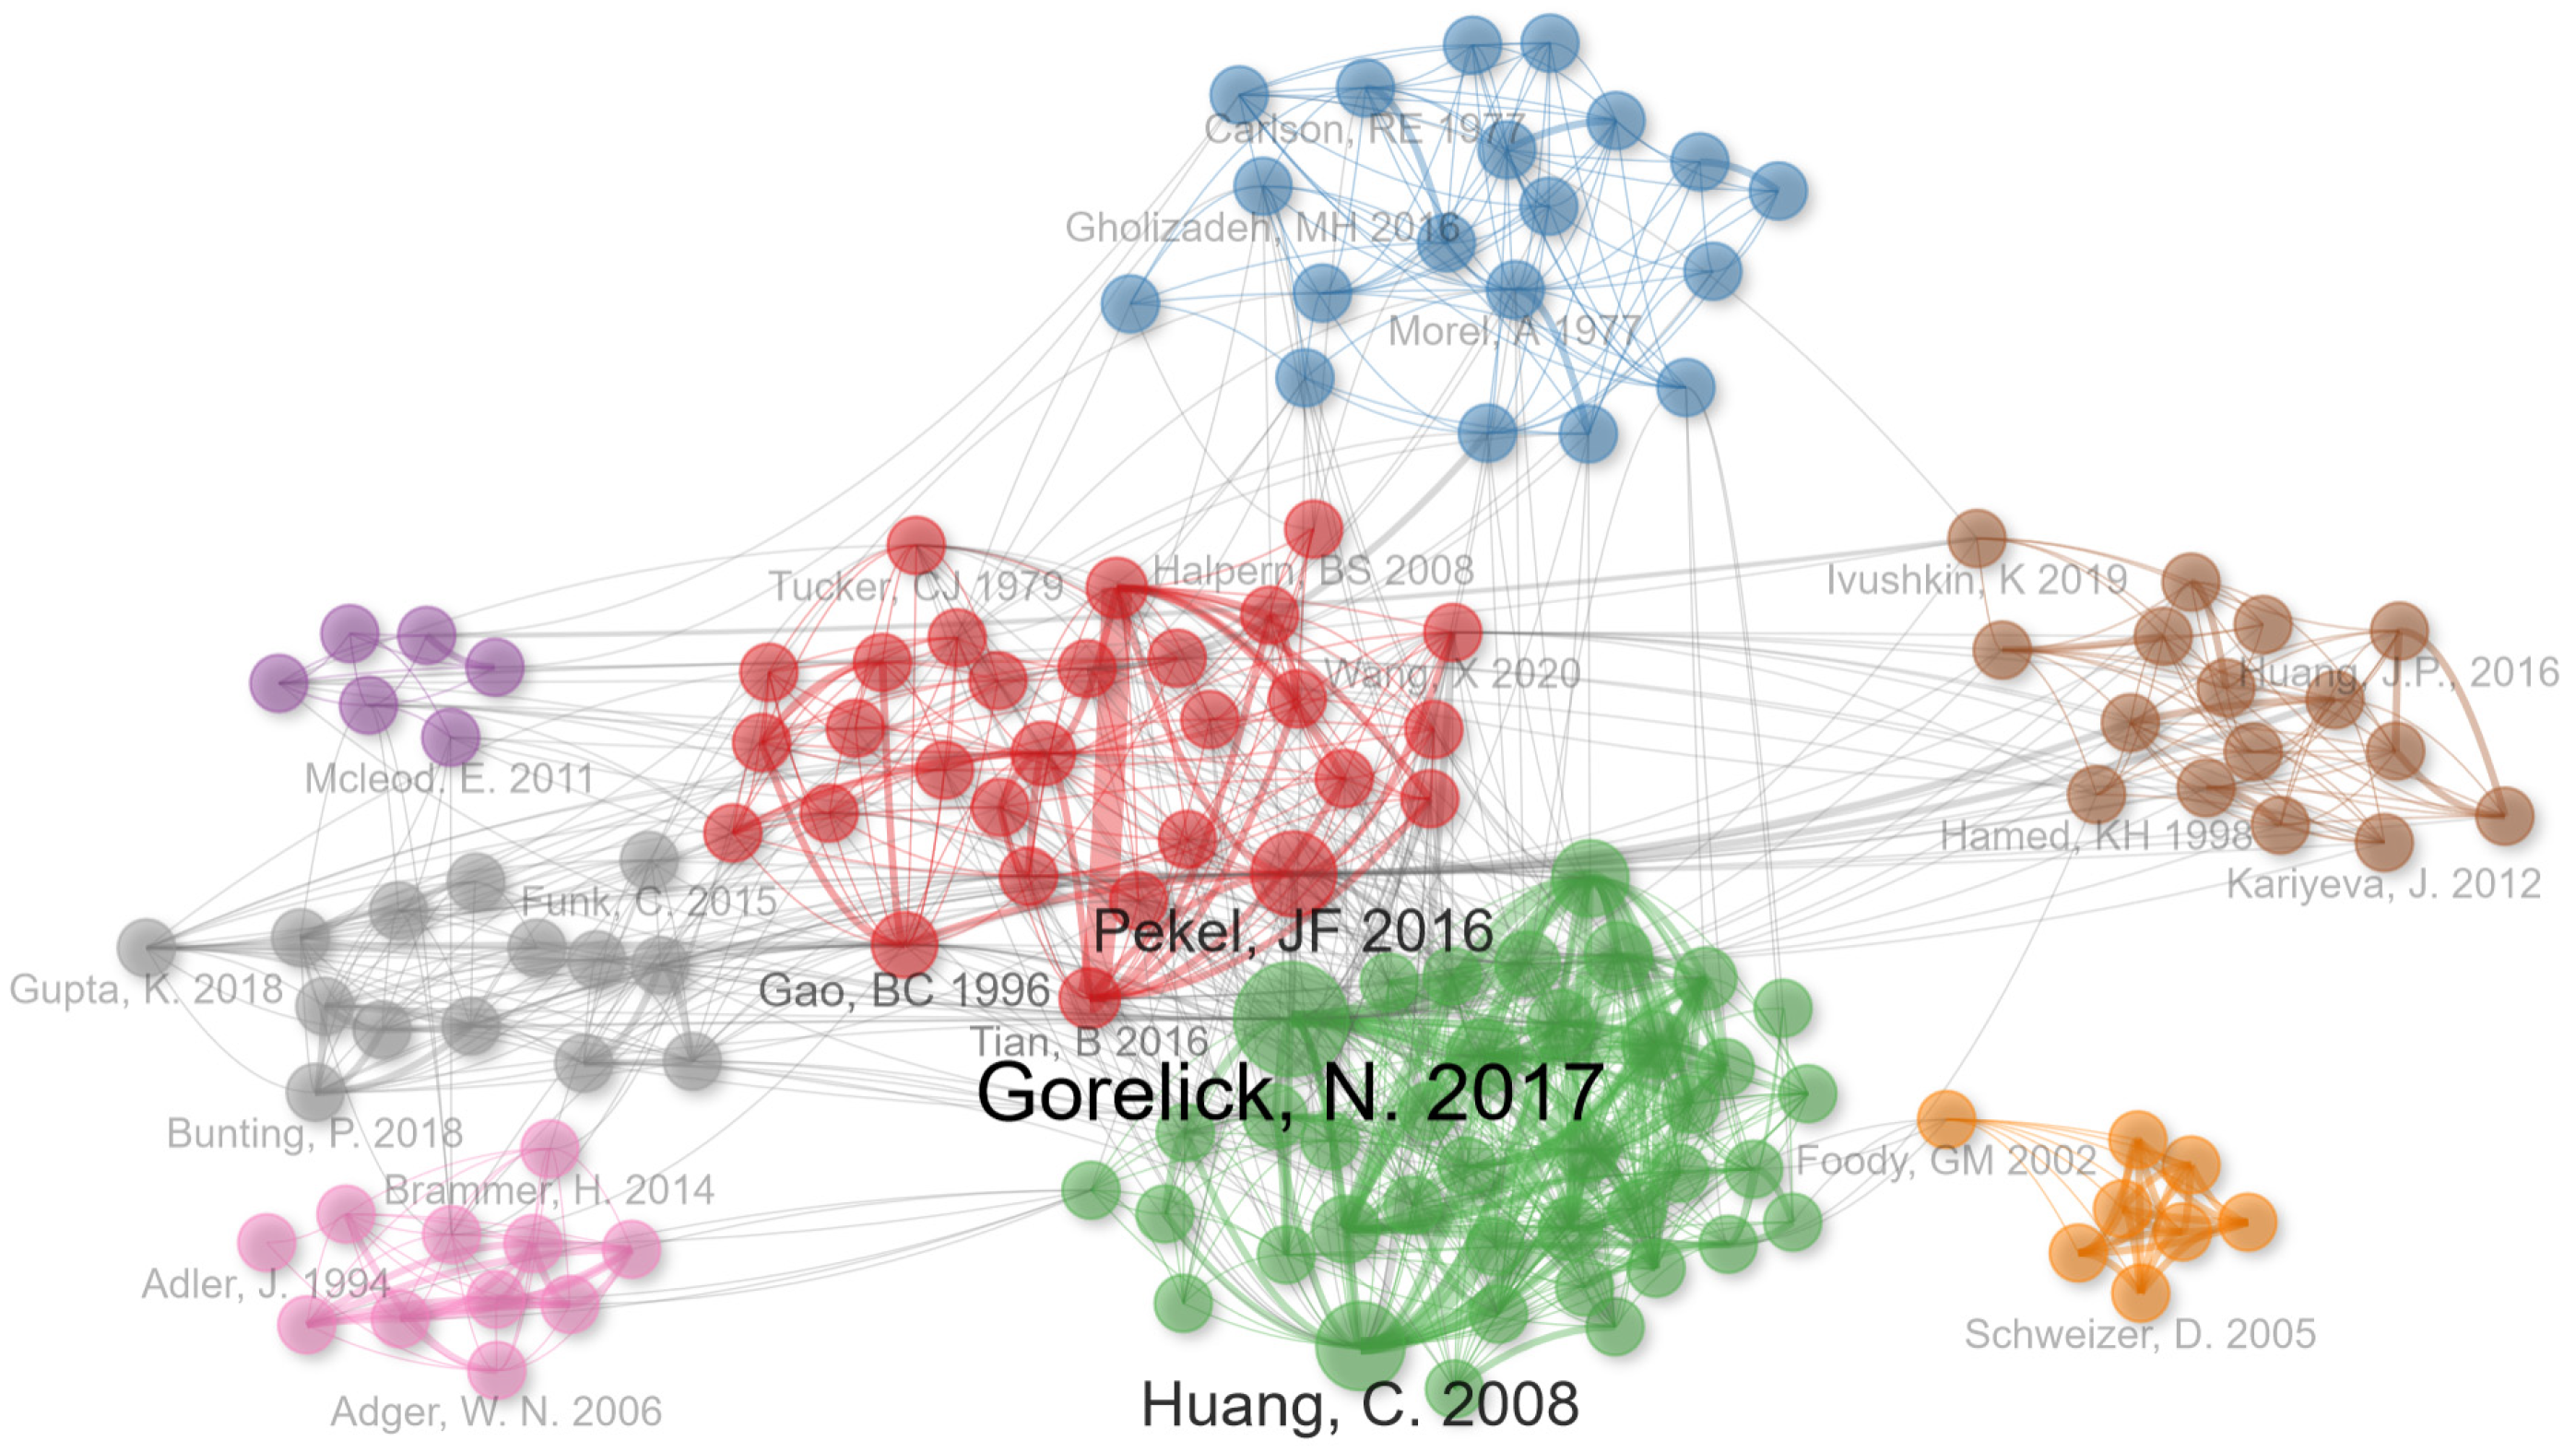
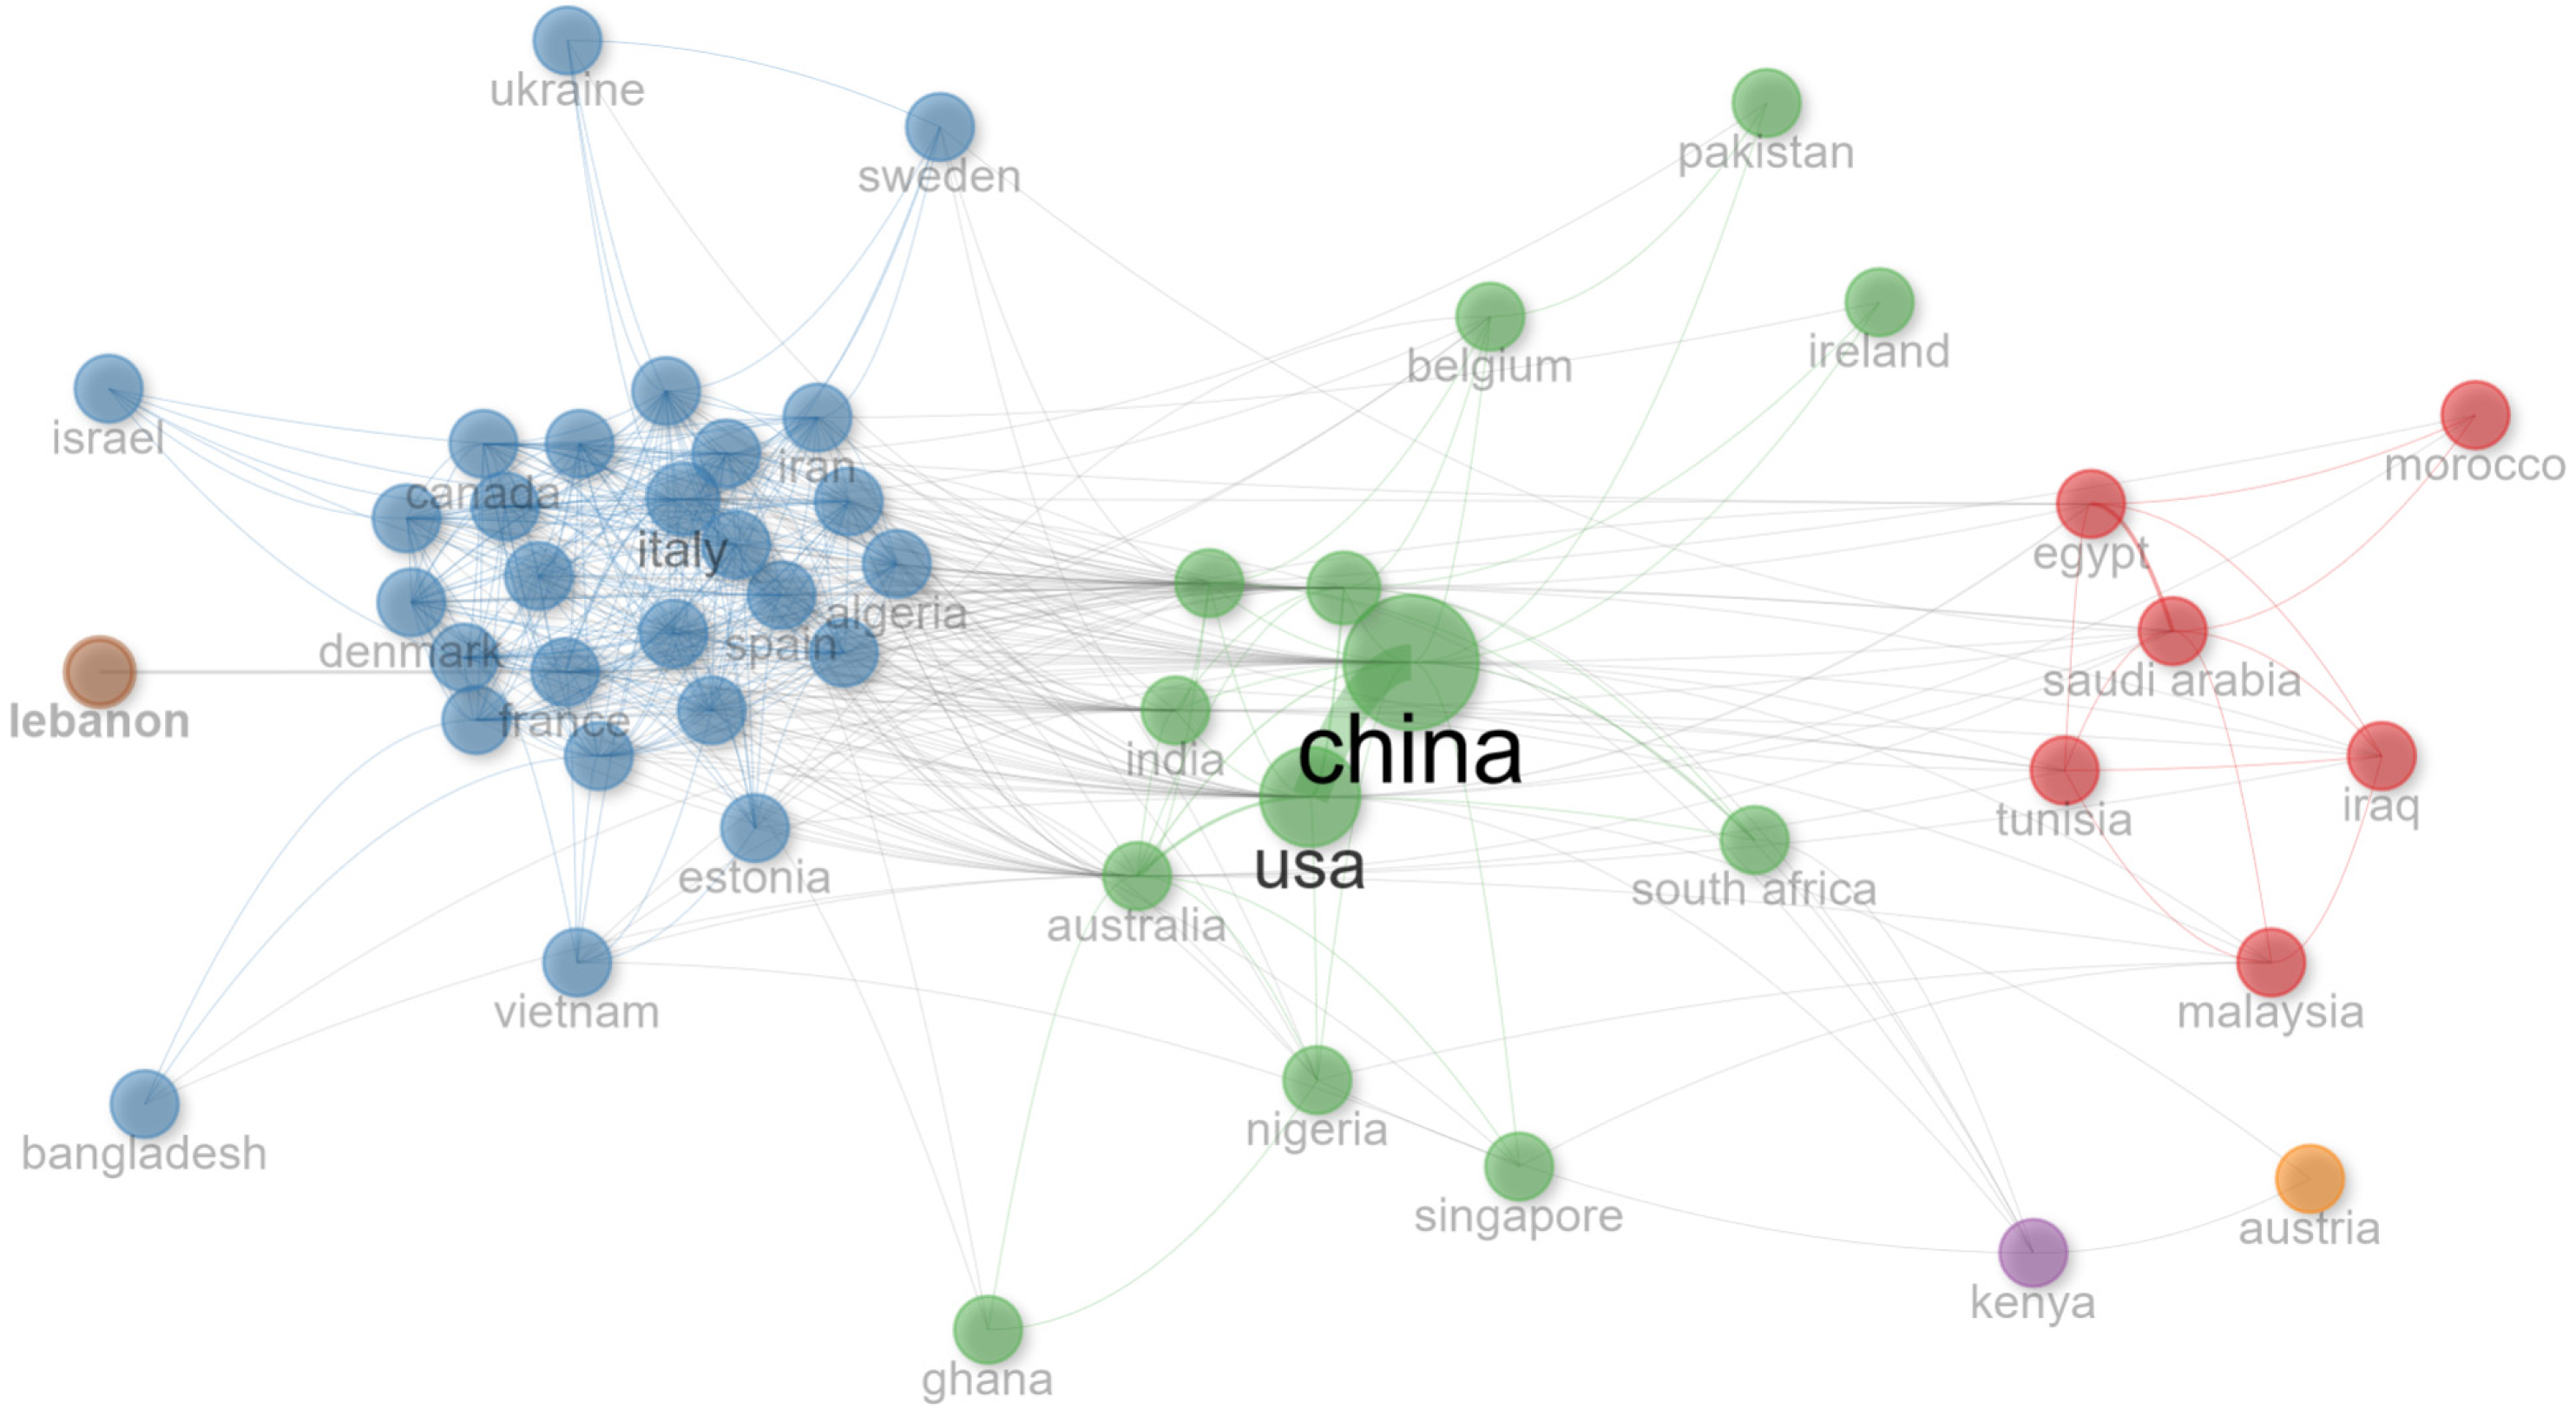
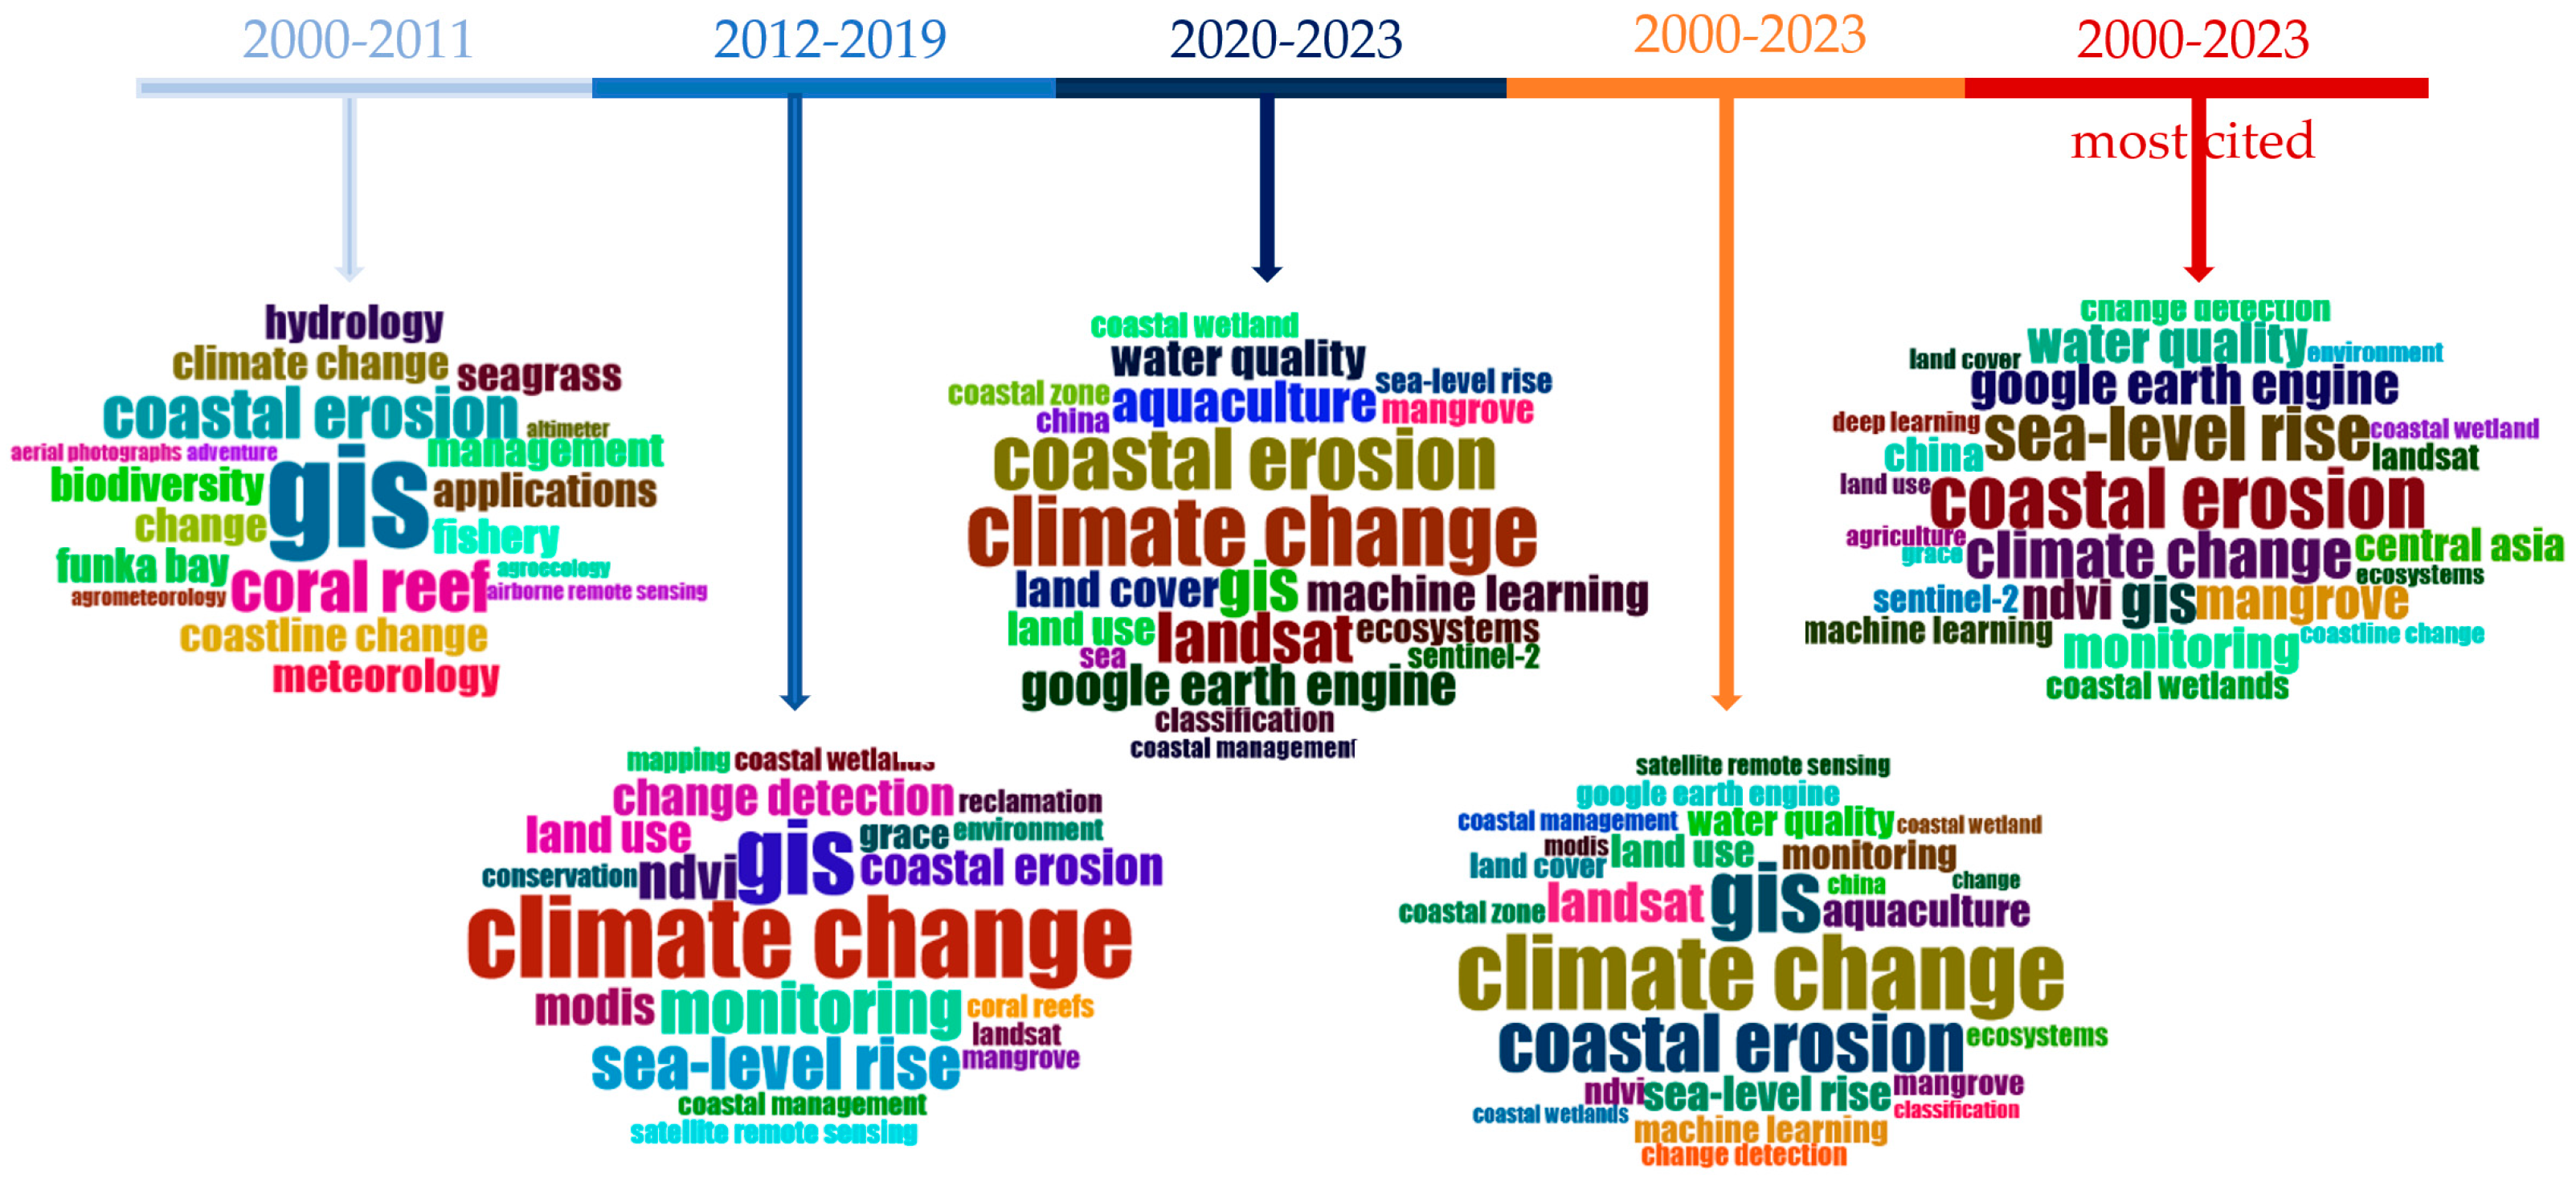
3.2. Science Mapping

A citation analysis is a simple but effective tool for measuring the impact of a research constituent (e.g., publication, author, institution, country). The impact is proportional to the number of citations [18]. Our bibliometric analysis discovered 499 articles matching the query from the WoS CC database with an average citation per article of 18.97. The top 10 global cited articles, spanning 2000–2023, are hereby presented in Table 5.
Based on the number of citations as a metric of influence, the most notable is Carr’s research paper [36] entitled “Estimation of Potential Productivity in Eastern Boundary Currents using Remote Sensing” published in 2001 in Deep-Sea Research Part II: Topical Studies in Oceanography, with total of 349 citations. This study used EO data from the first 24 months of the Sea-Viewing Wide Field of View Sensor, SeaWiFS to estimate potential primary production, the process by which marine organisms, primarily phytoplankton, produce organic matter through photosynthesis using sunlight, water, and carbon dioxide [46], in four Eastern boundary currents. The most recent article on the top-ten list is the third paper [38], published in 2017 in the ISPRS Journal of Photogrammetry and Remote Sensing, with 258 citations. Titled “A mangrove forest map of China in 2015: Analysis of time series Landsat 7/8 and Sentinel-1A imagery in Google Earth Engine cloud computing platform”, it explores a new classification algorithm for mapping mangrove forests in China using EO data and a cloud-based platform developed by Google for planetary-scale environmental data analysis and visualization. The focal themes of these top 10 papers cover different RS applications: the estimation of oceanographic parameters, pollution detection, risk and disaster management, mapping biodiversity and natural resource management, coastal change monitoring, and sustainable planning of marine areas and coastal zones.
A co-citation analysis of the references from articles with a minimum of three citations per year revealed eight thematic clusters (Figure 4).
The first cluster (red) consists of 19 publications that focus on the use of RS technology to monitor and analyze environmental changes, including water bodies [47], coastal wetlands [48], and vegetation [49,50]. These studies typically apply specific indices such as the Normalized Difference Water Index (NDWI) [49] or the Normalized Difference Vegetation Index (NDVI) [50] and use mapping techniques to interpret RS data.
Researchers in the second cluster (blue), which also comprises 19 publications, are centered around the studies in [51,52]. They focus on the RS of oceans using satellite images, including the estimation of the primary production of oceans, in order to understand the overall health of marine ecosystems.
The third cluster (green) has 39 publications and introduces automated procedures for analyses of RS data, as well as applications for the manipulation and analysis of big data for environmental mapping based on EO data [53,54]. The next two clusters are smaller ones with under 10 articles.
The fourth cluster (purple) has only six publications, mainly related to climate change [55].
The fifth cluster (orange) consists of eight publications centered around the study in [56], and these focus on biodiversity and conservation.
Researchers in the sixth cluster (brown), which includes 16 publications, focus on EO for environmental monitoring [57].
The seventh cluster (pink) has 11 publications focused on aspects related to environmental change and its impacts on a regional or global scale [58,59].
The last cluster (gray) has 14 articles, presenting research interested in monitoring and understanding climate extremes, particularly in regions vulnerable to climate hazards [60,61,62].
National cooperation is a vital component and plays a big role in achieving SD in every aspect of our planet. From the data collection of 499 papers retrieved from WoS CC, 36.87% of them are the product of international co-authorship. A co-authorship analysis related to cooperation between countries is visualized in Figure 5. The lines depicted in Figure 5 denote the collaborative efforts between nations, where the thickness of these lines is proportional to the intensity of cooperation. This analysis suggests varying degrees of collaboration between countries, with some clusters showing stronger partnerships and cooperation compared to others.
This co-authorship analysis on an international level revealed two major clusters (green and blue), one smaller cluster (red), and countries with low levels of international cooperation (e.g., Lebanon and Kenya). The central point of the green cluster is the strong connection between China and the USA and their cooperation with African countries. Apart from China and the USA, other members of this cluster are the United Kingdom, India, Australia, Greece, Belgium, South Africa, Ireland, Pakistan, Ghana, Singapore, and Nigeria. This cluster demonstrates the highest level of collaboration among countries. The second cluster is the blue cluster centered around the European cooperation network between Italy, Spain, France, Germany, Denmark, etc. This cluster shows moderate to high levels of collaboration between countries. The smallest cluster is the third cluster, i.e., the red cluster. Egypt, Saudi Arabia, Malaysia, Tunisia, Iraq, and Morocco are part of this cluster. Compared to the green or blue cluster connections, the collaboration between these countries is relatively low.
Unlike citation, co-authorship, or co-citation analyses, co-word analysis examines the content of the article itself and can assist in revealing research trends and basic, motor, or emerging themes in the scientific community. Figure 6 presents a word cloud of the 20 most frequent author keywords in different evolution periods: the Early Age (2000–2011); the Development Period (2012–2019); the Rapid Growth Period (2020–2023); the whole timespan (2000–2023) including all publications; and the whole timespan with only the core publications cited more than three times per year.
The period spanning from 2000 to 2011 is classified as the Early Stage, with just 43 publications related to ocean RS for SD. The most commonly occurring words were “GIS”, “coastal erosion”, “coral reef”, “applications”, and “biodiversity”. The terms for RS technology (sensors) included in the 25 most frequent author keywords were aerial photographs, airborne remote sensing, altimeter, and atmospheric lidar.
Moving to the Development Period, from 2012 to 2019, a total of 156 publications were published. The most frequent word in this period shifted from “GIS”, which fell into second place, to “climate change”, followed by “coastal erosion”, “monitoring”, and “sea-level rise”. Terms related to RS technology mentioned in the 25 most frequent words were “MODIS”, “GRACE”, “Landsat”, and “satellite remote sensing”.
In the most recent period analyzed, the Rapid Growth Period from 2020 to 2023, the terms “climate change”, “GIS”, and “coastal erosion” remained the top three most frequent words, followed by “Landsat” and “aquaculture”. New terms related to data analysis and interpretation arose with an emphasis on classification and machine learning (ML) techniques. A term closely connected to big data, “Google Earth Engine”, appeared in this period. Terms related to RS techniques that appeared in the 25 most frequent words were “Landsat”, “Sentinel”, and “satellite remote sensing”.
Finally, considering the entire period from 2003 to 2023, the most frequent term was “climate change”, followed by “GIS” and “coastal erosion”. The RS technologies mentioned among the top 25 most frequent terms were “Landsat”, “MODIS”, and “satellite remote sensing”. The term “NDVI” consistently appeared in all periods. Surprisingly, the terms “machine learning” and “Google Earth Engine” had a high frequency considering the whole period of 2000–2023, even though they became subjects of interest more recently, during the Rapid Growth Period.
Interestingly, there was a difference in the most frequent terms when only frequently cited articles from the period of 2000–2023 were analyzed. The most frequent author keywords were “coastal erosion”, “sea level rise”, and “GIS”. Many of them were focused on coastal areas, such as “coastal erosion”, “sea level rise”, “coastline change”, and “coastal wetland”. Additionally, the terms “mangrove”, “China”, and “Central Asia” were among the ten most frequent terms. Terms related to deep learning techniques and big data appeared with higher frequency in the most influential articles. Regarding technology, satellite sensors, including the Sentinel-2 fleet and the GRACE mission, were prominently featured.

4. Discussion

In this research, a bibliometric analysis of 499 research articles from the WoS CC database was performed to identify trends in ocean RS for SD, main contributors, and cooperation networks in the beginning of the 21st century from 2000 to 2023.
By analyzing studies related to RS [22,25], our research confirmed that the publication productivity in this field was very low up to the year 2000. However, the main statistics about data collection from WoS CC showed an annual growth rate of 17.94%, implying a growing scientific interest. From 2000 to 2011, there was a slow increase in the number of published papers. From 2012 to 2019, and especially in 2015, there was a noticeable increase in the number of published papers. One of the factors that certainly increased the interest of the scientific community in this area was the publication of the 2030 Agenda that set the UN SDGs in 2015 [7]. The expansion of research interest and the rapid growth in publication productivity from 2020 coincided with the commencement of the Ocean Decade, which is dedicated to the use and implementation of innovative science-driven solutions for SD and the growth of marine areas [9].
A keyword TS in WoS CC identified 499 articles related to RS, SD, and marine areas, which were spread across 215 different journals. However, the majority of these articles were concentrated in the top ten journals. This distribution pattern is consistent with findings from other bibliometric analyses [23,24]. The journals Remote Sensing (MDPI) and Sustainability (MDPI) published the greatest number of articles, with both being highly oriented to the focal topics used in our search and reflecting the interdisciplinary nature of this field. Additionally, an analysis of institutional productivity showed that Chinese institutions dominate in this field, with the University of the Chinese Academy of Sciences as the leader.
China is also the most productive country, with a total of 161 publications, followed by the USA (88), Italy (48), the UK (43), and Australia (35). Cooperation between research constituents (authors, affiliations, countries) is important for the development of any research field, but this is even more highlighted for global sustainable growth. A co-authorship analysis identified several cooperation clusters between nations. There are two major clusters, with the first being centered around the most productive countries such as China, the USA, and the UK, indicating extensive collaboration at an international level. The second cluster encompasses collaboration between EU countries: Italy, Spain, France, Germany, Denmark, etc. Although these two major clusters collaborate with African and South American countries, the worldwide distribution of publications shows lower scientific output as well as less international collaboration from the western parts of Africa and South America compared to other regions. This lack of cooperation could limit their access to the important research, technology, and funding needed for SD. As a result, these underrepresented regions will fall behind in achieving SDGs and their overall progress could be slowed down. To address these challenges, international development programs for building research capacity, such as Ocean Teacher Global Academy (OTGA) [63] and IHO capacity-building programs [64], should aim at these regions. Only active international cooperation can overcome the limitations in ocean data availability, such as low spatial or temporal resolution, to achieve robust global scientific solutions aimed at sustainable growth. This includes initiatives like Digital Twins of the Oceans [65], which would advance our understanding of ocean properties and marine ecosystems’ responses to the fast-changing climate and underpin better decision-making and management of marine resources, such as fisheries [26] and offshore energy [66].
Since 1978, when Seasat, one of the earliest EO satellites for monitoring ocean areas, was launched, the status of EO was characterized by advancements in satellite technology and data collection methods [23]. According to the WoS CC search performed in this research, the first paper related to RS over marine areas for SD was published in 1995 [35]. Challenges such as limited data accessibility and technological limitations were present and the full potential of RS for scientific research was not reached. The importance of multidisciplinary cooperation in understanding Earth’s processes and the need for an improved cost-effective EO system was the main challenge [35].
Based on our co-word analysis, the evolution of themes and RS technology can be tracked over three distinct periods regarding scientific productivity: an Early Stage (2000–2011), a Development Period (2012–2019), and a Rapid Growth Period (2020–2023).
The period from 2000 to 2011 was marked as the Early Stage regarding the interest of the scientific community in SD supported by ocean RS research. The research in this period was focused on coastal erosion and climate change, with increased interest in specific ecosystems like coral reefs and seagrass. RS technology relied on airborne sensors, aerial photographs, and altimeters.
The Development Period saw an expansion of RS capabilities with the adoption of satellite data from MODIS and Landsat. The NDVI became crucial for vegetation analysis, and GRACE contributed to understanding changes in Earth’s gravity field related to mass distribution. Research themes shifted towards broader environmental monitoring and the impacts of climate change, including rising sea levels. There was a growing concern for change detection and conservation pertaining to coastal areas and wetlands.
The most recent period remained oriented towards the fast-changing climate and coastal erosion. The advancement in technology was marked by the integration of ML and the augmentation of satellite missions like Sentinel-2. Google Earth Engine (GEE) emerged as a popular tool for large-scale environmental data processing and analyses. A co-word analysis of the most cited publications in the overall period (2000–2023) confirmed GEE and ML techniques as cutting-edge technologies, indicating a future shift towards more sophisticated data processing and analysis techniques, which has also been depicted in other RS-related analyses [24,25].
Science mapping techniques, including a co-word analysis of publications published from 2000 to 2023, and co-citation clusters, underpinned by the most influential articles, identified major threats to SD detected by ocean RS: marine pollution [67]; biodiversity loss [38,39], including coral reef degradation [45]; climate change’s impact on rising sea levels and temperatures [43]; and coastal erosion [41] and poor coastal management [44], leading to, e.g., overfishing.
It should be noted that real-time or near-real-time solutions using RS over marine areas for disaster management support systems have not been a topic of interest in this research field. However, RS data with high temporal and spatial resolution can support the assessment of and quick responses to marine disasters.
Ocean RS plays a significant role in supporting several UN SDGs, particularly those oriented to climate action (Goal 13), life below water (Goal 14), and life on land (Goal 15) (Figure 7). By providing data on ocean temperature, rising sea levels, marine biodiversity, and habitat health, RS enables policy-makers to monitor and predict the impacts of climate change, promote the sustainable management of fisheries, and preserve marine ecosystems. Furthermore, ocean RS contributes to achieving Goal 11 (Sustainable Cities and Communities) by providing vital information for coastal planning and disaster risk reduction against natural hazards. Additionally, it supports Goal 6 (Clean Water and Sanitation) by monitoring water quality and pollution levels in coastal areas. Moreover, ocean RS aids in achieving Goal 2 (Zero Hunger) by providing insights into ocean productivity, renewable energy potential, and the sustainable use of marine resources for food and energy production.
This bibliometric analysis aimed to identify the main research contributors, cooperation networks, and topic trends in the field of ocean RS for SD. The analysis was based on bibliometric data from the WOS CC database. Data were filtered based on a keyword search. It should be noted that some potentially relevant publications were omitted if they were not included in the WOS CC database or did not directly refer to terms related to SD. Ekmen et al. (2024) [24] suggested that publishers should recommend authors to include SDG-related terms in their keywords. Alternatively, a filter to refine search results related to specific UN SDGs, such as one in WOS CC, could be employed [68].

5. Conclusions

RS includes a variety of widely adopted techniques for marine research that aim to achieve sustainable growth.
The trends and challenges in this field have evolved significantly from 2000 to 2023. The Early Stage (2000–2011) was characterized by limited scientific interest and airborne remote sensing technologies, focusing on coastal erosion and specific ecosystems like coral reefs. During the Development Period (2012–2019), there was an increase in the number of publications, driven by the advancements in satellite technology and increasing concerns about climate change and environmental monitoring. The Rapid Growth Period (2020–2023) highlighted the augmentation of EO satellite missions and the integration of automated data processing techniques. ML and GEE reflect a shift towards more complex environmental analyses involving large amounts of data.
As technology advances, new challenges will include managing big data, ensuring the reliability of ML algorithms, and integrating diverse datasets for comprehensive analyses for robust scientific solutions like Ocean Digital Twins.
The top contributors in terms of journals include “Remote Sensing” and “Sustainability”, published by MDPI, which have produced the highest number of publications. Other significant journals are “Ocean & Coastal Management”, “Science of the Total Environment”, and “Environmental Monitoring and Assessment”. These all reflect the interdisciplinary nature of this research field. The top-cited publications highlight significant contributions from various researchers. For example, Carr’s 2001 [36] study on estimating potential productivity in Eastern boundary currents and Chen et al.’s 2017 [38] study on mapping mangrove forests in China using advanced classification algorithms and cloud computing platforms are among the most influential works. Key contributors to the field include institutions from China like the University of the Chinese Academy of Sciences and Nanjing University. China is the most productive country, followed by the USA and European nations.
The geographic distribution of research indicates strong international collaboration, particularly between China, the USA, and European countries, contributing to UN SDGs. These collaborations facilitate knowledge exchange, technological advancements, and comprehensive solutions to complex environmental issues on local, regional, and global levels. However, there is an uneven worldwide distribution of research contributions, with significant gaps in scientific output and international collaboration from regions like Western Africa and parts of South America.
To address these disparities and achieve the global goals of SD, capacity-building programs should focus on these underrepresented regions. Enhancing international cooperation through programs such as Digital Twins of the Oceans can address these gaps, provide robust scientific solutions, improve data availability, and support worldwide sustainable growth.
The research field of ocean RS for SD is interdisciplinary and covers diverse topics that contribute to various UN SDGs. This bibliometric analysis points out the research gap in real- or near-real-time support systems for disaster management utilizing ocean RS data. Moreover, future research could address ocean RS for specific SDGs, which would point out gaps and barriers in achieving particular goals. With such research, policy- and decision-makers could develop strategies to overcome them.

Author Contributions

Conceptualization, L.V.; methodology, L.V.; software, L.V.; validation, L.V., I.R. and M.Z.; formal analysis, L.V.; investigation, L.V.; resources, L.V. and I.R.; data curation, L.V., I.R. and M.Z.; writing—original draft preparation, L.V.; writing—review and editing, L.V., I.R. and M.Z.; visualization, L.V.; supervision, I.R. and M.Z.; project administration, L.V.; funding acquisition, I.R. and M.Z. All authors have read and agreed to the published version of the manuscript.

Funding

This research received no external funding.

Institutional Review Board Statement

Not applicable.

Informed Consent Statement

Not applicable.

Data Availability Statement

Data are contained within the article.

Acknowledgments

This research is partially supported through project KK.01.1.1.02.0027, a project co-financed by the Croatian Government and the European Union through the European Regional Development Fund—the Competitiveness and Cohesion Operational Program.

Conflicts of Interest

The authors declare no conflicts of interest.

References

  1. World Ocean Volumes. Available online: https://www.ncei.noaa.gov/sites/g/files/anmtlf171/files/2023-01/World%20Ocean%20Volumes.pdf (accessed on 10 May 2024).
  2. Seabed 2023. Available online: https://seabed2030.org/ (accessed on 10 May 2024).
  3. Wölfl, A.-C.; Snaith, H.; Amirebrahimi, S.; Devey, C.W.; Dorschel, B.; Ferrini, V.; Huvenne, V.A.I.; Jakobsson, M.; Jencks, J.; Johnston, G.; et al. Seafloor Mapping—The Challenge of a Truly Global Ocean Bathymetry. Front. Mar. Sci. 2019, 6, 283. [Google Scholar] [CrossRef]
  4. United Nations. United Nations Convention on the Law of the Sea; United Nations: New York, NY, USA, 1982. [Google Scholar]
  5. Pyć, D. The Role of the Law of the Sea in Marine Spatial Planning. In Maritime Spatial Planning, 2nd ed.; Zaucha, J., Gee, K., Eds.; Palgrave Macmillan Cham: London, UK, 2019; pp. 375–395. [Google Scholar] [CrossRef]
  6. Zhang, S.; Wu, Q.; Butt, M.M.Z.; Lv, Y.-M.; Yan-E-Wang. International Legal Framework for Joint Governance of Oceans and Fisheries: Challenges and Prospects in Governing Large Marine Ecosystems (LMEs) under Sustainable Development Goal 14. Sustainability 2024, 16, 2566. [Google Scholar] [CrossRef]
  7. United Nations. Transforming Our World: The 2030 Agenda for Sustainable Development. Available online: https://sdgs.un.org/2030agenda (accessed on 10 May 2024).
  8. Millennium Goals. Available online: https://www.un.org/millenniumgoals/ (accessed on 10 May 2024).
  9. Ocean Decade. Available online: https://oceandecade.org/ (accessed on 10 May 2024).
  10. Contarinis, S.; Pallikaris, A.; Nakos, B. The Value of Marine Spatial Open Data Infrastructures—Potentials of IHO S-100 Standard tο Become the Universal Marine Data Model. J. Mar. Sci. Eng. 2020, 8, 564. [Google Scholar] [CrossRef]
  11. Rani, M.; Masroor, M.; Kumar, P. Remote Sensing of Ocean and Coastal Environment—Overview. In Earth Observation, Remote Sensing of Ocean and Coastal Environments; Rani, M., Seenipandi, K., Rehman, S., Kumar, P., Sajjad, H., Eds.; Elsevier: Amsterdam, The Netherlands, 2021; pp. 1–15. [Google Scholar]
  12. EO4SDG. Earth Observations in Service of the 2030 Agenda for Sustainable Development. Strategic Implementation Plan 2020–2024. Available online: https://eo4sdg.org/wp-content/uploads/2019/09/EO4SDG-Strategic-Impl.-Plan-2020-2024.pdf (accessed on 12 May 2024).
  13. Sandwell, D.T.; Muller, R.D.; Smith, W.H.; Garcia, E.; Francis, R. New global marine gravity model from CryoSat-2 and Jason-1 reveals buried tectonic structure. Science 2014, 346, 65–67. [Google Scholar] [CrossRef]
  14. Mumby, P.; Green, E.; Edwards, A.; Clark, C. Cost-effectiveness of remote sensing for coastal management. J. Environ. Manag. 1999, 55, 157–166. [Google Scholar] [CrossRef]
  15. Wang, K.; Franklin, S.E.; Guo, X.; Cattet, M. Remote Sensing of Ecology, Biodiversity and Conservation: A Review from the Perspective of Remote Sensing Specialists. Sensors 2010, 10, 9647–9667. [Google Scholar] [CrossRef]
  16. Mayer, L.; Jakobsson, M.; Allen, G.; Dorschel, B.; Falconer, R.; Ferrini, V.; Lamarche, G.; Snaith, H.; Weatherall, P. The Nippon Foundation—GEBCO Seabed 2030 Project: The Quest to See the World’s Oceans Completely Mapped by 2030. Geosciences 2018, 8, 63. [Google Scholar] [CrossRef]
  17. Martín-Martín, A.; Orduna-Malea, E.; Thelwall, M.; Delgado López-Cózar, E. Google Scholar, Web of Science, and Scopus: A Systematic Comparison of Citations in 252 Subject Categories. J. Informetr. 2018, 12, 1160–1177. [Google Scholar] [CrossRef]
  18. Donthu, N.; Kumar, S.; Mukherjee, D.; Pandey, N.; Lim, W.M. How to conduct a bibliometric analysis: An overview and guidelines. J. Bus. Res. 2021, 133, 285–296. [Google Scholar] [CrossRef]
  19. van Eck, N.J.; Waltman, L. Software survey: VOSviewer, a computer program for bibliometric mapping. Scientometrics 2010, 84, 523–538. [Google Scholar] [CrossRef] [PubMed]
  20. Aria, M.; Cuccurullo, C. Bibliometrix: An R-tool for comprehensive science mapping analysis. J. Informetr. 2017, 11, 959–975. [Google Scholar] [CrossRef]
  21. Zhang, H.; Huang, M.; Qing, X.; Li, G.; Tian, C. Bibliometric Analysis of Global Remote Sensing Research during 2010–2015. ISPRS Int. J. Geo-Inf. 2017, 6, 332. [Google Scholar] [CrossRef]
  22. Araya-Lopez, R.; de Paula Costa, M.D.; Wartman, M.; Macreadie, P.I. Trends in the application of remote sensing in blue carbon science. Ecol. Evol. 2023, 13, e10559. [Google Scholar] [CrossRef]
  23. Wang, Q.; Wang, J.; Xue, M.; Zhang, X. Characteristics and Trends of Ocean Remote Sensing Research from 1990 to 2020: A Bibliometric Network Analysis and Its Implications. J. Mar. Sci. Eng. 2022, 10, 373. [Google Scholar] [CrossRef]
  24. Ekmen, O.; Kocaman, S. Remote sensing for UN SDGs: A global analysis of research and collaborations. Egypt. J. Remote Sens. Space Sci. 2024, 27, 329–341. [Google Scholar] [CrossRef]
  25. Chen, G.; Yang, R.; Zhao, X.; Li, L.; Luo, L.; Liu, H. Bibliometric Analysis of Spatial Technology for World Heritage: Application, Trend and Potential Paths. Remote Sens. 2023, 15, 4695. [Google Scholar] [CrossRef]
  26. Chen, C.-H.; Yen, K.-W. Developing International Collaboration Indicators in Fisheries Remote Sensing Research to Achieve SDG 14 and 17. Sustainability 2023, 15, 14031. [Google Scholar] [CrossRef]
  27. Moral-Muñoz, J.A.; Herrera-Viedma, E.; Santisteban-Espejo, A.; Cobo, M.J. Software tools for conducting bibliometric analysis in science: An up-to-date review. El Prof. De La Inf. 2019, 29, e290103. [Google Scholar] [CrossRef]
  28. Bibliometrix. Available online: https://www.bibliometrix.org/home/index.php/download (accessed on 15 May 2024).
  29. Mongeon, P.; Paul-Hus, A. The journal coverage of Web of Science and Scopus: A comparative analysis. Scientometrics 2016, 106, 213–228. [Google Scholar] [CrossRef]
  30. Pranckutė, R. Web of Science (WoS) and Scopus: The Titans of Bibliographic Information in Today’s Academic World. Publications 2021, 9, 12. [Google Scholar] [CrossRef]
  31. Wang, Q.; Waltman, L. Large-scale analysis of the accuracy of the journal classification systems of Web of Science and Scopus. J. Informetr. 2016, 10, 347–364. [Google Scholar] [CrossRef]
  32. Liu, C.; Li, W.; Xu, J.; Zhou, H.; Li, C.; Wang, W. Global trends and characteristics of ecological security research in the early 21st century: A literature review and bibliometric analysis. Ecol. Indic. 2022, 137, 108734. [Google Scholar] [CrossRef]
  33. Pohl, C.; Van Genderen, J.L. Review Article Multisensor Image Fusion in Remote Sensing: Concepts, Methods and Applications. Int. J. Remote Sens. 1998, 19, 823–854. [Google Scholar] [CrossRef]
  34. Carpenter, C.R.; Cone, D.C.; Sarli, C.C. Using publication metrics to highlight academic productivity and research impact. Acad. Emerg. Med. 2014, 21, 1160–1172. [Google Scholar] [CrossRef] [PubMed] [PubMed Central]
  35. Kozoderov, V.V. A Scientific Approach to Employ Monitoring and Modelling Techniques for Global Change and Terrestrial Ecosystems and Other Related Projects. J. Biogeogr. 1995, 22, 927–933. [Google Scholar] [CrossRef]
  36. Carr, M.-E. Estimation of potential productivity in Eastern Boundary Currents using remote sensing. Deep Sea Res. Part II Top. Stud. Oceanogr. 2001, 49, 59–80. [Google Scholar] [CrossRef]
  37. Petropoulos, G.P.; Ireland, G.; Barrett, B. Surface soil moisture retrievals from remote sensing: Current status, products & future trends. Phys. Chem. Earth Parts A/B/C 2015, 83–84, 36–56. [Google Scholar] [CrossRef]
  38. Chen, B.; Xiao, X.; Li, X.; Pan, L.; Doughty, R.; Ma, J.; Dong, J.; Qin, Y.; Zhao, B.; Wu, Z.; et al. A mangrove forest map of China in 2015: Analysis of time series Landsat 7/8 and Sentinel-1A imagery in Google Earth Engine cloud computing platform. ISPRS J. Photogramm. Remote Sens. 2017, 131, 104–120. [Google Scholar] [CrossRef]
  39. McArthur, M.A.; Brooke, B.P.; Przeslawski, R.; Ryan, D.A.; Lucieer, V.L.; Nichol, S.; McCallum, A.W.; Mellin, C.; Cresswell, I.D.; Radke, L.C. On the use of abiotic surrogates to describe marine benthic biodiversity. Estuar. Coast. Shelf Sci. 2010, 88, 21–32. [Google Scholar] [CrossRef]
  40. Wu, J.; Zhang, Q.; Li, A. Historical landscape dynamics of Inner Mongolia: Patterns, drivers, and impacts. Landsc. Ecol. 2015, 30, 1579–1598. [Google Scholar] [CrossRef]
  41. Appeaning Addo, K.; Walkden, M.; Mills, J.P. Detection, Measurement and Prediction of Shoreline Recession in Accra, Ghana. ISPRS J. Photogramm. Remote Sens. 2008, 63, 543–558. [Google Scholar] [CrossRef]
  42. Aschbacher, J.; Milagro-Pérez, M.P. The European Earth Monitoring (GMES) Programme: Status and Perspectives. Remote Sens. Environ. 2012, 120, 3–8. [Google Scholar] [CrossRef]
  43. Islam, M.A.; Mitra, D.; Dewan, A.; Akhter, S.H. Coastal Multi-Hazard Vulnerability Assessment along the Ganges Deltaic Coast of Bangladesh—A Geospatial Approach. Ocean Coast. Manag. 2016, 127, 1–15. [Google Scholar] [CrossRef]
  44. Radiarta, I.N.; Saitoh, S.-I.; Miyazono, A. GIS-Based Multi-Criteria Evaluation Models for Identifying Suitable Sites for Japanese Scallop (Mizuhopecten yessoensis) Aquaculture in Funka Bay, Southwestern Hokkaido, Japan. Aquaculture 2008, 284, 127–135. [Google Scholar] [CrossRef]
  45. Wabnitz, C.C.; Andréfouët, S.; Torres-Pulliza, D.; Müller-Karger, F.E.; Kramer, P.A. Regional-Scale Seagrass Habitat Mapping in the Wider Caribbean Region Using Landsat Sensors: Applications to Conservation and Ecology. Remote Sens. Environ. 2008, 112, 3455–3467. [Google Scholar] [CrossRef]
  46. Cullen, J.J. Primary Production Methods. In Encyclopedia of Ocean Sciences; Steele, J.H., Ed.; Academic Press: Cambridge, MA, USA, 2001; pp. 2277–2284. ISBN 9780122274305. [Google Scholar] [CrossRef]
  47. Pekel, J.F.; Cottam, A.; Gorelick, N.; Belward, A.S. High-resolution mapping of global surface water and its long-term changes. Remote Sens. 2016, 8, 810. [Google Scholar] [CrossRef] [PubMed]
  48. Wang, X.; Xiao, X.; Zou, Z.; Hou, L.; Qin, Y.; Dong, J.; Doughty, R.B.; Chen, B.; Zhang, X.; Chen, Y.; et al. Mapping Coastal Wetlands of China Using Time Series Landsat Images in 2018 and Google Earth Engine. ISPRS J. Photogramm. Remote Sens. 2020, 163, 312–326. [Google Scholar] [CrossRef] [PubMed]
  49. Gao, B.C. 1996. NDWI—A normalized difference water index for remote sensing of vegetation liquid water from space. Remote Sens. Environ. 1996, 58, 257–266. [Google Scholar] [CrossRef]
  50. Tucker, C.J. Red and Photographic Infrared Linear Combinations for Monitoring Vegetation. Remote Sens. Environ. 1979, 8, 127–150. [Google Scholar] [CrossRef]
  51. Gholizadeh, M.H.; Melesse, A.M.; Reddi, L. A Comprehensive Review on Water Quality Parameters Estimation Using Remote Sensing Techniques. Sensors 2016, 16, 1298. [Google Scholar] [CrossRef]
  52. Morel, A.; Prieur, L. Analysis of variations in ocean color. Limnol. Oceanogr. 1977, 22, 709–722. [Google Scholar] [CrossRef]
  53. Huang, C.; Song, K.; Kim, S.; Townshend, J.R.G.; Davis, P.; Masek, J.G.; Goward, S.N. Use of a dark object concept and support vector machines to automate forest cover change analysis. Remote Sens. Environ. 2008, 112, 970–985. [Google Scholar] [CrossRef]
  54. Gorelick, N.; Hancher, M.; Dixon, M.; Ilyushchenko, S.; Thau, D.; Moore, R. Google Earth Engine: Planetary-scale geospatial analysis for everyone. Remote Sens. Environ. 2017, 202, 18–27. [Google Scholar] [CrossRef]
  55. Mcleod, E.; Chmura, G.L.; Bouillon, S.; Salm, R.; Björk, M.; Duarte, C.M.; Lovelock, C.E.; Schlesinger, W.H.; Silliman, B.R. A blueprint for blue carbon: Toward an improved understanding of the role of vegetated coastal habitats in sequestering CO2. Front. Ecol. Environ. 2011, 9, 552–560. [Google Scholar] [CrossRef] [PubMed]
  56. Foody, G.M. Status of land cover classification accuracy assessment. Remote Sens. Environ. 2002, 80, 185–201. [Google Scholar] [CrossRef]
  57. Ivushkin, K.; Bartholomeus, H.; Bregt, A.K.; Pulatov, A.; Kempen, B.; De Sousa, L. Global mapping of soil salinity change. Remote Sens. Environ. 2019, 231, 111260. [Google Scholar] [CrossRef]
  58. Brammer, H. Bangladesh’s dynamic coastal regions and sea-level rise. Climate Risk Manag. 2014, 1, 51–62. [Google Scholar] [CrossRef]
  59. Adger, W.N. Vulnerability. Glob. Environ. Change 2006, 16, 268–281. [Google Scholar] [CrossRef]
  60. Gupta, K.; Mukhopadhyay, A.; Giri, S.; Chanda, A.; Majumdar, S.D.; Samanta, S.; Mitra, D.; Samal, R.N.; Pattnaik, A.K.; Hazra, S. An index for discrimination of mangroves from non-mangroves using LANDSAT 8 OLI imagery. MethodsX 2018, 5, 1129–1139. [Google Scholar] [CrossRef] [PubMed]
  61. Funk, C.; Peterson, P.; Landsfeld, M.; Pedreros, D.; Verdin, J.; Shukla, S.; Husak, G.; Rowland, J.; Harrison, L.; Hoell, A.; et al. The climate hazards infrared precipitation with stations—A new environmental record for monitoring extremes. Sci Data 2015, 2, 150066. [Google Scholar] [CrossRef]
  62. McKee, K.L.; Cahoon, D.R.; Feller, I.C. Caribbean mangroves adjust to rising sea level through biotic controls on change in soil elevation. Glob. Ecol. Biogeogr. 2007, 16, 545–556. [Google Scholar] [CrossRef]
  63. OCTGA. Available online: https://classroom.oceanteacher.org/ (accessed on 10 May 2024).
  64. IHO Capacity Building & Technical Cooperation. Available online: https://iho.int/en/capacity-building-and-technical-cooperation (accessed on 10 May 2024).
  65. Tzachor, A.; Hendel, O.; Richards, C.E. Digital twins: A stepping stone to achieve ocean sustainability? NPJ Ocean Sustain. 2023, 2, 16. [Google Scholar] [CrossRef]
  66. Racetin, I.; Ostojić Škomrlj, N.; Peko, M.; Zrinjski, M. Fuzzy Multi-Criteria Decision for Geoinformation System-Based Offshore Wind Farm Positioning in Croatia. Energies 2023, 16, 4886. [Google Scholar] [CrossRef]
  67. Tian, Y.; Yang, Z.; Yu, X.; Jia, Z.; Rosso, M.; Dedman, S.; Zhu, J.; Xia, Y.; Zhang, G.; Yang, J.; et al. Can we quantify the aquatic environmental plastic load from aquaculture? Water Res. 2022, 219, 118551. [Google Scholar] [CrossRef]
  68. WoS SDG Mapping. Available online: https://incites.help.clarivate.com/Content/Research-Areas/sustainable-development-goals.htm (accessed on 1 June 2024).
Figure 1. Bibliographic analysis procedure.
Sustainability 16 06211 g001
Figure 2. Number of scientific publications on ocean remote sensing for sustainable development from 2000 to 2023.
Sustainability 16 06211 g002
Figure 3. Distribution of scientific productivity measured by the number of publications (NP) worldwide.
Sustainability 16 06211 g003
Figure 4. Co-citation network of references from influential publications (2000–2023).
Sustainability 16 06211 g004
Figure 5. Worldwide cooperation network (2000–2023).
Sustainability 16 06211 g005
Figure 6. Word cloud of 20 most frequent author keywords in different time ranges: the Early Stage (2000–2011), the Development Period (2002–2019), and the Rapid Growth Period (2020–2023), as well as the whole observed period of 2000–2003 with all 499 articles and that with only the publications cited more than 3 times per year.
Sustainability 16 06211 g006
Figure 7. SDG mapping of the data collected from the WoS CC database [68].
Sustainability 16 06211 g007
Table 1. Main information about the data retrieved from WoS CC database.
Main Information DescriptionResults
DataTimespan2000–2023
Journals215
Articles499
Average citations per doc18.97
Annual growth rate %17.94
References27,256
ContentKeywords plus (ID)1525
Author keywords (DE)1955
AuthorsAuthors2734
Single-author docs27
Co-authors per doc6.41
International co-authorships %36.87
Table 2. The top 10 journals publishing papers related to ocean remote sensing for sustainable development from 2000 to 2023.
JournalNP 1IF2022 2PublisherTC 3
Remote Sensing445MDPI518
Sustainability243.9MDPI157
Ocean & Coastal Management164.6Elsevier 379
Science of the Total Environment149.8Elsevier284
Environmental Monitoring and Assessment113Springer173
Regional Studies in Marine Science112.1Elsevier86
Water113.4MDPI81
IEEE Journal of Selected Topics in Applied Earth Observations and Remote Sensing105.5.IEEE85
Frontiers in Marine Science103.7Frontiers 45
Remote Sensing of Environment913.5Elsevier508
1 Number of Publications, 2 The 2022 Impact Factor, 3 Total Number of Citation.
Table 3. The top 10 most productive affiliations publishing papers related to ocean remote sensing for sustainable development from 2000 to 2023.
No.Affiliation (Country)NP
1University of the Chinese Academy of Sciences (China)42
2Nanjing University (China)33
3Institute of Geographic Sciences and Natural Resources Research (China)31
4East China Normal University (China)25
5Ocean University of China (China)21
6Aerospace Information Research Institute (China)19
7Beibu Gulf University (China)15
8National Authority for Remote Sensing and Space Sciences (Egypt)14
9Shanghai Ocean University (China)13
10Shenzhen University (China)12
Table 4. The top 10 most productive countries publishing papers related to ocean remote sensing for sustainable development from 2000 to 2023.
No. CountryNP
1China161
2USA88
3Italy48
4United Kingdom43
5Australia35
6Egypt34
7India28
8France23
9Turkey23
10Germany18
Table 5. The top 10 most cited publications.
NoPaperJournalCitation
1Carr, M.E. (2001) [36]Deep-Sea Research Part II: Topical Studies in Oceanography349
2Petropoulos, G.P. et al. (2015) [37]Physics and Chemistry of the Earth297
3Chen, B.Q. et al. (2017) [38]ISPRS Journal of Photogrammetry and Remote Sensing258
4McArthur, M.A. et al. (2010) [39]Estuarine, Coastal and Shelf Science217
5Wu, J.G. et al. (2015) [40]Landscape Ecology161
6Appeaning Addo, K.A. et al. (2008) [41]ISPRS Journal of Photogrammetry and Remote Sensing147
7Aschbacher, J. and Milagro-Pérez, M.P. (2012) [42]Remote Sensing of Environment145
8Islam, M.A. et al. (2016) [43]Ocean & Coastal Management139
9Radiarta, I.N. et al. (2008) [44]Aquaculture120
10Wabnitz, C.C. et al. (2008) [45]Remote Sensing of Environment115
Disclaimer/Publisher’s Note: The statements, opinions and data contained in all publications are solely those of the individual author(s) and contributor(s) and not of MDPI and/or the editor(s). MDPI and/or the editor(s) disclaim responsibility for any injury to people or property resulting from any ideas, methods, instructions or products referred to in the content.

