Article

Energy and Environmental Analyses of a Solar–Gas Turbine Combined Cycle with Inlet Air Cooling

by
Ahmad M. Abubaker
1,*,
Adnan Darwish Ahmad
1,
Binit B. Singh
2,
Yaman M. Manaserh
3,
Loiy Al-Ghussain
4,*,
Nelson K. Akafuah
1 and
Kozo Saito
1
1
Institute of Research for Technology Development (IR4TD), University of Kentucky, Lexington, KY 40506, USA
2
Department of Mechanical Engineering, University of Minnesota Twin Cities, Minneapolis, MN 55414, USA
3
Department of Mechanical Engineering, ES2 Center, Binghamton University-SUNY, Binghamton, NY 13902, USA
4
Energy Systems and Infrastructure Analysis Division, Argonne National Laboratory, Lemont, IL 60439, USA
*
Authors to whom correspondence should be addressed.
Sustainability 2024, 16(14), 6229; https://doi.org/10.3390/su16146229 (registering DOI)
Submission received: 12 June 2024 / Revised: 9 July 2024 / Accepted: 18 July 2024 / Published: 21 July 2024
(This article belongs to the Section Pollution Prevention, Mitigation and Sustainability)

Abstract

:
Sensitivity to ambient air temperatures, consuming a large amount of fuel, and wasting a significant amount of heat dumped into the ambient atmosphere are three major challenges facing gas turbine power plants. This study was conducted to simultaneously solve all three aforementioned GT problems using solar energy and introducing a new configuration that consists of solar preheating and inlet-air-cooling systems. In this study, air was preheated at a combustion chamber inlet using parabolic trough collectors. Then, inlet air to the compressor was cooled by these collectors by operating an absorption cooling cycle. At the design point conditions, this novel proposed integration resulted in a 6.87% relative increase in generated power and a 10.53% relative decrement in fuel consumption, achieving a 19.45% relative increment in the plant’s thermal efficiency. This was accompanied by a reduction of 0.026 kg/s, 4.2 kg/s, and 0.278 kg/s in CO2, CO, and NOx emissions, respectively. Finally, spider diagrams were employed to assess the impact of the operating parameters on the overall system’s performance and its associated environmental implications.

1. Introduction

Solar power has promising potential, but it faces a few challenges, including high intermittency [1] and low efficiency in direct electrical generation using concentrated solar power in PTCs due to the limitations of the maximum allowable temperature in the solar field troughs. The organic Rankine cycle driven by solar collectors, for example, suffers from less than 10% efficiency [2]. Hybridization with fossil fuel systems is recommended to enhance solar energy stability and minimize fuel consumption [3]. Gas turbines operated by NG, a good candidate for hybridization [4], suffer from three major problems: the significant amount of waste heat released into the ambient atmosphere, the excessive amount of fuel required, and sensitivity to ambient air temperature. The following explains each of these three problems.

1.1. The First Problem of GTs: Waste Heat

The exhaust temperature of a gas turbine operating on natural gas could range from 350 °C to 650 °C [5]. Utilization of the waste heat could enhance the thermal efficiency of gas turbines [6]. Adopting cogeneration systems by combining the GT cycle coupled with a secondary cycle is extremely favorable, due to the high temperatures of exhaust gases from a GT, which exceed 500 °C [7]. Dabwan et al. [8] proposed using waste heat to cool the compressor’s inlet air utilizing absorption chillers, increasing power output by 19% and overall system efficiency by 2.3%.

1.2. The Second Problem of GTs: Excessive Amount of Fuel

Gas turbines are responsible for a considerable portion of NG consumption growth worldwide; in 2019, global NG consumption growth was approximately 2.1% [9]. The use of NG for power generation has been consistently increasing in the USA. There was a 7% rise in the consumption of NG for power generation in the USA from 2022 to 2023 [10]. In addition, gas turbine power plants use a large amount of air while operating, with one extreme case report using up to 290 kg/s of air in the combustion chamber [11], in which the temperature of combustion gases can be higher than 1800 °C, releasing an enormous amount of environmentally harmful gases such as CO2, CO, and NOx [12]. The implementation of carbon mitigation policies such as cap-and-trade systems is being incrementally noticed worldwide. Gas turbines, for instance, pour extensive amounts of carbon monoxide and dioxide into the atmosphere. Therefore, research is suggesting new strategies to cut down the pollution caused by power generation systems. For instance, Dimitriadis et al. [13] proposed a bi-level optimization framework to enhance and optimize order strategies for gas-fired power plants based on weighting the market of electricity and natural fuel. An emission trading system (ETS) would be also a good candidate market-based tool to create motivation to mitigate greenhouse gas emissions and save natural gas reserves.
In the case of a sole GT power plant, waste heat can be used to preheat inlet air using a recuperator, improving the GT cycle’s thermal efficiency. Another way of improving the efficiency of GT power plants is to use solar energy. For instance, Al-Otoom et al. [14] used PTC to increase the temperature of the air entering the CC, decreasing NG consumption by 64%.

1.3. The Third Problem of GTs: Sensitivity to Ambient Air Temperature

1.3.1. Ambient Air Temperature Control by Inlet-Air-Cooling Techniques

An increase in the ambient temperature causes a drop in GT output power [15] since power output heavily depends on the air mass flow rate, creating the third problem. The specific volume of air at the air compressor’s inlet increases by the increase in ambient temperature, requiring more power to be compressed. Extremely hot climate regions whose daily high temperature can reach 50 °C often use gas turbine power plants. For instance, it was reported that a 0.74% and 0.1% decrease in GT power output and overall thermal efficiency, respectively, are expected if the ambient temperature increases by 1 °C [16]. In hot-weather regions, the electricity demand is typically accompanied with an increment in ambient temperature due to air conditioning load [17], suggesting IAC could be a solution, either by evaporation to reduce temperature and increase humidity or refrigeration to only reduce temperature.
Many gas turbines are combined with HRUs that drive steam turbine STs to use the most power from waste heat, making the ACU limited and unable to reach the ideal inlet air temperature of 5 °C [18] because the condensation of sulfuric acid [19], corrosive to the pipes of the heat exchangers [20], will occur below this ideal temperature. Darwish Ahmad et al. [7] managed to utilize this small amount of waste heat in the GTCC and successfully overcame these two problems by proposing a hybrid IAC system that uses ACU and MCU. The absorption chilling unit, limited by low waste heat, can reduce the ambient temperature to a certain degree, after which the MCU can extend the temperature drop until it reaches 5 °C.

1.3.2. The Effect of Inlet Air Cooling on Fuel Consumption

IAC is efficient in boosting power-plant-generated power and improving its efficiency. On the other hand, cooling the air that enters the compressor decreases the temperature of air leaving the compressor, considering its polytropic efficiency [21], and, hence, cooler air enters the CC. Consequently, the amount of energy that needs to be introduced to maintain a constant turbine inlet temperature at the design point will increase [22]. This means that higher amounts of fuel will be introduced in the CC, hence leading to higher amounts of pollutant emissions. Najjar and Al-Zoghool [23] showed that the annual fuel cost would increase by USD 191 K and USD 184 K when employing mechanical and absorption cooling systems, respectively.

1.4. Problem Statement and Motivation for This Study

Previous studies focused on one or two of these challenges simultaneously, but none of these studies addressed these challenges at the same time. For instance, cooling the air entering a compressor to boost generated power has extensively been investigated. Even though it introduces reasonable control over the air temperature at the compressor’s inlet, the amount of fuel used in the CC considerably increases [24]. In addition, researchers have investigated utilizing waste heat to preheat the CC’s inlet air and operating IAC cycles, which are thermally driven to improve power plant efficiency [25]. In some cases, researchers even investigated integrating renewable resources into existing power plants [26]. This proposed work will consider not only the importance of research from the position of applying a gas turbine whose intake system is the subject of utilization but also the utilization of fuel consumption by increasing air temperature before the combustion chamber. However, and most importantly, as explained by Cho and Saito [27], these three problems are nonlinear—the same as TPS. Therefore, they should be investigated simultaneously and addressed together. Hence, this study aims to investigate these issues simultaneously by considering the following:
  • An actual GTCC was integrated with a PTC. Hence, the initial GT dilemma was resolved using a steam generator with a heat recovery system to operate an ST to generate extra power.
  • A new CSS was introduced with two SHEs powered by PTCs to address the second and third dilemmas.
    The first solar heat exchanger, SHE1, was utilized to preheat the air that enters the combustion chamber to decrease the amount of fuel the system uses, hence further decarbonizing the system.
    The second solar heat exchanger, SHE2, operated an ACU to decrease the compressor’s inlet air temperature to 5 °C. According to the recommendation, the air temperature cooling was limited to this temperature to attain the highest output power while eliminating the possibility of ice formation on the compressor’s blades.
Researchers [28,29] have used existing power plant performance to validate their theoretical configurations and predictions. Following this methodology, the Al-Qatrana GTCC located in Jordan was adopted as an actual case study to be examined in this paper to confirm the prediction and reliability of the developed code. The current Al-Qatrana power plant is highly affected by high ambient temperatures and large fuel consumption rates [30]. The proposed system offers an environmentally friendly and sustainable resolution to solve the problem associated with increased fuel consumption caused by the IAC, which has not been addressed before.
The novelty and major contributions of this study can be summarized as follows:
  • A solution that simultaneously addresses the three problems of GTCC plants using solar energy is presented.
  • The energy of the integration is explored by employing thermodynamic, heat transfer equations, and semi-empirical equations.
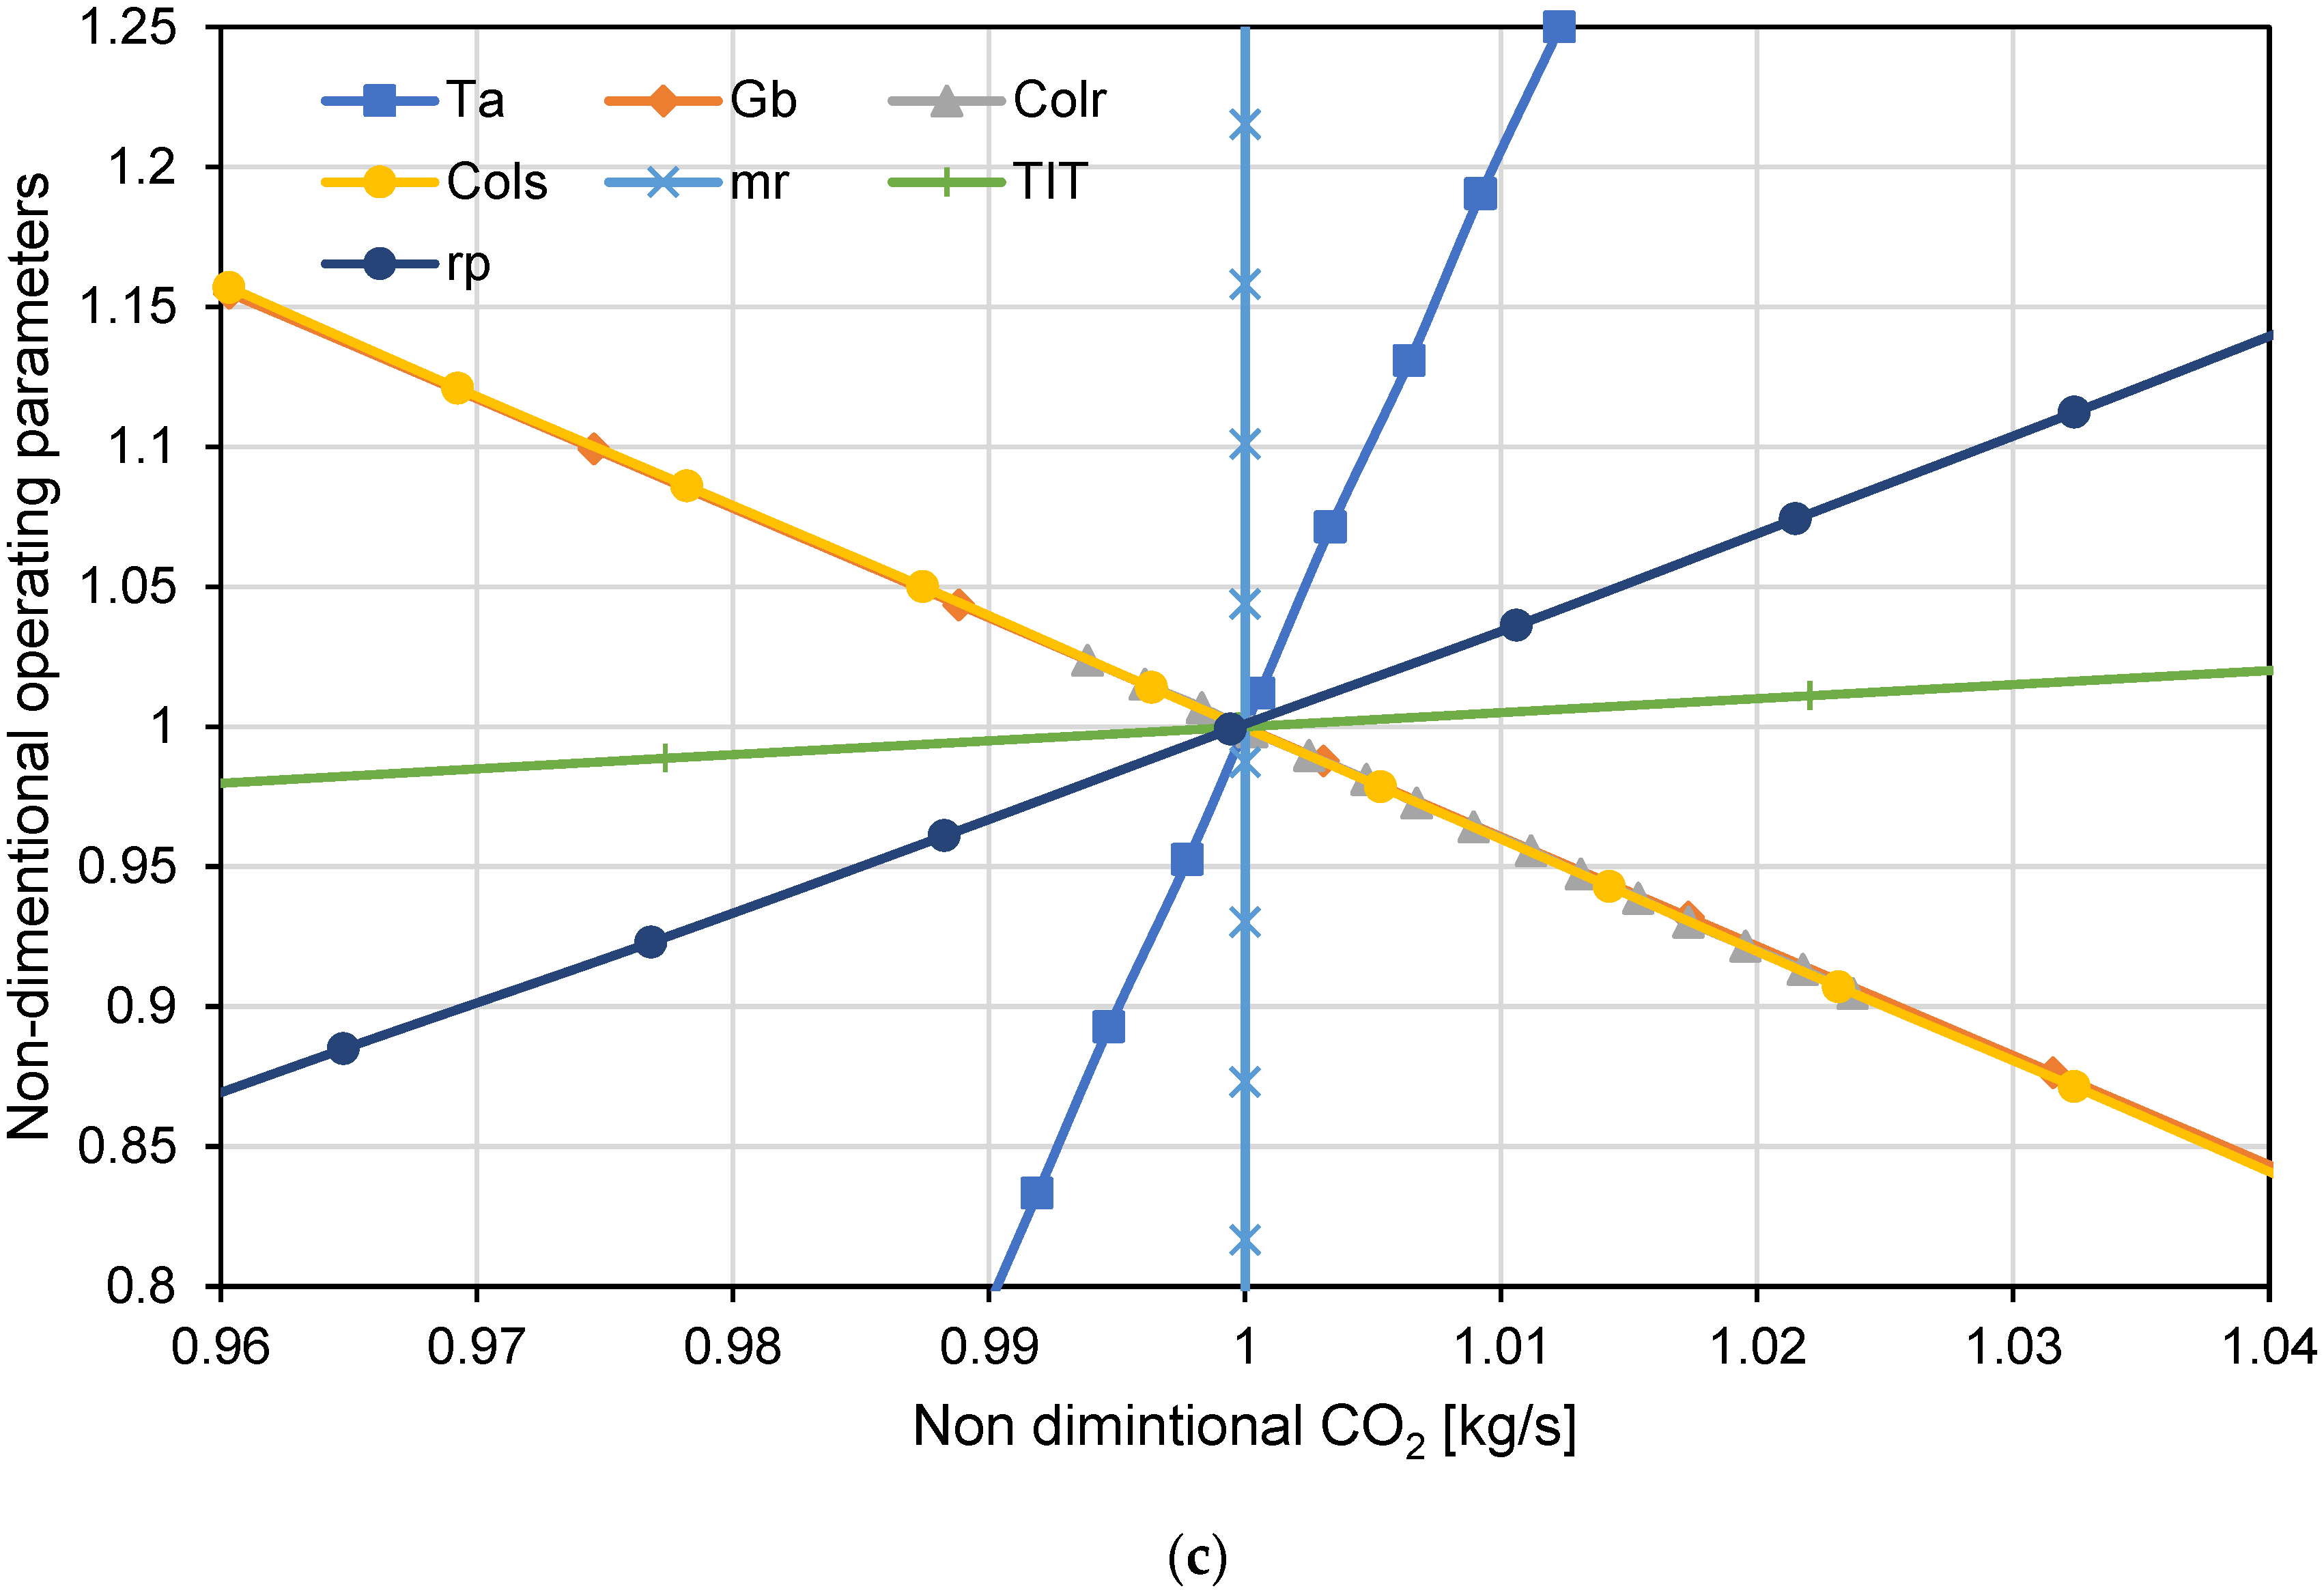
  • The environmental aspects of the combined cycle are improved by reducing greenhouse gas emissions and pollutants (CO, CO2, and NOx).
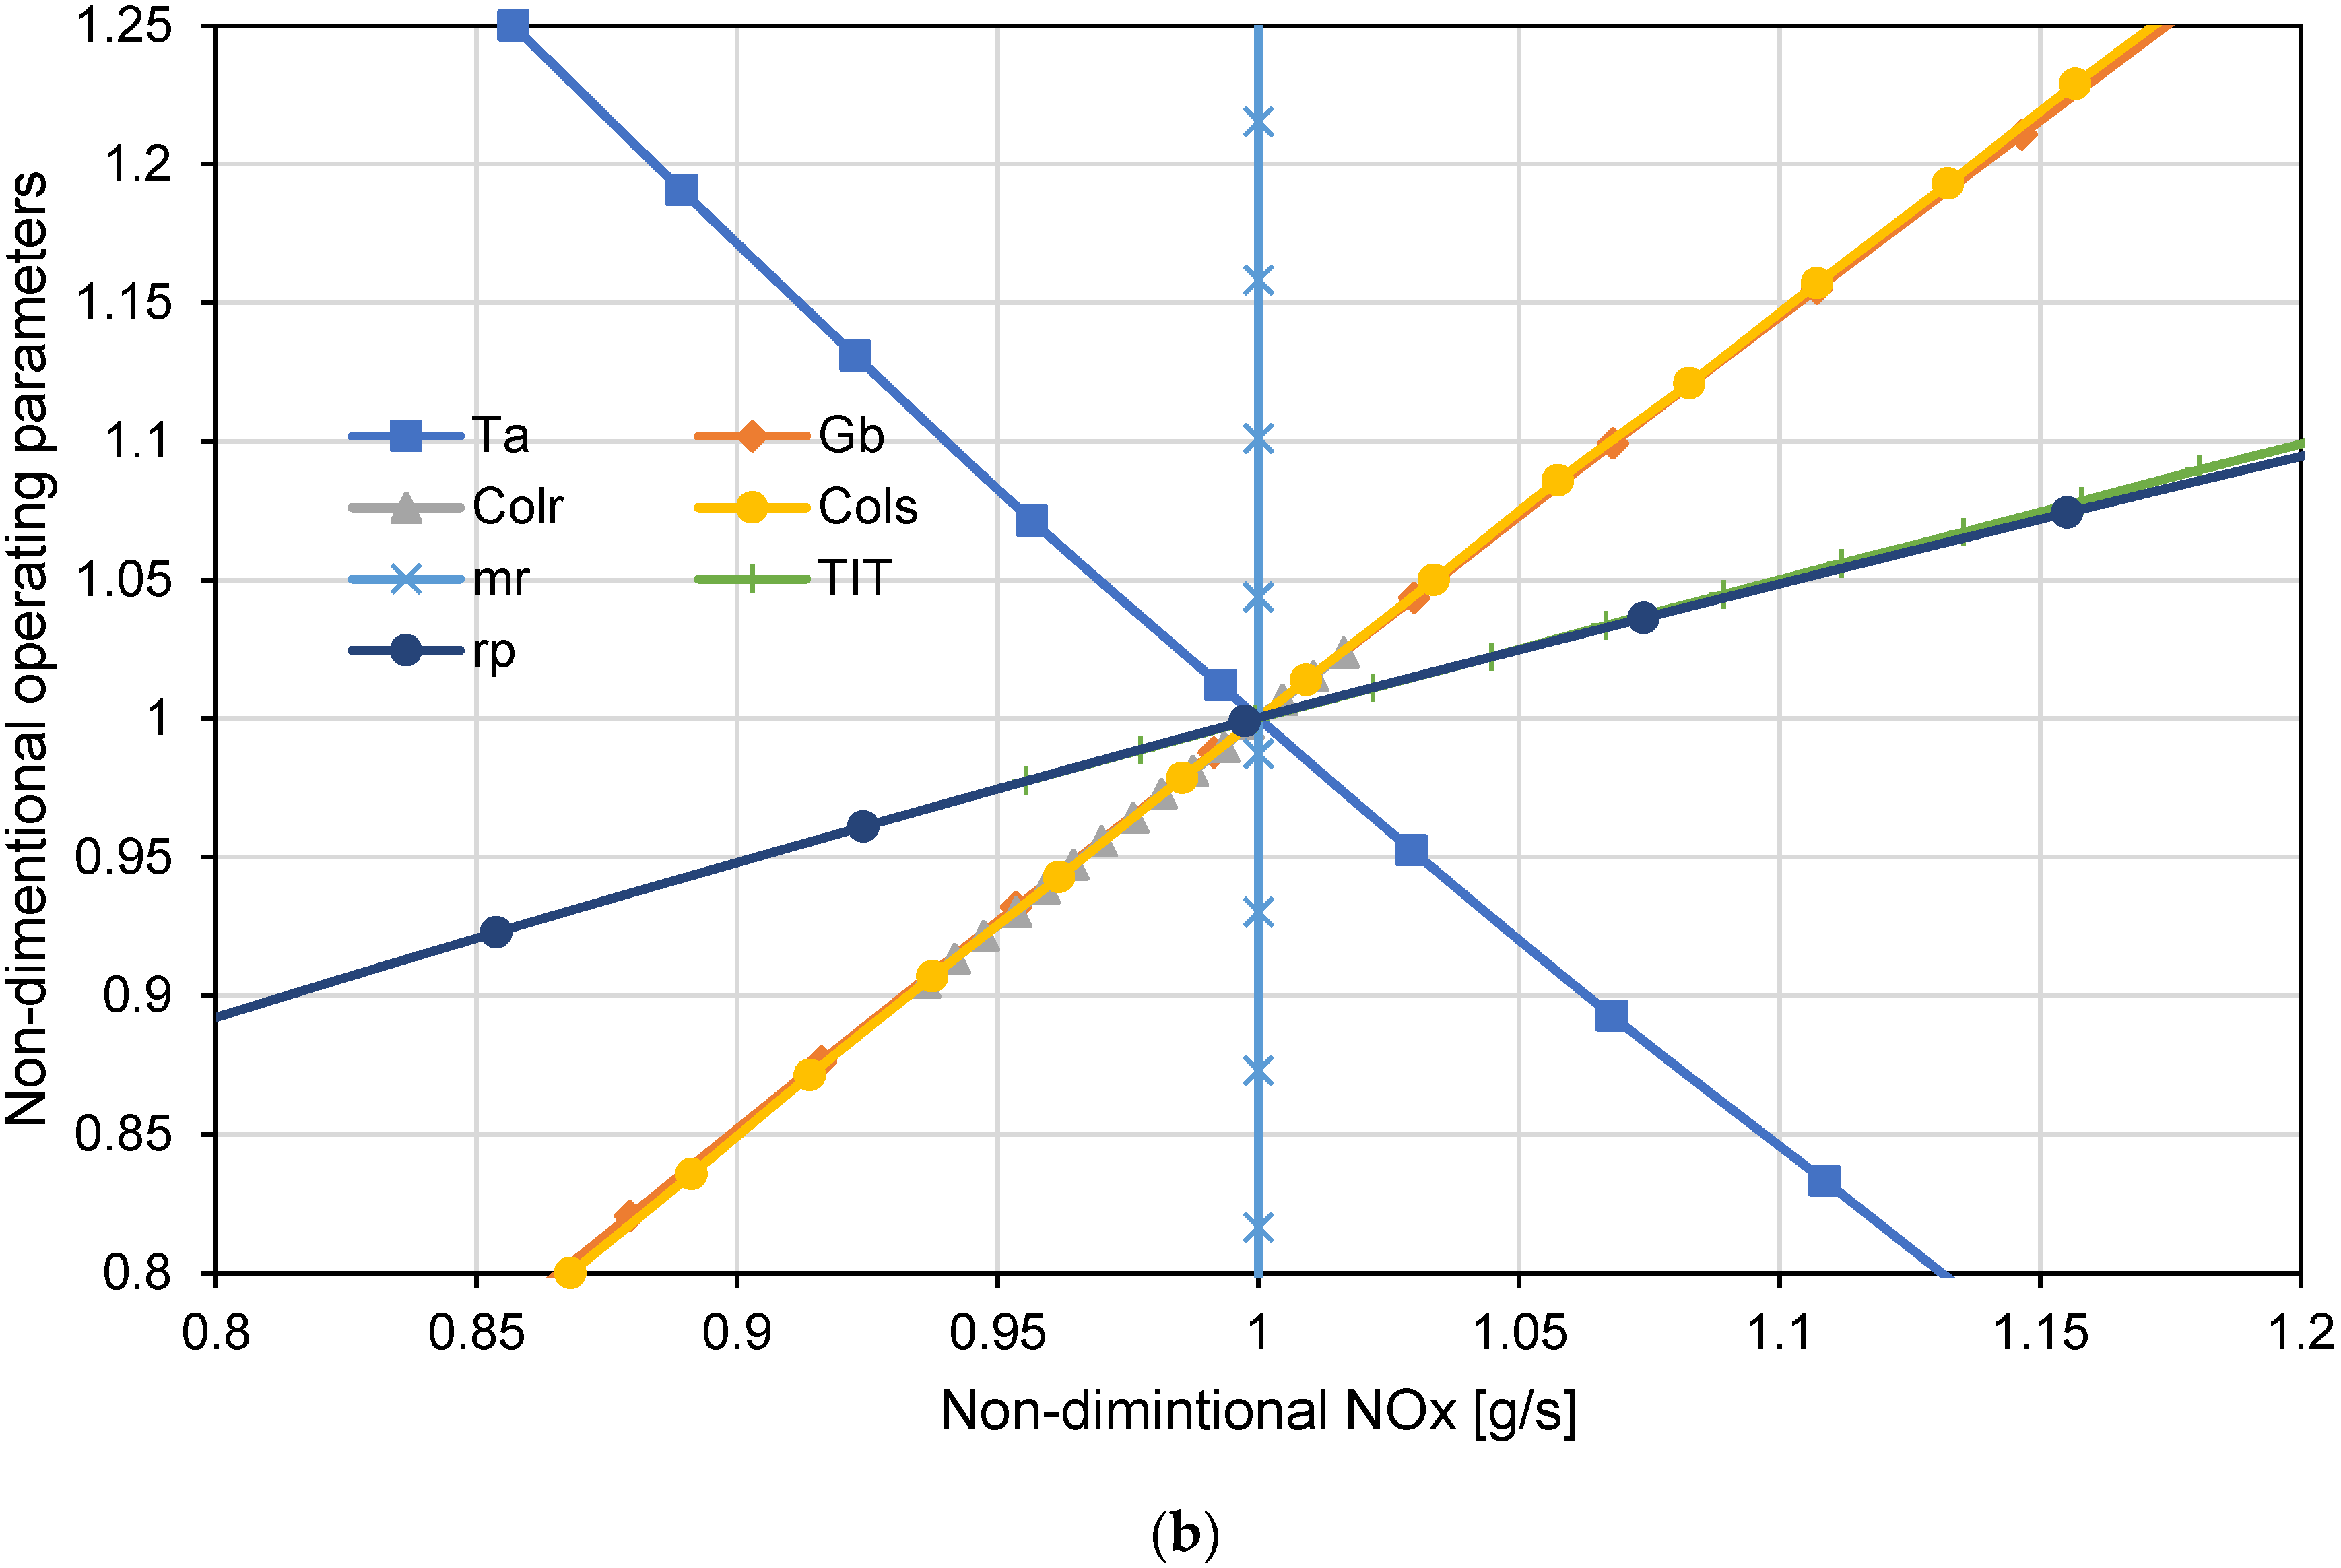
  • A parametric spider diagram study of the major operating parameters is used to examine their impact on the power plant’s performance and pollutant emissions.
Figure 1 summarizes the methodology adopted in this study.
The following sections will provide a detailed description of the proposed system (Section 2), an explanation of the modeling methods used for all system components, and details of the performance analysis conducted.

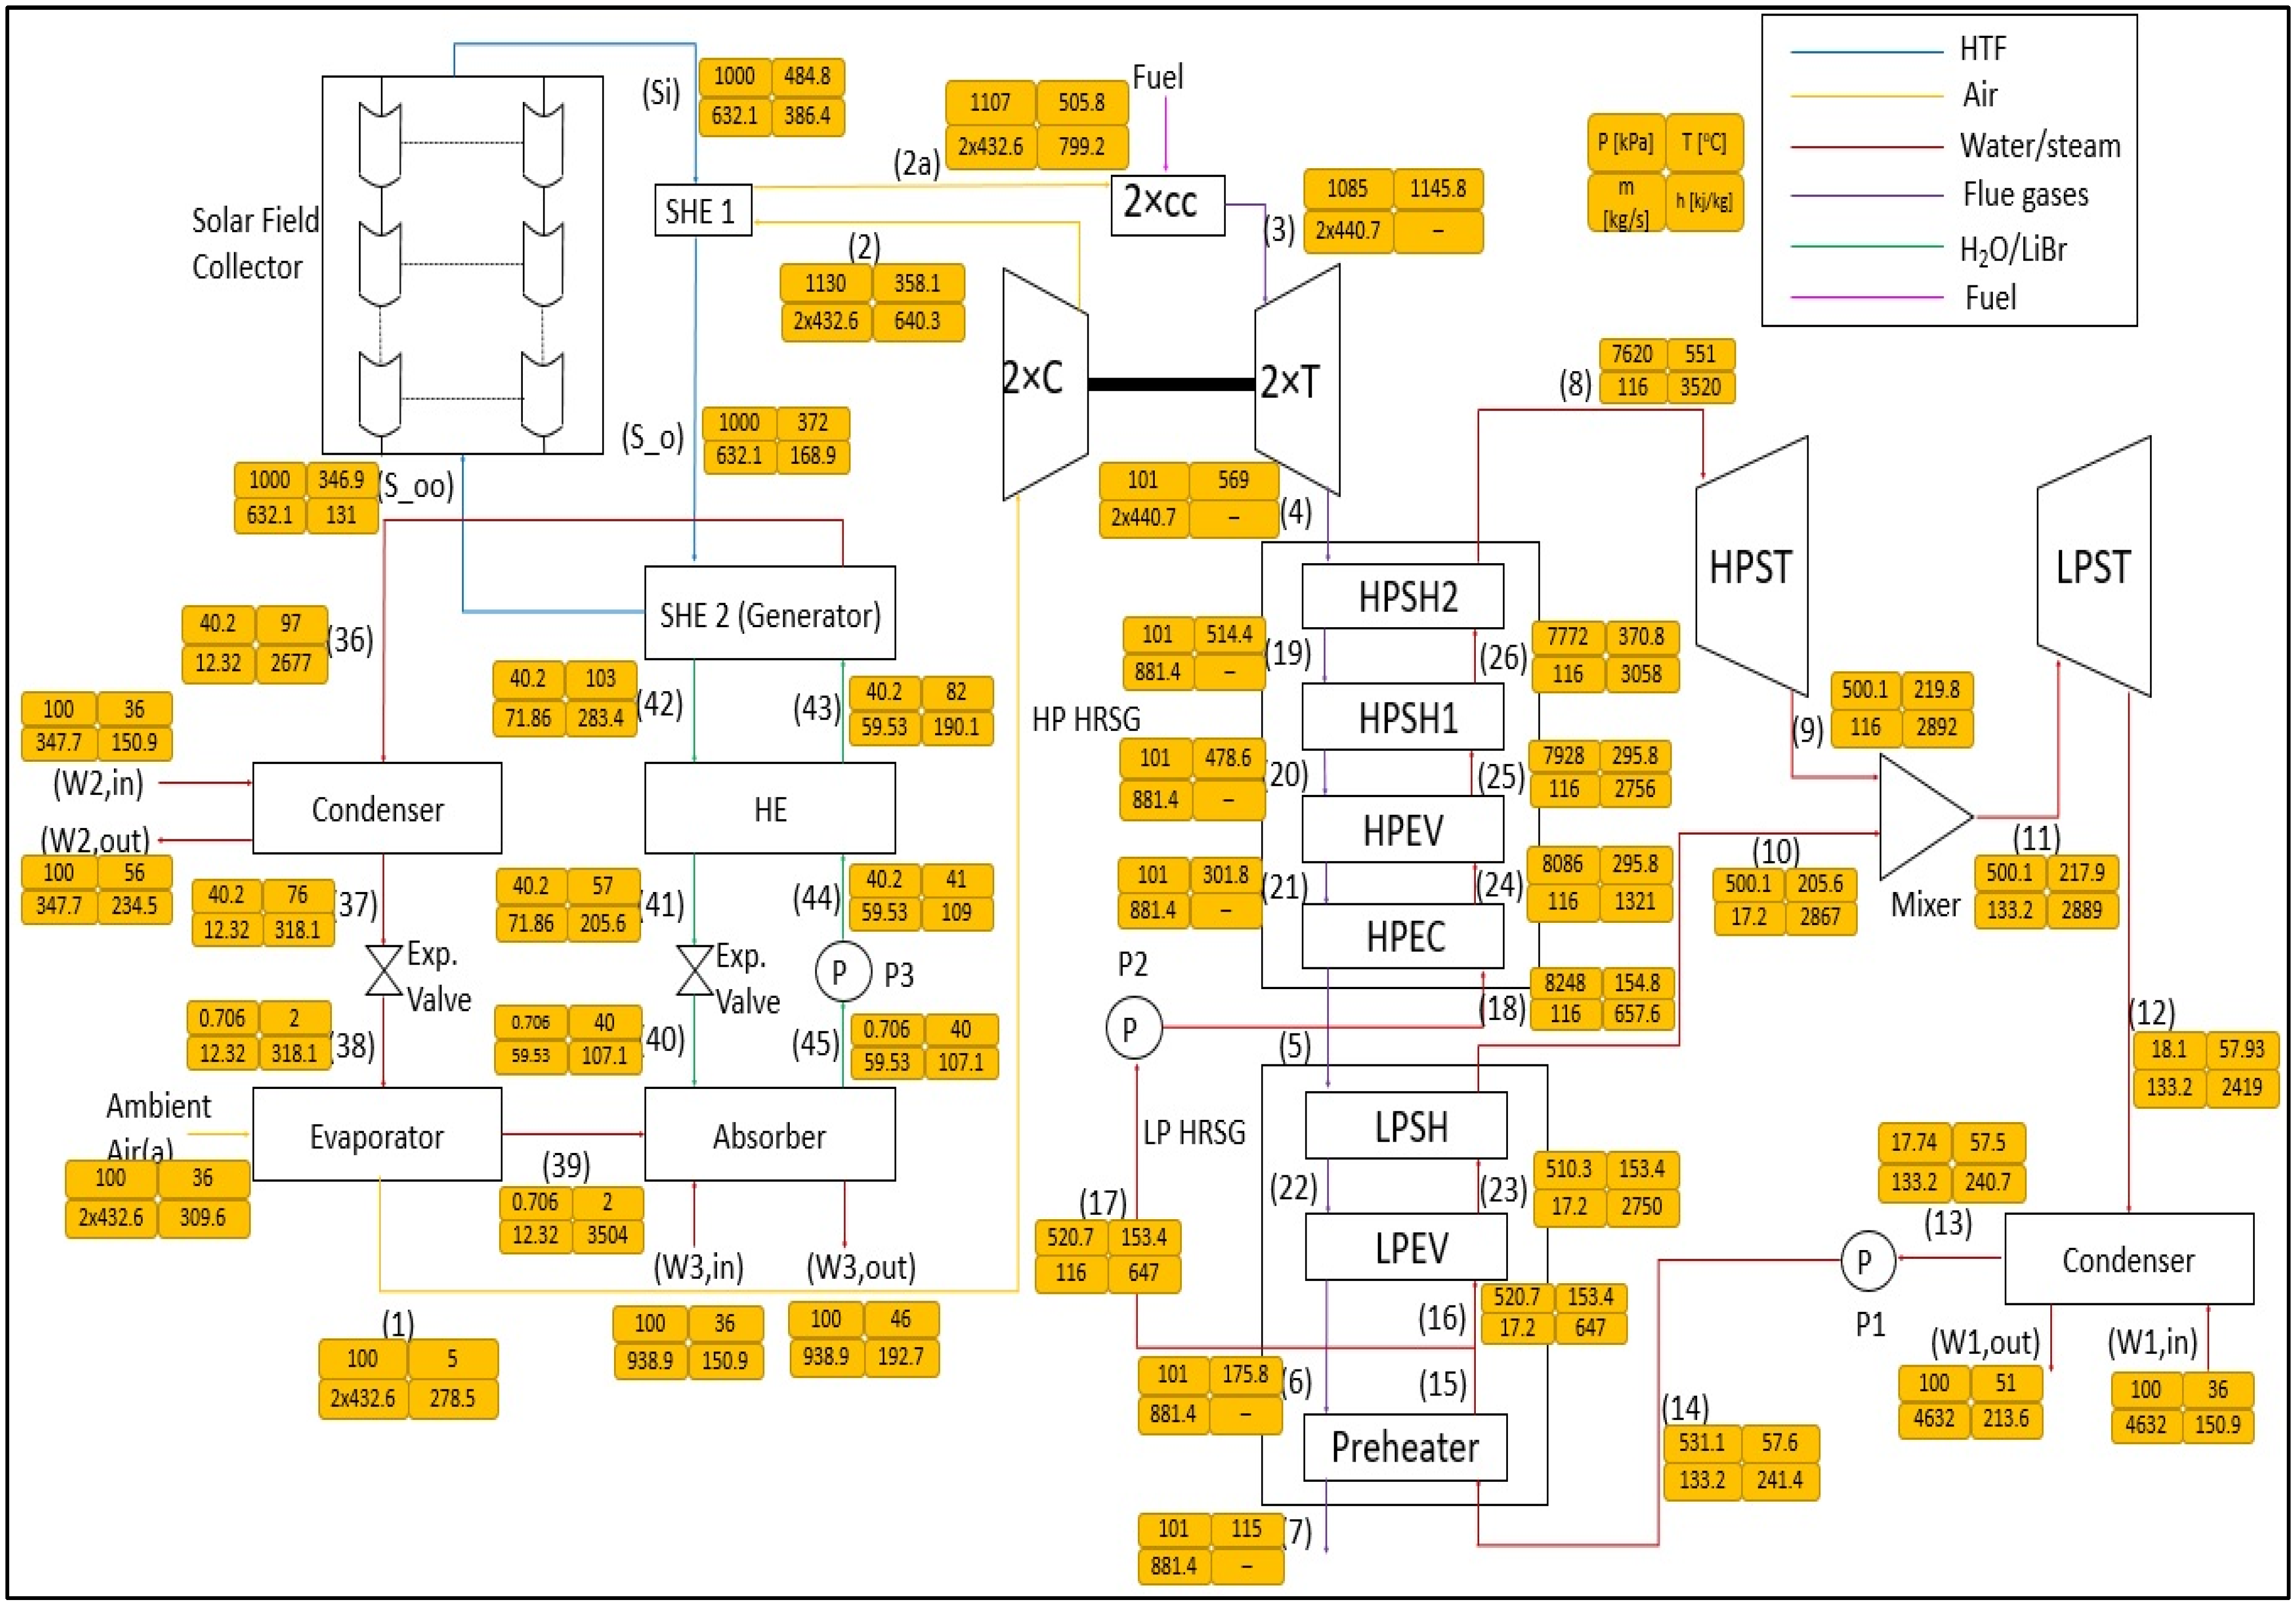
2. System Description

As mentioned, Al-Qatrana was selected as an actual GTCC, since its operational conditions can vary within an acceptable range, to find the best operating conditions for integration with the CSS [28]. Further information about the power plant can be found in [31]. Waste heat from GTs is utilized in one double-pressure level HRSG connected to high- and low-pressure STs to produce power. Figure 2 shows the proposed integrated GTCC combined with the PTC system and ACU system (PACC). Two solar heat exchangers are cascaded to preheat the compressed air before entering the CC and operating the absorption chiller.
The proposed system consists of a gas turbine, where, after the compressor, there is a solar parabolic collector station that increases the temperature further before entering the combustion chamber. This can reduce the fuel used while keeping the operational temperature at the design point. The remaining heat from the parabolic solar collectors was utilized in an absorption cooling unit to reduce the ambient temperature before entering the compressor to reduce its power consumption. In Heller et al. [32], the first original solar-powered gas turbine system was installed and tested in the CESA-1 tower facility at Plataforma Solar de Almerı’a (PSA) in Spain.
Figure 2. Schematic diagram of the main system [33].
Sustainability 16 06229 g002
To ensure the system’s reliability, PACC was divided into four subsystems, GT, HRU, PTC, and ACU, and each subsystem was validated with the literature data. Finally, the overall PACC integration of all subsystems was validated using EES software 9.4.7.8 [34].
Readers are referred to Figure 2, which follows the sequence of the PACC. The GT sequence is summarized in Figure 3. After air is pressurized in the compressor, it is heated up in stages by concentrated solar panels and then by the combustion chamber via combustion with fuel. High-energy combusted gases are utilized in the turbine. Since the fuel input is decreased due to the preheating in SHE2, the mass flow rate of flue gas decreases proportionally, and power generation in the STs is expected to reduce. The subsequent HRSG starting from pump1 is illustrated in Figure 4. As for the CSP system, PTCs are used to reflect the solar radiation incident on a PTC absorber in which the HTF (molten salt) flows. The sequence of the CSP system is illustrated in Figure 5. As for the ACU, a single-effect LiBr/H2O is considered instead of ammonia/water for poisonousness conundrums. Also, vapor water is considered a refrigerant. Finally, the remaining sequence of the PACC is shown in Figure 6. These diagrams can be interpreted by the main system schematic diagram in Figure 2.

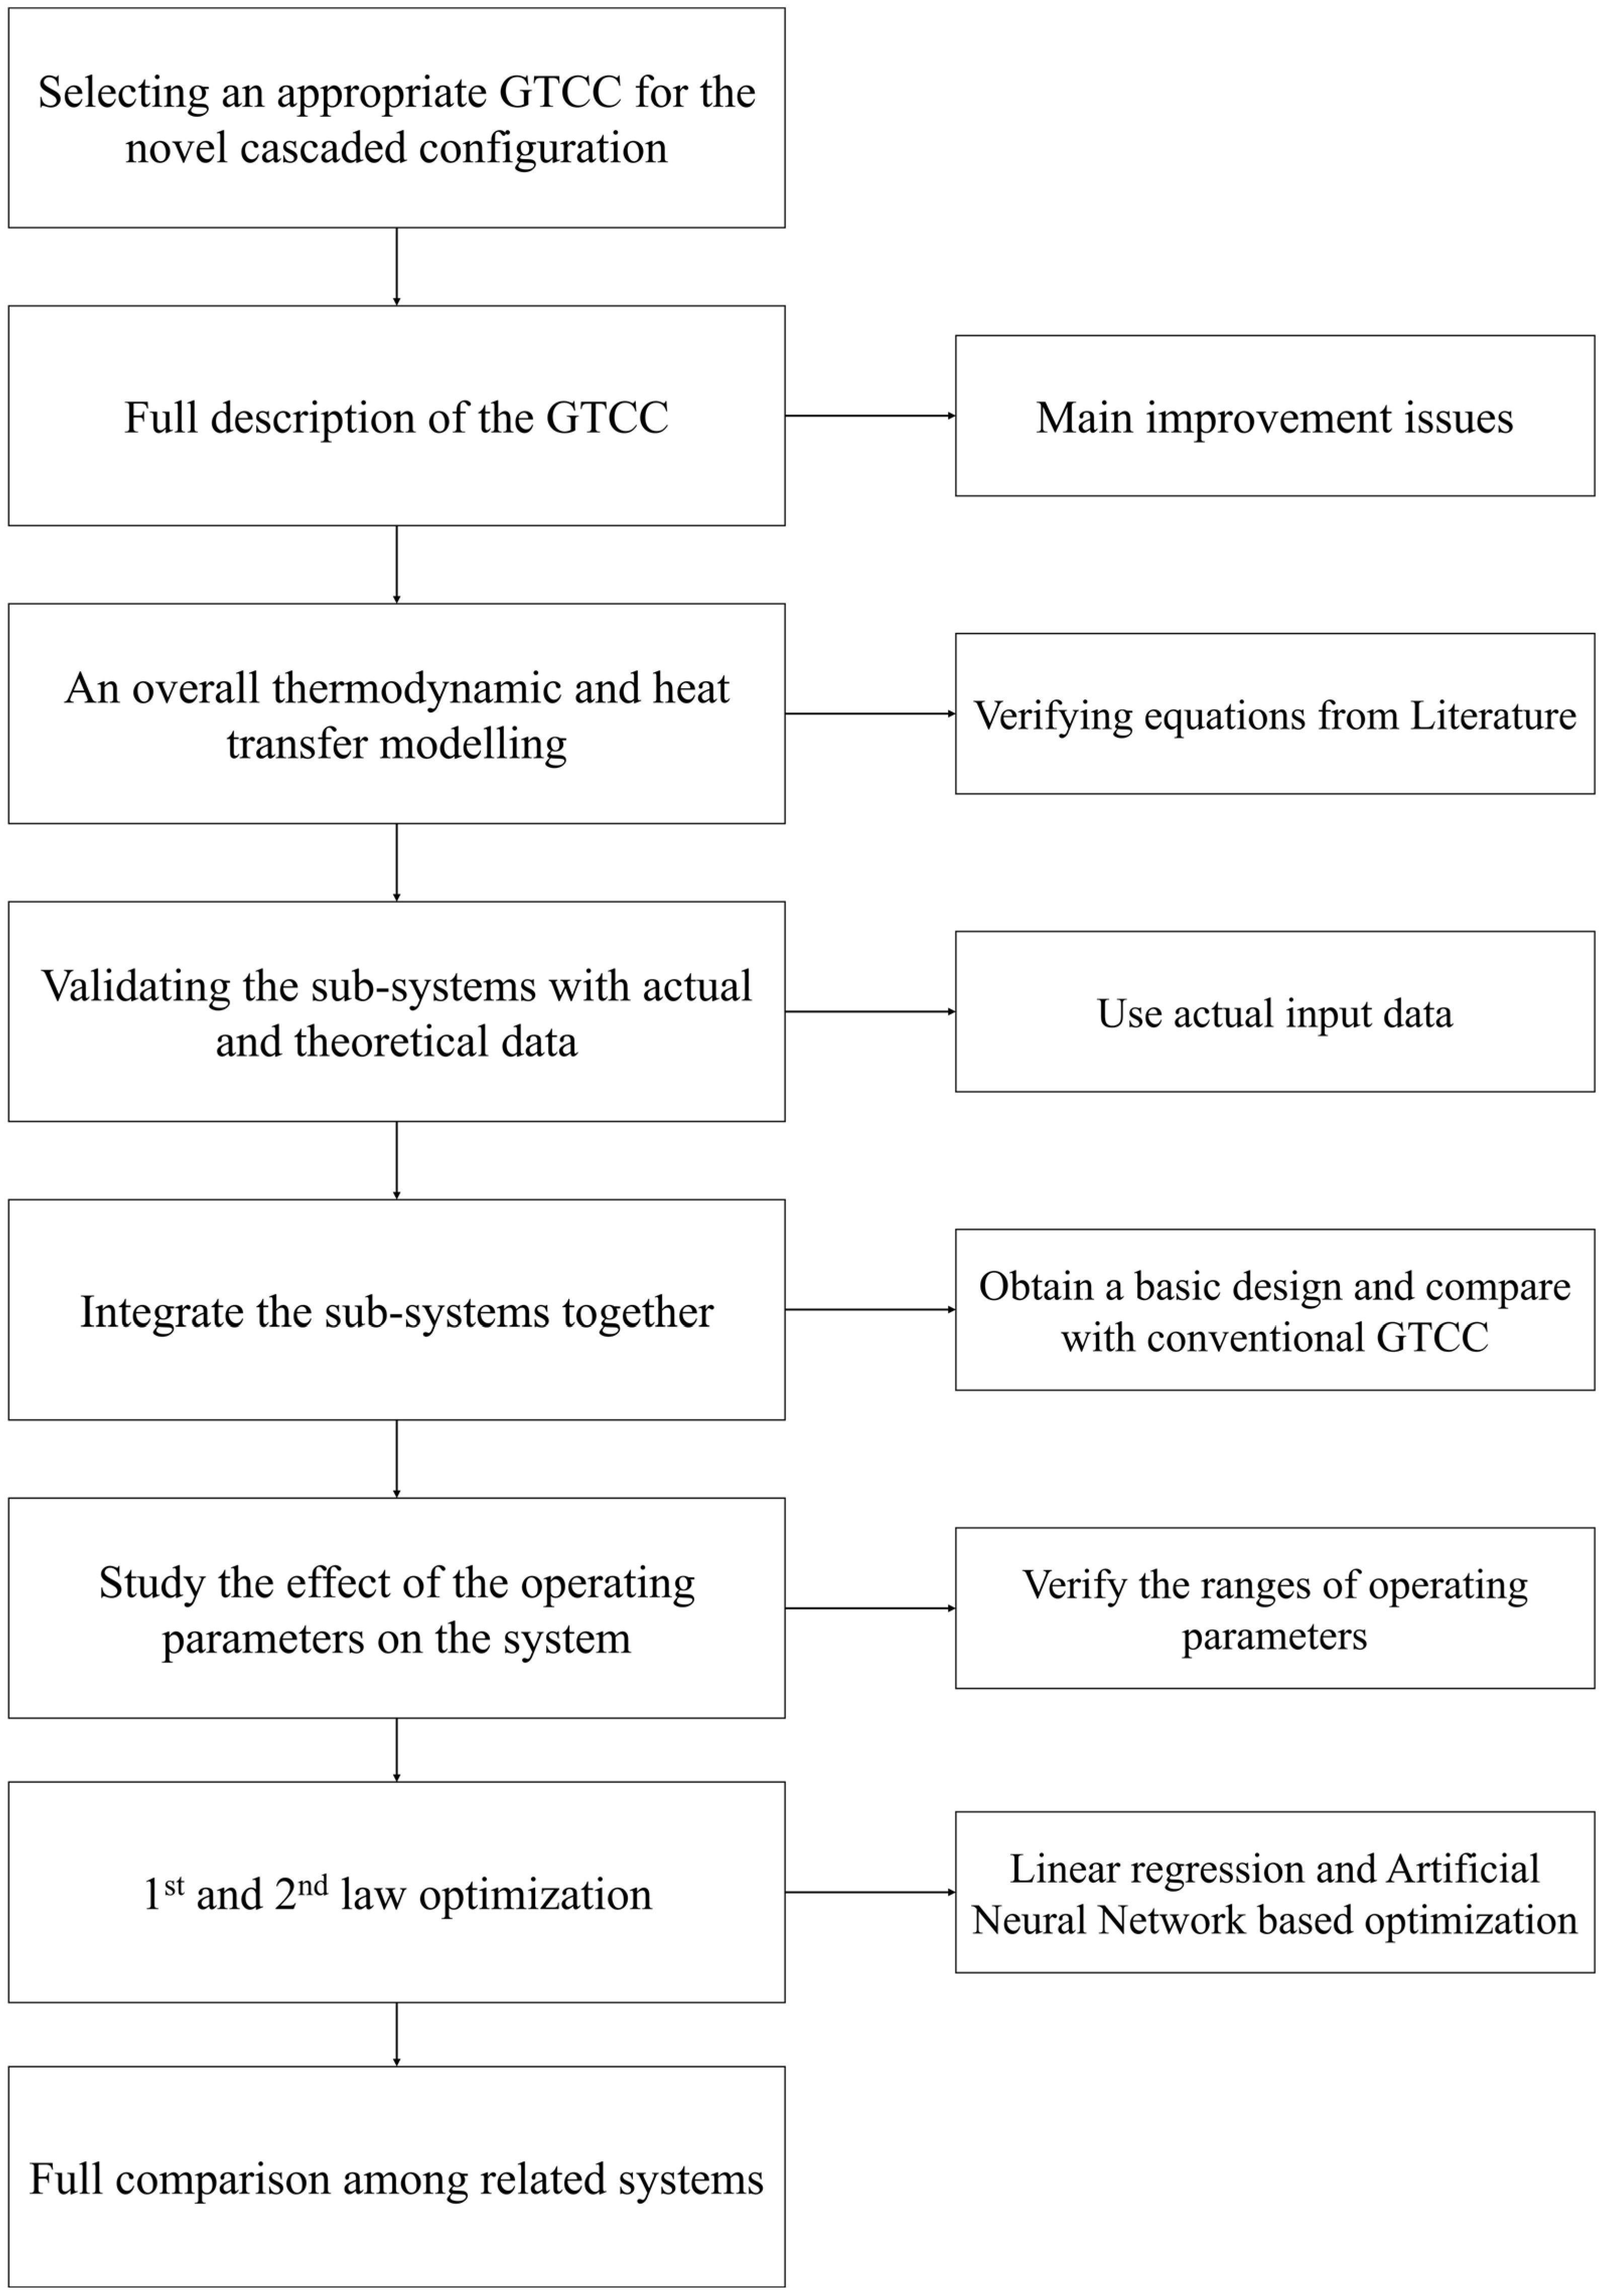
3. Power Plant Modeling

The modeling and performance evaluation of the GTCC, PTC, ACU, and cascaded solar heat exchangers are discussed in this section. The assumption, operating, and ambient conditions at the design point for the Al-Qatrana plant are summarized in Table 1. The assumptions made for the subsystems are adopted from [35] GTCC, ref. [36], PTC, and ACU [7], while the integration of all three components is our original work and is shown here for the first time.
Figure 7 shows a flow chart for the interaction among the units and how each system can contribute to the other. The gas turbine starts to operate the HRU, which results in enhancing the overall performance by recovering heat from exhaust gases and generating additional power using STs. Then, PTC drives the ACU through SHE2 to boost the GT-generated power by reducing the compressor’s power consumption. Finally, SHE1 heats the air before flowing into the CC to decrease the fuel consumption.
Here, we built our mathematical model for the cycle to analyze the performance of the proposed system thermodynamically. Assumptions for each unit of the PACC were made while conducting this study as follows:
  • All PACC components are adiabatic.
  • Steady-state conditions are achieved.
  • Negligible kinetic and potential energies are achieved [37], since the cooling load that is required by the ACU and the heat input required for the compressed air are acquired from the GTs.
  • A pressure drop was assumed to occur through each heat exchanger unit [24].

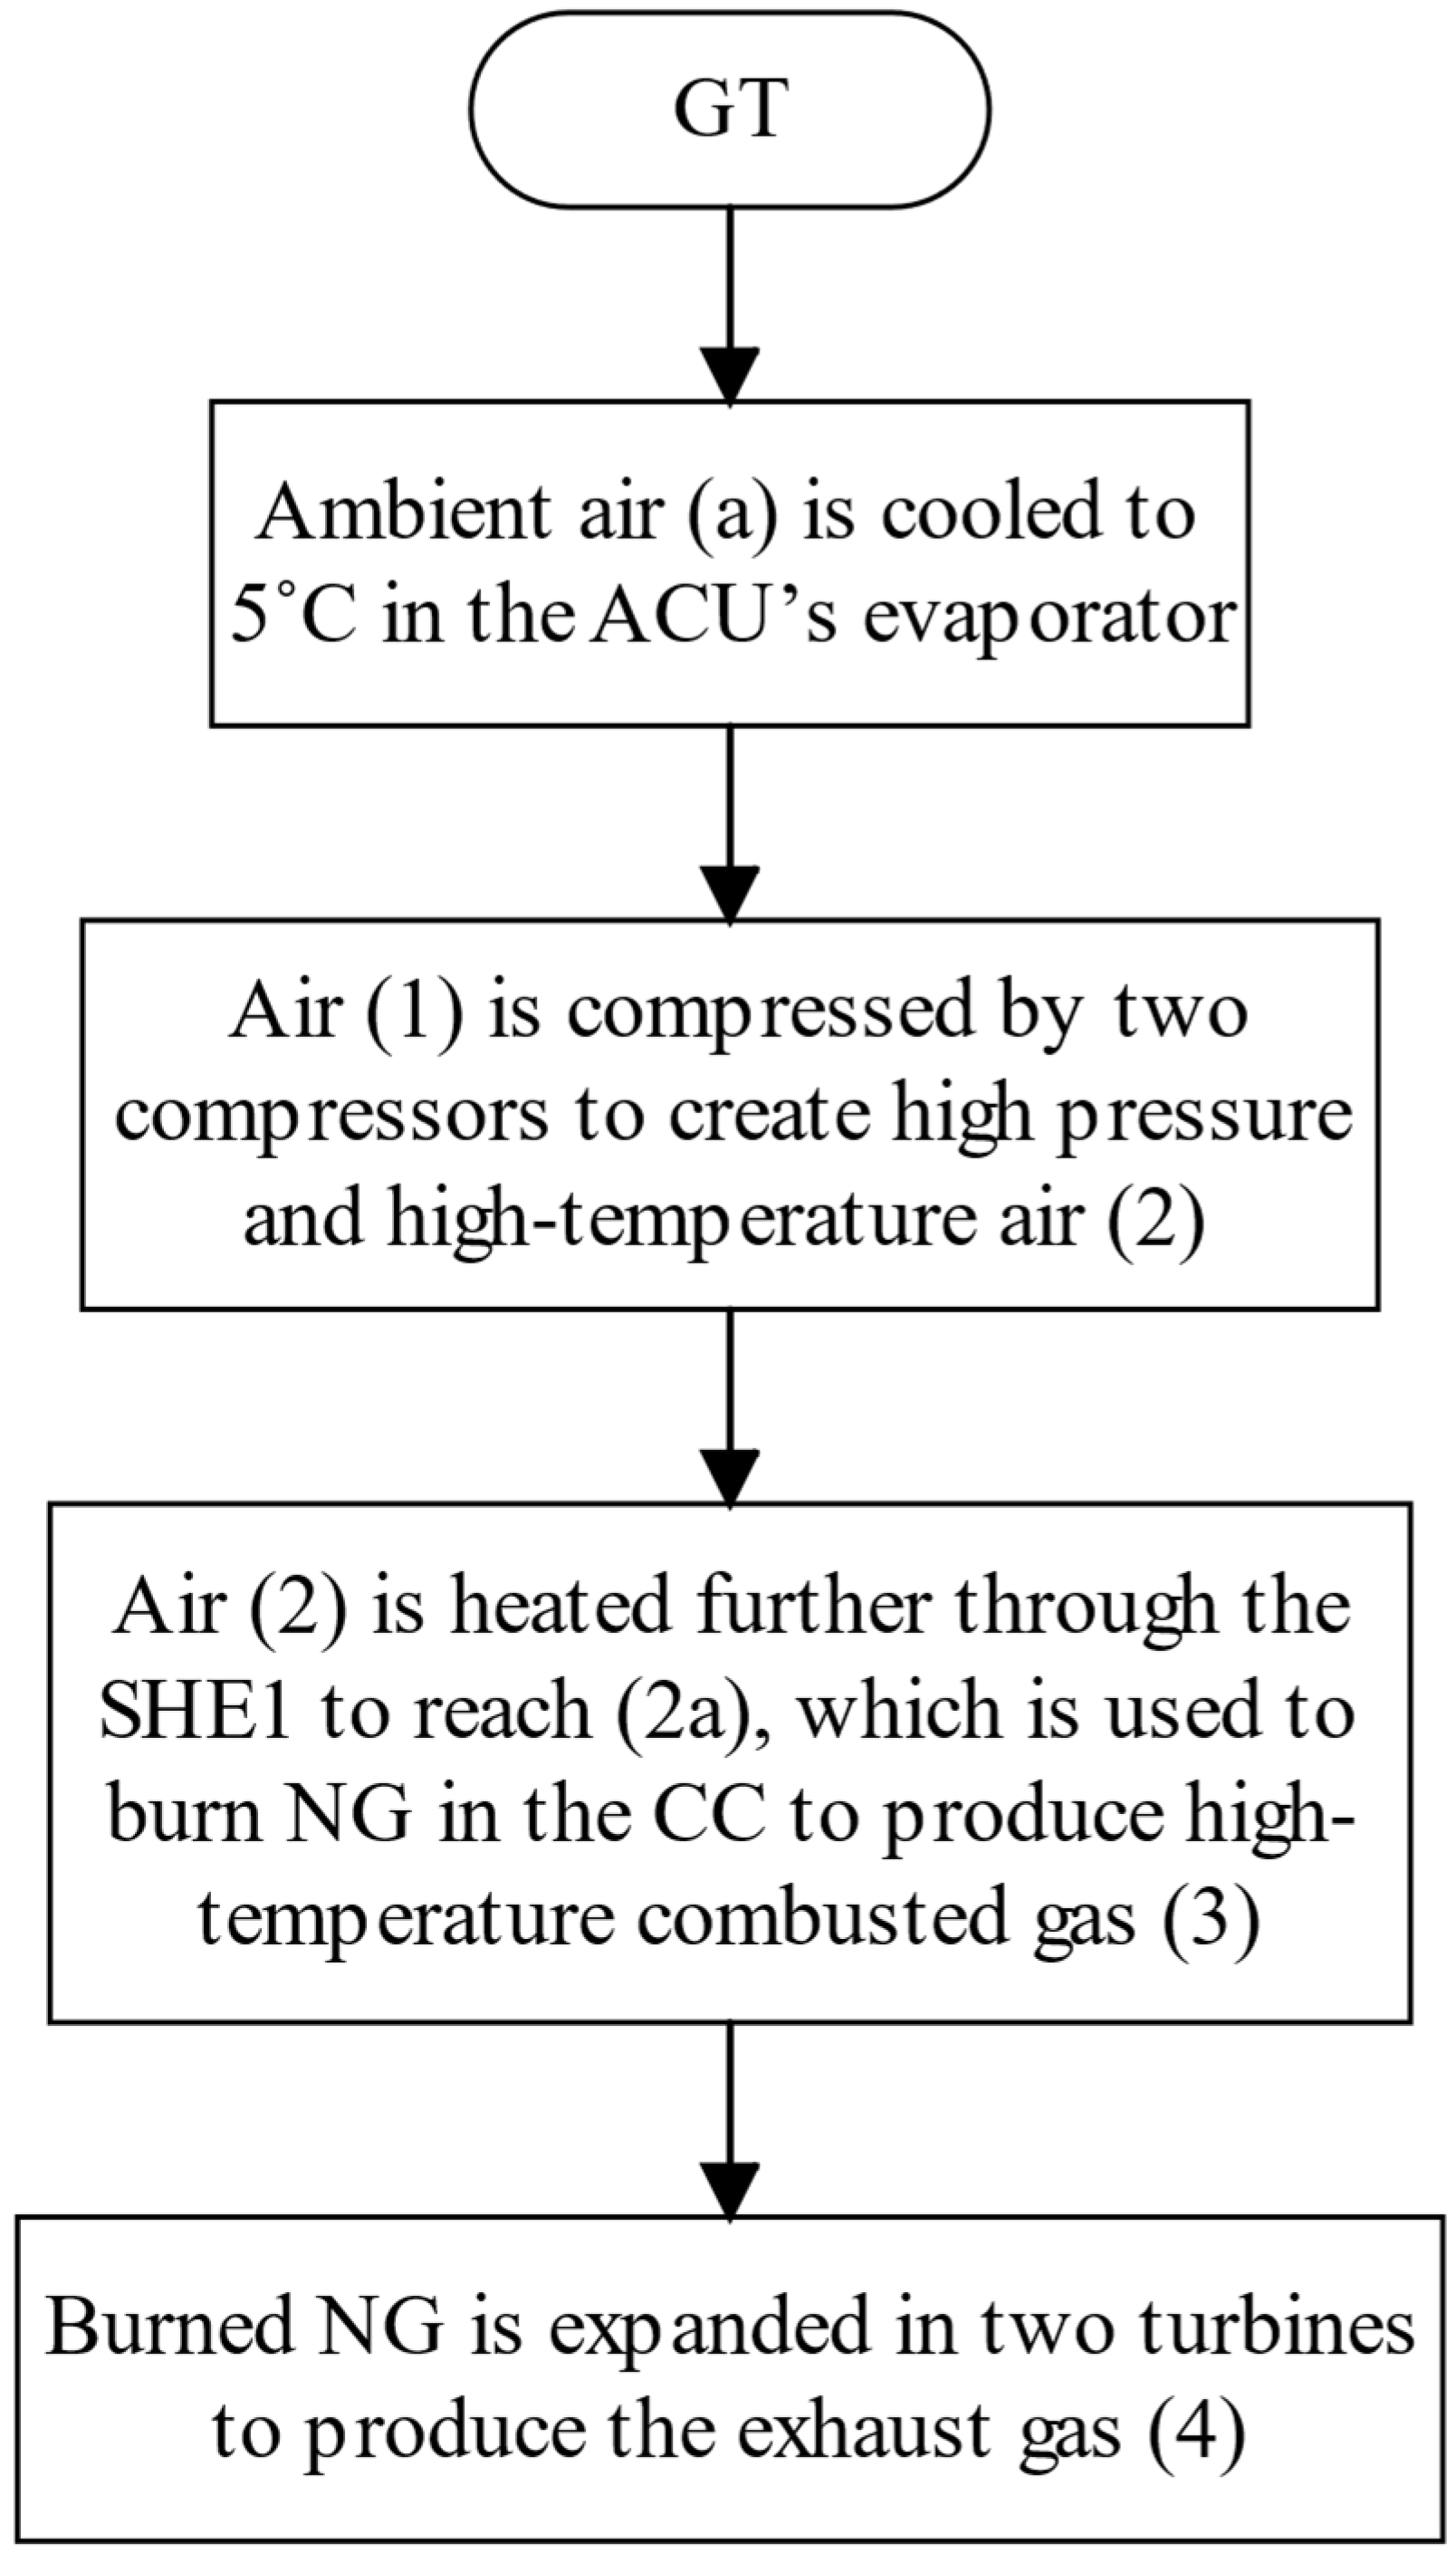
3.1. Modeling of GT Unit

Gas turbines have the highest energy production in the PACC; however, the power generation rate can be further improved at high ambient temperatures. The governing equations to model GT components, compressors, CCs, and turbines for two GTs were adopted from [38], and GTs are shown in Appendix A to simulate the GT operation numerically.

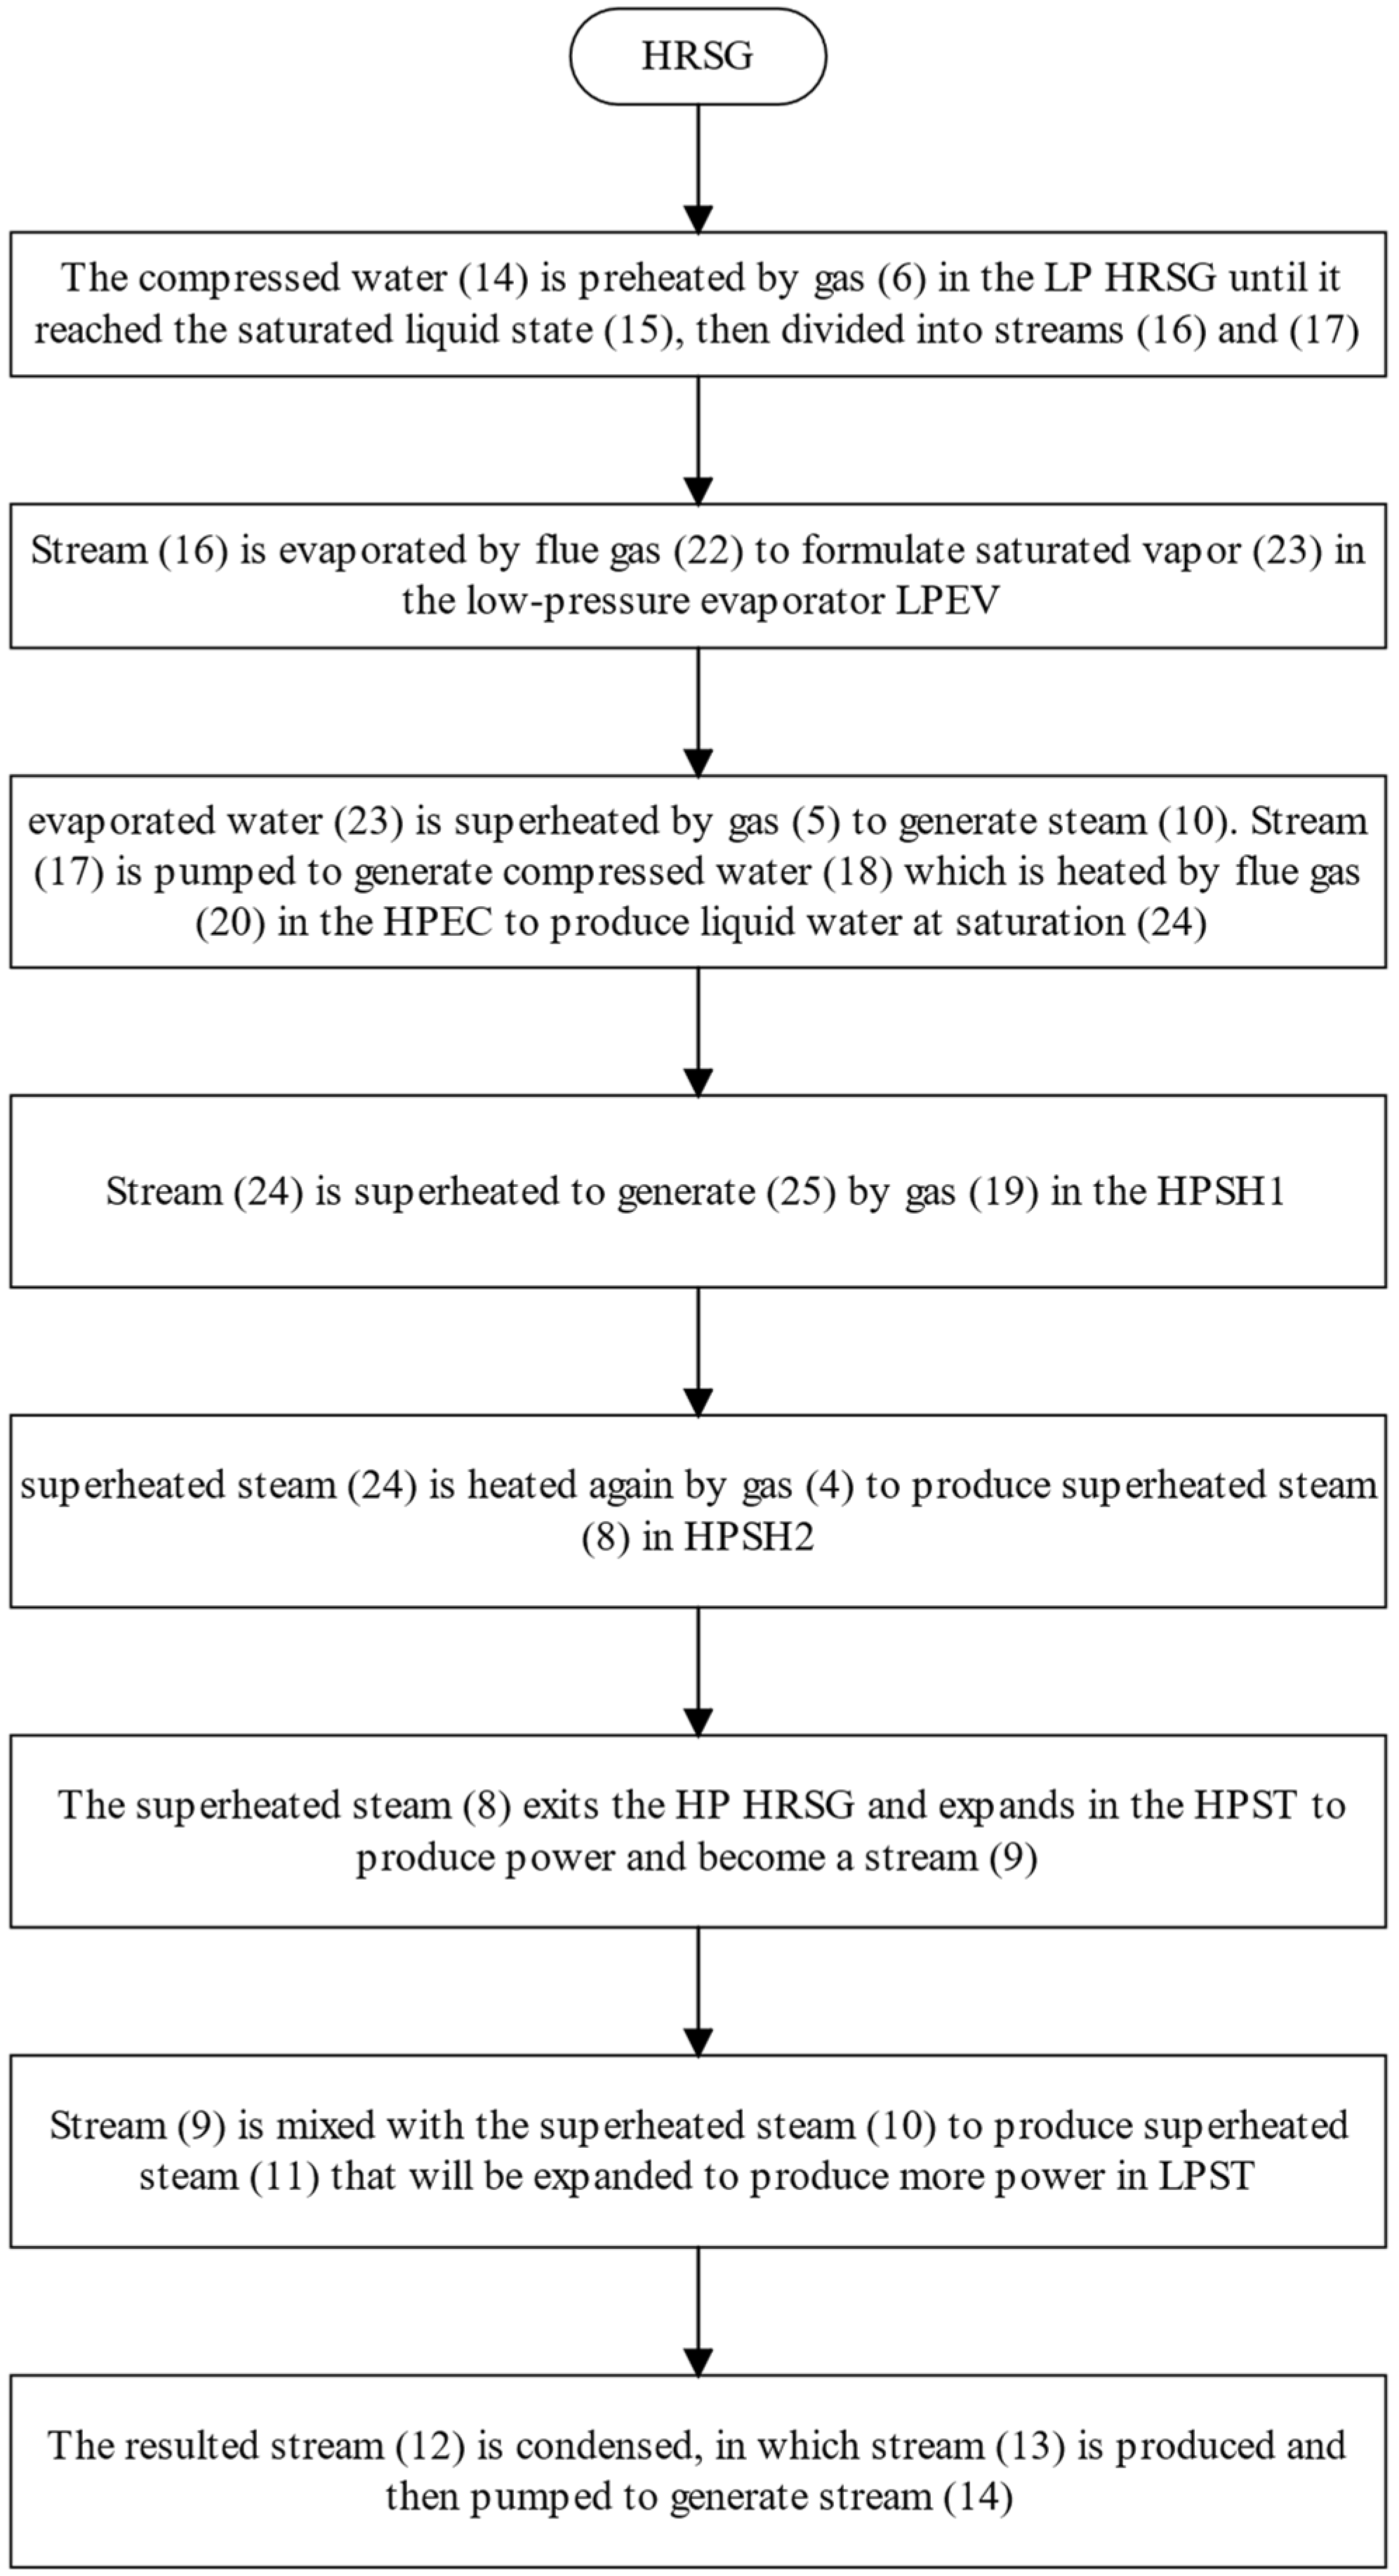
3.2. Modeling of the HRSG Unit

The input energy for the HRSG unit comes directly from the GT waste heat and the PACC, which affects the total mass flow, whose small part comes from the fuel in the total energy output in the STs. While modeling the HRSG, a pressure drop was assumed to occur through each heat exchanger unit [24]. The equations used for calculating the properties of the different states across the heat exchanger are given in Appendix A.

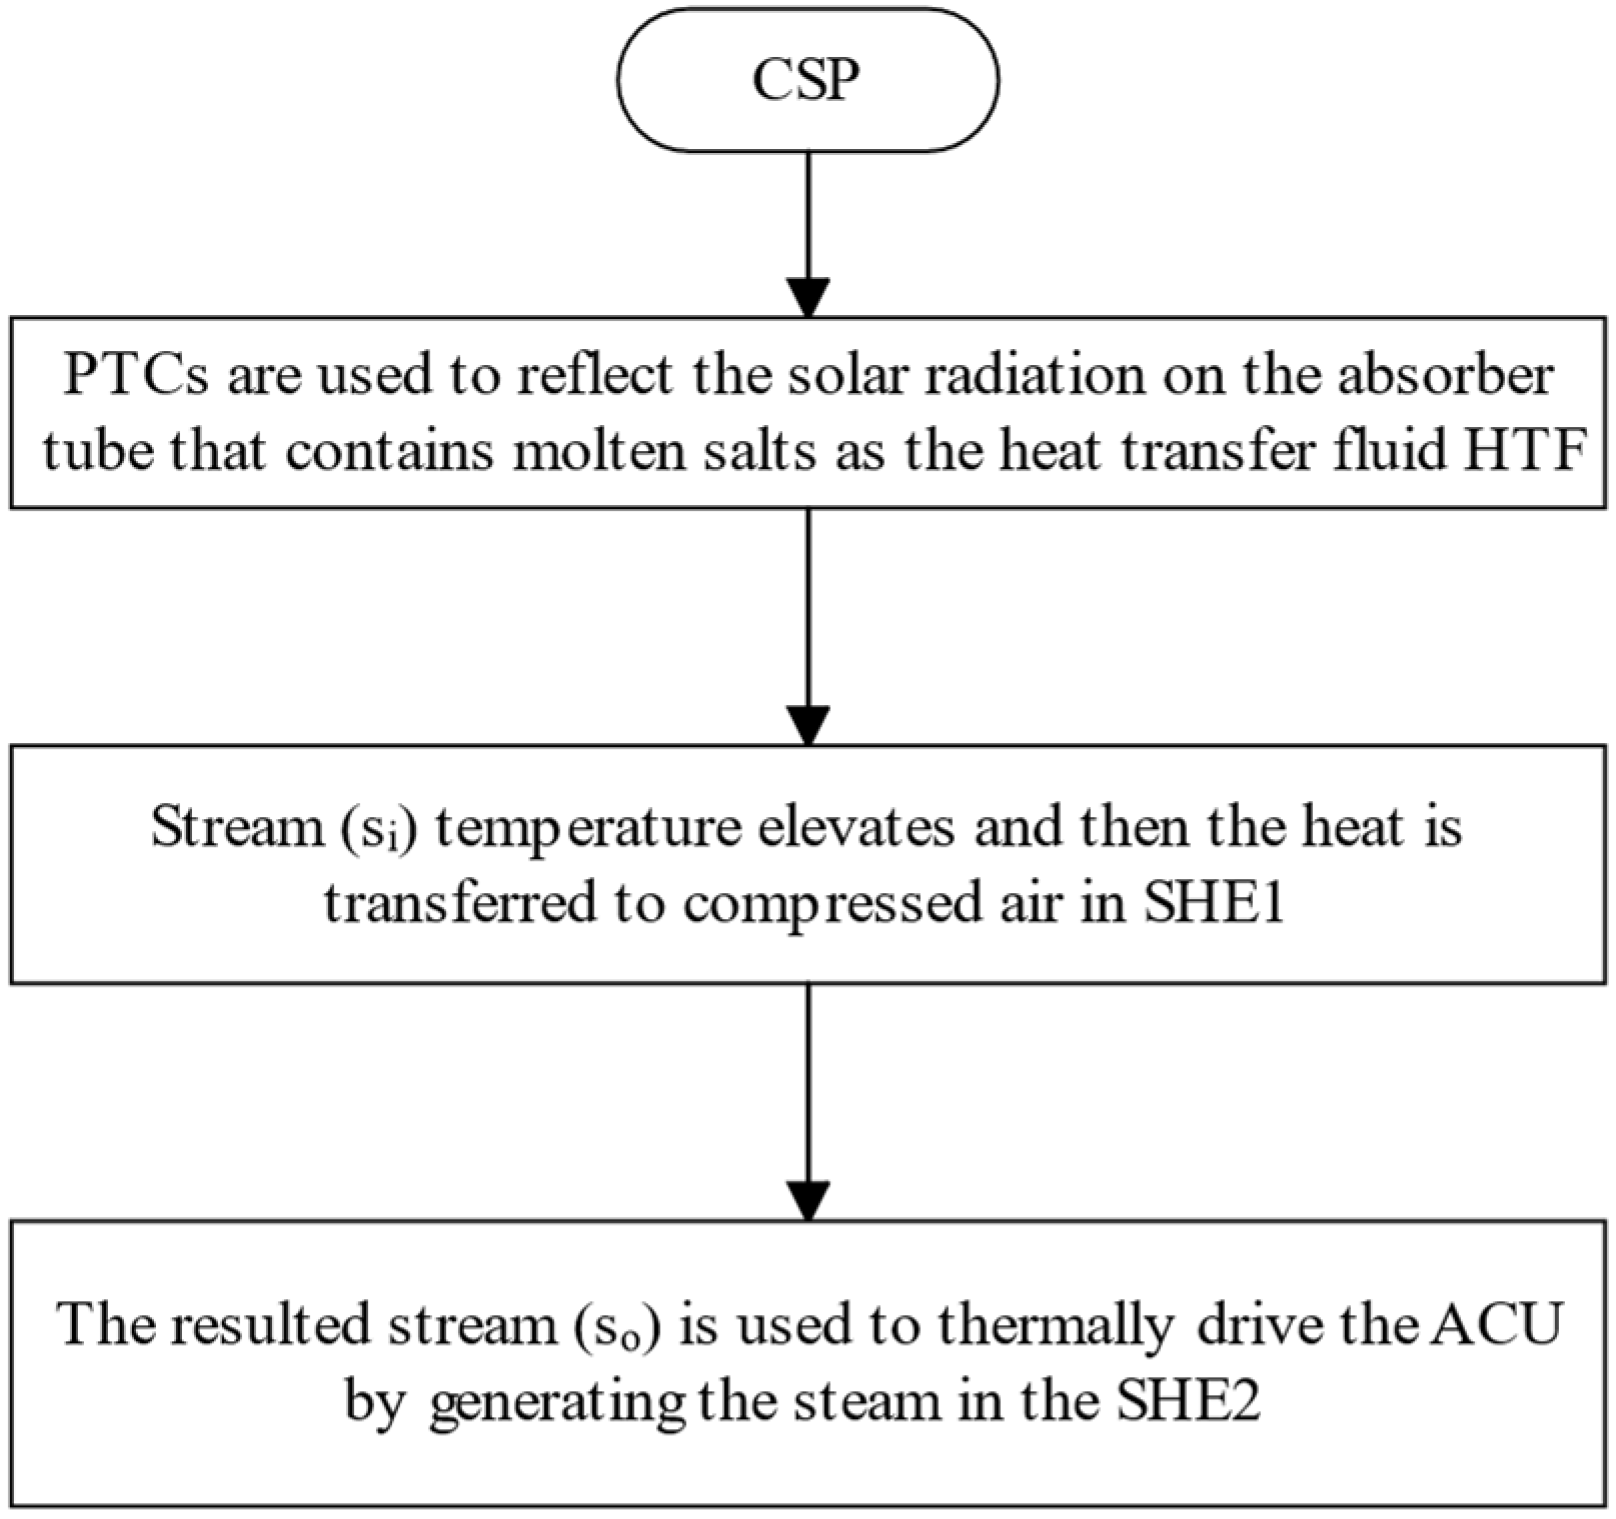
3.3. Modeling of the CSP Unit

Concentrated solar power (CSP) consists of parabolic trough collectors that work in a trace mode, Colr collector modules in parallel, and Cols series, whose parameters substantially affect the active solar collecting area. The amount of HTF that passes through each Colr is fixed; hence, using larger Colr number results in a higher HTF mass flowrate, while increasing the Cols results in increasing the HTF output temperature [39]. Luz 3rd generation parabolic trough collector, LS-3, was selected based on the recommendation by [40] with the specifications reported in [41].
Solar radiation fluctuates throughout the day and varies from one place to another. Some models use the highest potential [42], while using the annual average seems reasonable. Therefore, we obtained the hourly solar radiation record from SoDa for a year and developed a code to identify days with high solar radiation. The code showed that daily average solar hours with high radiation were 7 h, corresponding to 705 W/m2 average irradiances for Al-Qatrana.
Thermal energy collected from the receivers is transported and exchanged through heat exchangers, where the high performance of the HTF favors high thermal conductivity, specific heat capacity, and density. High thermal conductivity supports effective heat transfer from the absorber to the SHE1, and a high specific heat capacity and density can increase heat flux with the minimum mass flow rates since the working temperature before the CC is higher than 300 °C.
To satisfy these requirements, we selected solar salt (60NaNO3-40KNO3) based on the studies of [43]. The HTF mass flow rate range per tube is (0.8–2) kg/s, as seen in [44]. Note that solar salt has a greater heat capacity and higher thermal conductivity than oil-based HTFs, whose properties are considered functions of the operating temperatures and pressures in each stream of the cycle instead of fixed properties [36], to reflect a change in the operating temperature. The methodology used in modeling the CSP field and the heat losses was adopted from [44]. Appendix A provides the equations used in modeling the CSP field and its heat losses.

3.4. Modeling of ACU

The ACU works in a single-effect stage with a mixture of LiBr and H2O as the working fluid and refrigerant, respectively, which is more environmentally friendly than ammonia/H2O. The cycle has a simpler configuration than double- and triple-effect stages, requiring lower maintenance and cost. After delivering part of the thermal heat in SHE1, the remaining heat from the HTF will be used to operate the generator also known as SHE2. The relatively high operating temperature, Tso > 370 °C, has been justified by Talbi and Agnew [37], who used diesel engine waste heat with a running temperature above 370 °C to drive an ACU. In this work, the ACU is controlled by the amount of cooling required by the GT, i.e., the amount of energy transferred from the inlet air until the temperature reaches 5 °C before entering the compressor.
The properties for each component in ACU were fixed; therefore, the refrigerant’s mass flow rate is considered a variable controlled by cooling load using energy conservation equations. Also, depending on the cooling load, the required heat input thermal energy entering the generator changes, leading to different outlet temperatures for the HTF in SHE2. The properties of the H2O refrigerant were obtained by each stream’s indicated temperature and quality. Modeling the ACU was carried out using the methodology reported in [45], where the effect of relative humidity was negligible because the ACU cools the air before entering the compressor by sensible cooling, which means no water will be introduced to the system [7]. The power required by the absorption pump was identified as negligible. Constraints for operation [46] included the following: The system is assumed to operate under steady-state conditions. The refrigerant exits the condenser as a saturated liquid, the evaporator exits as a saturated vapor, the solution departs the generator and absorber as saturated liquids, and the water concentration in the LiBr/H2O that exits the generator is fixed. Appendix A shows the adopted equations for the absorption system simulation.

3.5. Thermo-Environomic Modeling

Due to the current global warming trend and increasing air pollution, it is essential to evaluate the thermal effect of gas turbines on the environment. We include three major pollutants, CO, NOx, and CO2 (CO and NOx as toxic and CO2 as greenhouse gas [47]), in modeling natural gas [48] combustion to maximize fuel efficiency and minimize its environmental effects [12]. To make the thermo-environomic modeling relevant and effective to the gas turbine combustion system, semi-empirical correlations were employed as suggested by [35] and shown in Appendix A.

3.6. Overall Performance Analysis

The above model provides performance parameters on the combined parabolic trough collectors and absorption chilling unit (PACC). These parameters are fuel flow rate and thermal efficiency, the total generated power, and the specific fuel consumption. These parameters were estimated using the methodology reported in [33]. Appendix A provides all equations to calculate these performance parameters.

4. Results and Discussion

4.1. Validation of the Developed Model

The developed code was benchmarked against the available models of the PACC components (GT, HRSG, CSP, and ACU) using experimental and theoretical data in the literature [7,41,45]. However, our current integrated system is new and requires independent validation.
We applied the available literature values [49] to our conditions and conducted the following validation steps. The first step is to simulate the outputs of the case study investigated. Afterward, the results were benchmarked against the data reported in [30], which showed good agreement, with a maximum difference of 9.6% for the GT 75% load case, as shown in Table 2. Afterwards, separate codes were developed and benchmarked against the results reported in the literature for the ACU [7] and for the PTC [41].
This can be considered a good validation. After gaining confidence in the developed subsystem codes, these codes were integrated with the previously validated power plant code to calculate the performance of the proposed system.

4.2. Design Point Calculations

After integrating the three (GTCC, PTC, and ACU) subsystems, we selected a simple design to evaluate against [7] the power augmentation, efficiency enhancement, fuel reduction, and SFC decrease with an EES code. From the exhaust temperature stated in Table 1, the TIT was found to be 1145.8 °C, rp = 11.3, Ta = 36 °C, the average annual direct solar irradiation Gb = 705 W/m2 (as justified in Section 3.3), the HTF flowrate (ms) was 1.505 kg/s, 10 Cols, and 420 Colr.
When the operating parameters are selected, the code can be integrated. Table 3 displays the state points and thermodynamic properties for the system at the necessary design calculations. A comparison between the novel design and the conventional GTCC is detailed in Table 4 for the system’s impact and advantages. When the novel cascaded solar system is integrated, the compressor inlet temperature drops by 5 ℃, and the compressor work cuts back by 10.8%, but unfortunately, the compressor outlet temperature drops as a negative performance. To overcome this negative performance, SHE1 would increase the compressed air temperature by 41.2% to decrease the amount of fuel consumed in the system by 10.5% compared with the conventional power plant. This is accompanied by a significant reduction in pollutant emissions, as follows: CO2 4.21 kg/s, CO 0.0257 kg/s, and NOx 0.2778 kg/s. However, this reduction in fuel consumption results in reducing the gases’ mass flow rate through the gas turbine, hence slightly reducing its generated power by 1.69%.

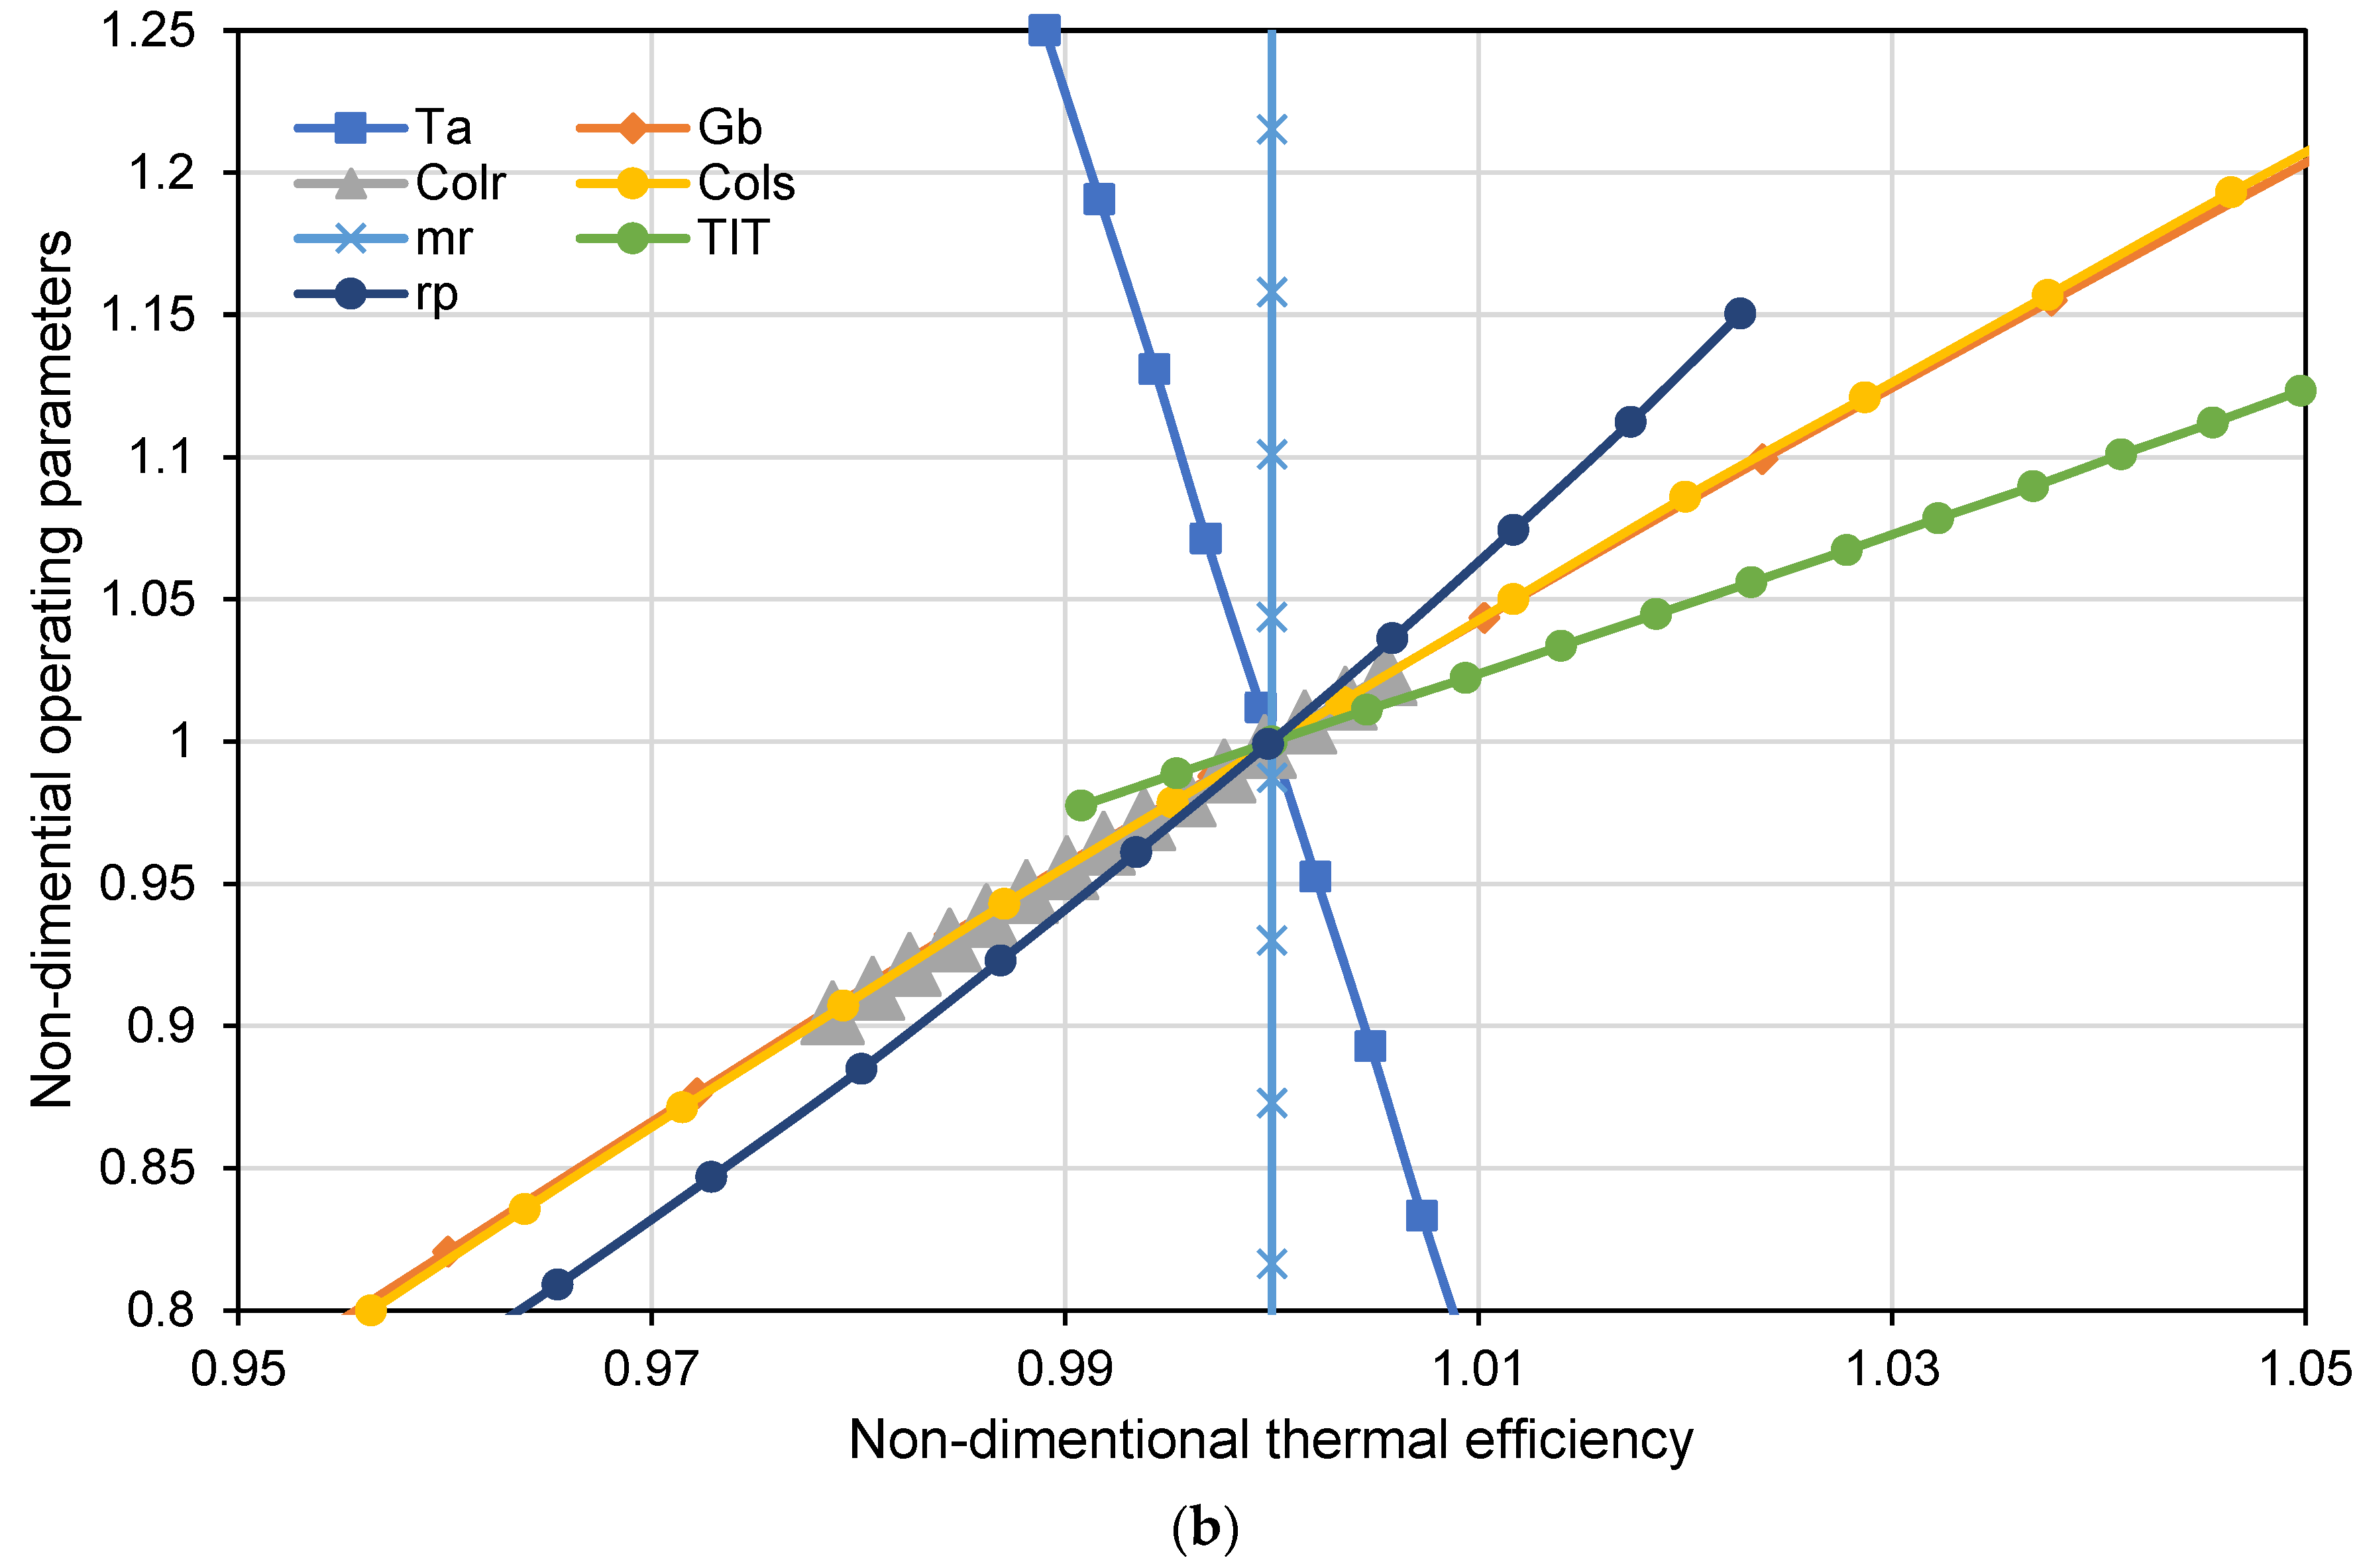
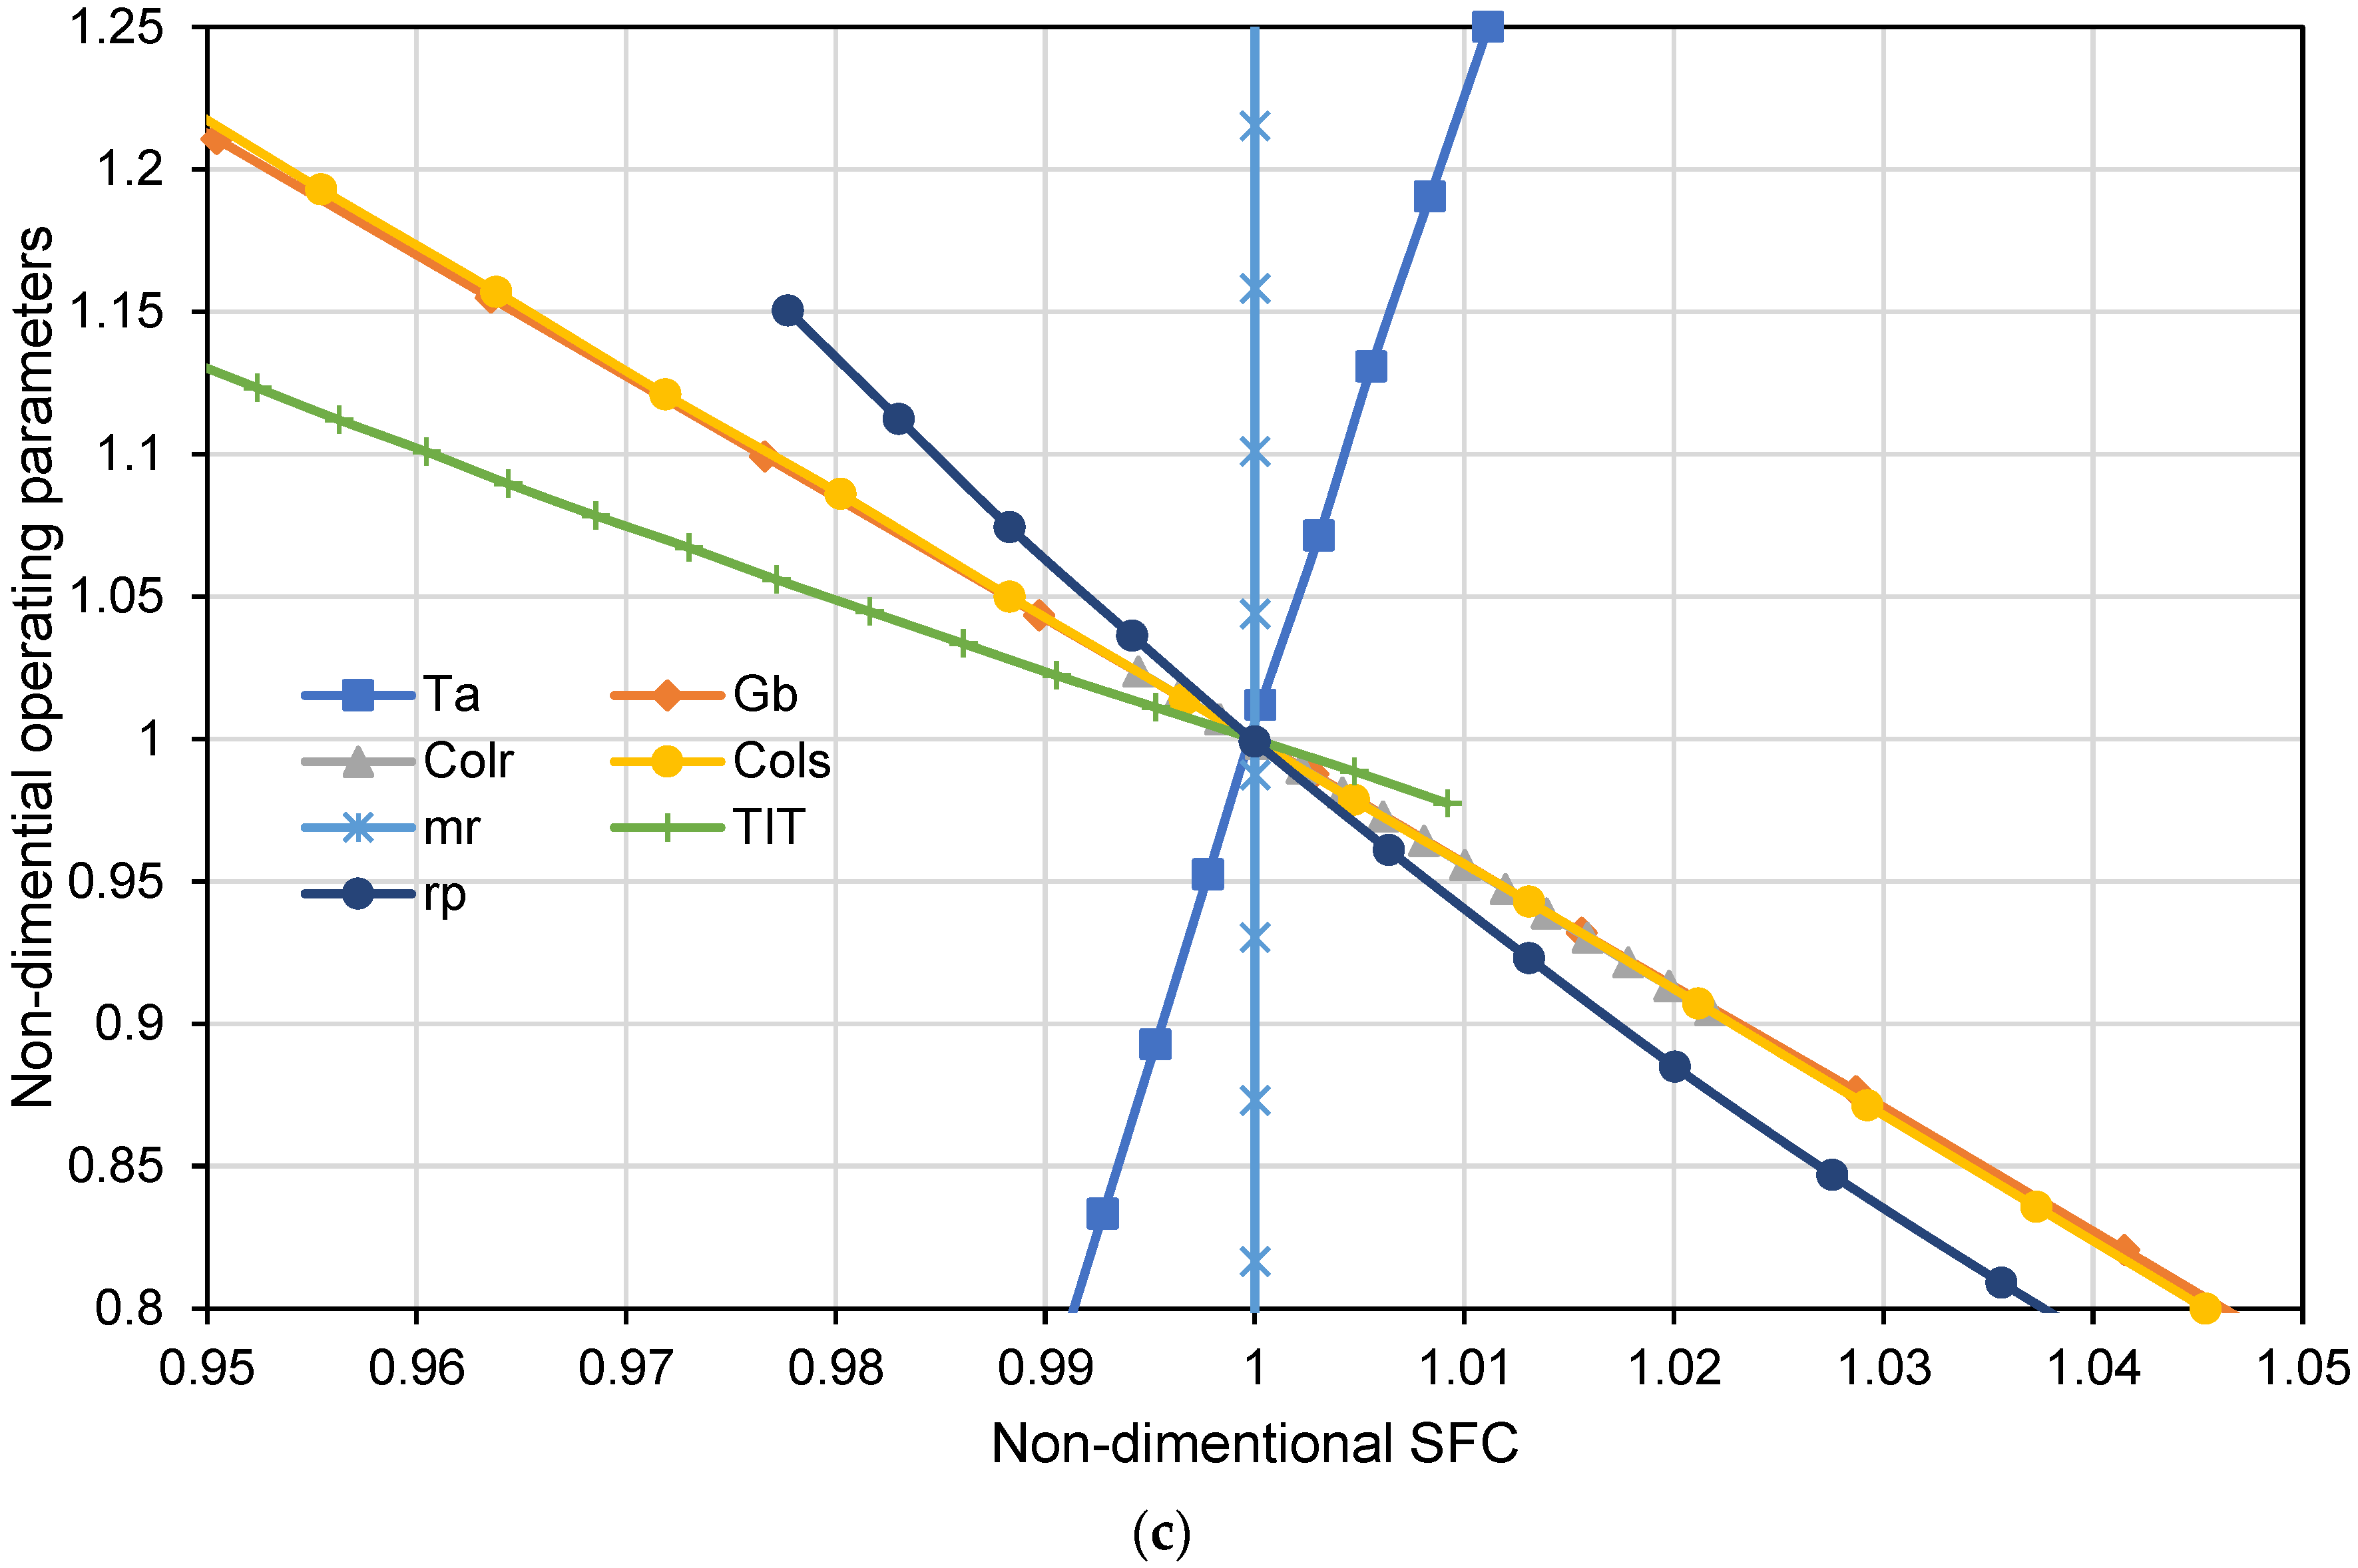
4.3. Variation Impact of the Operating Parameters on the Performance of the System

The impact of the variation in operating parameters on the system’s overall performance using the spider diagrams used in [50] is investigated in this section. Since ambient conditions influence the system, the impact of solar radiation, air inlet temperature, and the impact of operating parameters on the GTCC, namely TIT and rp, were studied. Also, the main parameters to drive the PTC, which are ms in each absorber tube, Colr, and Cols, were studied. Table 5 shows the operating ranges for these variables along with verification references. A wide range of operations will help us better understand the system’s behavior for Al-Qatrana PP for other GTCCs applications. Table 6 summarizes the cooling load and heat input given by the ACU and the PTC, as well as the heat transfer coefficients of the ACU components.
Ambient temperature and incident solar irradiation are two operating parameters that can be controlled by selecting the location of the GTPP and operating hours by evaluating one parameter at the time and keeping the other constant. Figure 8 illustrates the following three different performances, (a) Wnet, (b) ηth, and (c) SFC, all under the following conditions: Ta, Gb, Colr, the Cols, the HTF mass flow rate (mr), TIT, and rp of the GT.
These non-dimensional results were calculated by dividing the values of the varying operating and performance parameters over the corresponding design values while keeping the inlet compressor temperature at 5 °C to provide the lowest energy consumption in the compressors. When the ambient temperature increases, the cooling load would increase, resulting in a decrease in Ts,oo, causing Tsi to decrease and, therefore, lowering the useful solar heat input into the system from SHE1 and sending more fuel to maintain constant GT inlet temperature. A higher amount of fuel would cause a relatively small increase in the turbines’ work, as shown in Figure 8a. By contrast, Figure 8b shows a drop in thermal efficiency with the raise in the ambient air temperature, while Figure 8c illustrates a proportional relation between the SFC and the ambient air temperature where the resulting surge in fuel consumption outweighs the increased power explained earlier, resulting in the noted behaviors. The result is that a 10% increase in ambient air temperature would increase the cooling load by 11.6%, decrease Tsoo by 0.92%, decrease Tsi by 0.6%, and increase fuel consumption by 0.45%, hence increasing power by 0.04%, decreasing η t h by 0.44%, and increasing the SFC by 0.42%.
Figure 8a–c show the variation in solar radiation as a function of the Wnet, ηth, and SFC, which indicate that the power and SFC decrease while the thermal efficiency grows as G b increases. That is because, with a higher amount of solar radiation, the HTF temperature exiting the PTC field is increased due to the higher amount of energy absorbed in the PTC; the thermal energy associated with elevated temperature in the HTF is transferred to the compressor air that will be combusted in the combustion chamber. Since the TIT is fixed, the required fuel to be injected will be lower (because Tsi is already high). The power output will decrease due to the lower amount of hot gases entering the turbines (since fuel is reduced). Overall, thermal efficiency will increase, and SFC will reduce because the percentage decrease in fuel consumption is higher than the decrease in power output.
Furthermore, a sensitivity analysis was conducted to show that a 10% increase in solar radiation increases Tsi by 3.26%. Specific results included the findings that the compressed air temperature (T2a) was increased by 3.4%, hence decreasing the fuel consumption by 2.5%, causing a reduction in the turbine power by 0.12% and, therefore, power reduction by 0.23%, thermal efficiency improvement by 2.39%, and SFC reduction by 0.023%. The hot gases coming from the GT are reduced due to a decrease in fuel consumption, influencing the performance of the HRU, especially the STs, and the ST cycle’s net power, which was altered by a 0.19% reduction when a 10% increase in Gb occurs.
Figure 8a–c also illustrate the influence of mr variation on the performance parameters of the PP (Wnet, η, SFC) and show that increasing the value of mr will not affect performance. When applying a higher mr, while the solar flux on the PTCs is fixed, Tsi is expected to decrease due to energy conservation. Solar heat input remains constant over the variation in mr. Consequently, the mass flow rate of the fuel, the power output, thermal efficiency, and SFC remain constant, while a 10% increase in mr lowers the Tsi by 0.67% and keeps the solar heat input constant at 161.4 MW.
Afterward, the effects of varying Colr on the overall performance parameters (Wnet, η, and SFC) were estimated. Increasing the number of collectors increased mr while keeping its temperature constant, which led to a higher amount of useful solar heat input into the system, causing a reduction in fuel intake. The power augmented stayed constant since, as stated earlier, the ambient temperature was reduced to 5 °C. However, the reduction in fuel consumption is more significant with η and SFC, as η increased and the SFC decreased. The total net solar heat input would increase by 9.9%, with a 10% increase in Colr. Therefore, T2a would increase by 3.4%, leading to a 2.6% reduction in fuel consumption, resulting in a 0.22% reduction in power, a 2.3% relative increase in efficiency, and a 2.3% decrease in SFC.
Moreover, the effects of varying Cols on the performance parameters (Wnet, η, SFC) were estimated; it was found that increasing Cols increased the temperature of the HTF coming out from the PTC field. Hence, more solar power is introduced, causing the compressed air temperature to increase and, therefore, the mass flow rate for the fuel to decrease. When the mass flow rate of the fuel is reduced, thermal efficiency will increase, while the power and SFC will decrease. A 10% increase in Cols would cause the following: a 3.36% increase in T2a, 2.5% increase in mf, 0.2% decrease in power, 2.3% increase in efficiency, and 2.3% decrease in SFC.
To study the system’s behavior under different operating loads, the variation for operating parameters TIT and rp were studied since the GT loads usually change depending on the power demand. Accordingly, the TIT and rp change. Figure 8a–c show that increasing TIT would increase the power output and thermal efficiency and decrease the SFC because the higher temperature allowed in the turbine would generate more expansion in the combustion product gases and release more energy that is transformed into mechanical power, increasing the power output and lowering the SFC. Note that although the mass flow rate of the fuel increased, the thermal efficiency still increased because the power output increase due to the higher TIT outweighs the increase in the fuel’s mass flow rate. Sensitivity analysis showed that a 10% increase in TIT results in a 20% increase in fuel consumption, a 25% increase in power generation, a 4.1% rise in efficiency, and a 3.9% reduction in SFC. On the other hand, increasing rp while holding the rest of the operating parameters fixed would increase both the power generation rate and thermal efficiency and decrease the SFC. A 10% increase in rp would increase both the power and efficiency by 4.4% and 1.5% and decrease SFC by 1.5%.
Figure 9a,b present the influence of different operating parameters on the CO and NOx production rate measured in gram/second per kg of fuel. Measuring the species production rate (emission rate) per kg of fuel can help us mitigate the effects of the fuel consumed on the emission rate and, therefore, is important for environmental and pollution analysis. As Ta increases, the cooling load increases in ACU, dragging more heat from HTF and decreasing the inlet temperature of air (2a) before it enters the CC, slightly reducing the adiabatic flame temperature. As a result, the production rate of CO per kg of fuel increases in a small amount. The production rate of NOx per kg of fuel decreases, as seen in A57, since the adiabatic flame temperature decreases.
A 10% increase in Ta increases the CO emission rate per kg of fuel by 0.65%, decreasing the NOx emission rate per kg of fuel by 2.76%. Similarly, an increase in Gb, Colr, or Cols, will increase the thermal energy of the high-temperature fluid. As a result, T2a increases. This rise in the air temperature increases the adiabatic flame temperature inside the combustion chamber, helping to decrease CO emissions per kg of fuel and increasing the NOx emission per kg of fuel. A 10% increase in Gb decreases the CO emission rate per kg of fuel by 6.41% but increases the NOx emission rate per kg of fuel by 7.5%. Similarly, a 10% increase in Cols would decrease the CO emission rate per kg of fuel by 7.64% and increase the NOx emission rate per kg of fuel by 8.09%. The same 10% increase in Colr decreases the CO emission rate per kg of fuel by 9.32% and increases the NOx emission rate per kg of fuel by 8.89%.
The emission of CO and NOx per kg of fuel remains independent of mr because it would cause no change to the total thermal energy available for heat exchange at SHE1 and makes no impact on the thermodynamic condition of the combustion chamber to alter the emission rates. Among all the operating parameters, TIT has the most significant influence on CO emission per kg of fuel. A 10% increase in TIT would increase CO emission rate per kg of fuel by 107.17%. An increase in TIT requires more fuel to be injected in the CC, thus increasing the fuel–air equivalence ratio. As a result, the adiabatic flame temperature drops, and CO emission per kg of fuel also increases dramatically.
The NOx emission per kg of fuel is independent of TIT and depends only on stoichiometric (adiabatic) flame temperature under little influence of the fuel–air equivalence ratio. An increase in rp increases air pressure entering the combustion chamber at point 2a, which reduces the CO emission per kg of fuel. By contrast, the same scenario increases the NOx emission per kg of fuel based on A57. A 10% increase in rp, would decrease the CO emission rate per kg of fuel by 2.83% and increase the NOx emission rate per kg of fuel by 15.78%.
Figure 10 shows the nondimensionalized operating parameters’ effect on the nondimensionalized emission rate of (a) CO, (b) NOx, and (c) CO2. All seven operational parameters (Ta, Gb, Cols, Colr, mr, TIT, and rp) create a similar impact on CO and NOx emission rate as they did on the CO emission rate per kg of fuel and NOx emission rate per kg of fuel, because trend lines of respective operating parameters are identical in Figure 9a,b and Figure 10a,b, whereas TIT differently influences NOx emission rate per kg of fuel. Comparison between Figure 9b and Figure 10b shows that the NOx emission rate per kg of fuel remains constant with increasing TIT.
A higher TIT requires more fuel to be injected into the CC, therefore increasing the NOx flow rate. The rate of CO2 emission is directly proportional to the amount of fuel injected into the combustion chamber. Variation in the emission rate of CO2 (kg/s) based on the seven different operating parameters is shown in Figure 10c. When Ta increases, the ACU’s thermal load increases, pulling more heat from the HTF and decreasing T2a at the combustion chamber inlet because less heat is available for heat exchange at SHE1. To keep the TIT constant, fuel input into the combustion chamber increases the CO2 emission rate. Thus, a 10% increase in Ta increases the CO2 emission rate by 0.20%.
Meanwhile, with an increase in Gb or Colr or Cols, the thermal energy available for heat exchange at SHE1 increases, which results in an increased T2a of air into the combustion chamber. This requires less fuel to keep the TIT fixed, and the CO2 emission rate decreases. A 10% increase in Gb causes a drop in the CO2 emission rate of 1.69%. Similarly, a 10% increase in Colr reduces the CO2 emission rate by 2.21%, whereas 10% increase in Cols decreases the CO2 emission rate by 1.91%.
The emission rate of CO2 remains independent of mr because it would make no change to the total thermal energy available for heat exchanger SHE1, and fuel injected into the CC remains unchanged. Increasing the air temperature at the outlet of the CC requires more fuel, thus increasing TIT and resulting in a significant increase in the CO2 emission rate. A 10% increase in TIT increases the CO2 emission rate by 20.53%, while the same 10% increase in rp increases the CO2 emission rate by 2.62%.

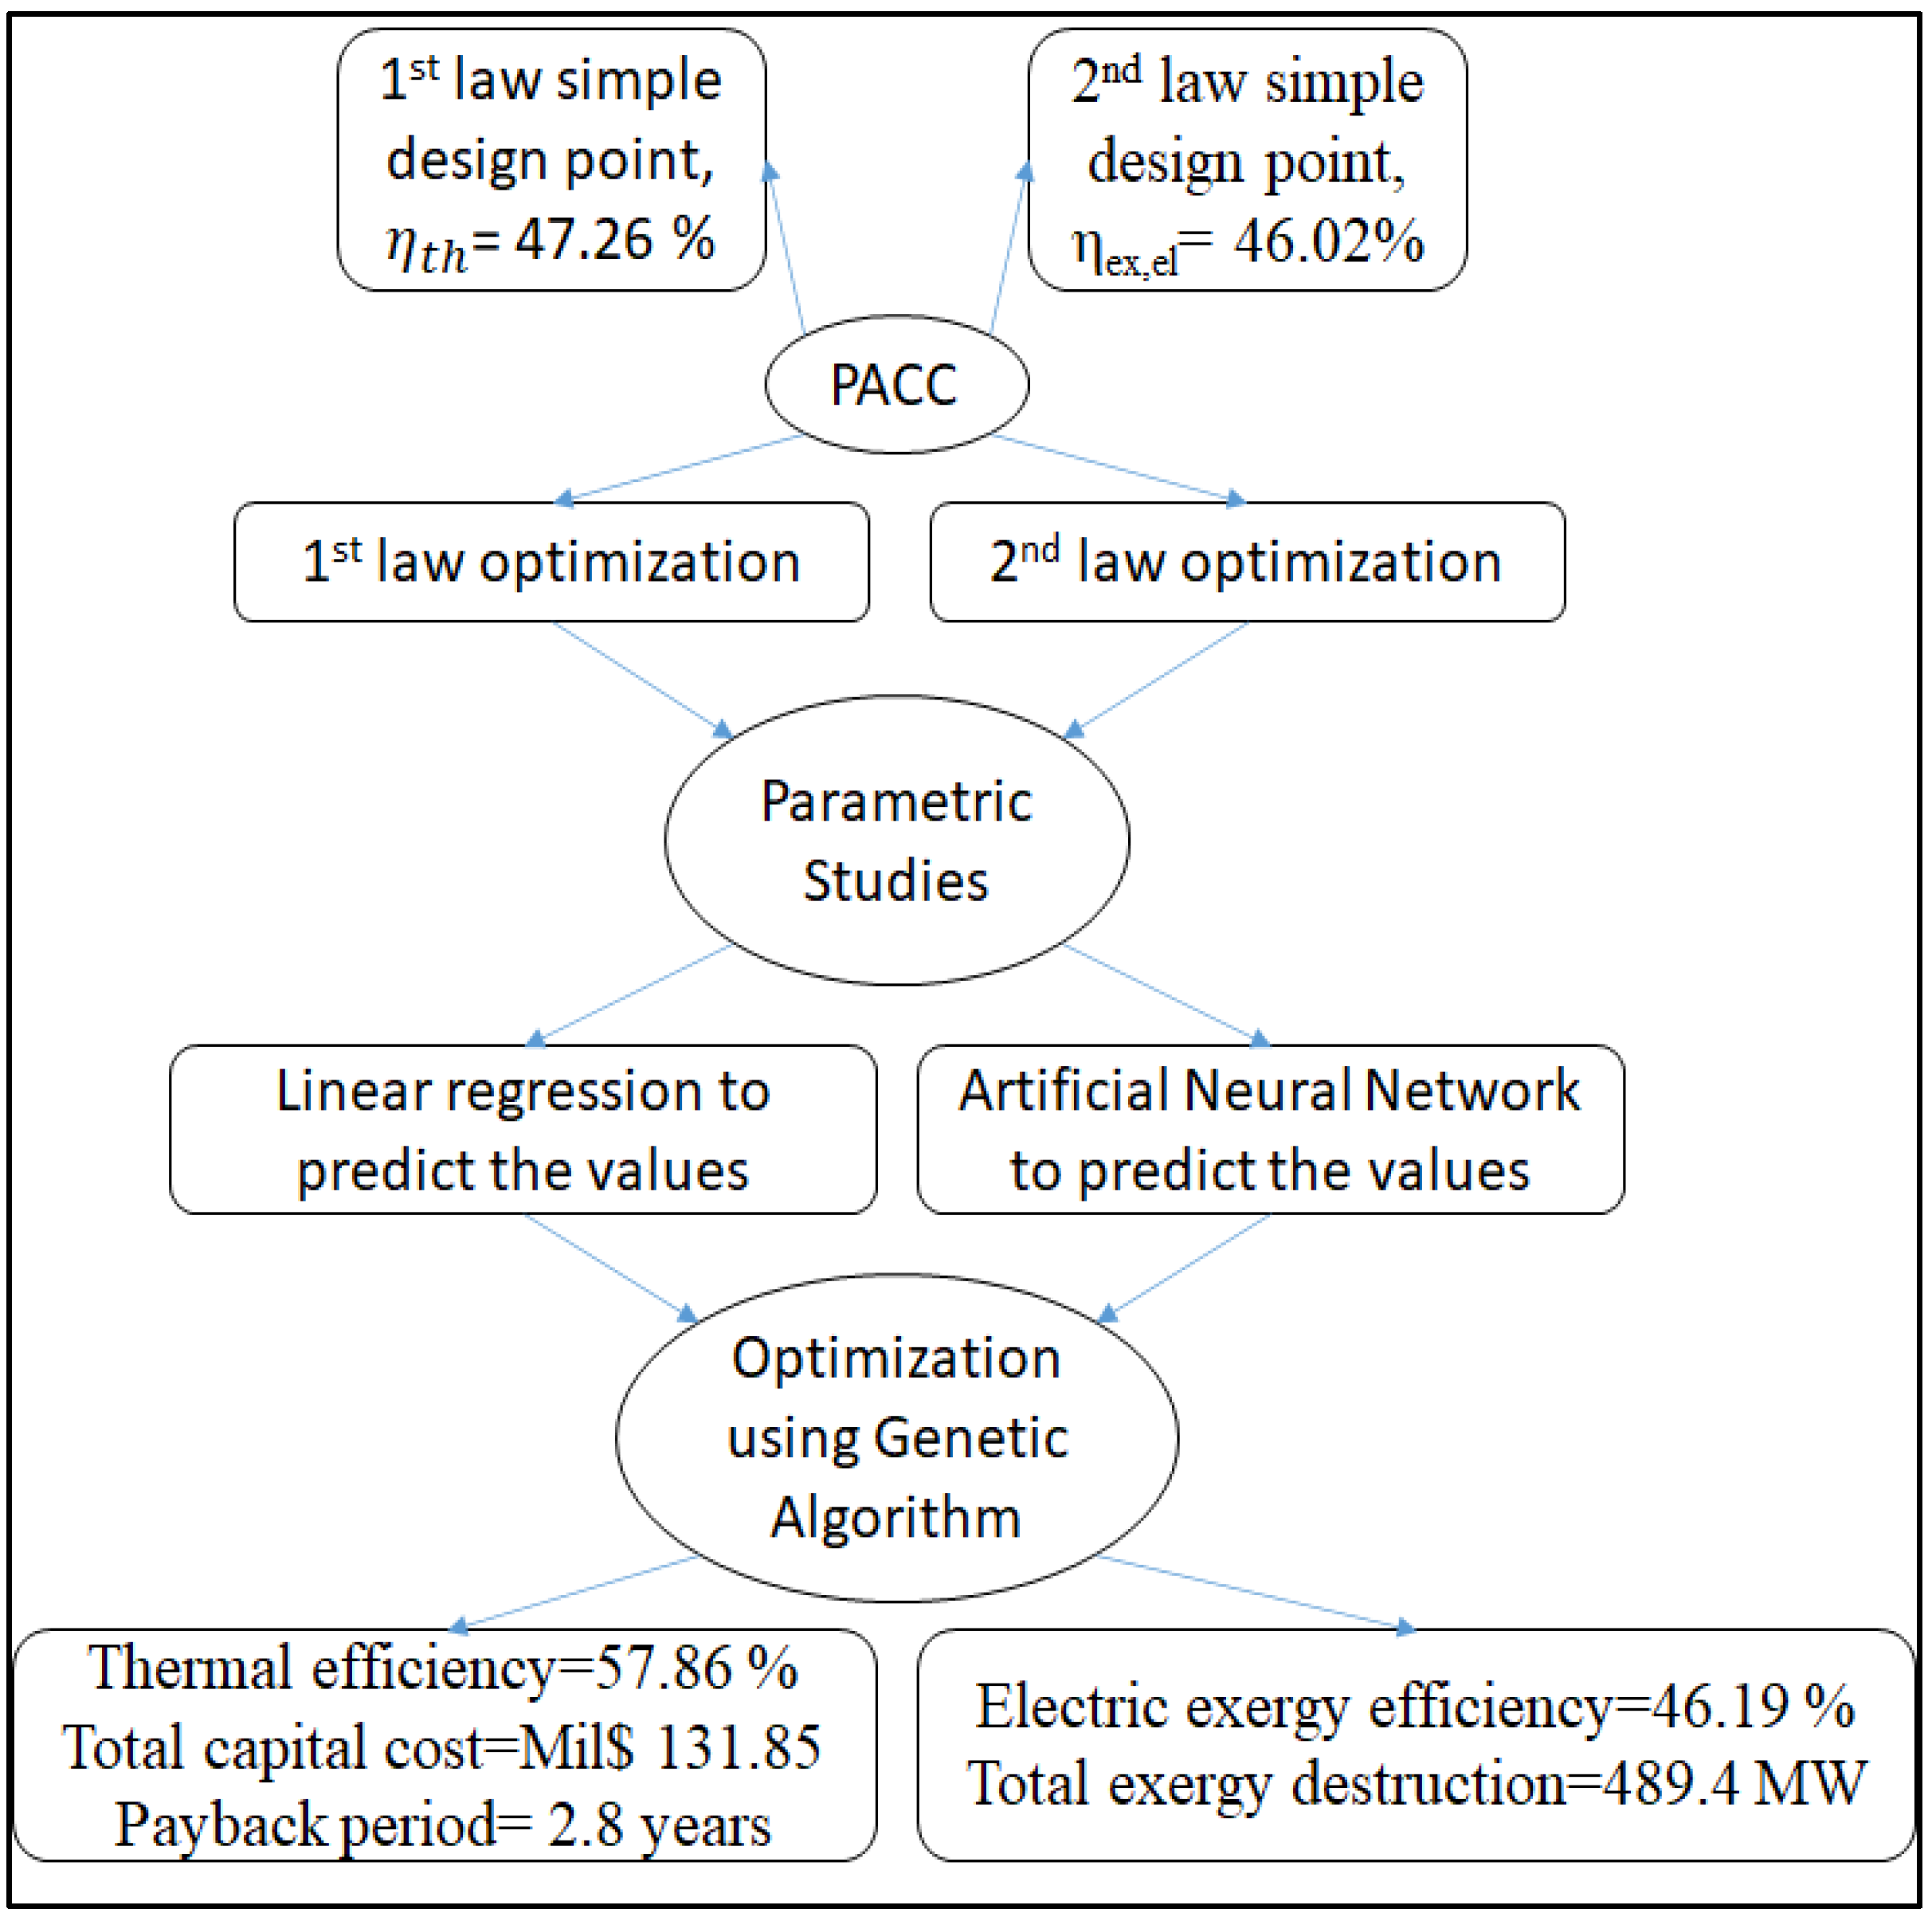
4.4. The First and Second Laws of Thermodynamics Optimization

Optimization studies have been conducted on the novel integration to identify the optimal performance based on the first and second laws of thermodynamics [55]. Figure 11 shows a summary of the optimization’s main results.
Optimization of the first law consisted of maximizing the thermal efficiency of the integrated cycle while minimizing the capital cost of the PTC/ACU [33]. Thermal efficiency was selected as the main parameter in the optimization to evaluate the power plant’s performance. Because it accounts for obligatory fuel consumption while considering power output instantaneously, this optimizes the plant’s performance with regard to its efficiency, ensuring optimal, efficient fuel consumption, whereas the capital cost was chosen to ensure the economic viability of the proposed system, which determines if the proposed installment is realistic.
Based on the parametric study, two highly accurate polynomial equations were formulated using linear regression to implement them in the optimization process. These formulas are employed to estimate the values of the thermal efficiency and the capital cost, where the operating parameters are the independent variables. These formulas were employed in a Genetic Algorithm-based multi-objective optimization method using MATLAB to calculate the best performance in terms of the optimum value of first law efficiency and reasonable total cost. The results indicated that the optimum thermal efficiency would be 57.9%, corresponding to a capital cost value of 131.85 million USD. Additionally, the work was extended to conduct the payback period of the PTC/ACU. The economic analysis was based on savings from fuel revenues, increased power generated, social costs, and capital costs. Based on the optimum values of the capital cost and thermal efficiency, the payback period was found to be 2.8 years, which implies that the novel cycle is feasible.
Optimizing the second law consisted of minimizing overall exergy destruction while maximizing electrical exergy efficiency [55]. ANN was used to build the multi-objective optimization in MATLAB using the data obtained from a parametric study to develop the ANN. The input data to the ANN were a combination of different ranges of Cols, Colr, mr, TIT, rp of the GT, and the temperature difference in the proposed ACU condenser. Same as first law optimization, the Genetic Algorithm optimization approach was also used to investigate the optimum values from the second law’s point of view. The results show that the optimal system can achieve 46.2% electric exergy efficiency with 489 MW overall exergy destruction.

4.5. Evaluation of the Proposed System’s Improvements

Finally, Table 7 briefly compares different modifications proposed in the literature to enhance the performance of GT and GTCC PP by cooling the air entering the compressor, integrating solar energy, and adopting secondary systems.

5. Conclusions

This study investigated the integration of a combined cogeneration cycle system with PTC cascaded with an inlet air cooling system to enhance the performance of a combined cycle power plant under normal and rough ambient conditions. We developed our system model to utilize solar power to drive a cascaded solar heat exchanger. The system model has been shown to reduce the compressor inlet’s ambient temperature to 5 °C. Although this reduction results in a drop in the combustion chamber inlet temperature, which causes a rise in fuel consumption, the novel integration can counter this change via solar hearing. A simulation-constructed approach was applied to validate predictions from these models with actual plant and literature data. It evaluated the cooling load impact of the ACU and the solar heat input on the system’s total power generation, thermal efficiency, and SFC. The specific results from this study can be summarized as follows:
(1)
The method proposed in this study assesses the overall performance of the gas turbine system, which can be applied to evaluate other existing and future GT powerplants.
(2)
A cascaded solar power system was proposed to improve the system’s overall performance, increase the power generation at the design point by 6.87%, and improve thermal efficiency by 19.5% with a 10.53% reduction in fuel consumption.
(3)
The ACU successfully lowered the ambient temperature to 5 °C using the available solar power that drives the generator (solar heat exchanger number 2), resulting in the compressors’ lowest consumed power.
(4)
Utilizing solar power in solar heat exchanger number 1 saved the maximum amount of NG fuel input by solving two problems: the conventionally high amounts of fuel required for generating power in the GTs and the rise in the temperature difference caused by the inlet air cooling.
(5)
The effect of each of the seven main operating parameters on the overall performance of the system was quantified and explained.
Future studies should address the remaining aspects of the system’s feasibility, such as real-time dynamic responses with regard to the variables of the grid-like voltage, active power, and reactive power dissipation. Additionally, since the integration of this system was investigated for larger-scale applications, power plants in this case, it would be interesting to test the feasibility of such integrations on much smaller scale systems that involve air compression and combustion.

Author Contributions

A.M.A.: Conceptualization; Data curation; Formal analysis; Investigation; Methodology; Resources; Software; Validation; Roles/Writing—Original draft; Writing—Review and editing. A.D.A.: Conceptualization; Data curation; Formal analysis; Investigation; Methodology; Resources; Software; Validation; Roles/Writing—Original draft; Writing—Review and editing. B.B.S.: Formal analysis; Software; Roles/Writing—original draft. Y.M.M.: Writing—Original Draft, Writing—Review and Editing. L.A.-G.: Formal analysis, Resources; Software; Validation; Writing—Original Draft, Writing—Review and Editing. N.K.A.: Conceptualization; Funding acquisition; Investigation; Project administration; Resources; Supervision; Roles/Writing—Original draft; Writing—Review and editing. K.S.: Conceptualization; Data curation; Formal analysis; Funding acquisition; Project administration; Resources; Supervision; Roles/Writing—Original draft; Writing—Review and editing. All authors have read and agreed to the published version of the manuscript.

Funding

This study was sponsored by the University of Kentucky IR4TD research fund.

Institutional Review Board Statement

Not applicable.

Informed Consent Statement

Not applicable.

Data Availability Statement

The data presented in this study are available on request from the corresponding author.

Acknowledgments

University of Kentucky’s IR4TD members for their valuable comments and discussion.

Conflicts of Interest

The authors declare no conflict of interest.

Abbreviations

ACUAbsorption chilling unit
CCCombustion chamber
CCGTCombined-cycle gas turbine
ColrNumber of collectors in row
ColsNumber of collectors in series
CSPConcentrated solar power
CSSCascade solar system
CWHRCascaded waste heat recovery
EESEngineering equation solver
GbSolar irradiation
GTsGas turbines
GTCCGas turbine-combined cycle
GTPPsGas turbine power plants
HP High-pressure heat recovery steam generator
HPECHigh-pressure economizer
HPSHHigh-pressure superheater
HPSTHigh-pressure steam turbine
HRSGHeat recovery steam generation
HRUHeat recovery unit
HTFHeat transfer fluid
IACInlet air cooling
ISCCsIntegrated solar combined cycle power plants
LFCsLinear Fresnel collectors
LHVLower heating value
LP Low-pressure heat recovery steam generator
LPEVLow-pressure evaporator
LPSTLow-pressure steam turbine
MCUMechanical chiller unit
mrHTF mass flow rate
NGNatural gas
PaAmbient pressure
PACCIntegrated GTCC combined with PTC/ACU
PPsPower plants
PTCsParabolic trough collectors
rpPressure ratio
SFCSpecific fuel consumption
STSteam turbine
T2sCompressed air temperature
TaAmbient temperature
TITTurbine inlet temperature
TpzAdiabatic flame temperature (K)
Ts,ooInlet temperature of HTF into PTC
TsiOutlet temperature of HTF from PTC
TsoOperating temperature
TstStoichiometric temperature (K)
WnetOverall power
Greek letters
ηthThermal efficiency
Subscripts
1–45State points
COCarbon monoxide
CO2Carbon dioxide
H2OWater
LiBrLithium bromide
NOxNitrogen oxides

Appendix A

Table A1. Modeling of the power plant components.
ModuleEquationCrucial PointsEquation Number
Gas turbine engine
Air compressors [38] r p = P 2 P 1 The pressure at the compressor’s outlet is estimated using r p (A1)
η c = 1 ( 0.09 + r p 1 300 ) Compressor’s efficiency (polytropic) (A2)
( n a 1 n a ) = γ a 1 γ a η c (A3)
T 2 = T 1 ( r p ) ( n 1 ) / n   η p From (A1), (A2), and (A3), one can find air compressors temperature(A4)
W ˙ c = m ˙ 1 h 2 h 1 Power required for the compressors. At each defined state (i), the enthalpy was estimated using the libraries in EES(A5)
Combustion chamber [38,63,64,65] m ˙ 2 a h 2 a + m ˙ f L H V = m ˙ 3 h 3 + ( 1 η C C ) m ˙ f L H V Conservation of energy in the CC(A6)
m ˙ 3 = m ˙ 1 + f   m ˙ 1 Hot gases’ mass flow rate (A7)
f = T 1 T 3 C C G , 3 · d T T 1 T 2 a C a · d T   ( L H V T 1 T 3 C C G , 3 · d T ) η C C Fuel-to-air ratio is calculated based on the energy balance given in (A6)(A8)
C C G = C a + f 1 + f ( 1.0887572 × 10 3 1.4158834 × 10 1 T + 1.9160159 × 10 3 T 2 1.2400934 × 10 6 T 3 + 3.0669459 × 10 10 T 4 2.6117109 × 10 14 T 5 ) Flue gas specific heat used in (A8)(A9)
λ C x 1 H y 1 + ( x O 2 O 2 + x N 2 N 2 + x H 2 O H 2 O + x C O 2 C O 2 + x A r A r ) y C O 2 C O 2 + y N 2 N 2 + y O 2 O 2 + y H 2 O H 2 O + y N O N O + y C O C O + y A r A r General combustion reaction, where
y C O 2 = ( λ x 1 + x C O 2 y C O ) ,
y N 2 = x N 2 y N O ,
y H 2 O = x H 2 O + λ y 1 2 ,
y O 2 = x O 2 λ x 1 λ y 1 4 y C O 2 y N O 2 ,
y A r = x A r ,
λ = η f u e l η a i r
(A10)
P 3 = P 2 a 1 P c o m b u s t o r P 2 a Estimation of the drop in the pressure across the CC (A11)
Gas turbines [38] r G T = P 3 P 4 Pressure ratio of the turbines (A12)
η , G T = 0.9 + r G T 1 250 Polytropic efficiency of the gas turbine(A13)
( n g 1 n g ) = η G T ( γ g 1 ) γ g (A14)
T 4 = T 3 ( P 4 P 3 ) η G T ( n g 1 ) / n g Turbine exhaust temperature(A15)
W ˙ G T = m ˙ 3 T 3 T 4 C C G , i · d T Generated power by hot gas expansion (A16)
GT performance W ˙ n e t ( G T ) = W ˙ G T W ˙ c Net output power of GT(A17)
Steam turbine cycle
Heat recovery steam generator (HRSG) [7] ε = m ˙ c o l d C p c o l d ( T h o t T c o l d ) ( m ˙ C p ) m i n T m a x T m i n Effectiveness heat exchanger including SHE1 and 2, GTs, HRSG, and ACU(A18)
ε = ( T h o t T c o l d ) T m a x T m i n Effectiveness when ( m ˙ C p ) m i n = m ˙ c o l d C p c o l d (A19)
Q ˙ l o s t = m ˙ g T , c o l d T , h o t C C G · d T Waste energy by exhaust gases(A20)
Q ˙ g a i n e d = m ˙ c o l d ( h h o t h c o l d ) Energy earned by water(A21)
Pumps W ˙ a c , p = m ˙ v P e x i t P i n l e t η p Work consumed by the pump(A22)
Mixer e x i t m ˙ i h i = i n l e t m ˙ i h i Conservation of energy to estimate the enthalpy and temperature at the outlet state (A23)
Steam turbines W ˙ s , S T = η S T m ˙ S T ( h i n h o u t ) Actual steam turbine output power(A24)
Overall performance W ˙ n e t ( S T ) = W ˙ a c , H P S T + W ˙ a c , L P S T W ˙ a c , p steam turbine cycle net-work output(A25)
Solar field system
Absorber [44] Q ˙ u , t o t a l = m ˙ H T F ( h s i h s o o ) The parabolic trough collector’s useful power rate(A26)
Q ˙ u = A a p F R S A r A a p U L T s o o T a The aperture area is A a p = w D c , o L (A27)
N c o l = Q ˙ u , t o t a l Q ˙ u Number of collectors is used to calculate Q ˙ u , t o t a l , where N c o l = C o l r C o l s ,
Also, Colr is collectors in rows and Cols is collectors in series
(A28)
S = G b η r Solar radiation utilized by the PTC tube receiver(A29)
η r = ρ c γ τ α k γ Receiver efficiency, the values for the constants are given in Table 2 (A30)
F R = m ˙ H T F C p H T F A r U L   1 exp A R U L F 1 m ˙ H T F C p H T F Heat loss coefficient (A31)
F 1 = U o U L Efficiency coefficient of the collector (A32)
U L = A r h c , c a + h r , c a A C + 1 h r , c r 1 Heat loss between the ambient air and the solar receiver, where receiver surface area A r = π D r , o L , and collector surface area
A c = π D c , o L
(A33)
h r , c r = σ T c + T r , a v T c 2 + T r , a v 2 1 ϵ r + A r A C 1 ϵ C v 1 Radiative heat transfer coefficient between the tube cover and the receiver where Tc is the receiver temperature, Tr,av receiver average temperature and σ is Stefan–Boltzmann constant, whereas   ϵ r and ϵ C v are given in Table 2.(A34)
h r , c a = ϵ c v σ T c + T a T C 2 + T a 2 Radiative heat transfer coefficient between the ambient air and the tube cover(A35)
h c , c a = N u s a   K a D c , o Convection heat transfer coefficient between the ambient air and the tube cover, Ka is the thermal conductivity of air(A36)
N u s a = 0.3 R e a 0.6 Nusselt number for air(A37)
R e a = V a D r , o υ a Reynolds number for air assuming the air velocity (Va) is 5 m/s(A38)
U O = 1 U L + D r , o h c , r , i n D r , i + D r , o 2 K H T F ln D r , o D r , i 1 Total heat transfer coefficient between the HTF and surroundings, where KHTF is the HTF conductivity(A39)
h c , r , i n = N u s H T F k H T F D r , i Heat transfer coefficient between the receiver and the tube cover(A40)
N u s H T F = 0.023 R e H T F 0.8 P r H T F 0.4 Nusselt number for the HTF(A41)
R e H T F = V H T F D r , i υ H T F Reynolds number for the HTF(A42)
V H T F = m H T F ρ H T F A r , c r o s s Inner velocity for the HTF, where cross area in each tube A r , c r o s s = 0.25 π D r , i 2 (A43)
T c = h r , c r T r , a + A c A r h c , c a + h   r , c a T 0 h r , c r + A c A r h c , c a + h   r , c a Temperature of the receiver cover(A44)
Q ˙ S H E 1 = m ˙ H T F ( h s i h s o ) Heat input in the SHE1(A45)
h 2 a = Q ˙ S H E 1 m ˙ 1 + h 2 (A46)
Inlet air cooling system (Absorption chiller)
Evaporator Q ˙ C L = m ˙ 1   h a h 1 Required cooling energy to decrease the temperature of the inlet air by 5 °C(A47)
Q ˙ C L = Q ˙ E The heat transferred to the refrigerant (A48)
Q ˙ E = m ˙ 36   h 39 h 38 The energy balance in the evaporator is employed to find the m ˙ 36 which is the refrigerant mass flow rate (A49)
Generator (SHE2) Q ˙ G e n , S H E 2 = m ˙ 42 h 42 h 43 + m ˙ 36 h 36 h 42 Required heat to run the generator (A50)
Q ˙ G e n , S H E 2 = m H T F ( h s o h s o o ) The state of the HTF at the SHE2 outlet is found using the heat gained in the generator (A51)
m ˙ 42 = x 42 x 36 x 42 x 43 × m ˙ 36 LiBr/H2O mass flow rate with xi being the concentration at state (i)(A52)
Absorber Q ˙ A b s = m ˙ 39 h 39 + m ˙ 40 h 40 m ˙ 45 h 45 Heat generated (A53)
Condenser Q ˙ C o n d = m ˙ 36 ( h 36 h 37 ) Heat produced (A54)
Solution HE Q ˙ S o l , H E = m ˙ 41 ( h 42 h 41 ) Heat transfer rate (A55)
Absorption pump W ˙ A b s , p = m ˙ 45 ( h 44 h 45 ) Power consumed by the absorption pump(A56)
Thermo-environomic modelling [35]
Mass flow rate for the NOx [g/Kgfuel] m ˙ N O x = 0.15 10 16 τ 0.5 e x p ( 71100 T s t ) P 3 0.05 ( Δ P 3 P 3 ) 0.5 Where T s t is the stoichiometric temperature, Δ P 3 P 3 is the normalized pressure drop, τ is the residence time which assumed to be constant (0.002s). (A57)
Mass flow rate for CO [g/Kgfuel] m ˙ C O = 0.179 10 9 e x p ( 7800 T p z ) P 3 2 τ ( Δ P 3 P 3 ) 0.5 (A58)
Adiabatic flame temperature T p z = A σ α e x p   ( β σ + λ 2 ) ( P P r e f ) x θ y ψ z Where θ dimensionless temperature T T r e f , ψ is the atomic fuel ratio, x , y , and z are second-degree correlation based on σ , whereas A,   α , β are constant, which can be found in [19](A59)
Overall system performance analysis
Overall power W ˙ n e t , = W ˙ n e t ( G T ) + W ˙ n e t ( S T ) W ˙ A b s , p The total net power (A60)
Thermal efficiency η C C P P = W ˙ n e t , m ˙ a i r L H V   f The overall efficiency (A61)
Specific fuel consumption S F C = f   m ˙ a i r W ˙ n e t -(A62)

References

  1. Furlan, G.; You, F. Robust design of hybrid solar power systems: Sustainable integration of concentrated solar power and photovoltaic technologies. Adv. Appl. Energy 2024, 13, 100164. [Google Scholar] [CrossRef]
  2. Østergaard, P.A.; Duic, N.; Noorollahi, Y.; Mikulcic, H.; Kalogirou, S. Sustainable Development Using Renewable Energy Technology; Elsevier: Amsterdam, The Netherlands, 2020. [Google Scholar]
  3. Akroot, A.; Almaktar, M.; Alasali, F. The Integration of Renewable Energy into a Fossil Fuel Power Generation System in Oil-Producing Countries: A Case Study of an Integrated Solar Combined Cycle at the Sarir Power Plant. Sustainability 2024, 16, 4820. [Google Scholar] [CrossRef]
  4. Mokheimer, E.M.; Dabwan, Y.N.; Habib, M.A. Optimal integration of solar energy with fossil fuel gas turbine cogeneration plants using three different CSP technologies in Saudi Arabia. Appl. Energy 2017, 185, 1268–1280. [Google Scholar] [CrossRef]
  5. Liu, X.; Jeffries, J.; Hanson, R.; Hinckley, K.; Woodmansee, M. Development of a tunable diode laser sensor for measurements of gas turbine exhaust temperature. Appl. Phys. B 2006, 82, 469–478. [Google Scholar] [CrossRef]
  6. Jiang, Y.; Ma, Y.; Han, F.; Ji, Y.; Cai, W.; Wang, Z. Assessment and optimization of a novel waste heat stepped utilization system integrating partial heating sCO2 cycle and ejector refrigeration cycle using zeotropic mixtures for gas turbine. Energy 2023, 265, 126326. [Google Scholar] [CrossRef]
  7. Ahmad, A.D.; Abubaker, A.M.; Najjar, Y.S.; Manaserh, Y.M.A. Power boosting of a combined cycle power plant in Jordan: An integration of hybrid inlet cooling & solar systems. Energy Convers. Manag. 2020, 214, 112894. [Google Scholar]
  8. Dabwan, Y.N.; Zhang, L.; Pei, G. A novel inlet air cooling system to improve the performance of intercooled gas turbine combined cycle power plants in hot regions. Energy 2023, 283, 129075. [Google Scholar] [CrossRef]
  9. Yao, X.; Yi, B.; Yu, Y.; Fan, Y.; Zhu, L. Economic analysis of grid integration of variable solar and wind power with conventional power system. Appl. Energy 2020, 264, 114706. [Google Scholar] [CrossRef]
  10. Iraola, A. U.S. Natural Gas Consumption Set Annual and Monthly Records during 2023; U.S. Energy Information Administration: Washington, DC, USA, 2024. [Google Scholar]
  11. Rabbani, R.; Zeeshan, M. Exploring the suitability of MERRA-2 reanalysis data for wind energy estimation, analysis of wind characteristics and energy potential assessment for selected sites in Pakistan. Renew. Energy 2020, 154, 1240–1251. [Google Scholar] [CrossRef]
  12. Kayadelen, H.K.; Ust, Y. Thermoenvironomic evaluation of simple, intercooled, STIG, and ISTIG cycles. Int. J. Energy Res. 2018, 42, 3780–3802. [Google Scholar] [CrossRef]
  13. Dimitriadis, C.N.; Tsimopoulos, E.G.; Georgiadis, M.C. Optimal bidding strategy of a gas-fired power plant in interdependent low-carbon electricity and natural gas markets. Energy 2023, 277, 127710. [Google Scholar] [CrossRef]
  14. Al-Otoom, A.; Al-Khalaileh, A.T. Water desalination using solar continuous humidification–dehumidification process using hygroscopic solutions and rotating belt. Sol. Energy 2020, 197, 38–49. [Google Scholar] [CrossRef]
  15. Hu, H.; Wang, T.; Ren, Y.; Zhang, F.; Zhang, B.; Li, J. A Case Study of Thermal Performance of Gas-Steam Combined Cycle with Gas Turbine Inlet Air Cooling and Condenser Deep Cooling. Case Stud. Therm. Eng. 2024, 60, 104747. [Google Scholar] [CrossRef]
  16. Archer, C.L.; Jacobson, M.Z. Evaluation of global wind power. J. Geophys. Res. Atmos. 2005, 110. [Google Scholar] [CrossRef]
  17. Foley, A.M.; Leahy, P.G.; Marvuglia, A.; McKeogh, E.J. Current methods and advances in forecasting of wind power generation. Renew. Energy 2012, 37, 1–8. [Google Scholar] [CrossRef]
  18. Ondryas, I.; Wilson, D.; Kawamoto, M.; Haub, G. Options in gas turbine power augmentation using inlet air chilling. J. Eng. Gas Turbines Power U. S. 1991, 113, 203–211. [Google Scholar] [CrossRef]
  19. Barzegar Avval, H.; Ahmadi, P.; Ghaffarizadeh, A.; Saidi, M. Thermo-economic-environmental multiobjective optimization of a gas turbine power plant with preheater using evolutionary algorithm. Int. J. Energy Res. 2011, 35, 389–403. [Google Scholar] [CrossRef]
  20. Mohapatra, A.K. Thermodynamic assessment of impact of inlet air cooling techniques on gas turbine and combined cycle performance. Energy 2014, 68, 191–203. [Google Scholar] [CrossRef]
  21. Ehyaei, M.; Hakimzadeh, S.; Enadi, N.; Ahmadi, P. Exergy, economic and environment (3E) analysis of absorption chiller inlet air cooler used in gas turbine power plants. Int. J. Energy Res. 2012, 36, 486–498. [Google Scholar] [CrossRef]
  22. Nayak, C.K.; Nayak, M.R. Battery Energy Storage System for Solar PV and Wind Power Smoothing Considering Economic Aspects. In Applications of Computing, Automation and Wireless Systems in Electrical Engineering; Springer: Berlin/Heidelberg, Germany, 2019; pp. 157–168. [Google Scholar]
  23. Najjar, Y.; Al-Zoghool, Y. Sustainable energy development in power generation by using green inlet-air cooling technologies with gas turbine engines. J. Eng. Thermophys. 2015, 24, 181–204. [Google Scholar] [CrossRef]
  24. Najjar, Y.S.; Abubaker, A.M.; El-Khalil, A.F. Novel inlet air cooling with gas turbine engines using cascaded waste-heat recovery for green sustainable energy. Energy 2015, 93, 770–785. [Google Scholar] [CrossRef]
  25. Mahmoudi, S.; Zare, V.; Ranjbar, F.; Farshi, L.G. Inlet Air Cooling Using Absorption Refrigeration. J. Appl. Sci. 2009, 9, 2399–2407. [Google Scholar] [CrossRef]
  26. Klein, P.; Roos, T.; Sheer, T. Parametric analysis of a high temperature packed bed thermal storage design for a solar gas turbine. Sol. Energy 2015, 118, 59–73. [Google Scholar] [CrossRef]
  27. Cho, F.; Saito, K. Fujio Cho Legacy Lecture Notes; Institute of Research for Technology Development Textbook Gallery: Lexington, KY, USA, 2020; Available online: https://uknowledge.uky.edu/cgi/viewcontent.cgi?article=1000&context=ir4td_textbooks (accessed on 10 September 2021).
  28. Mehrpanahi, A.; Naserabad, S.N.; Ahmadi, G. Multi-objective linear regression based optimization of full repowering a single pressure steam power plant. Energy 2019, 179, 1017–1035. [Google Scholar] [CrossRef]
  29. Colak, H.E.; Memisoglu, T.; Gercek, Y. Optimal site selection for solar photovoltaic (PV) power plants using GIS and AHP: A case study of Malatya Province, Turkey. Renew. Energy 2020, 149, 565–576. [Google Scholar] [CrossRef]
  30. Najjar, Y.S.; Manaserh, Y.M.A. Aligning combined cycle power plant performance with field measurements. Arab. J. Sci. Eng. 2019, 44, 1657–1669. [Google Scholar] [CrossRef]
  31. Huld, T.; Müller, R.; Gambardella, A. A new solar radiation database for estimating PV performance in Europe and Africa. Sol. Energy 2012, 86, 1803–1815. [Google Scholar] [CrossRef]
  32. Heller, P.; Pfänder, M.; Denk, T.; Tellez, F.; Valverde, A.; Fernandez, J.; Ring, A. Test and evaluation of a solar powered gas turbine system. Sol. Energy 2006, 80, 1225–1230. [Google Scholar] [CrossRef]
  33. Abubaker, A.M.; Ahmad, A.D.; Singh, B.B.; Akafuah, N.K.; Saito, K. Multi-objective linear-regression-based optimization of a hybrid solar-gas turbine combined cycle with absorption inlet-air cooling unit. Energy Convers. Manag. 2021, 240, 114266. [Google Scholar] [CrossRef]
  34. EU Science Hub. Non-Interactive Service. 2020. Available online: https://joint-research-centre.ec.europa.eu/photovoltaic-geographical-information-system-pvgis/getting-started-pvgis/api-non-interactive-service_en (accessed on 15 September 2021).
  35. Yazdi, M.R.M.; Ommi, F.; Ehyaei, M.; Rosen, M.A. Comparison of gas turbine inlet air cooling systems for several climates in Iran using energy, exergy, economic, and environmental (4E) analyses. Energy Convers. Manag. 2020, 216, 112944. [Google Scholar] [CrossRef]
  36. Singh, H.; Mishra, R. Performance analysis of solar parabolic trough collectors driven combined supercritical CO2 and organic Rankine cycle. Eng. Sci. Technol. Int. J. 2018, 21, 451–464. [Google Scholar]
  37. Talbi, M.; Agnew, B. Exergy analysis: An absorption refrigerator using lithium bromide and water as the working fluids. Appl. Therm. Eng. 2000, 20, 619–630. [Google Scholar] [CrossRef]
  38. Bergman, T.L.; Incropera, F.P.; DeWitt, D.P.; Lavine, A.S. Fundamentals of Heat and Mass Transfer; John Wiley & Sons: Hoboken, NJ, USA, 2011. [Google Scholar]
  39. NextEra Energy Partners. Annual Report; 2018. Available online: https://www.investor.nexteraenergypartners.com/~/media/Files/N/NEP-IR/reports-and-fillings/quartely-earnings/2018/q4/4Q18%20NEP%20Earnings%20Release%20FINAL.PDF (accessed on 15 September 2021).
  40. Price, H.; Lüpfert, E.; Kearney, D.; Zarza, E.; Cohen, G.; Gee, R.; Mahoney, R. Advances in parabolic trough solar power technology. J. Sol. Energy Eng. 2002, 124, 109–125. [Google Scholar] [CrossRef]
  41. Al-Sulaiman, F.A. Exergy analysis of parabolic trough solar collectors integrated with combined steam and organic Rankine cycles. Energy Convers. Manag. 2014, 77, 441–449. [Google Scholar] [CrossRef]
  42. Elsafi, A.M. Exergy and exergoeconomic analysis of sustainable direct steam generation solar power plants. Energy Convers. Manag. 2015, 103, 338–347. [Google Scholar] [CrossRef]
  43. Kearney, D.; Kelly, B.; Herrmann, U.; Cable, R.; Pacheco, J.; Mahoney, R.; Price, H.; Blake, D.; Nava, P.; Potrovitza, N. Engineering aspects of a molten salt heat transfer fluid in a trough solar field. Energy 2004, 29, 861–870. [Google Scholar] [CrossRef]
  44. Shahin, M.S.; Orhan, M.F.; Uygul, F. Thermodynamic analysis of parabolic trough and heliostat field solar collectors integrated with a Rankine cycle for cogeneration of electricity and heat. Sol. Energy 2016, 136, 183–196. [Google Scholar] [CrossRef]
  45. Najjar, Y.S.; Abubaker, A.M. Indirect evaporative combined inlet air cooling with gas turbines for green power technology. Int. J. Refrig. 2015, 59, 235–250. [Google Scholar] [CrossRef]
  46. Gebreslassie, B.H.; Guillén-Gosálbez, G.; Jiménez, L.; Boer, D. Design of environmentally conscious absorption cooling systems via multi-objective optimization and life cycle assessment. Appl. Energy 2009, 86, 1712–1722. [Google Scholar] [CrossRef]
  47. National Research Council. The Ongoing Challenge of Managing Carbon Monoxide Pollution in Fairbanks, Alaska: Interim Report; National Academies Press: Cambridge, MA, USA, 2002. [Google Scholar]
  48. Saito, K.; Williams, F.; Gordon, A. Structure of laminar coflow methane–air diffusion flames. ASME J. Heat Mass Transfer 1986, 108, 640–648. [Google Scholar] [CrossRef]
  49. Abubaker, A.M.; Najjar, Y.S.; Ahmad, A.D. A uniquely finned tube heat exchanger design of a condenser for heavy-duty air conditioning systems. Int. J. Air-Cond. Refrig. 2020, 28, 2050004. [Google Scholar] [CrossRef]
  50. Shi, W.; Pan, L. Optimization study on fluids for the gravity-driven organic power cycle. Energies 2019, 12, 732. [Google Scholar] [CrossRef]
  51. Najjar, Y.S.; Al-Absi, S. Thermoeconomic optimization for green multi-shaft gas turbine engines. Energy 2013, 56, 39–45. [Google Scholar] [CrossRef]
  52. Bellos, E.; Tzivanidis, C.; Antonopoulos, K.A. Parametric analysis and optimization of a solar assisted gas turbine. Energy Convers. Manag. 2017, 139, 151–165. [Google Scholar] [CrossRef]
  53. Wu, C.; Wang, S.-S.; Feng, X.-J.; Li, J. Energy, exergy and exergoeconomic analyses of a combined supercritical CO2 recompression Brayton/absorption refrigeration cycle. Energy Convers. Manag. 2017, 148, 360–377. [Google Scholar] [CrossRef]
  54. Edge, E. Overall Heat Transfer Coefficient Table Charts and Equation. 2020. Available online: https://www.engineersedge.com/thermodynamics/overall_heat_transfer-table.htm?fbclid=IwAR2s0hlUqOyWk8_JBl69iV_qVKZM8I6G5Jxi_WulMUA6nDIDwYA14fGhH7k (accessed on 8 September 2020).
  55. Abubaker, A.M.; Darwish Ahmad, A.; Salaimeh, A.A.; Akafuah, N.K.; Saito, K. A novel solar combined cycle integration: An exergy-based optimization using artificial neural network. Renew. Energy 2022, 181, 914–932. [Google Scholar] [CrossRef]
  56. Deymi-Dashtebayaz, M.; Kazemiani-Najafabad, P. Energy, exergy, economic, and environmental analysis for various inlet air cooling methods on Shahid Hashemi-Nezhad gas turbines refinery. Energy Environ. 2019, 30, 481–498. [Google Scholar] [CrossRef]
  57. Alizadeh, S.; Ghazanfari, A.; Ehyaei, M.; Ahmadi, A.; Jamali, D.; Nedaei, N.; Davarpanah, A. Investigation the Integration of Heliostat Solar Receiver to Gas and Combined Cycles by Energy, Exergy, and Economic Point of Views. Appl. Sci. 2020, 10, 5307. [Google Scholar] [CrossRef]
  58. Baghernejad, A.; Yaghoubi, M. Exergoeconomic analysis and optimization of an Integrated Solar Combined Cycle System (ISCCS) using genetic algorithm. Energy Convers. Manag. 2011, 52, 2193–2203. [Google Scholar] [CrossRef]
  59. Amelio, M.; Ferraro, V.; Marinelli, V.; Summaria, A. An evaluation of the performance of an integrated solar combined cycle plant provided with air-linear parabolic collectors. Energy 2014, 69, 742–748. [Google Scholar] [CrossRef]
  60. Yari, M.; Mahmoudi, S. Utilization of waste heat from GT-MHR for power generation in organic Rankine cycles. Appl. Therm. Eng. 2010, 30, 366–375. [Google Scholar] [CrossRef]
  61. Ebrahimi, M.; Moradpoor, I. Combined solid oxide fuel cell, micro-gas turbine and organic Rankine cycle for power generation (SOFC–MGT–ORC). Energy Convers. Manag. 2016, 116, 120–133. [Google Scholar] [CrossRef]
  62. Schwarzbözl, P.; Buck, R.; Sugarmen, C.; Ring, A.; Crespo, M.J.M.; Altwegg, P.; Enrile, J. Solar gas turbine systems: Design, cost and perspectives. Sol. Energy 2006, 80, 1231–1240. [Google Scholar] [CrossRef]
  63. Alhazmy, M.; Najjar, Y.S. Augmentation of gas turbine performance using air coolers. Appl. Therm. Eng. 2004, 24, 415–429. [Google Scholar] [CrossRef]
  64. Korakianitis, T.; Wilson, D.G. Models for predicting the performance of Brayton-cycle engines. J. Eng. Gas Turbines Power 1994, 116, 381–388. [Google Scholar] [CrossRef]
  65. Ameri, M.; Mohammadzadeh, M. Thermodynamic, thermoeconomic and life cycle assessment of a novel integrated solar combined cycle (ISCC) power plant. Sustain. Energy Technol. Assess. 2018, 27, 192–205. [Google Scholar] [CrossRef]
Figure 1. Flow diagram of the research structure procedure.
Sustainability 16 06229 g001
Figure 3. Description of GT sequence.
Sustainability 16 06229 g003
Figure 4. HRSG sequence description.
Sustainability 16 06229 g004
Figure 5. Description of CSP sequence.
Sustainability 16 06229 g005
Figure 6. Description of the remaining sequence in the PACC.
Sustainability 16 06229 g006
Figure 7. Flowchart for the proposed system.
Sustainability 16 06229 g007
Figure 8. The impact of the operating parameters on (a) output power, (b) thermal efficiency, and (c) SFC.
Sustainability 16 06229 g008aSustainability 16 06229 g008bSustainability 16 06229 g008c
Figure 9. The impact of the operating parameters on (a) CO emissions and (b) NOx per kg fuel.
Sustainability 16 06229 g009
Figure 10. The impact of the operating parameters on the (a) CO emissions, (b) NOx emissions, and (c) CO2 emissions.
Sustainability 16 06229 g010aSustainability 16 06229 g010bSustainability 16 06229 g010c
Figure 11. Flow chart for the optimization process.
Sustainability 16 06229 g011
Table 1. Assumption, operating, and ambient conditions at the design point.
Ambient Conditions [30]
Ambient air temperature36 °C
Ambient air pressure100 kPa
GT [7]
Model SGT6-2000E
Number of gas turbines 2
Pressure ratio11.3
CC efficiency, ηCC98%
Natural gas LHV49,322 kJ/s
GT exhaust temperature, T4569 °C
Air mass flowrate for each GT, ma 432.6 kg/s
HRSG [7]
Isentropic efficiency of STs85%
Efficiency of pumps80%
Evaporation pressure in HP HRSG8248 kPa
Evaporation pressure in LP HRSG 531.1 kPa
Steam flowrate in HP HRSG, m8116 kg/s
Steam flowrate in LP HRSG, m1017.2 kg/s
Pressure ratio in HP HRSG, rp,HP15.8
Pressure ratio LP HRSG, rpLP30
Pressure drop in heat exchanger 2%
Table 2. Validation of the developed models compared to the models reported in the literature.
GTPower Generated at Full and Part Loads
Present StudyRef. [30]Relative Difference (%)
Load %100%268,828 (kW)256,438 (kW)4.83
75%211,608 (kW)193,034 (kW)9.62
HRSGHeat Transferred at Full and Part Loads
Present StudyRef. [30]Relative Difference (%)
Load %100%133,829 (kW)132,736 (kW)0.82
75%112,068 (kW)111,736 (kW)0.30
ACUBased on the Cooling Load (kW/ kgref)
Present StudyRef. [7]Relative Difference (%)
qevap (kW/kgref)2495 (kW/ kgref)2316 (kW/ kgref)7.73
PTCCollected Heat Considering Ambient Temperature and Heat Loses
Present StudyRef. [41]Relative Difference (%)
Ta,avg (°C)100.6 (°C)10.67 (W/m2)10.6 (W/m2)0.66
149.1 (°C)19.46 (W/m2)19.3 (W/m2)0.83
196.7 (°C)31.12 (W/m2)30.6 (W/m2)1.70
245.8 (°C)46.82 (W/m2)45.4 (W/m2)3.13
293.3 (°C)66.11 (W/m2)62.9 (W/m2)5.10
Table 3. State point thermodynamic properties along with the PACC system.
State PointFluidTemperature (°C)Pressure (kPa)Mass Flow Rate (kg/s)
aAir361002 × 432.6
1Air5 1002 × 432.6
2Air358.111302 × 432.6
2aAir505.811072 × 432.6
3Gas1145.810852 × 440.7
4Gas5691012 × 440.7
5Gas218.3101881.4
6Gas175.8101881.4
7Gas115101881.4
8Steam5517620116
9Steam219.8500.1116
10Steam205.6500.117.2
11Steam217.9500.1133.2
12Steam57.9318.1133.2
13Water57.517.74133.2
14Water57.6531.1133.2
15Water57.6531.1133.2
16Water153.4520.717.2
17Water153.4520.7116
18Water154.88248116
19Gas514.4101881.4
20Gas478.6101881.4
21Gas301.8101881.4
22Gas216.1101881.4
23Steam153.4510.317.2
24Steam295.88086116
25Steam295.87928116
26Steam370.87772116
36Steam9740.212.32
37Water7640.212.32
38Water20.70612.32
39Steam20.70612.32
40LiBr/H2O550.70671.86
41LiBr/H2O5740.271.86
42LiBr/H2O10340.271.86
43LiBr/H2O8240.259.53
44LiBr/H2O4140.259.53
45LiBr/H2O400.70659.53
siSolar Salt484.81000632.1
soSolar Salt3721000632.1
sooSolar Salt346.91000632.1
w1,inWater361004632
w1,outWater511004632
w2,inWater36100347.7
w2,outWater56100347.7
w3,inWater36100938.9
w3,outWater46100938.9
Table 4. Difference in the performance parameters between the proposed system and Al-Qatrana plant at the design point conditions.
Performance ParameterAl-QatranaProposed System Relative Difference [%]
Generated power [MW]402.72430.396.87
Thermal efficiency [%]47.2656.4519.45
Fuel consumption [kg/s]17.2815.46−10.53
SFC [×10−5 kg/kW]4.293.59−16.32
Table 5. Operating parameters’ acceptable ranges.
Operating VariableOperation RangeReferences
Ambient temperature, Ta [°C]15–45[7]
Direct solar irradiation, Gb [W/m2]500–1050[41]
Turbine inlet temperature, TIT or T3 [°C]1120–1350[51]
rp7–13[52]
mr [kg/s]0.8–2[44]
Colr380–430[7]
Cols8–13[52]
Table 6. Specifications for the ACU and PTC fields.
SpecificationsValue
ACU cooling load, QCL [MW]26.94
PTC heat input, QHI [MW]161.45
ACU generator heat transfer coefficient, UACU,Gen [kW/m2K]1.3 [53]
ACU condenser heat transfer coefficient, UACU,Con [kW/m2K]0.5 [53]
ACU evaporator heat transfer coefficient, UACU,Eva [kW/m2K]1.1 [53]
ACU absorber heat transfer coefficient, UACU,Abs [kW/m2K]0.8 [53]
ACU heat exchanger heat transfer coefficient, UACU,HE [kW/m2K]0.7 [53]
SHE1 heat transfer coefficient, UACU,SHE1 [kW/m2K]0.3 [54]
Table 7. A brief comparison of different enhancements on GT and GTCC PPs presented in the literature.
Ref.SummaryKey ProsKey DisadvantageKey Findings
This study Combined cycle power plant incorporated with compressed air heater and air-cooling system, both operated by solar energy.
  • Boosting the generated power.
  • Reducing the power plant fuel consumption.
  • Intermittent of renewable energy.
Increasing efficiency from 47.26% to 61.1%.
Bellos et al. [52]Gas turbine combined with PTC that directly heats the compressed air of the GT.
  • Decreasing fuel consumption and evaluating the pressure drop in the turbine
  • The HTF is the compressed air that causes larger PTC.
Fuel is saved by 64%.
Darwish Ahmad et al. [7]GTCC with hybrid air-cooling system with PTC for generating steam.
  • Utilizing waste heat.
  • Boosting generated power.
  • Improving efficiency.
  • Introducing a large number of components.
  • Additional fuel consumption by IAC.
Increasing the efficiency to 52%.
Najjar et al. [24]Combined gas turbine with two propane cycles.
  • Utilizing waste heat.
  • Boosting generated power.
  • Improving efficiency.
  • Insufficient amount of waste heat.
  • Additional fuel consumption by IAC.
Increasing the efficiency from 28.5% to 41.3%.
Yazdi et al. [35]Various IAC technologies integrated with various GTs.
  • Boosting generated power.
  • Improving efficiency.
  • Additional fuel consumption by IAC.
  • Sensitivity to humidity while fogging is being used.
Increasing the efficiency by 5.5–5.8%.
Dashyebayaz and Najafabad [56]Integrating NG pressure drop station with GT.
  • Improving efficiency.
  • Hazardous method due to releasing NG.
The efficiency was enhanced by 2.5%.
Alizadeh et al. [57]Combined GTCC power plant with CSP.
  • Utilizing clean energy.
  • Boosting generated power.
  • Improving efficiency.
  • Limited therminol maximum temperature (400 °C).
Increasing the efficiency from 28.4% to 44%.
Avval et al. [19]GTPP integrated with air preheater.
  • Utilizing waste heat.
  • Reducing fuel consumption.
  • Improving efficiency.
  • Waste heat was limited.
Increasing the exergy efficiency to 44%.
Baghernejad and Yaghoubi [58]GTCC with CSP.
  • Utilizing clean energy.
  • Boosting generated power.
  • Improving efficiency.
  • Vulnerable to the variation in air temperature.
Increasing the exergy efficiency 47%.
Amelio et al. [59]GTCC integrated with air-based PTC.
  • Utilizing clean energy.
  • Reducing fuel consumption.
  • Improving efficiency.
  • Significant large number of PTCs.
Increasing the efficiency from 51.4% to 60.9%.
Yari and Mahmoudi [60]Driving GT combined with two Organic Rankine Cycles (ORCs) by Helium reactor.
  • Utilizing waste heat.
  • Boosting generated power.
  • Require a unique power source.
  • Hazardous.
Increasing the efficiency by 3%.
Ebrahimi and Moradpoor [61]Integrated solid oxide fuel cell, mGT, and ORC.
  • Utilizing waste heat.
  • Improving efficiency
  • Works for micro-GTs.
Increasing the efficiency by up to 61%.
Schwarzbözl et al. [62]Solar gas turbine.
  • Utilizing clean energy.
  • Reducing fuel consumption.
  • Improving efficiency.
  • Require a larger number of solar towers.
Increasing the efficiency from 40% to 50%.
Disclaimer/Publisher’s Note: The statements, opinions and data contained in all publications are solely those of the individual author(s) and contributor(s) and not of MDPI and/or the editor(s). MDPI and/or the editor(s) disclaim responsibility for any injury to people or property resulting from any ideas, methods, instructions or products referred to in the content.

