Article

A Systems Engineering Approach to Decarbonizing Mining: Analyzing Electrification and CO2 Emission Reduction Scenarios for Copper Mining Haulage Systems

1
Department of Mining Engineering, Colorado School of Mines, Golden, CO 80401, USA
2
SysEne Consulting Inc., Vancouver, BC V6C 0A6, Canada
*
Author to whom correspondence should be addressed.
Sustainability 2024, 16(14), 6232; https://doi.org/10.3390/su16146232
Submission received: 13 May 2024 / Revised: 9 July 2024 / Accepted: 16 July 2024 / Published: 21 July 2024

Abstract

:
Due to climate change risks, the public, regulators, and investors require solid actions to minimize the greenhouse gas (GHG) emissions of mineral extraction and metals production. The mining sector considers alternatives to reduce its carbon footprint by transforming the business and adopting new technologies into operations. Given the capital intensity, technical characteristics, and business structure involved, a shift in the mining industry necessitates impartial insights into the trade-offs and risks. Considering the low-carbon transition trade-offs and risks in mining, this study presents the application of system dynamics modeling (SDM) in mining projects to analyze the impact of decarbonization alternatives with respect to carbon footprint and costs. A system dynamics model of an open-pit copper mine is developed to quantify greenhouse gas (GHG) emissions, as well as capital and operational costs, during the project life cycle. The change in GHG emissions in the business-as-usual scenario with diesel equipment haulage versus the alternative scenario with electric overland conveyor haulage is compared concerning GHG emissions and associated costs. The results unequivocally demonstrated that electrifying material mobility offers significant decarbonization in open-pit mining if the on-site electricity has a low emission factor. The findings also indicate that the substantial cost difference between electrification and diesel alternatives is another major obstacle to implementing electrification in an open-pit copper mine. This research proves that implementing SDM in the mining industry can offer impartial insights into decision-making and enable a thorough evaluation of options using quantitative criteria. It effectively assesses and communicates the trade-offs and risks of transitioning to low-carbon alternatives because it analyzes project variables quantitatively and holistically and is easy to run.

1. Introduction

The mining industry was responsible for 2% to 4% of global CO2 emissions [1] and 10% of all energy-related greenhouse gas (GHG) emissions in 2018 [2]. It also emitted 4% to 7% of GHG globally [3]. Climate change and its associated risks have emerged as significant global concerns. The public and investors are seeking solid measures from corporations to reduce greenhouse gas emissions in their operations. Mining companies face several challenges in reducing GHG emissions throughout the mining life cycle. These challenges include heavy reliance on fossil fuels, lack of access to grid or low-carbon electricity in remote project locations, and the growing energy demands for transportation and processing as ore grades decline.
Due to fossil fuel dependency and energy-intensive operational steps, the release of carbon dioxide (CO2), methane (CH4), nitrous oxide (N2O), nitrogen oxides (NOx), sulfur oxides (SOx), carbon monoxide (CO), and particulate matter (PM) negatively impacts the natural environment and human health and, contributes to global warming [4]. Hence, mining companies are working on alternatives to reduce their carbon footprint in line with the global trend.
One aspect of reducing the carbon footprint is integrating low-carbon transition into corporate decision-making via corporate policy and strategy documents. The major mining companies, such as Rio Tinto, BHP, Newmont, Barrick, Freeport-McMoRan, Glencore, Anglo American, have introduced climate change strategies with reduction and even net-zero targets as part of sustainability and environmental, social, and governance (ESG) strategies [5,6,7,8,9,10]. The second and most challenging one is transforming the business by making the valuation, design, planning, and operational changes required to operationalize corporate net-zero transition targets and policies and adopt new technologies.
The Organization for Economic Co-operation and Development (OECD) report on ESG investing [11] argues that companies from different sectors mostly deliver integrating climate change strategies at the corporate level. In contrast, implementing these strategies at the site level requires more attention and resources to accelerate the transition. In the case of mining, such transition requires the availability of non-emitting or low-carbon technologies, low-carbon fuels, mainly electricity, and capital, in addition to an objective assessment of trade-offs and risks of such transformation.
The mining industry’s pursuit of net-zero carbon initiatives is crucial in the context of the mineral-intensive energy transition. According to the International Energy Agency (IEA), the amount of minerals needed to construct new power generation capacity has risen by 50% since 2010. This increase aligns with the growing share of renewable energy sources in overall capacity additions [12]. The transition to renewable energy necessitates a shift from a predominantly fuel-based system to one that predominantly relies on materials. Electric vehicles necessitate six times the mineral input compared to conventional vehicles. According to the IEA [12], offshore wind farms necessitate 10 times more minerals than gas-powered power plants. To effectively address global warming, it is imperative to prioritize a significant boost in the production and availability of critical minerals. Renewable technologies and infrastructure growth are significant and imperative as they correspond to the rising need for sustainable solutions. Therefore, net-zero carbon targets in the mining industry are essential because mining, beneficiation, and metallurgical processes are highly energy-intensive. Increasing decarbonization necessitates an expansion of mining operations. Hence, establishing net-zero carbon strategies in mineral extraction is crucial for achieving a low-carbon future and meeting global warming mitigation goals [13]. Decarbonization strategies must be developed effectively by quantitatively evaluating decarbonization options in mining and beneficiation processes to satisfy the increasing metal demand and net-zero targets.
This study uses a systems engineering approach, namely system dynamics modeling (SDM), to evaluate decarbonization options in a typical open-pit copper mining operation, including processing sulfide ore to create a copper concentrate. Surface mining dominates world copper production compared to underground mining. Thus, the study considered a typical surface mining operation with generic unit operations, including drilling and blasting, waste and ore excavation and haulage, crushing, grinding, and recovery of the targeted mineral or metal.
Mine production in an open-pit operation is one of the most energy-intensive activities. According to the Coalition for Energy Efficient Comminution (CEEC) study [14], diesel equipment in an open-pit copper mine consumes 60% of the total energy. Material haulage, including overburden and ore, accounts for most of the diesel consumption, and despite the efficiency improvement of engines, diesel haulage trucks are the largest diesel consumers in open-pit mines [15]. Feng et al. [16] also highlight that material excavation and hauling with diesel equipment account for almost 51% of GHG emissions. The study focuses on material haulage as the major diesel-consuming and GHG-intensive activity in an open-pit mine. The electric overland conveyor is being considered as the alternative for its substantial efficiency enhancement achieved by swapping out the internal combustion engine option, which has an average efficiency of 35%, with an electric motor alternative boasting an efficiency of up to 90% [17]. The following decarbonization scenarios are considered:
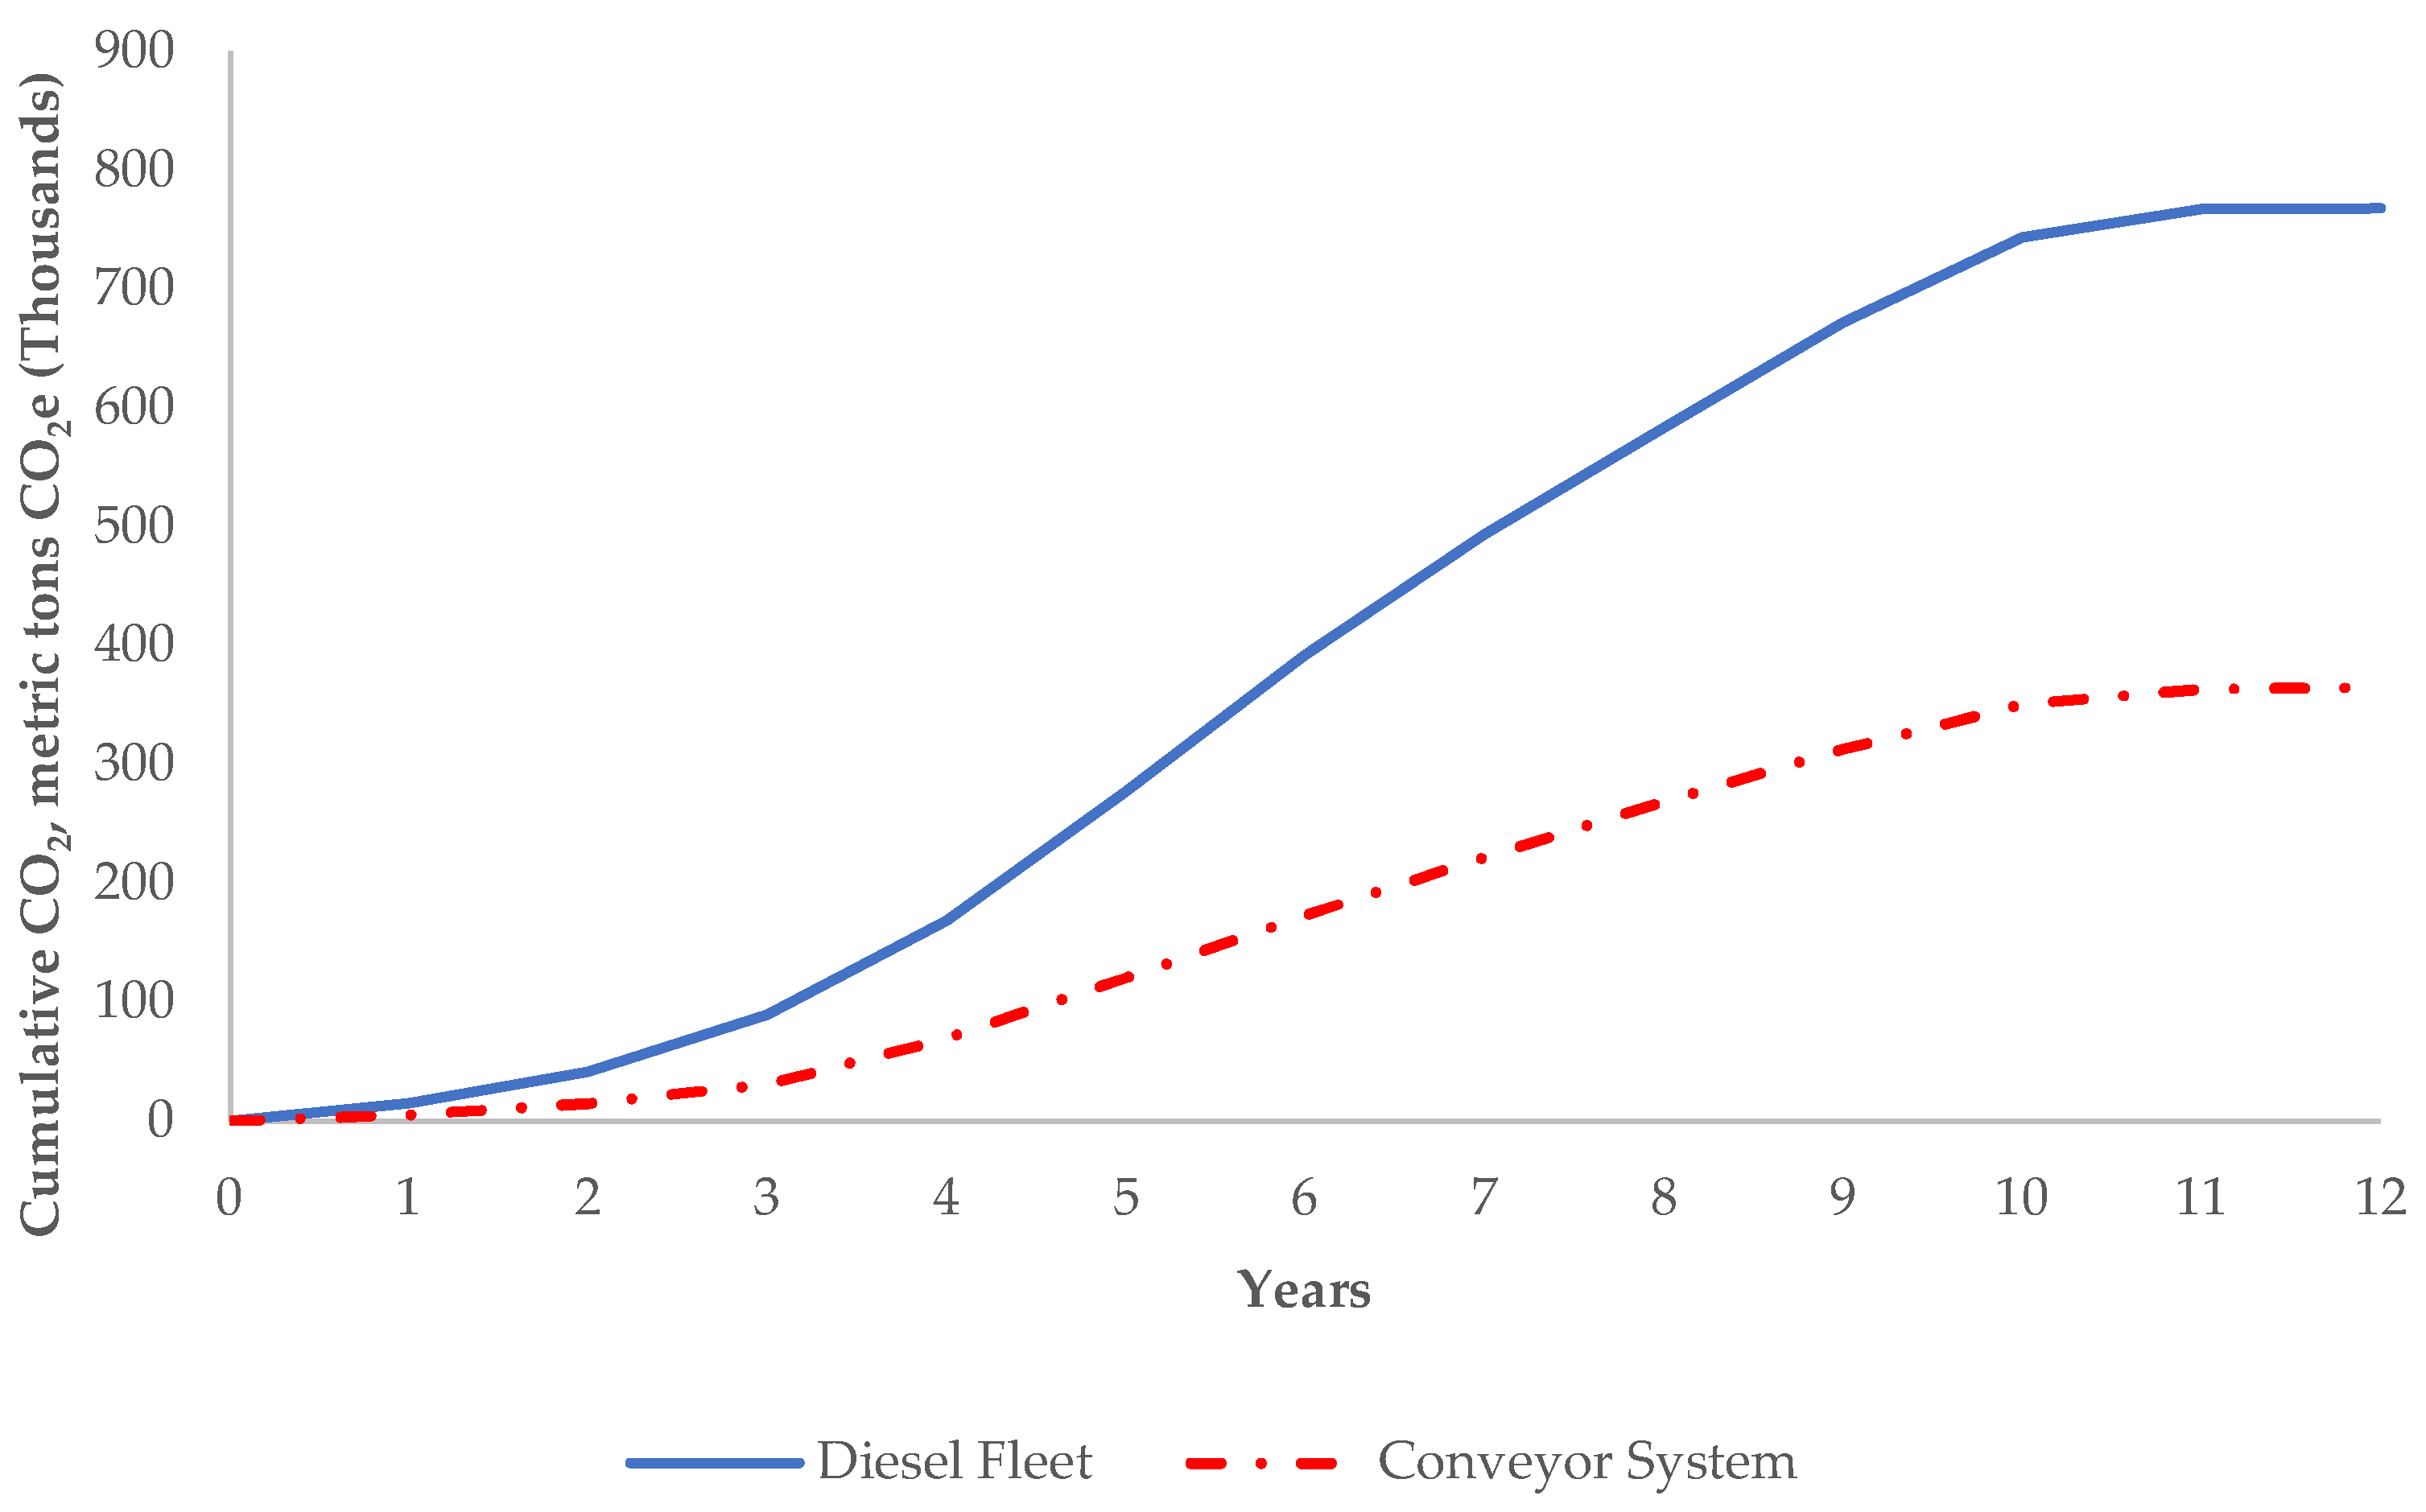
  • Electrification of waste and ore haulage by replacing the diesel fleet with an electric overland conveyor system in an open-pit copper mine in Canada with 12 years of life-of-mine (LOM).
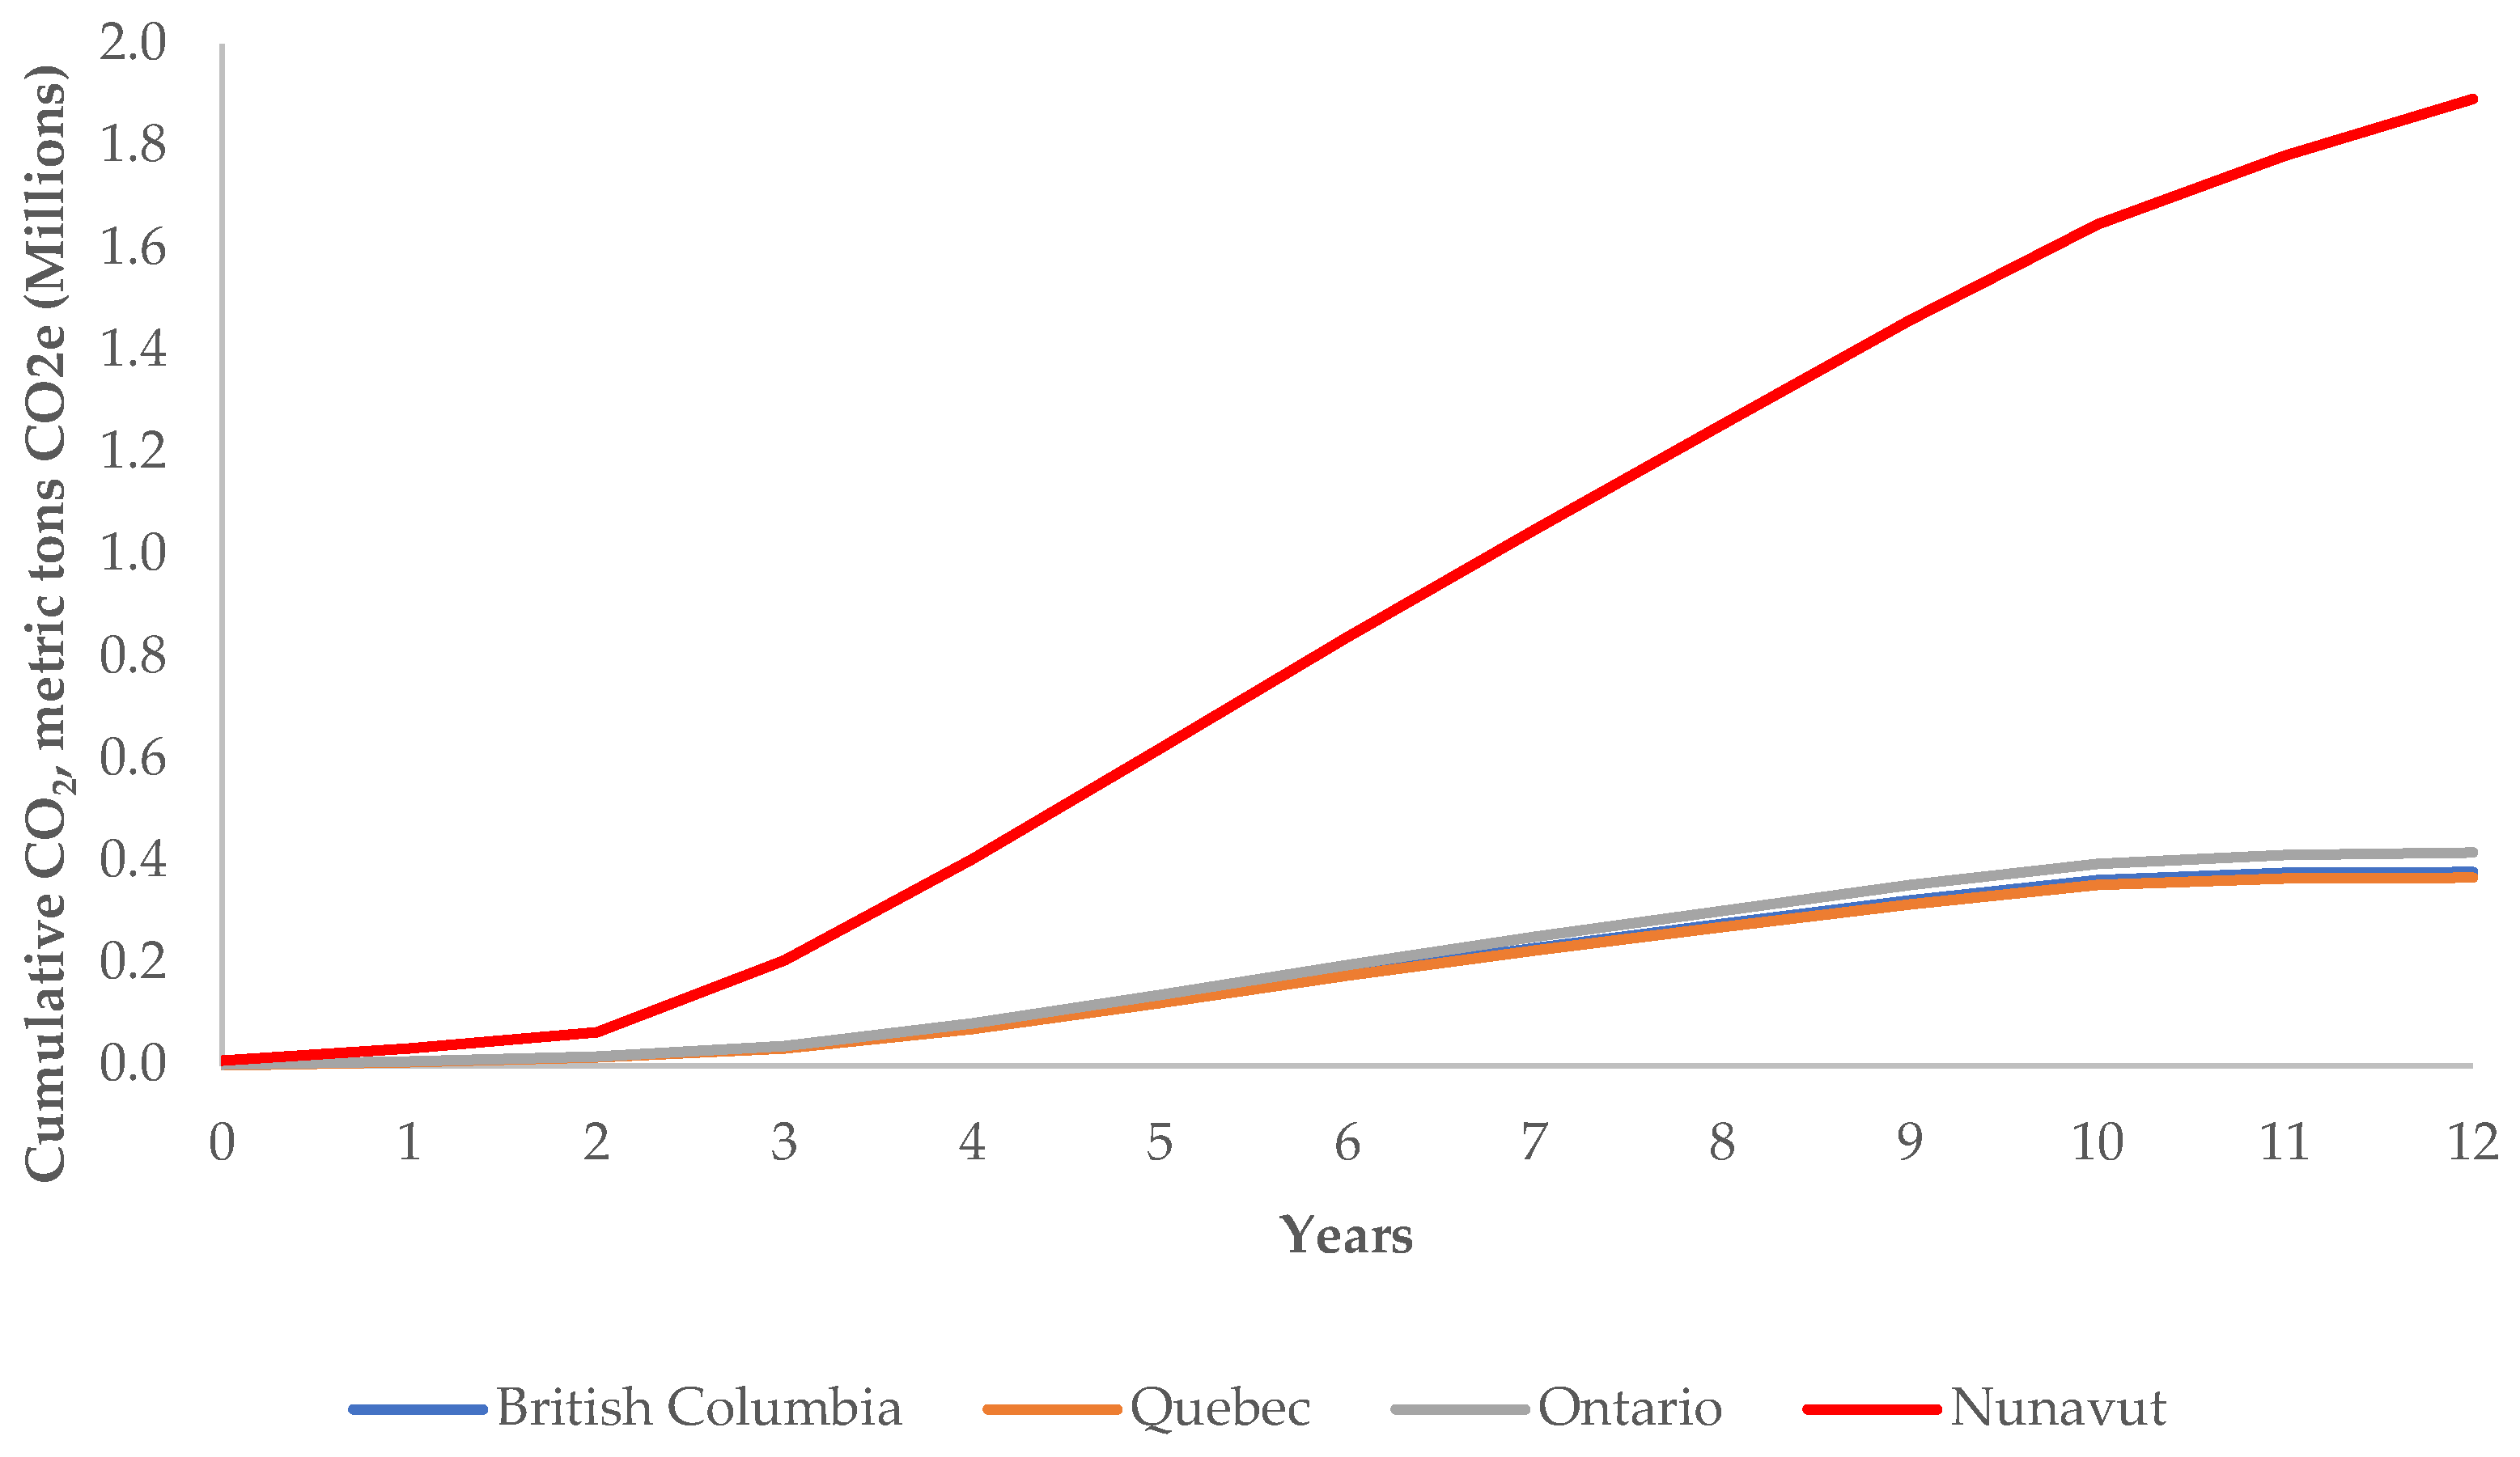
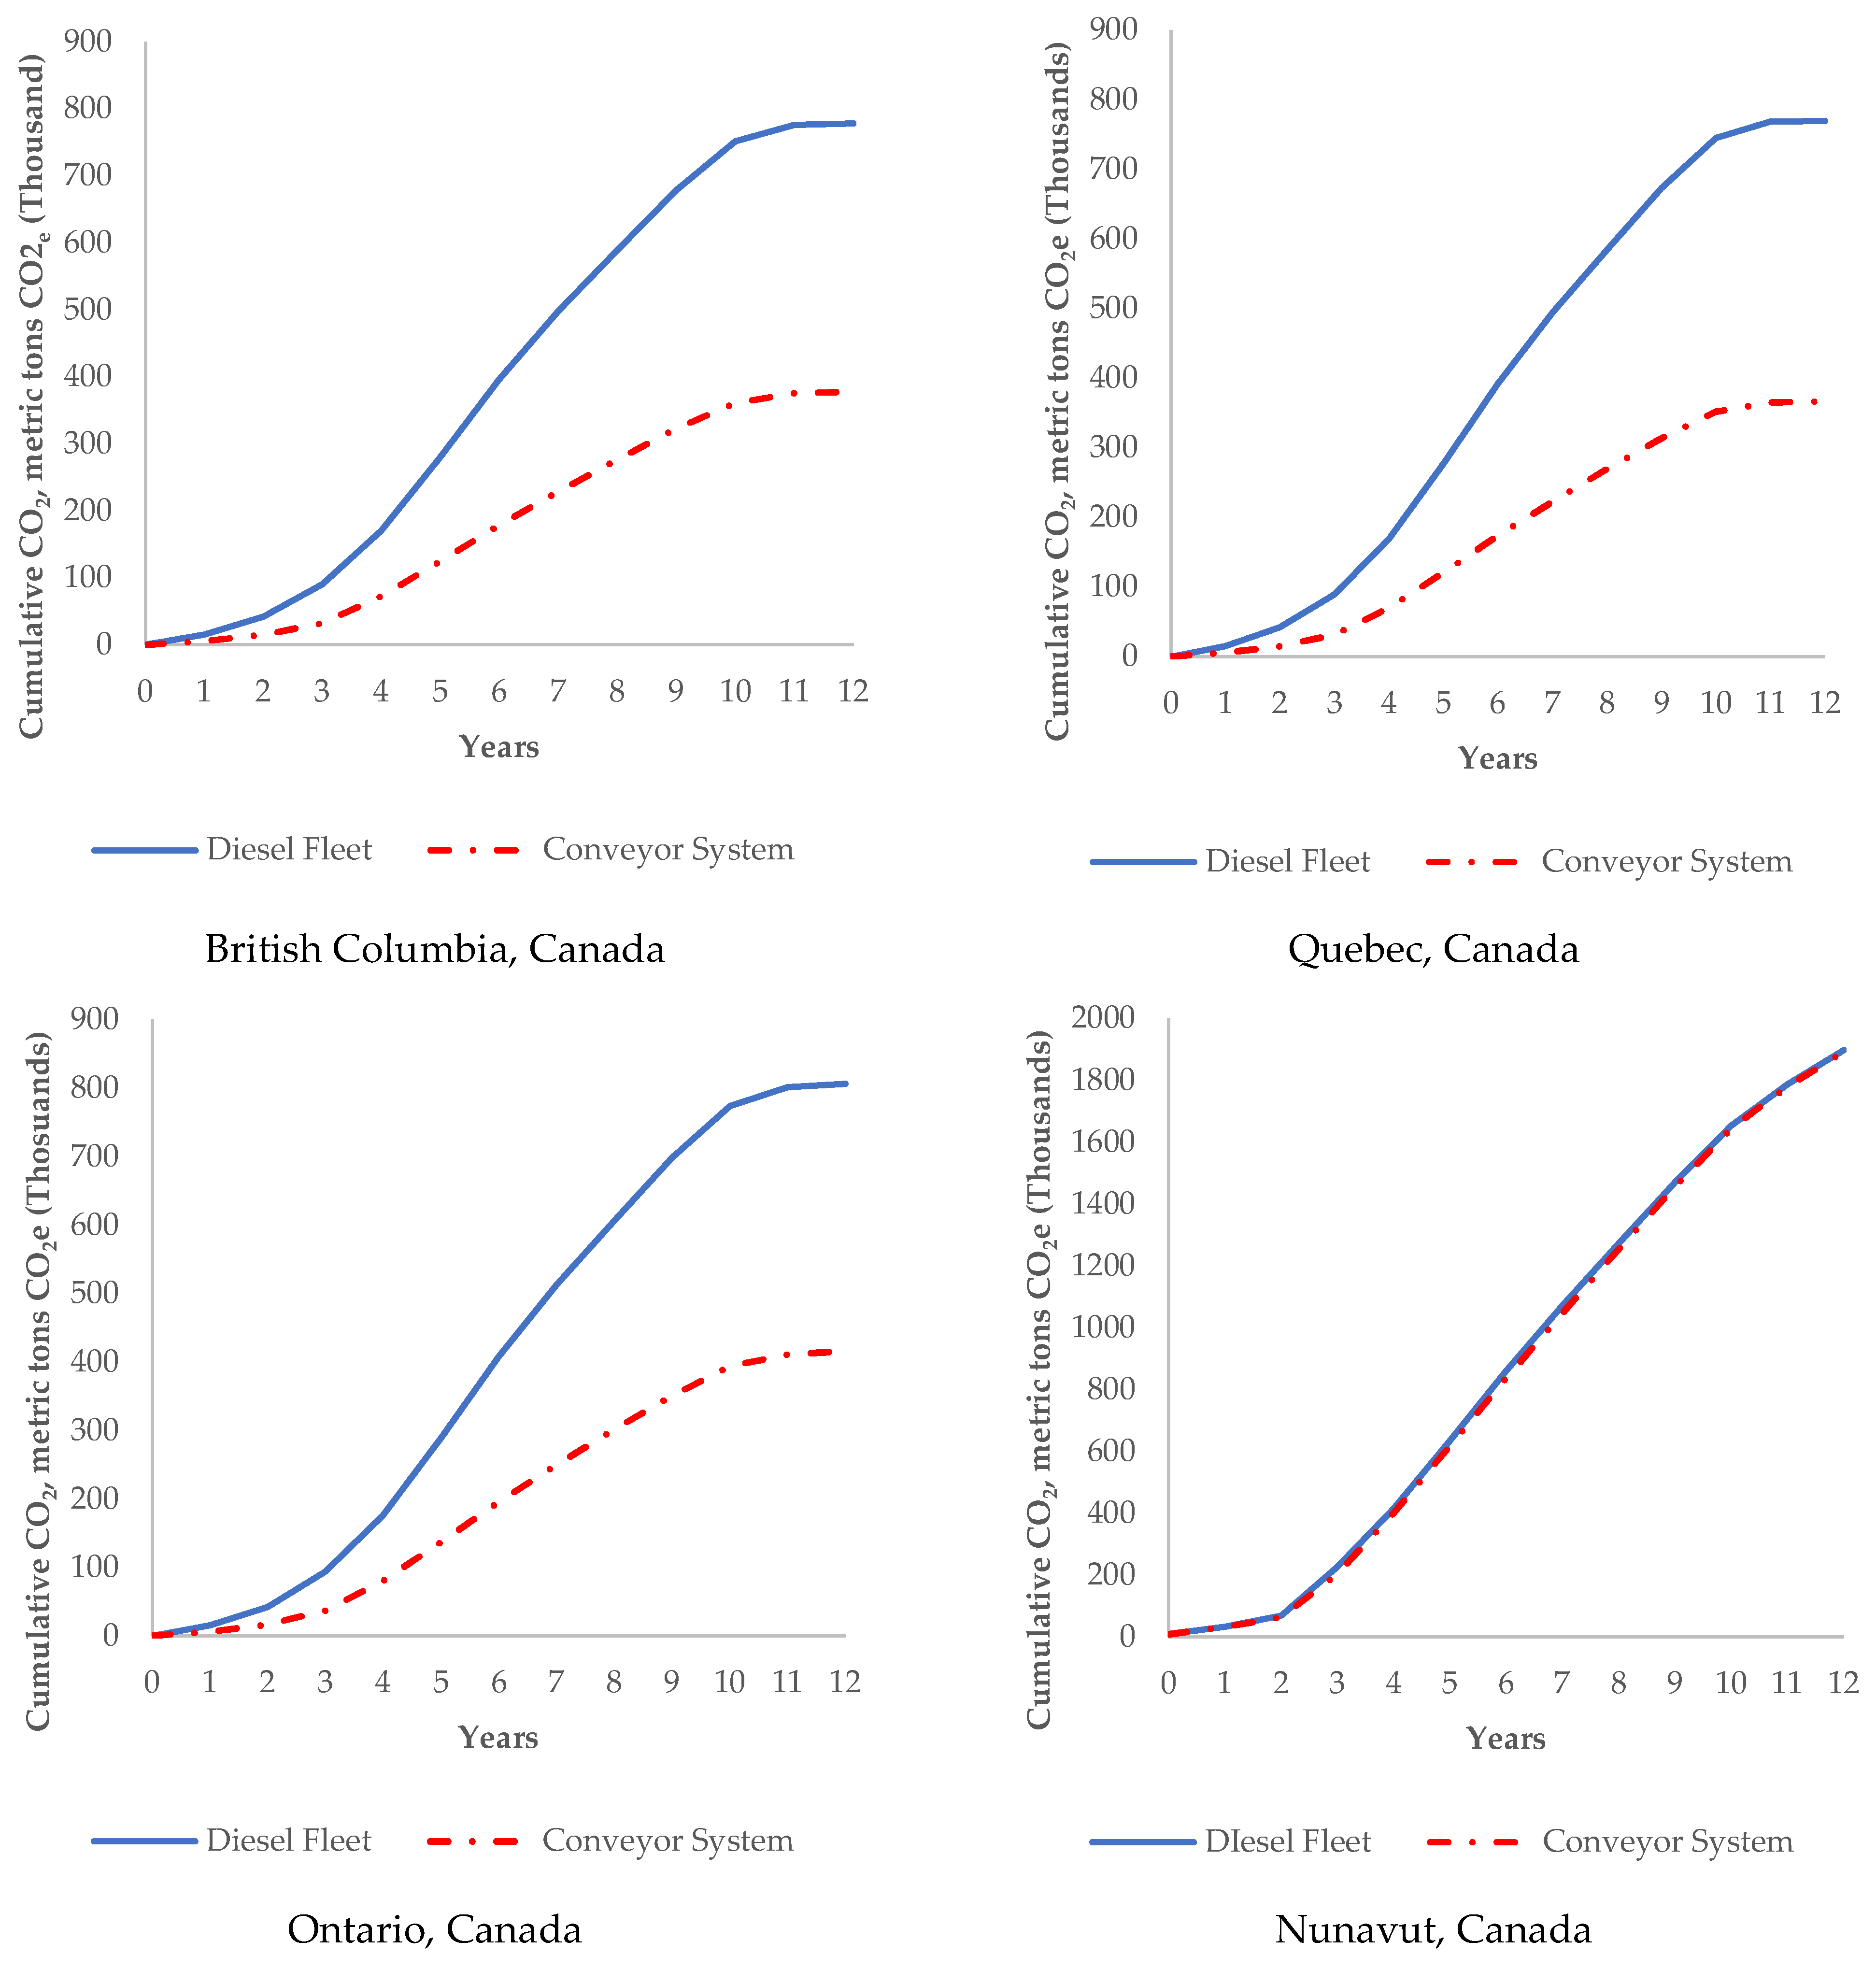
  • Decarbonization potential of electric overland conveyor system-based waste and ore haulage in different jurisdictions with various grid emission factors.
To ensure a thorough and objective understanding of the trade-offs and risks involved in the net-zero transition in mining, it is crucial to comprehend the underlying causes of the intricate nature of mining operations. These operations possess distinct characteristics, consisting of interconnected subsystems with associated issues and limitations. Thus, system thinking allows one to analyze the interaction between energy systems and systems of systems in a mining operation.
The approach outlined in this paper makes significant contributions to the existing literature on decarbonization efforts in extractive industries and the enhancement of mining’s ESG performance. Given the complex nature and challenges associated with mining and beneficiation operations, this research offers the following insights:
  • It provides a systematic approach to quantifying the evaluation of decarbonization alternatives. It considers the costs, energy, and carbon savings of low-carbon technology alternatives at various stages of the mine life cycle with different mining characteristics.
  • It Integrates market, policy, local, and climate-related risks and opportunities into the business-as-usual and electrification option analyses.
  • It allows mapping the complex mining system holistically, time-efficiently, and cost-effectively to provide cost-effective improvement options by addressing highly interdependent operational and process subsystems of mining operations.

1.1. Overview of Copper Demand and Supply

Copper plays a crucial role in the energy transition as it is a key metal in electrification. It is an essential aspect of achieving a net-zero transition by 2050. Copper is utilized in various components of renewable power generation systems such as wind generators, photovoltaic modules, transformers, inverters, and cables and connectors, specifically in their electrical conductors. The transmission and distribution of electricity are equally crucial to renewable power generation. Copper is essential in transmission and distribution networks and electrical storage applications for reliable renewable power generation systems. Heat pumps and electric vehicles are significant contributors to the low-carbon transition. In terms of copper usage, an electric vehicle (EV) requires approximately 62.5 to 75 kg of copper, while a combustion engine vehicle only requires 25 to 30 kg of copper [18]. The primary source of copper production is mining. According to the International Copper Study Group (2023), only 16% of the world’s copper production came from recycled copper in 2022. The demand for copper is fundamentally linked to economic growth with its extensive usage in the industrial and technology sectors. According to 2020 global copper users’ data [19], equipment manufacturing (32%), building construction (28%), infrastructure (16%), transportation (12%), and industrial (12%) users demand copper. As the global population continues to urbanize, the demand for copper-intensive infrastructure, including buildings and power grids, remains robust. The global push towards low-carbon economies has also become a key driver for increased copper demand in renewable and low-carbon technologies, e.g., battery-electric vehicles (BEV), solar and wind energy technologies, transmission and distribution [20].
This shift towards cleaner energy sources reshapes the copper market and drives long-term growth. The International Copper Association (2023) estimates that copper demand will reach 38 million tonnes by 2030 and 57 million tonnes by 2050. The World Bank Group [18] determined that achieving a 100 percent end-of-life recycling rate would merely result in a 26% reduction in the demand for copper from primary sources by the year 2050. Thus, copper from mining operations will still be required sustainably, to supply the global demand through 2050. On the other hand, Copper, which has been included on the list of critical minerals by Natural Resources Canada [21], International Energy Agency [22], and the United States Department of Energy [23], has a narrow supply base. The global copper reserves are estimated to be 890 million tonnes in 2022 [24]. The 2020 reserve locations are given as Chile (23%), Australia (11%), Peru (9%), Russia (7%), Mexico (6%), and the USA (5%). Canada has only 1% of the global reserves [19]. The identified resources are in South and North America, 38% and 23%, respectively, followed by Central and Eastern Asia (9%) and Africa (6%) [24].
In 2022, the world copper mine production was 22 million tonnes [24]. The geographical distribution of copper reserves and the geopolitical stability of major producing countries significantly influence the global supply chain. Chile was the leader in mined copper production in 2021, with 26.8% of the global production. Peru, China, and the Democratic Republic of Congo followed Chile in mined copper production in 2021 with 10.5%, 8.6%, and 8.6%, respectively. The USA, Australia, and Canada produced 5.7%, 4%, and 2.6% of the global copper supply in 2021, respectively. The other significant producers are Zambia, Russia, Indonesia, and Mexico, which produced 15% of the global copper supply in 2021 [19]. The primary copper production by region was 39% in Latin America, 21% in Asia, 15% in Africa, 12% in North America, and 4% in Oceania in 2022 [24].
Technological advancements, geopolitical factors, and environmental considerations have influenced global copper production. Global copper consumption has experienced a more than threefold increase within the last five decades. The anticipated rise in copper demand, driven by emerging technologies and net-zero initiatives, necessitates a robust and environmentally conscious supply chain. Copper exploration and extraction projects are crucial to meet the anticipated future demand. The timeline for transitioning from copper exploration and initial deposit identification to production can be lengthy, often spanning several years or even decades, primarily due to the permitting processes involved. The lengthy permitting procedures pose a significant challenge in effectively increasing supply to meet sudden increases in demand. Incorporating environmental, social, and governance (ESG) factors, such as the social license to operate, in mining operations adds complexity to the sociotechnical framework of the copper supply chain [13]. Therefore, assessing low-carbon production options in copper mining activities is crucial to establishing efficient net-zero-carbon approaches in the mining sector.

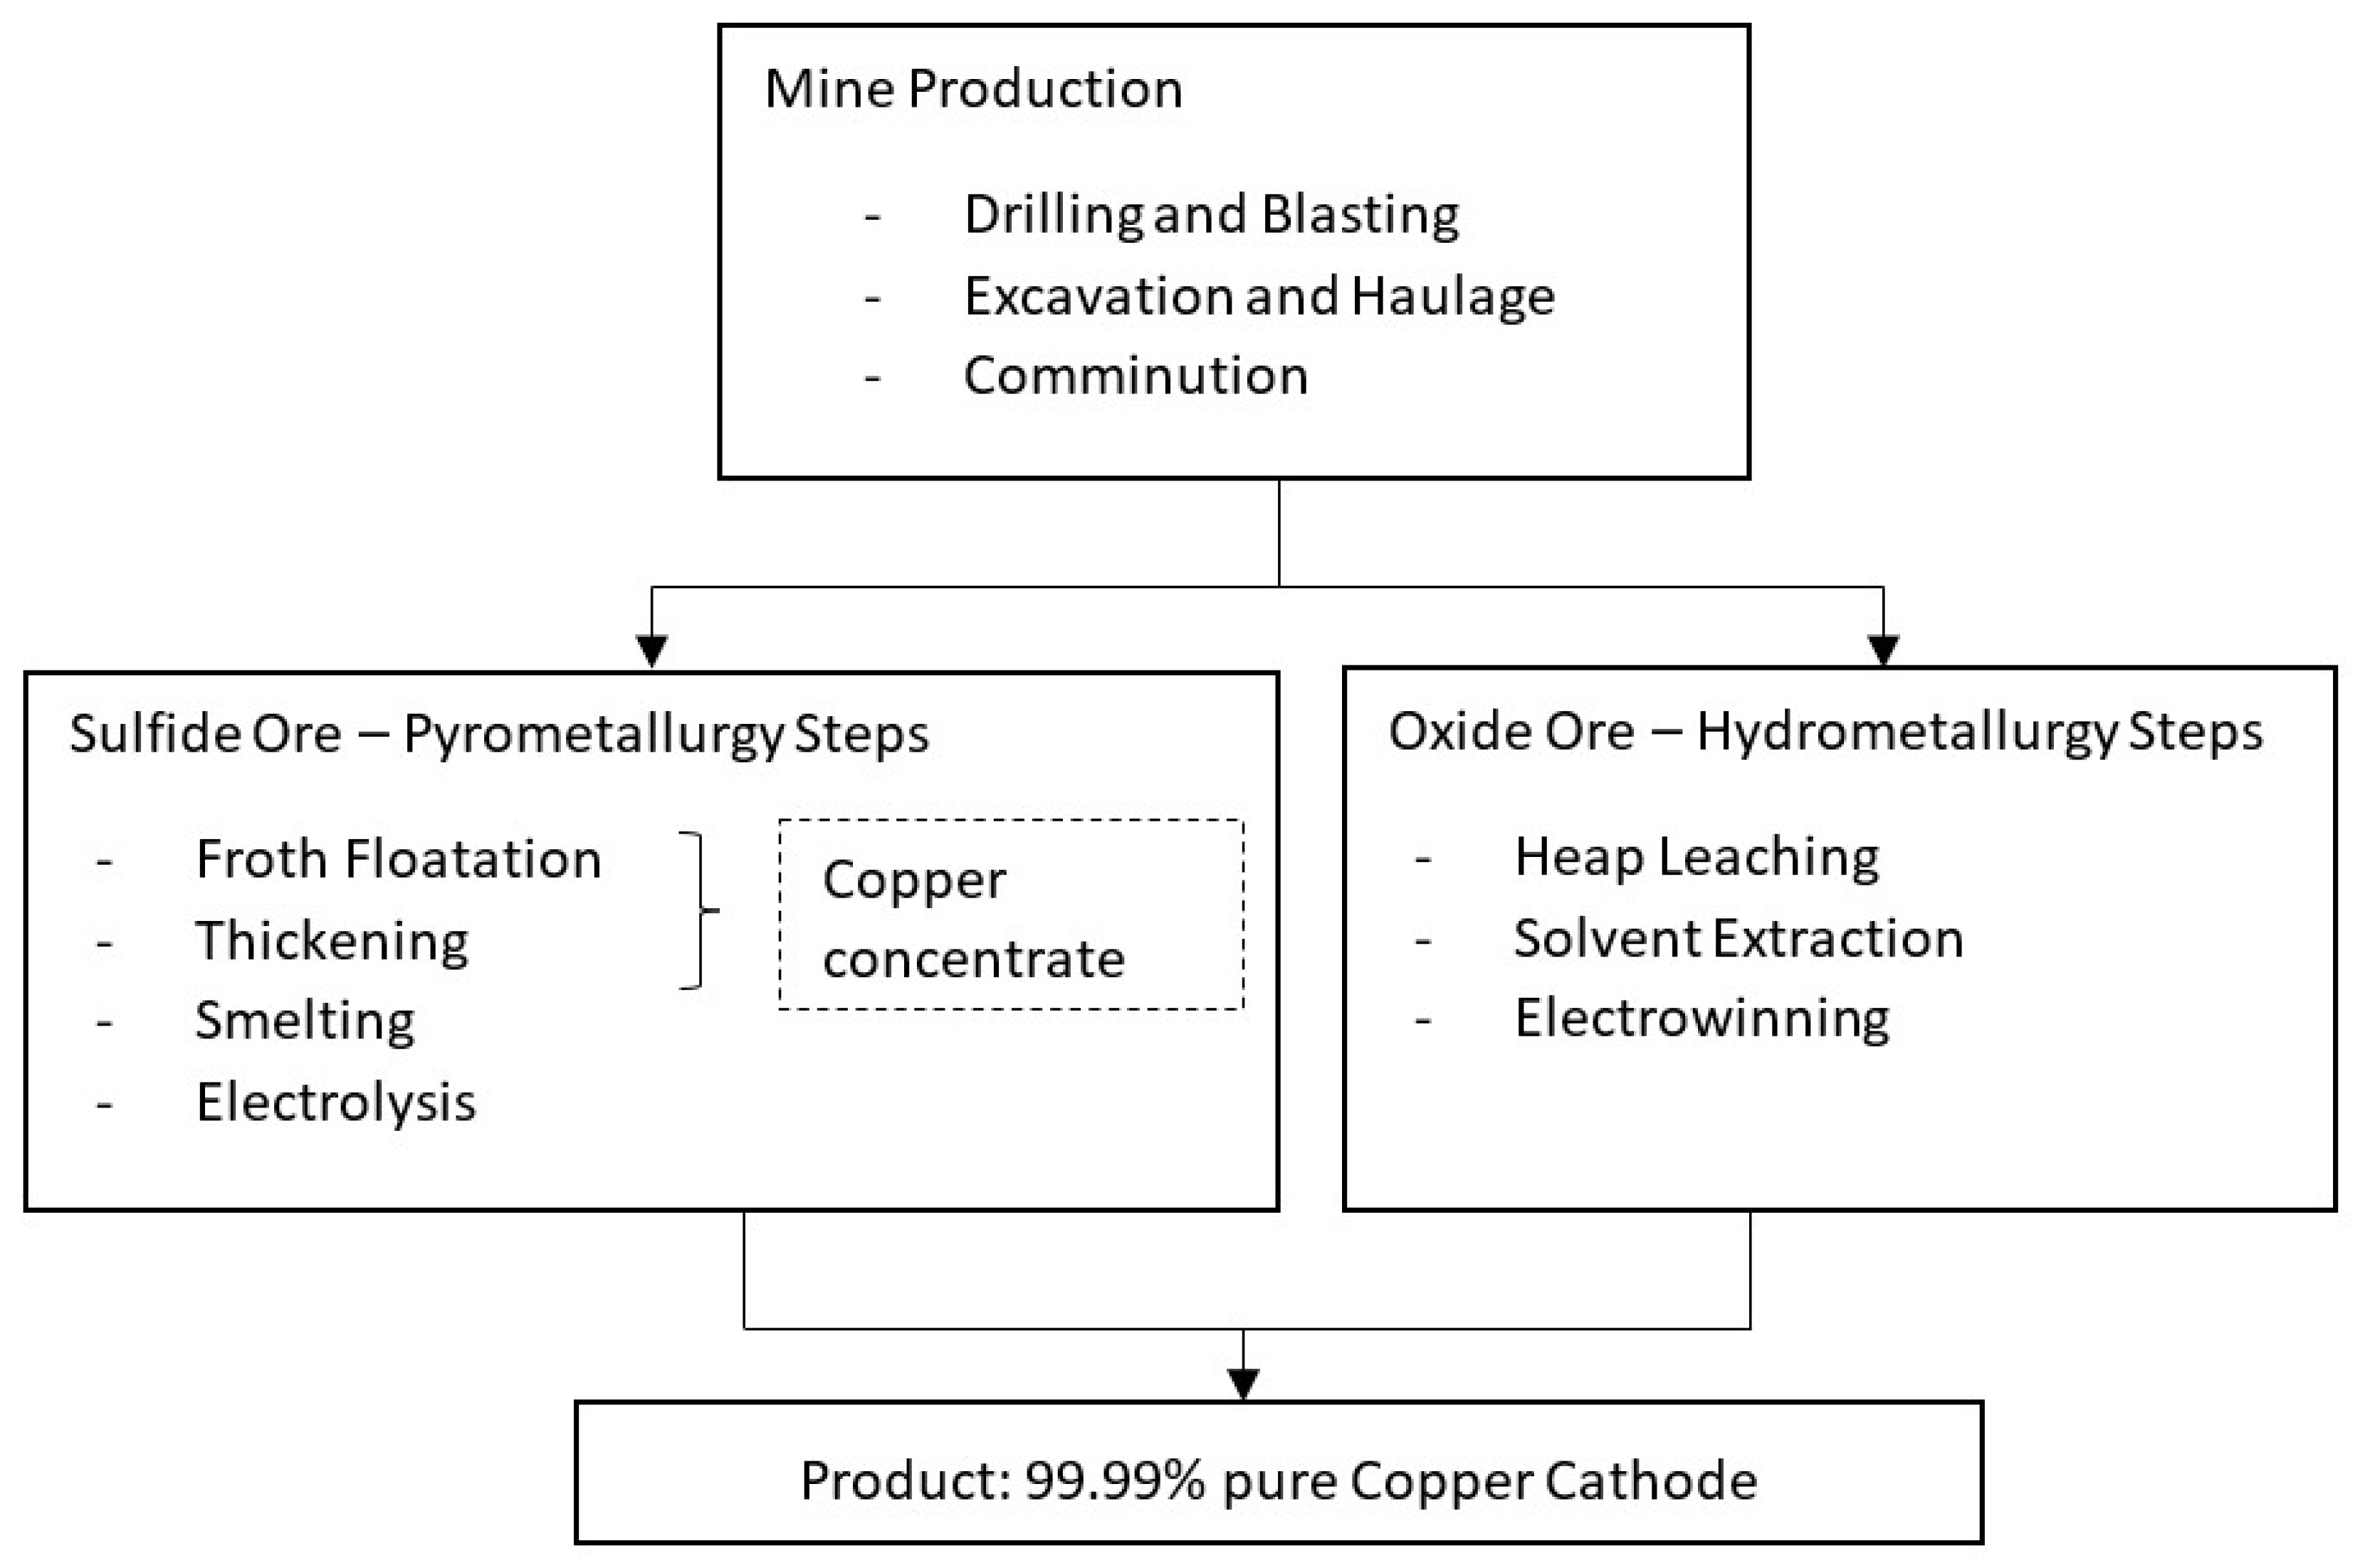
1.2. Surface Copper Mining and Beneficiation Systems

Open-pit mining is prevalent in current operational copper mines, while underground mining targets deeper deposits. In open-pit mining, major unit operations are drilling and blasting to fragment the ore and waste rock and excavating and hauling ore and waste from the pit to the processing facility and waste dump site, respectively. In current operations, ore material generally comprises a copper content ranging from 0.25% to 1%. To produce copper concentrate from the run-of-mine ore (ROM) with a copper content of 0.25% to 1%, complex, multi-step, and energy-intensive metallurgical processing steps must be followed, Figure 1. There are two distinct metallurgical pathways, namely beneficiation and the hydrometallurgical process, based on the nature of the ore, sulfide, or oxide ores [18].
The hydrometallurgical process of oxide ore involves crushing, grinding, leaching, solvent extraction, and stripping before electrowinning, Figure 1. Note that this process is also used for sulfide ores by using oxygen blow [18]. Utilizing the hydrometallurgical process is the primary method for extracting copper from oxide ores via heap leaching, solvent extraction to enrich leaching liquor, and electrowinning (SX-EW process). The sulfide ore beneficiation process is the most common in copper concentrate production today. In the beneficiation process, the sulfide ore undergoes crushing and grinding before entering a flotation process to yield a copper concentrate [18]. The stages involved in the production of copper cathode from ROM ore are given in Figure 1.
Copper concentrates typically have a copper grade of 20% to 40% that undergo a smelting process to produce matte, with a copper grade ranging from 50% to 70%. A further process of matte results in blister copper, which has 98.5–99.5% copper content. After the smelter process, the blister copper may be fire-refined as the traditional process route, or it is re-melted and cast into anodes for electro-refining to produce copper cathodes with a 99.99% copper grade [24].
A beneficiation process is used to produce 85% of row copper [25]. In 2008, 75% of the worldwide copper production was from surface mining [26], and this trend continues today [27]. As a result, this study considers the mining and beneficiation process systems of drilling, blasting, material handling, crushing, grinding, and flotation to produce copper concentrate. These systems are modeled using SDM.

1.3. System Dynamics Modeling (SDM)

System thinking allows one to unpack the complexity of systems in evaluating various alternatives [28]. SDM is about examining interrelationships via patterns of change based on historical information [28,29]. SDM is applied in various areas, such as climate impacts on artisanal and small-scale gold mining [30], societal impacts of landfill mining [31], and analysis of small-scale surface gold mining, where SDM is integrated with optimization modeling to assess the feasibility of major internal changes within the gold supply chain in Puno, Peru [32], environmental analysis and planning [11,33,34,35], analysis and simulation of complex systems and scenarios [36,37,38,39], the impact of policy alternatives [40,41,42,43,44], energy and GHG emission scenarios of cement industry [45], and emission reduction and resilience scenario analysis [44,45,46,47,48,49,50].
SDM is a powerful tool for analyzing and communicating the impacts of changing design and operational variables on GHGs over the project life cycle. SDM is also an effective method to objectively evaluate and communicate trade-offs and risks of project alternatives. It is quantitative and holistic and, hence, allows one to analyze project variables. It provides running systems under alternative scenarios based on technical, investor, stakeholder, and rightsholder perspectives. The application of SDM potentially improves management decision-making and helps mitigate unintentional corporate or governmental policy consequences of projects [41]. Thus, using SDM to screen and evaluate risks, benefits, and costs based on project-specific characteristics and limitations enhances the decision-making process and business practices, considering the low-risk appetite of the mining sector and investors.

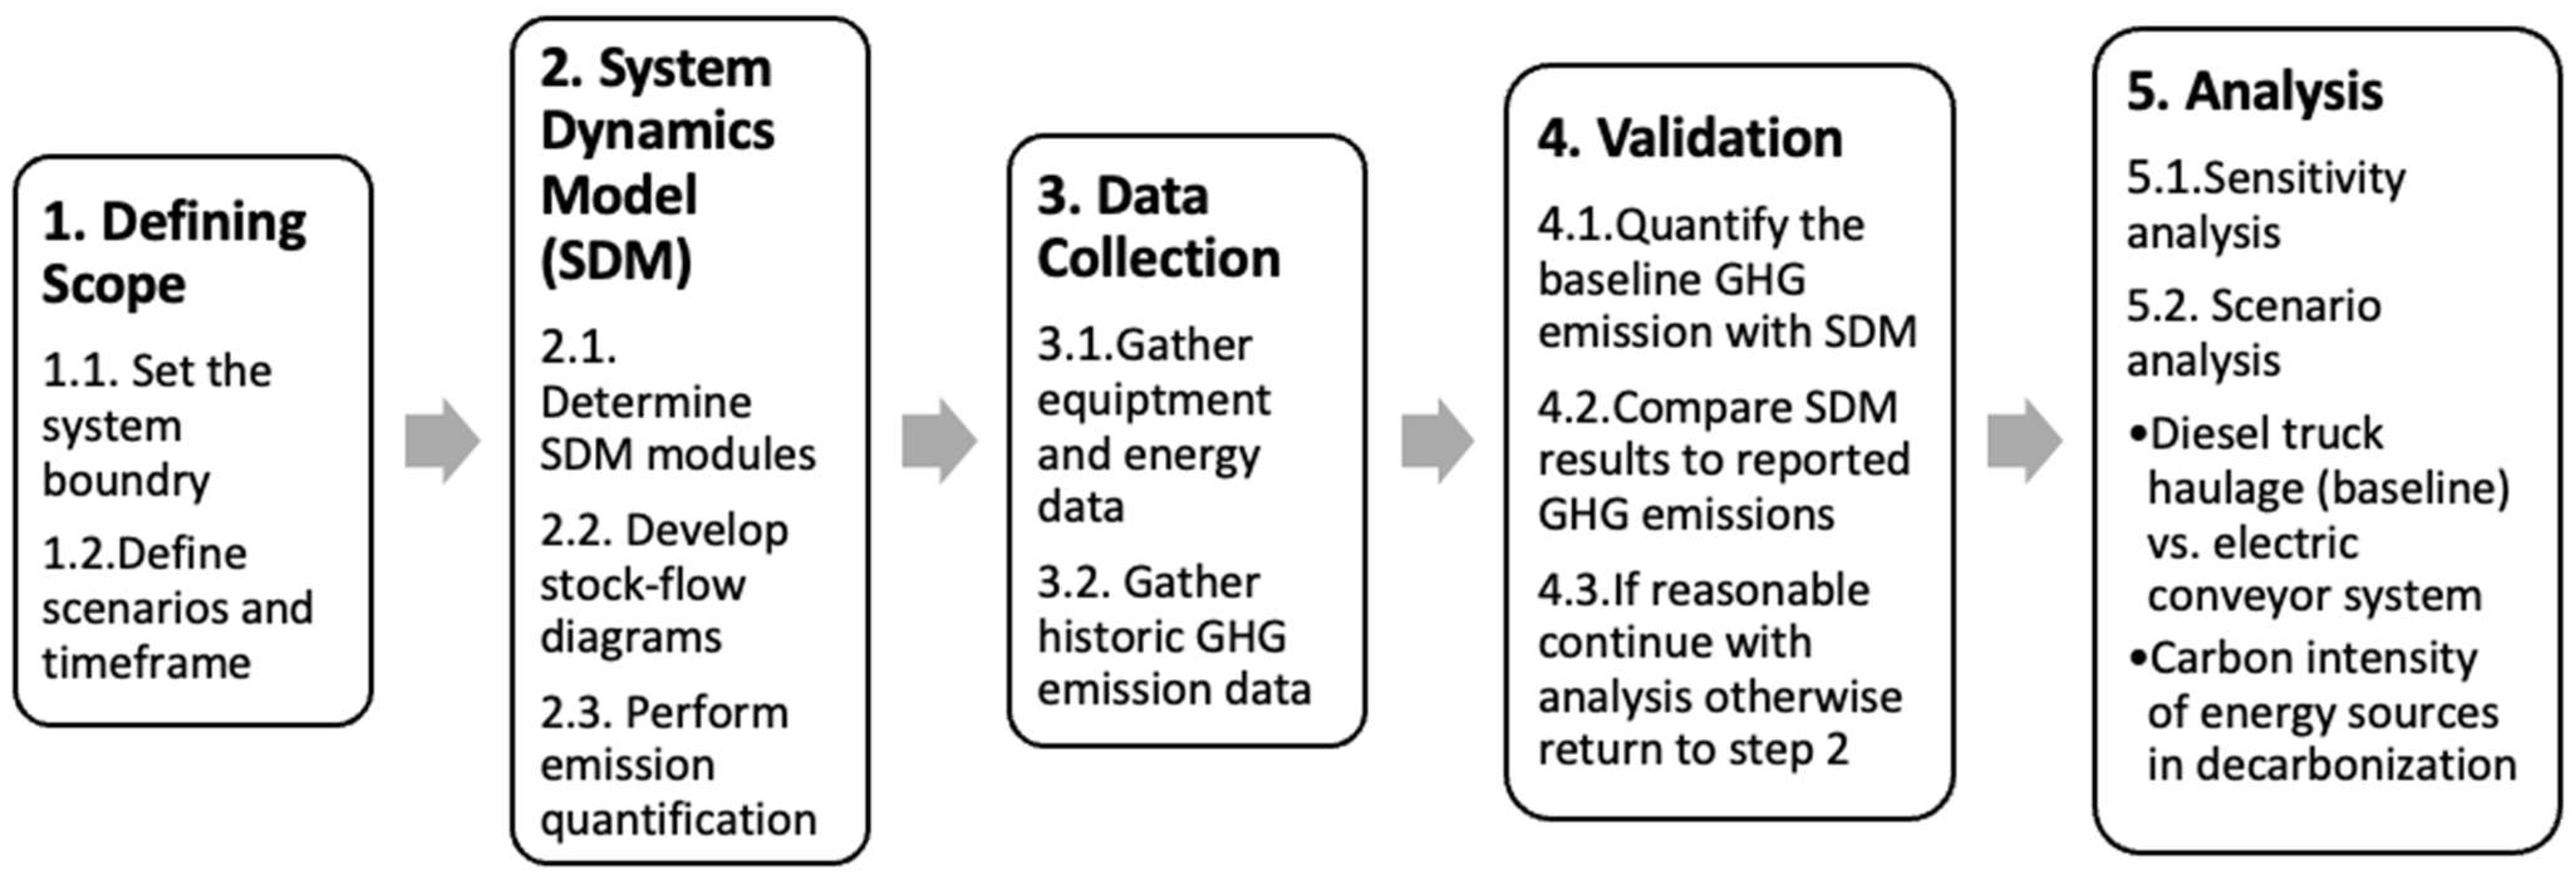
2. Materials and Methods

The study is based on systems thinking and follows the framework shown in Figure 2. The SDM is a method used to integrate systems thinking into analyzing scenarios within a defined system boundary and timeframe. The first step in the methodology is defining the scope, system boundary, scenarios, and timeframe Figure 2. As the SDM method is used to analyze complex systems, it is critical to set a clear system boundary with the causal-loop diagrams that allow analyzing scenarios [50,51]. This paper aims to evaluate the decarbonization potential of an open-pit copper mine concerning CO2e emissions and costs in mine production and processes. The system boundary is the production and mineral processing steps in an open-pit copper mine, described in more detail in Section 3.2. The second step in Figure 2 is developing SDM, starting with determining the modules. Modules are sub-systems that study a complex system using smaller, more manageable components. In this study, these subsystems are grouped based on the type of operations described in Section 3.2. Stock-flow diagrams are the main component of SDM, and they are developed based on the SDM modules and the defined scope and scenarios. These diagrams and details of the SDM are given in Section 3.2.
Measuring the GHG emissions is necessary to compare the GHG emission reduction performance of variables quantitatively. Different emission calculation methods are used to measure GHG emissions depending on the objective and data availability. The tier 1 method is a top-down approach that is preferred if the analysis details are not critical and detailed data are limited. The tier 3 method is a bottom-up approach and can be applied effectively when detailed data, processes, and equipment are accessible with limited assumptions [4]. A hybrid approach, a combination of bottom-up and top-down approaches, is used in this paper, described in Section 3.3.
Data gathering is the third step, Figure 2, and it involves collecting data used for quantifying emissions and energy consumption data of the equipment and systems compared in SDM. The data used in the analyses are obtained from publicly available sources, such as manufacturer specifications and mining companies’ technical reports (NI43-101) via desktop research. However, due to operational and processing characteristic differences, the authors considered typical surface mining fundamentals to deliver the study’s objective within the defined system boundary and scope. The data of the mining operation and gathered data are summarized in Section 3.3.
Validation of the SDM is the fourth step in Figure 2. Validation of the model for a real mining operation can be done by calculating the CO2e emissions for available data in a given year as the baseline. The calculated baseline is compared to the reported emission of the mine in their sustainability/ESG reports. The best approach to validating the SDM is comparing the calculated baseline with the reported actual emissions. In this study, as the data belongs to a hypothetical open-pit copper mine representing a typical open-pit copper mine, the model is validated by reviewing the process plant emissions and using open-source data of other open-pit copper mines with similar overall production and process types.
The last step of the framework is analysis, where several scenarios are performed after a sensitivity analysis, considering variable emission factors. The scenarios include the effect of emission factor change on total CO2 emissions and costs for 12 years of life-of-mine and using electric equipment in the haulage system.

3. Implementation of the Methodology to an Open-Pit Copper Mining Operation

This section explains each step of the proposed methodology for an open-pit copper mining operation.

3.1. Defining Scope

The system boundary of SDM in this study, as shown in Figure 3, involves fragmentation, including drilling and blasting, and haulage as the mining unit operations, comminution, enrichment, and output as main beneficiation processing stages developed for both the baseline and the electrification case. The haulage module in the baseline case includes diesel truck haulage of the waste and ore material from the pit to the mineral processing stages. The haulage module electrification case involves diesel truck haulage of the material (ore and waste) from the production bench to the pit exit and hauling the waste material with an electric overland conveyor system to the waste dump site.
The hypothetical open-pit copper mine uses data from openly accessible projects and exhibits data from an actual, operating open-pit copper mine. It is also assumed that the mine is in Canada. The description of the mine and its operational characteristics are given in Section 3.3.

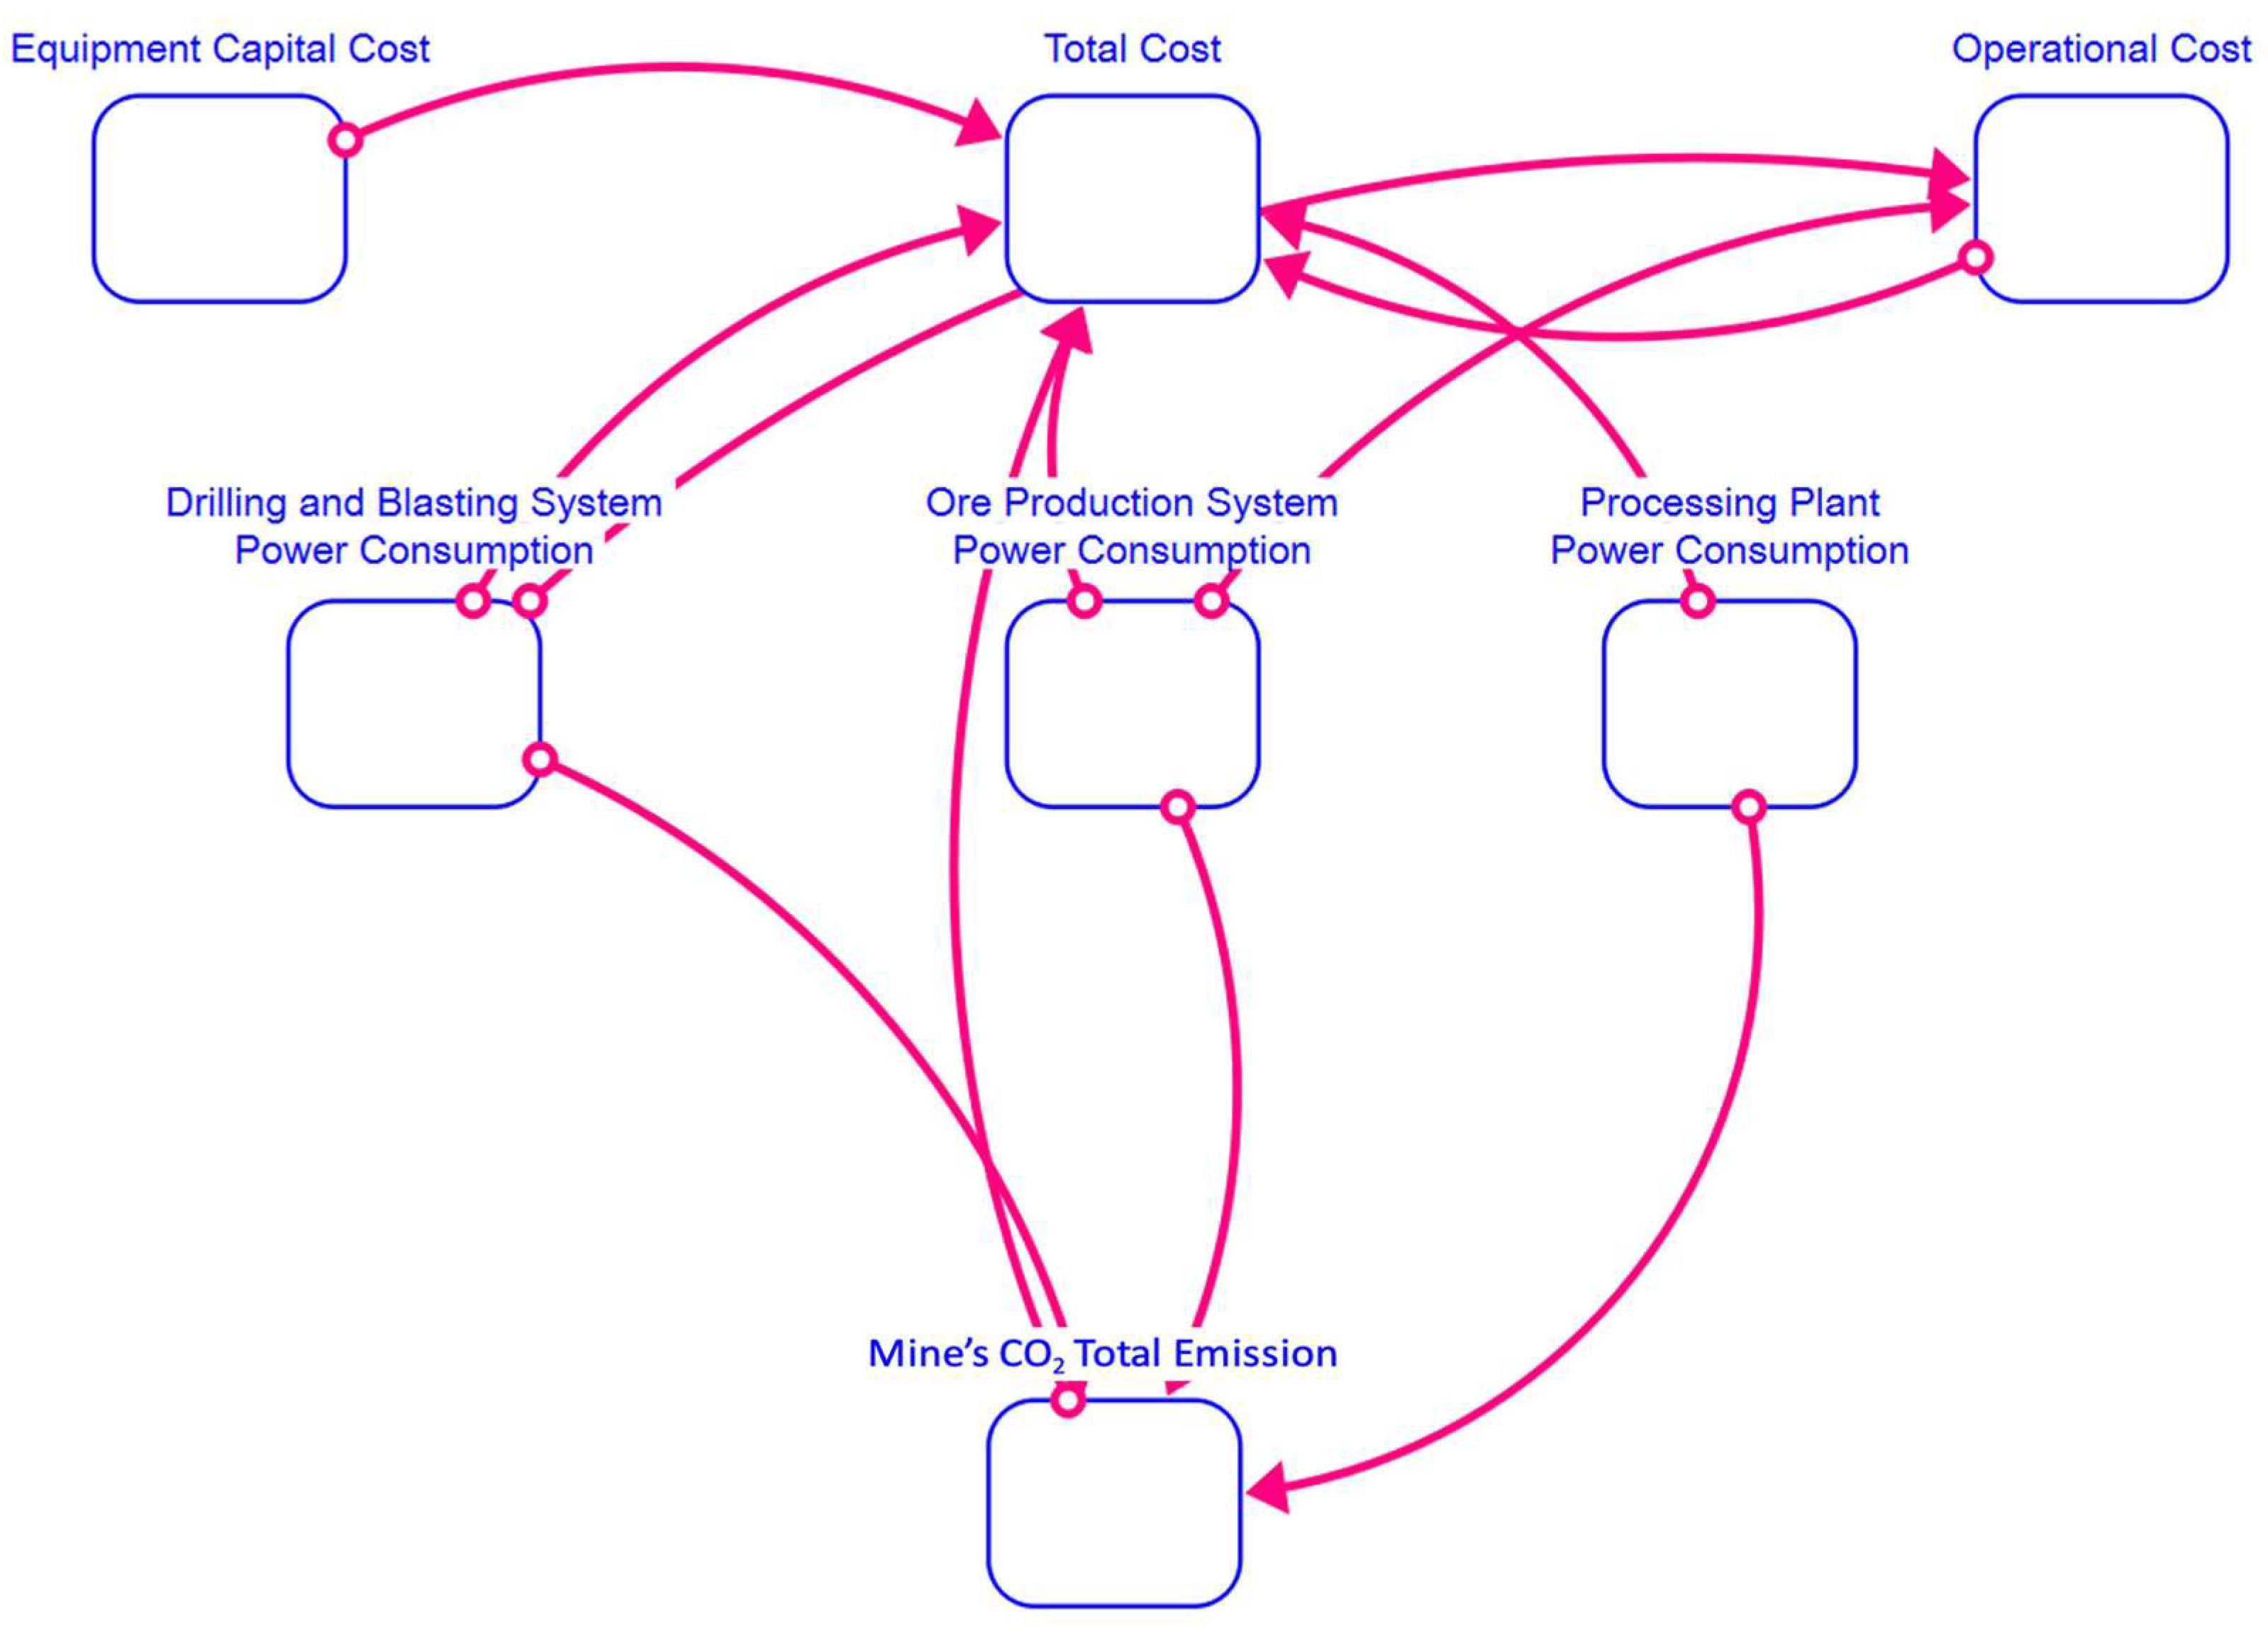
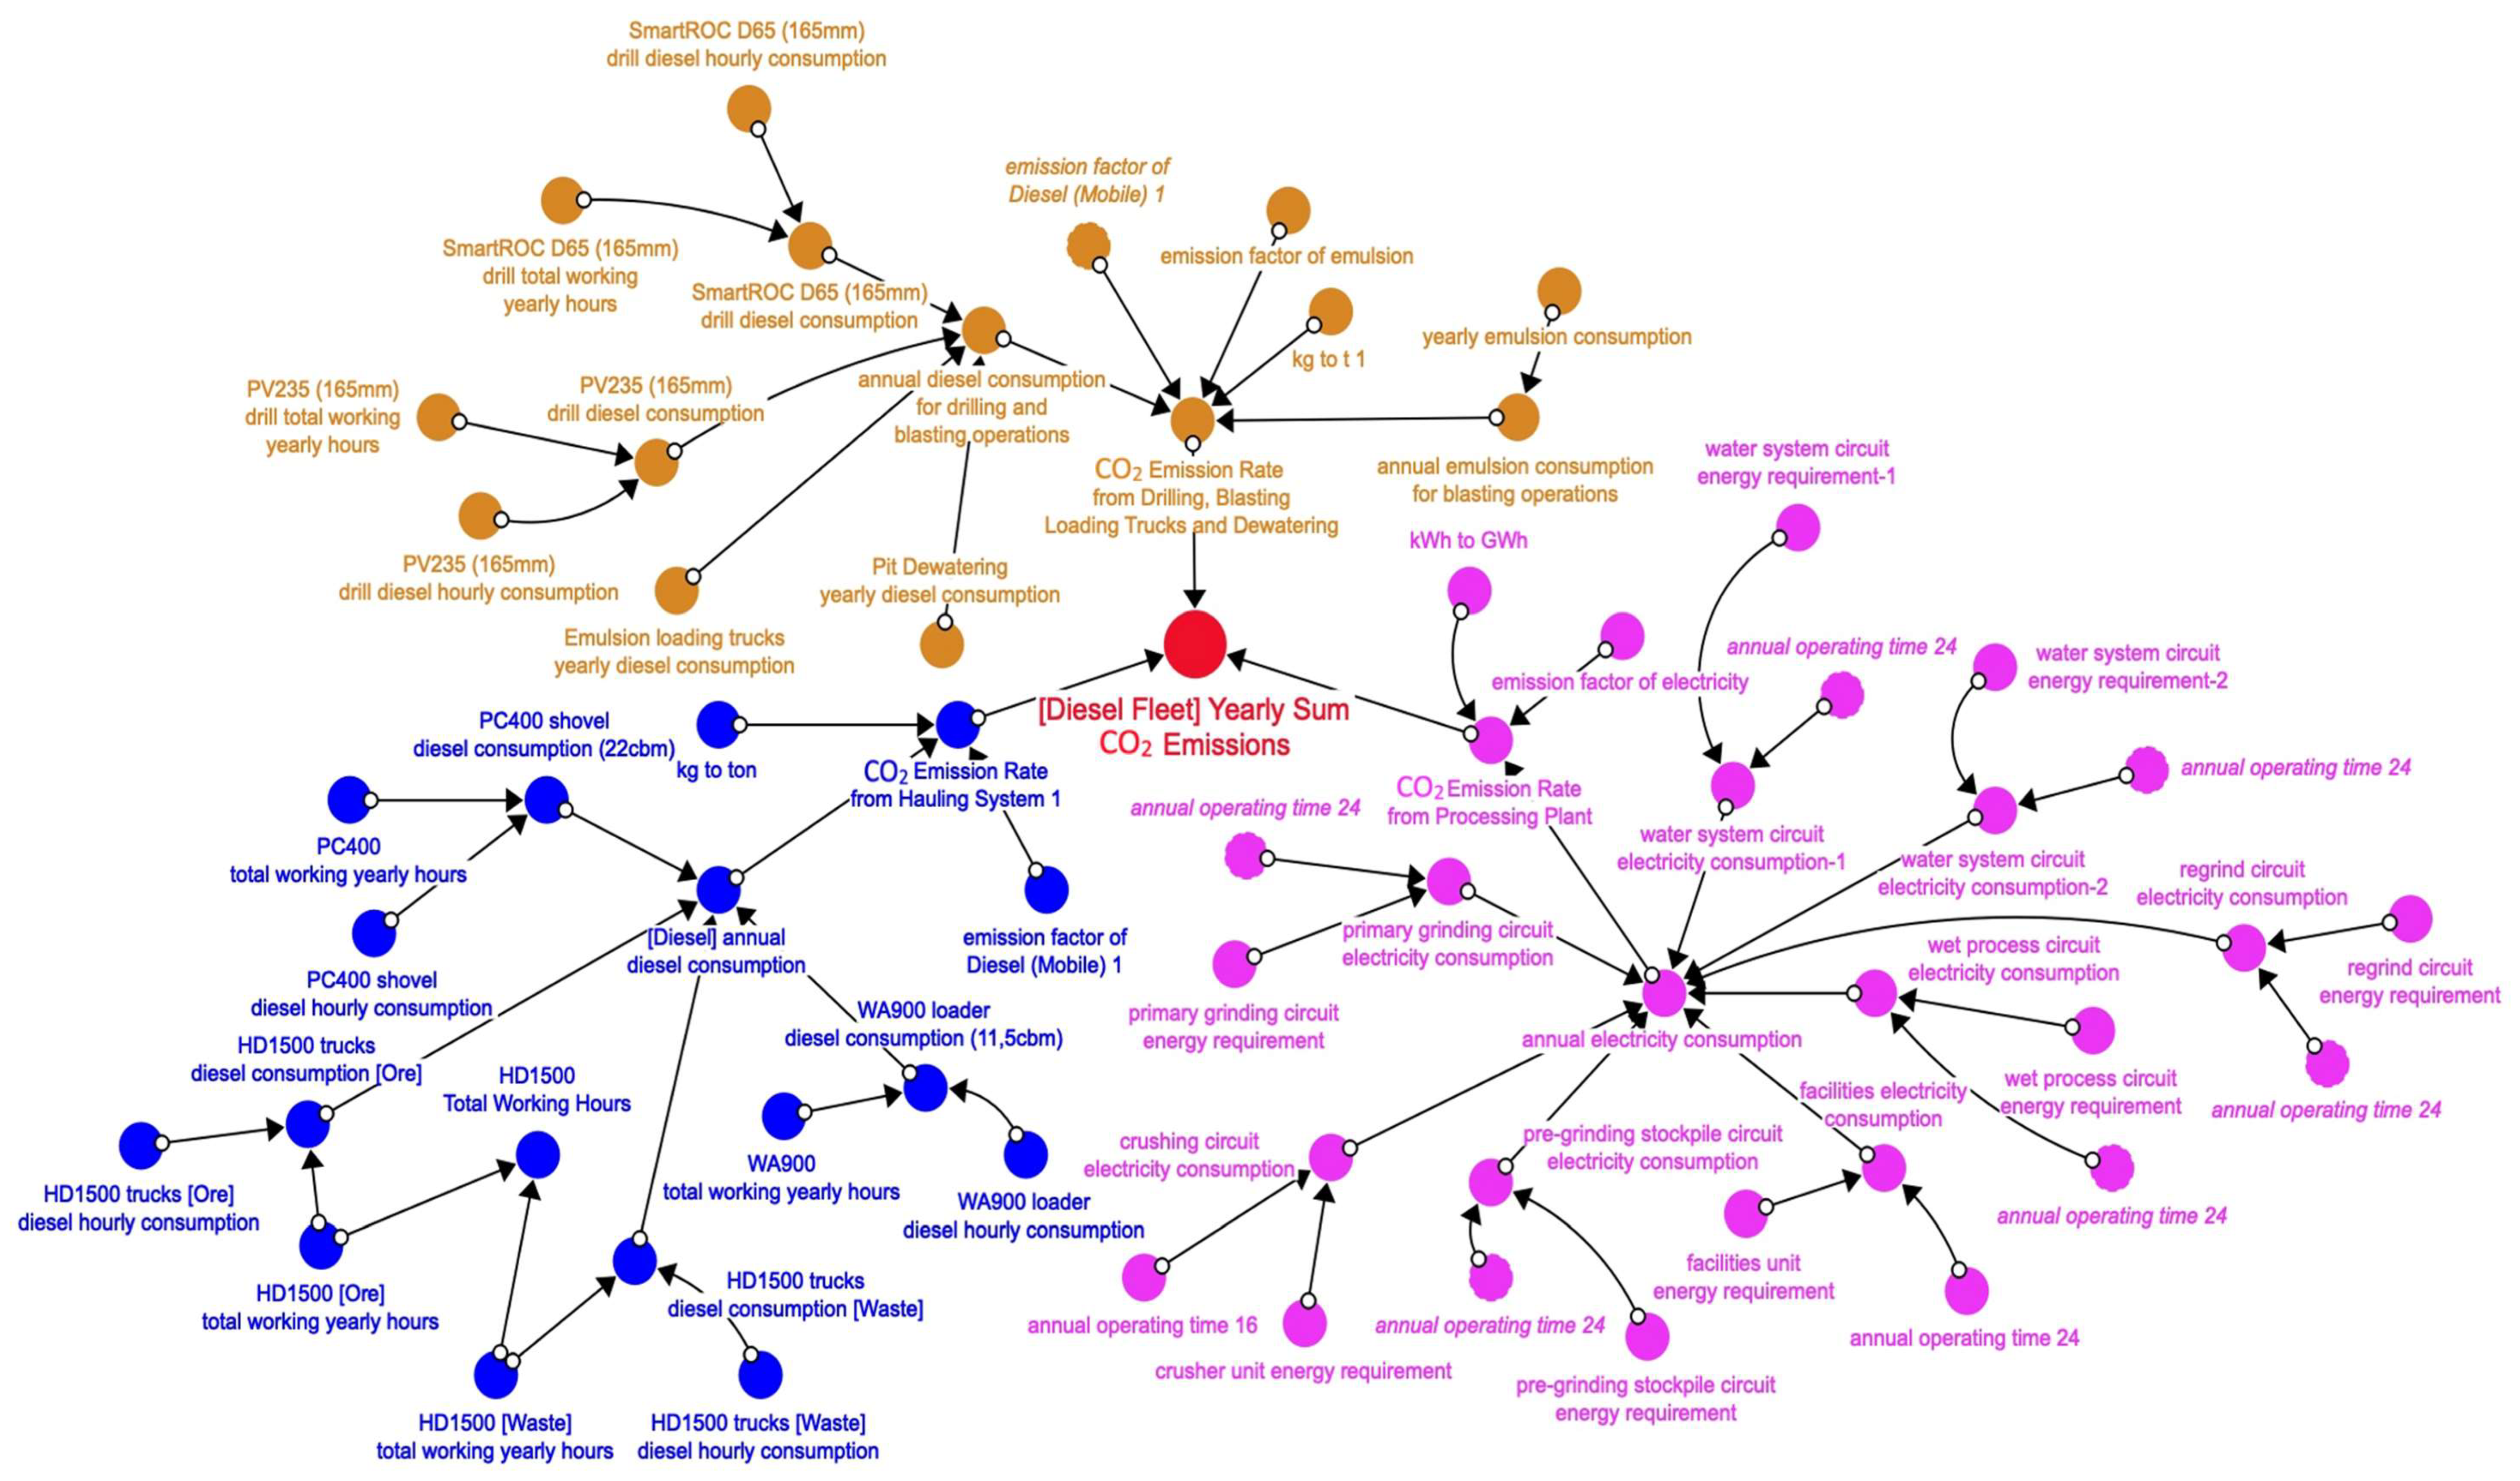
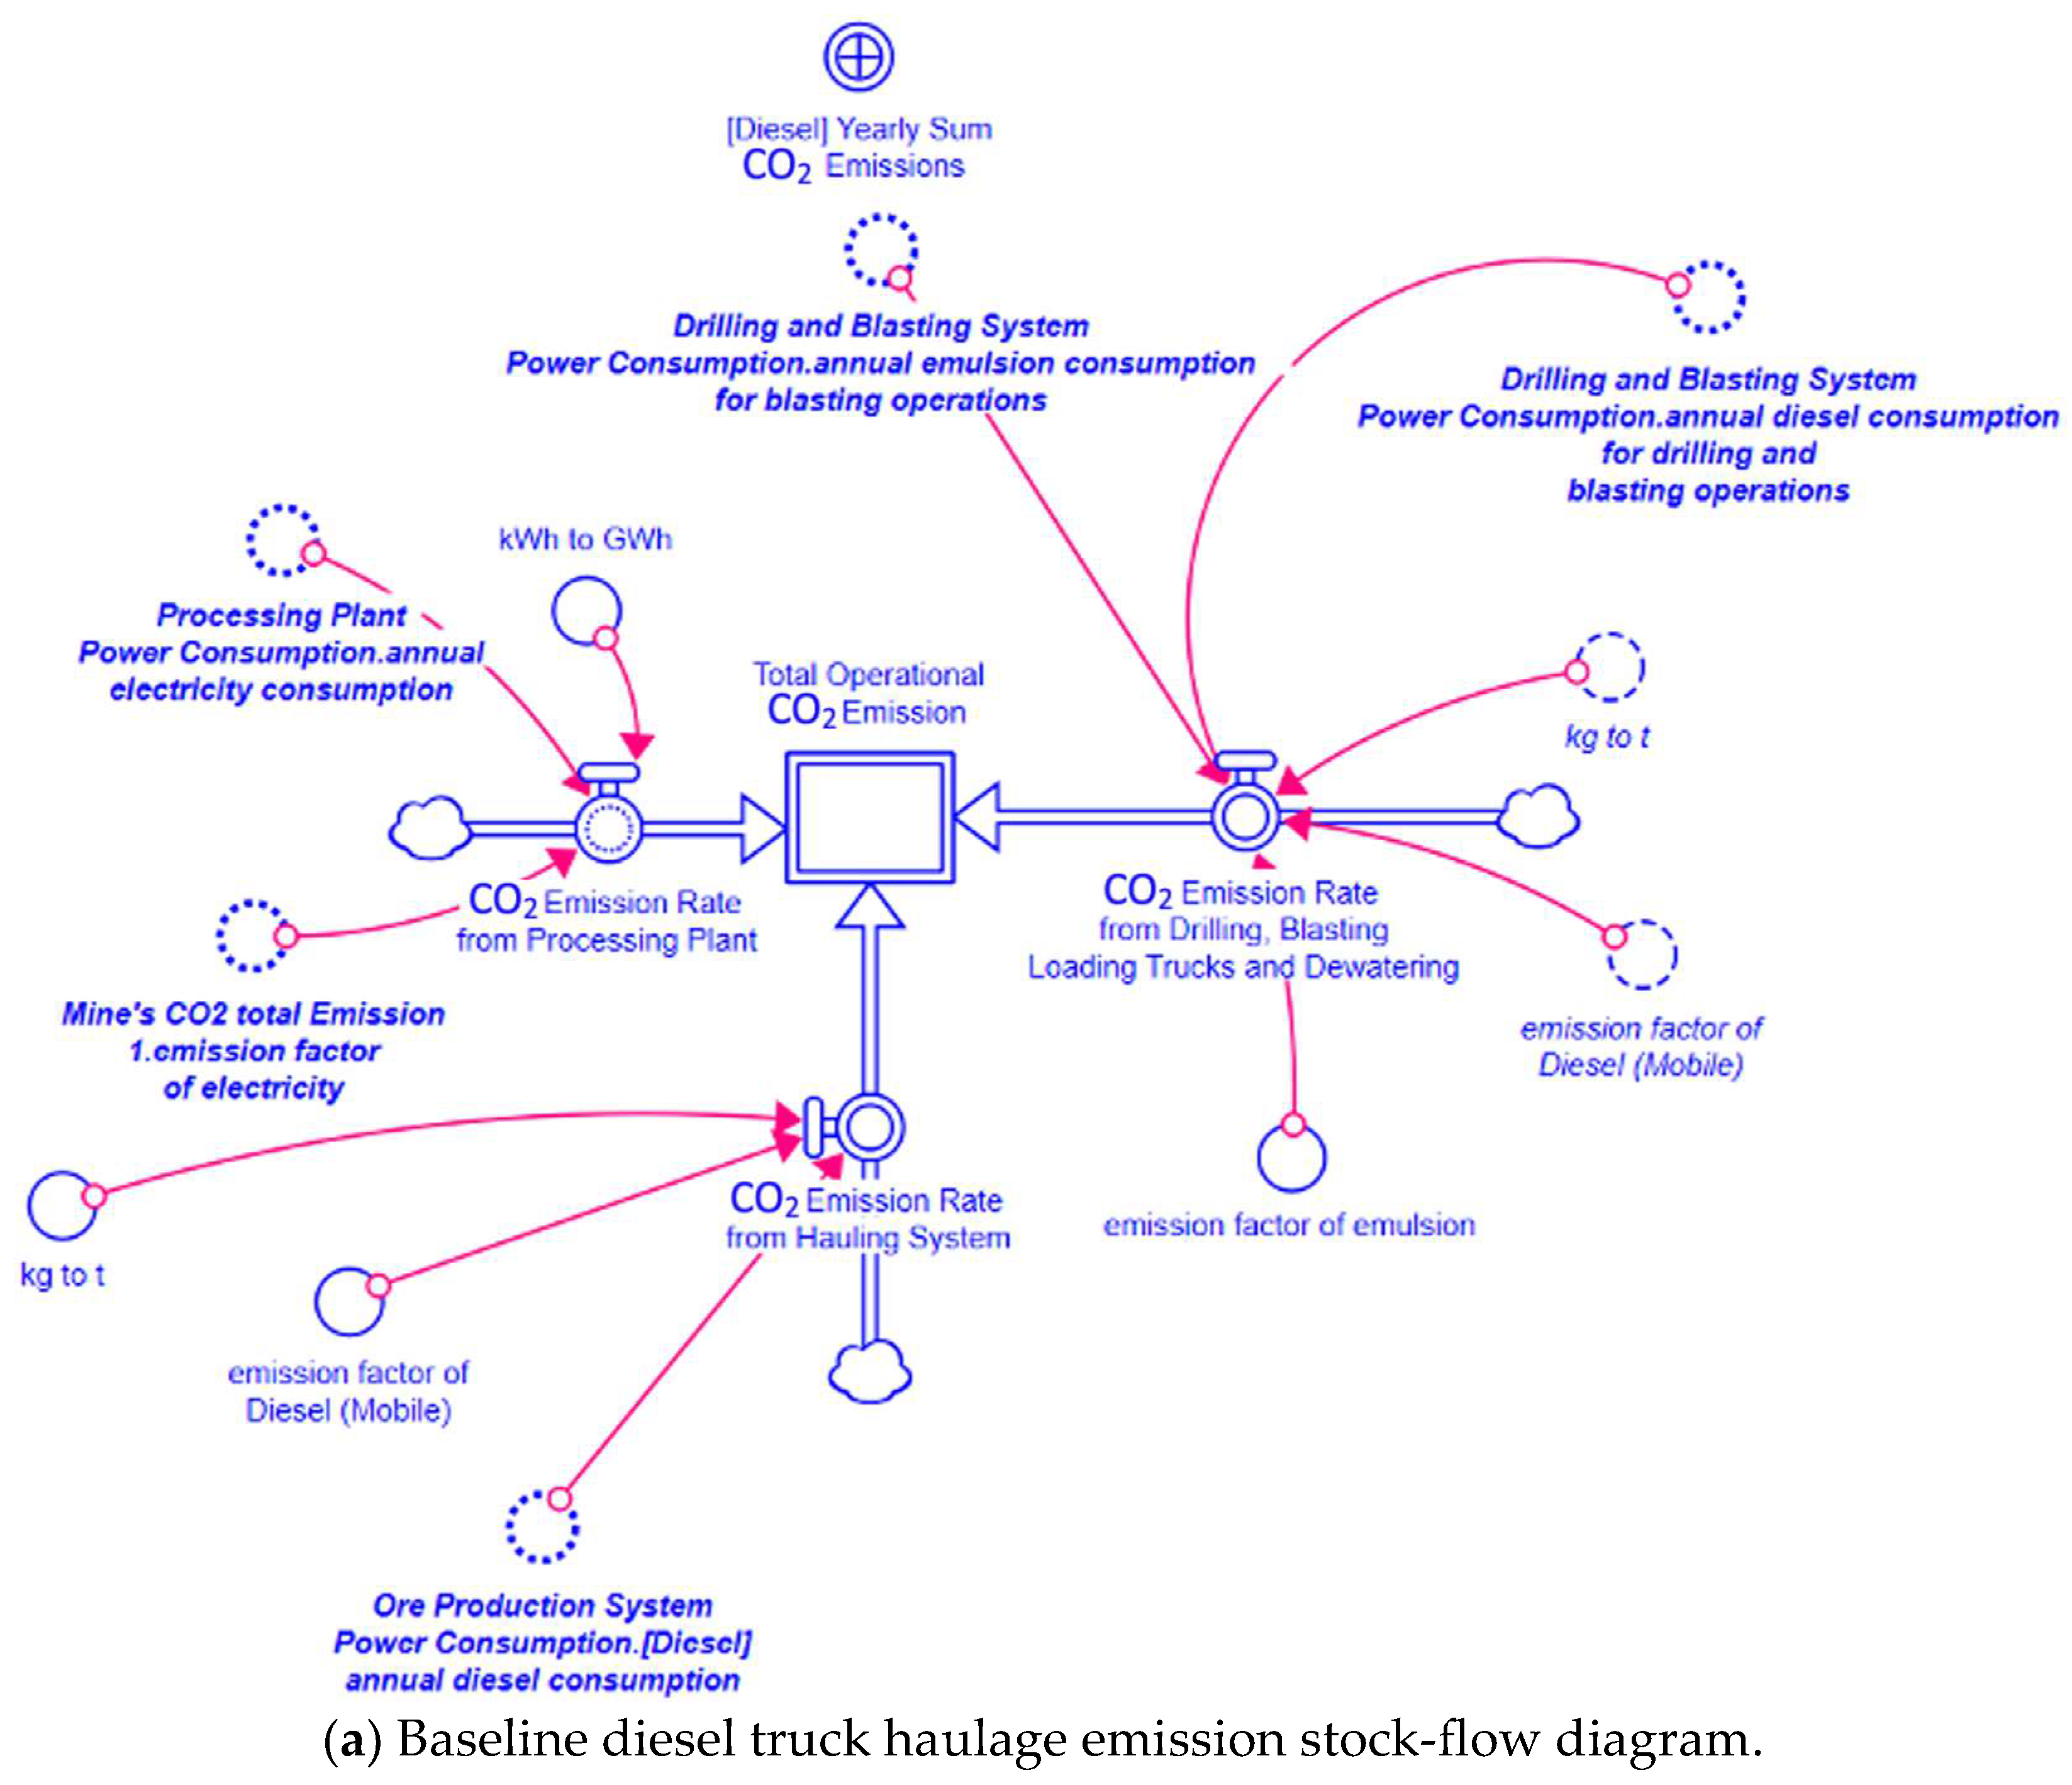
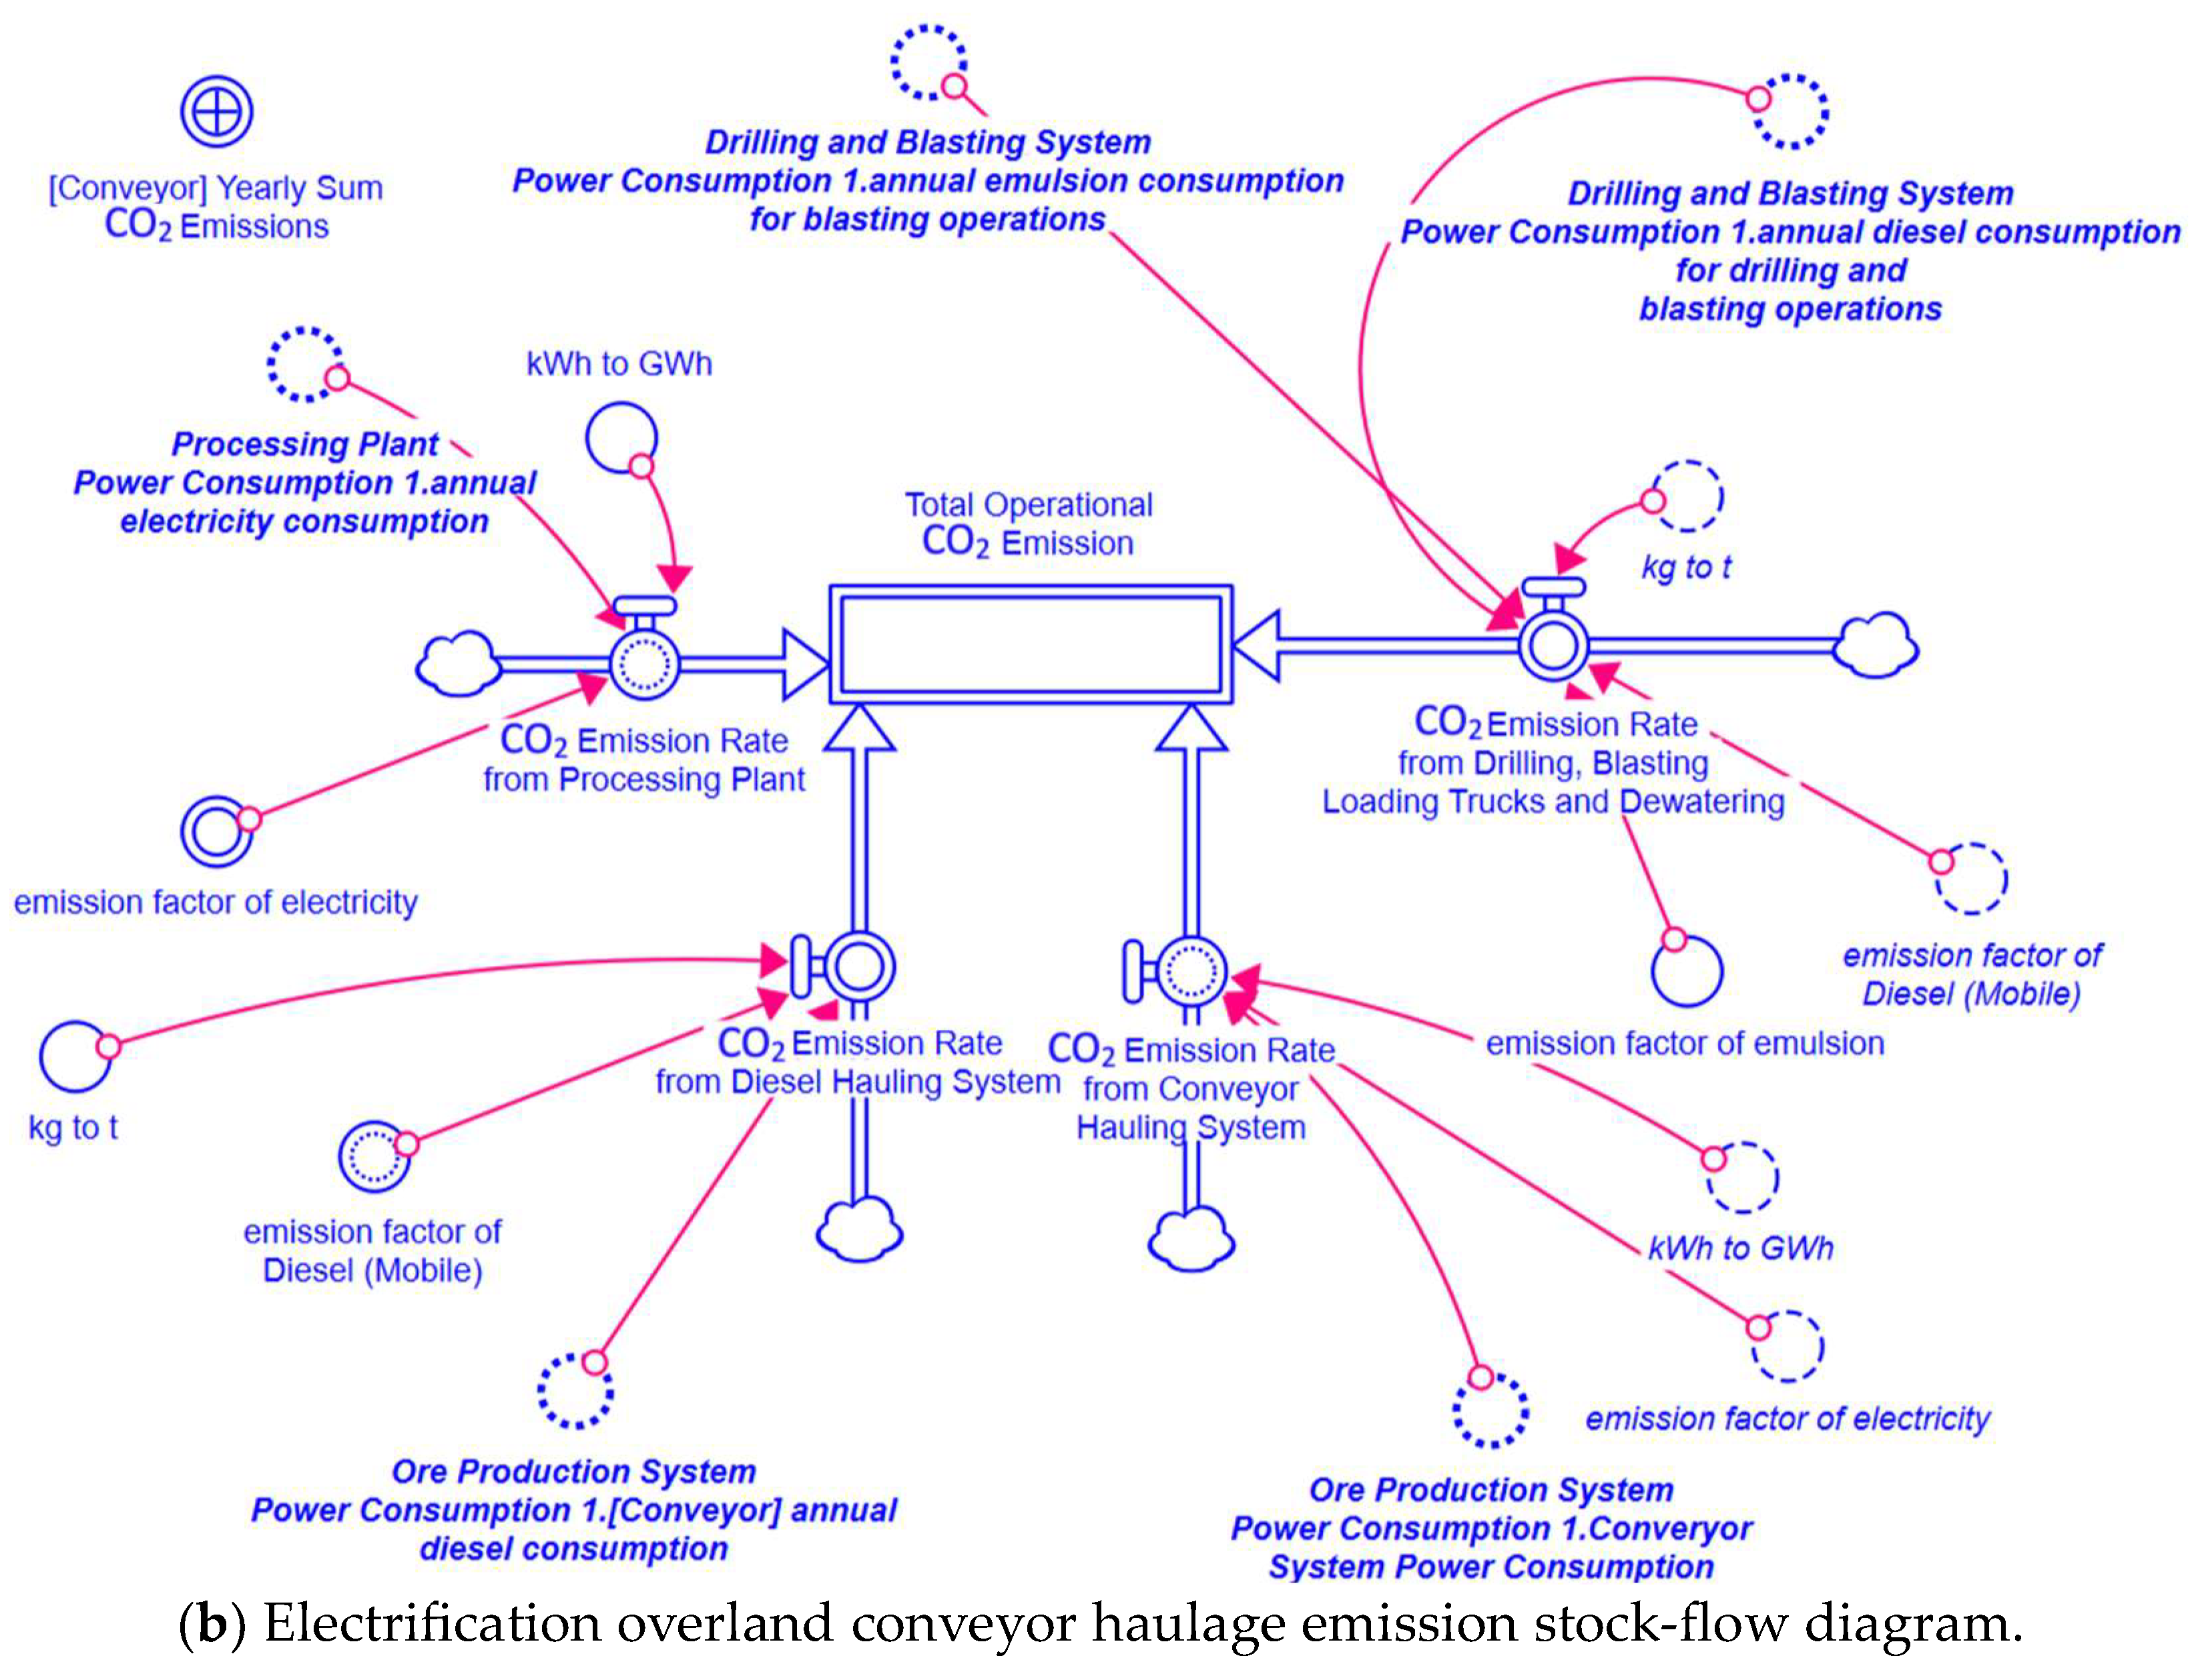
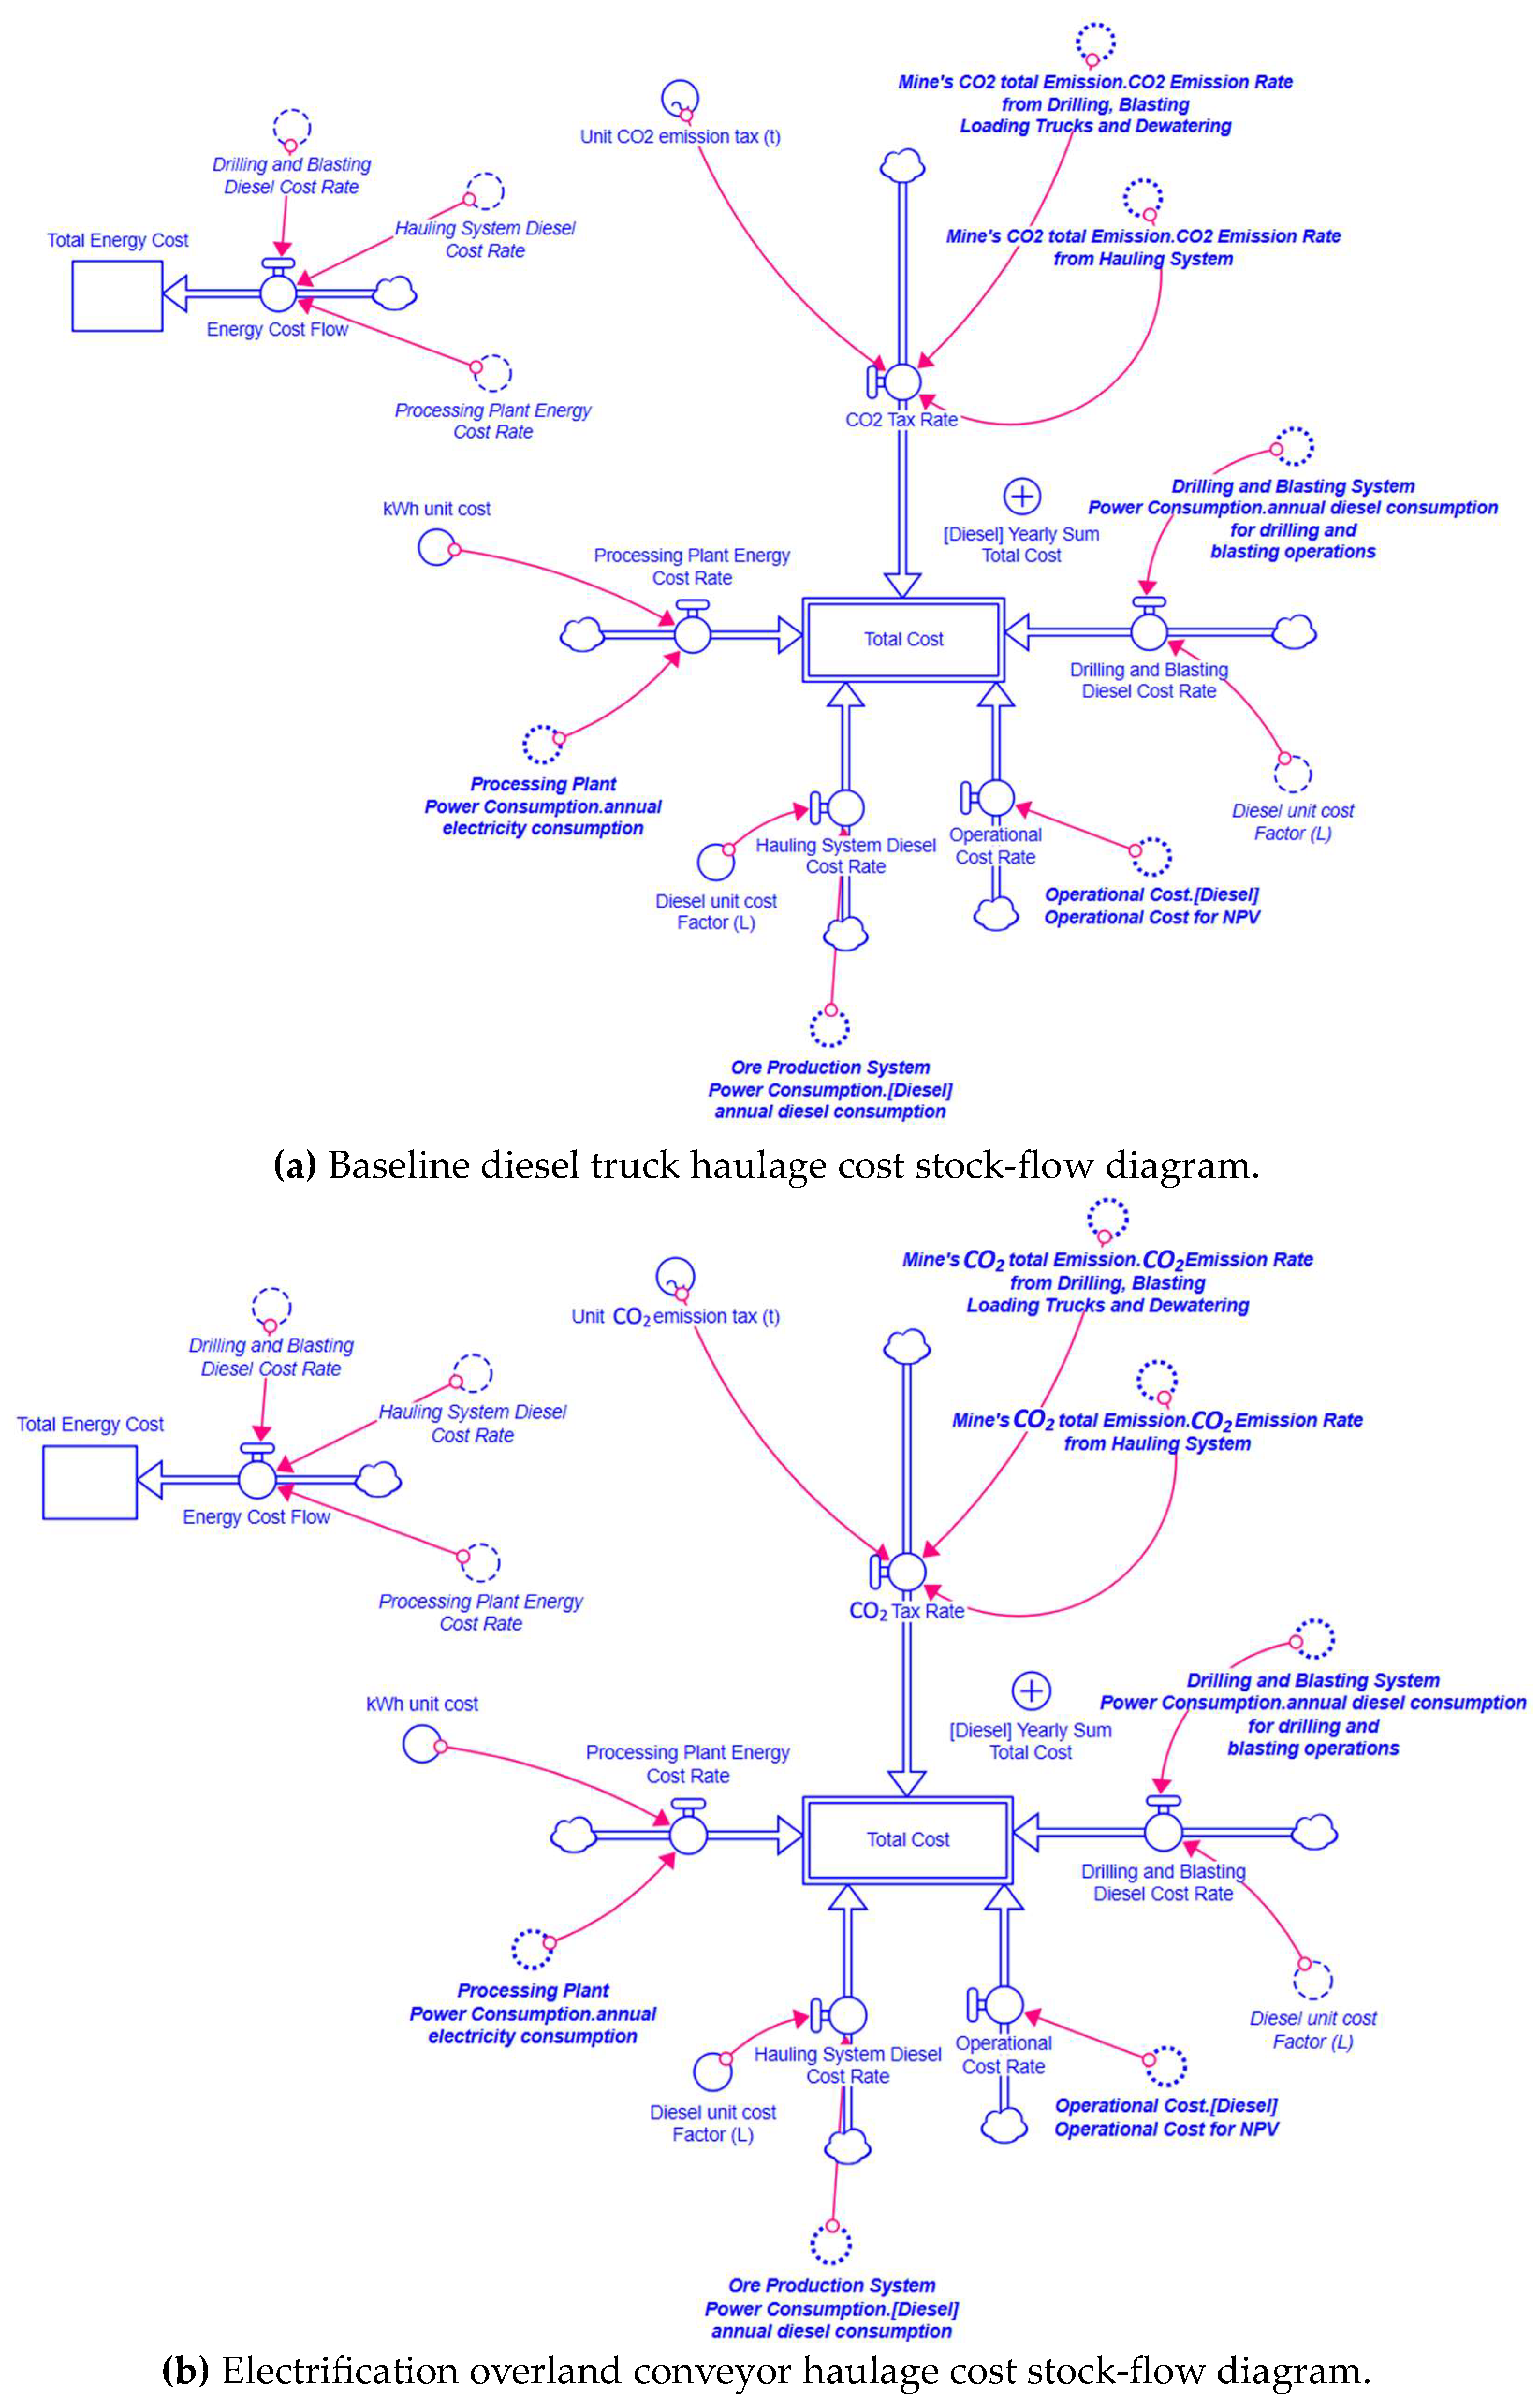
3.2. System Dynamics Model (SDM)

The SDM modules for both cases are shown in Figure 4. Note that the SD model represented in Figure 4 is a representation for both the baseline and electrification scenarios. The SDM compares the baseline with the electrification case regarding CO2e emissions and the Net Present Value (NPV). It considers all power consumption based on fuel type, electricity and diesel, operating hours, capital cost, operational cost, and carbon tax, Figure 4. As the mine is assumed to be in Canada, the Canadian carbon tax is used in the cost calculations.
The same equipment for fragmentation and beneficiation process stages is used for both cases. The haulage module in Figure 4 involves excavation and hauling equipment for transporting ore and waste material from the pit to the crusher and the waste dump site, respectively. This module has stock-flow diagrams in the model for the diesel truck haulage (baseline case) and conveyor haulage of waste material (electrification case).
The beneficiation process stages module in Figure 4 covers the crushing and grinding circuits and copper concentrate enrichment, including the wet process, flotation, thickening, filtration, and pumping of tailings to the tailing facility and production of copper concentrate for both cases.
Figure 5 presents the aggregation of annual CO2e emissions for the baseline case. It includes all emissions from all modules, including fragmentation (drilling and blasting), production (loading, hauling), and processing (comminution and recovery).
As Figure 5 shows, the model covers different CO2e emissions sources. The orange and blue color codes represent mining operations, while the pink color indicates mineral processing operations.
The orange color code represents the contributors to CO2e emissions for mining activities such as drilling, blasting, and dewatering. This model sub-system calculates emissions from drills, blasting agent loaders, and dewatering pumps. The blue color code represents the contributors to CO2e emissions for the hauling system. This model sub-system calculates the CO2e emissions from the equipment used in material handling: haulage trucks, shovels, and loaders. The pink color code shows the contributors to CO2e emissions from the mineral processing operations, from crushing and grinding to the concentrate as a final product. This model sub-system calculates the emission from the electricity consumption of the crushing plant and the mill. The CO2e emission of each unit in the sub-systems is separately calculated and summed to obtain the annual CO2e emissions of the entire system (represented by the red node), Figure 5.
The model represented in Figure 5 is also used in the electrification case after modifying the material handling part (blue color) by adding the electrical conveyor system for waste transportation. To show the differences between the two cases (baseline and electrification), we include the stock-flow diagrams for both the CO2e emission (Figure 6) and total cost (Figure 7) calculations. In the stock-flow diagrams, the box shapes represent stocks, the double-lined arrows represent flows, and the single-lined arrows represent the connection to converters. The converters (parameters or variables) are represented as solid and dashed circles. The solid circles represent parameters and variables that exist in the shown sub-system, whereas the dashed circles represent parameters and variables that are ghosted from another sub-system and used in the shown system.
The utilization of diesel equipment in mine production is the industry standard. Therefore, the baseline scenario in this study is using diesel trucks to haul ore and waste material. Figure 6 includes the total operational CO2e emission calculation SDMs for both the baseline diesel haulage (Figure 6a) and the electrification overland conveyor (Figure 6b) systems. Therefore, the difference between the baseline and electrification cases for the CO2e emission calculation SDMs is the addition of the conveyor hauling system flow to the model. The electrification scenario in this study is the utilization of an overland conveyor for waste material haulage instead of diesel trucks. This includes hauling ore from the pit to the crusher, hauling waste from the pit to the conveyor loading station with 150-tonne trucks, and hauling waste from the loading station in the vicinity of the pit exit ramp to the waste dump site with a 5000-m conveyor system.
Figure 7 includes stock-flow diagrams of the costs of all equipment and associated activity costs for both the baseline diesel haulage (Figure 7a) and the electrification overland conveyor (Figure 7b) systems, including capital and operational costs (OPEX and CAPEX). The operational costs include energy and non-energy costs, e.g., maintenance, and carbon tax for diesel consumption. Therefore, the difference between the baseline and electrification cases for the total cost calculation is the addition of the conveyor energy and operational cost flows.
The following haulage characteristics within the system boundary are used in SDM:
  • As the baseline case, the diesel truck haulage activity is modeled based on in-pit and ex-pit activities. The open-pit development starts with the movement of overburden material closer to the waste dump site, and the travel distance and average grade of the haulage roads will increase as the pit gets deeper. In this regard, the average haulage distance is assumed to be 1000 m at the beginning of the project, and it is increased by 10% annually over LOM in the model. The assumption is used for ore and waste haulage activity within the pit in the model.
  • The ex-pit distance for ore and waste haulage is different. The ex-pit haulage distance of ore material is kept constant as the pit exit location and process plant location, specifically the crusher, will be the same during LOM. The ex-pit ore haulage is assumed to be 1500 m during LOM. However, the ex-pit waste material haulage distance is assumed to be 4000 m from the exit of the pit to the waste dump site, and a 5% increase in distance due to the high change of the waste dump site is included for the baseline calculations.
  • The in-pit haulage activities are kept the same for the electrification case as the baseline diesel truck case. The ex-pit distance of the conveyor haulage is assumed to be 5000 m to reflect the system’s cost and energy consumption due to inflexible route selection requirements and extension needs as the waste stockpile area extends over time. The conveyor’s capacity is calculated to deliver the work required at the mine’s peak production years.
The emission quantification is the last stage of the SDM step, Figure 2. The quantification of CO2e emissions in this study is conducted using Equation (1). Aggregated emissions from each fuel type are used for comparison. The variables in Equation (1). are listed in Table 1.
E C O 2 = A D i × E F i c f

3.3. Data Collection

Data collection is the third step in the methodology given in Figure 2. The data for SDM in this study were gathered from publicly accessible sources, including equipment specifications and NI43-101 reports of open-pit copper mines. Additionally, some of the operational aspects of these projects have been anonymized. The equipment-specific activity data, location-based emission factors, and real mine site operational durations used in the model were gathered from similar operating open-pit mines’ publicly disclosed documents.
As briefly described in Section 1.1, a typical open-pit copper mine with an intense production plan involves fragmentation of host rock with drilling and blasting, haulage of waste and ore material, and processing ore to produce concentrate.
As a result of desktop research, the following data were gathered for the mining operation considered for this study. In addition to the real data gathered from similar operations, the authors made assumptions when the data were missing based on previous experience and data from similar projects, Table 2.
According to Table 2, the modeled mine, assumed to be in Canada, has the following operational aspects based on the gathered data and made assumptions in the model:
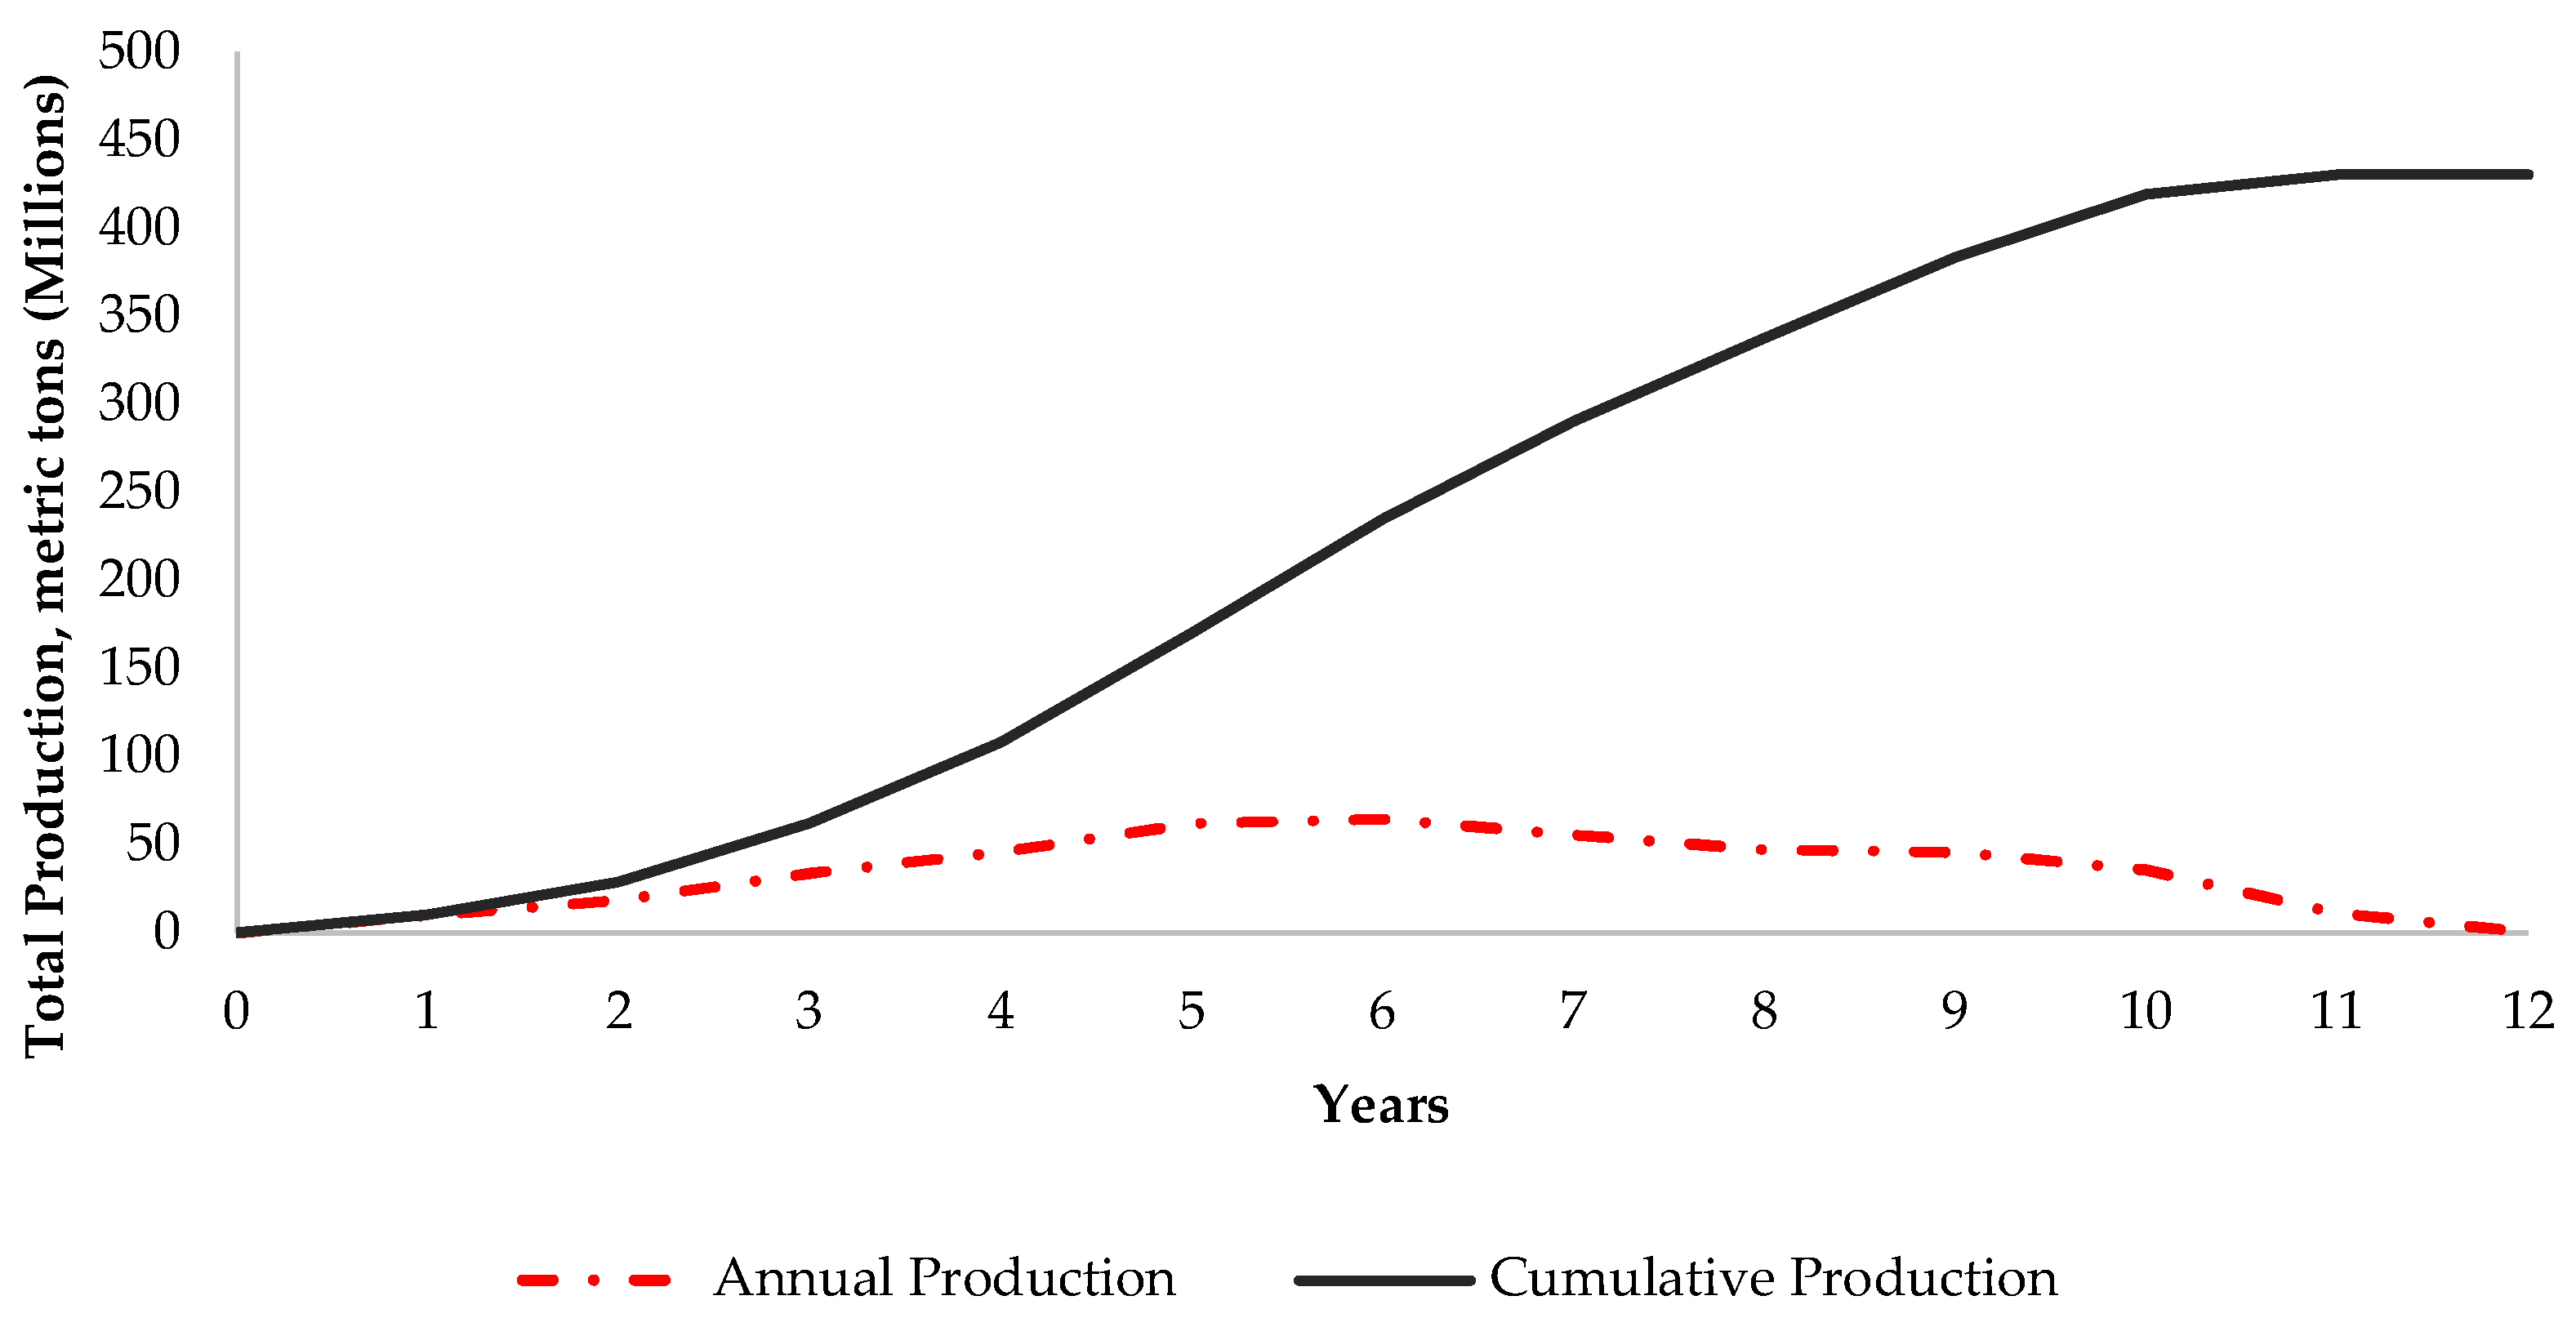
  • The considered open-pit copper mine has 12 years of LOM. The first year is preproduction, where only overburden (waste) material is excavated and hauled. Ore production and waste rock haulage start in Year 2. The total production is 430.5 million tonnes (Figure 8), 391 million tonnes of which are waste material and 39.5 million tonnes of ore. The overall stripping ratio is 1:10.
  • The mine operates two 12-h daily shifts for 365 days with a 12-year life-of-mine (LOM). However, 7500 h per year of active truck and shovel/loader operational time is used in the model due to operational and mechanical efficiency limitations in an operating mine based on the authors’ expertise. The number of non-haulage and process plant equipment is assumed to be the same in both cases. The costs and emissions from these processes are assumed to be the same in both cases and included in the analysis.
  • The average annual ROM ore is 3.3 million tonnes, and hauled waste is 32.5 million tonnes. The overall stripping ratio of 10:1 results in hauling 10 tonnes of waste material for mining one tonne of ore.
  • The mill and crusher operation times are assumed to be 12 h per shift for 365 days a year and 16 h per day for 365 days a year, and there will be a stockpile to control the grade and feed the mill continuously. It is assumed that the processing plant will start operating at the beginning of the third year to feed enough ore to the stockpile and the mill.
  • The baseline case includes shovel and truck production with 150 tonnes of haulage trucks with a fuel consumption of 95 L (diesel) per hour. Due to the significant difference in total waste production year over year after Year 6, it is assumed that leasing haulage trucks for a specific period during the peak production years is feasible. It is calculated that 44 haulage trucks are needed in the peak production year. The cost analysis considers the purchased 34 trucks and the leased rest of the haulage trucks. The number of trucks leased is eight in year 5, 10 in Year 6, and five in Year 7. Mine operates with the owned trucks in the other years. Truck working hours are calculated based on prioritizing the shovels and loaders, not waiting.
  • The mine has two 22-cubic-meter hydraulic shovels and three 11.5-cubic meter Front-End Loaders (FELs). The loading equipment loads ore and waste material to 150-ton diesel haulage trucks.
  • The model includes auxiliary mining equipment in addition to the main diesel production equipment: three dozers, two graders, five 165 mm drills, an emulsion, and a water truck.
  • The processing plant has an annual capacity of 3.7 Mt and an assumed overall mechanical availability of 86%. The model includes comminution, froth flotation, thickener, conveyors and pumps, and pit dewatering.
  • The electrification case includes an overland conveyor system to haul waste material from the exit of the pit near the process plant location to the waste dump site. The overland conveyor requires a crusher in a loading station. As the loading station is an ex-pit asset, it is assumed that 150-t diesel truck utilization is required to haul material from production faces to the crusher. The loading station mainly has a crusher and a feeder. The main crusher has a capacity of 5000 tonnes per hour, and a secondary crusher with a capacity of 3000 tonnes per hour is added to the feeding system starting from Year-4 to Year-10. A 150-kW feeder and discharger are used in the system, and an additional 100-kW feeder is used for Year-4 to Year-10 in the loading station.
  • It is assumed that the waste dump site accepts all waste material. Even though storing waste material when ore starts to be produced requires a special facility to avoid acid mine generation, it is assumed that the waste material can be dumped in a single waste dump site in the mine for this study.
  • The electricity consumption of the pumps for dewatering the pit starts in Year 1, and the process plant water system electricity consumption starts in Year 3, with the plant starting to process fed ore.
  • Emissions factors for the electricity grid in various Canadian jurisdictions are gathered from the federal governmental authority, Environment and Climate Change Canada [52]. The emission factors used in the analysis are listed in Table 3.
  • The data used to calculate costs in the model are listed in Table 4, and all the monetary information in this study is in Canadian dollars.
  • Carbon tax rates are only calculated for diesel equipment.

3.4. Validation

The next step in the research methodology given in Figure 2 is validation. To evaluate the accuracy of SDM in this study, validation of the model is performed based on a comparison of similar mine emission data, sensitivity analysis, and expert judgment. Baseline GHG emissions are quantified with SDM for a similar operational data comparison. The fuel consumption or GHG emissions of similar operational open-pit mines with similar production rates, equipment profiles, and utilization are obtained from the sustainability reports and used for comparison. Sensitivity analysis is the other approach for validating SDM in this study, which is described in Section 3.5.1. For the validation of the model with sensitivity analysis, the model’s key parameters and selected operational mine data are compared. For this purpose, GHG emissions are compared based on various emission factors of the electricity used in the electric case and Net Present Values (NPV) of diesel and electric case with various discount rates. Furthermore, contacted experts with operational and consulting experience are asked for their feedback about the assumptions used in the model and insights on the model’s outcomes. Based on these processes, the necessary adjustments are performed.

3.5. Analysis

The model’s sensitivity to variables is assessed with the emission factor of used electricity in cumulative CO2e emission and cumulative NPV change of diesel and electric options against the variable discount rate. The model analyzes two scenarios: switching the haulage from diesel equipment to electric equipment and the carbon intensity of energy sources on decarbonization in open-pit mining. The analyses provide the information to evaluate:
  • Change in GHG footprint of material movement based on diesel and electric equipment cases.
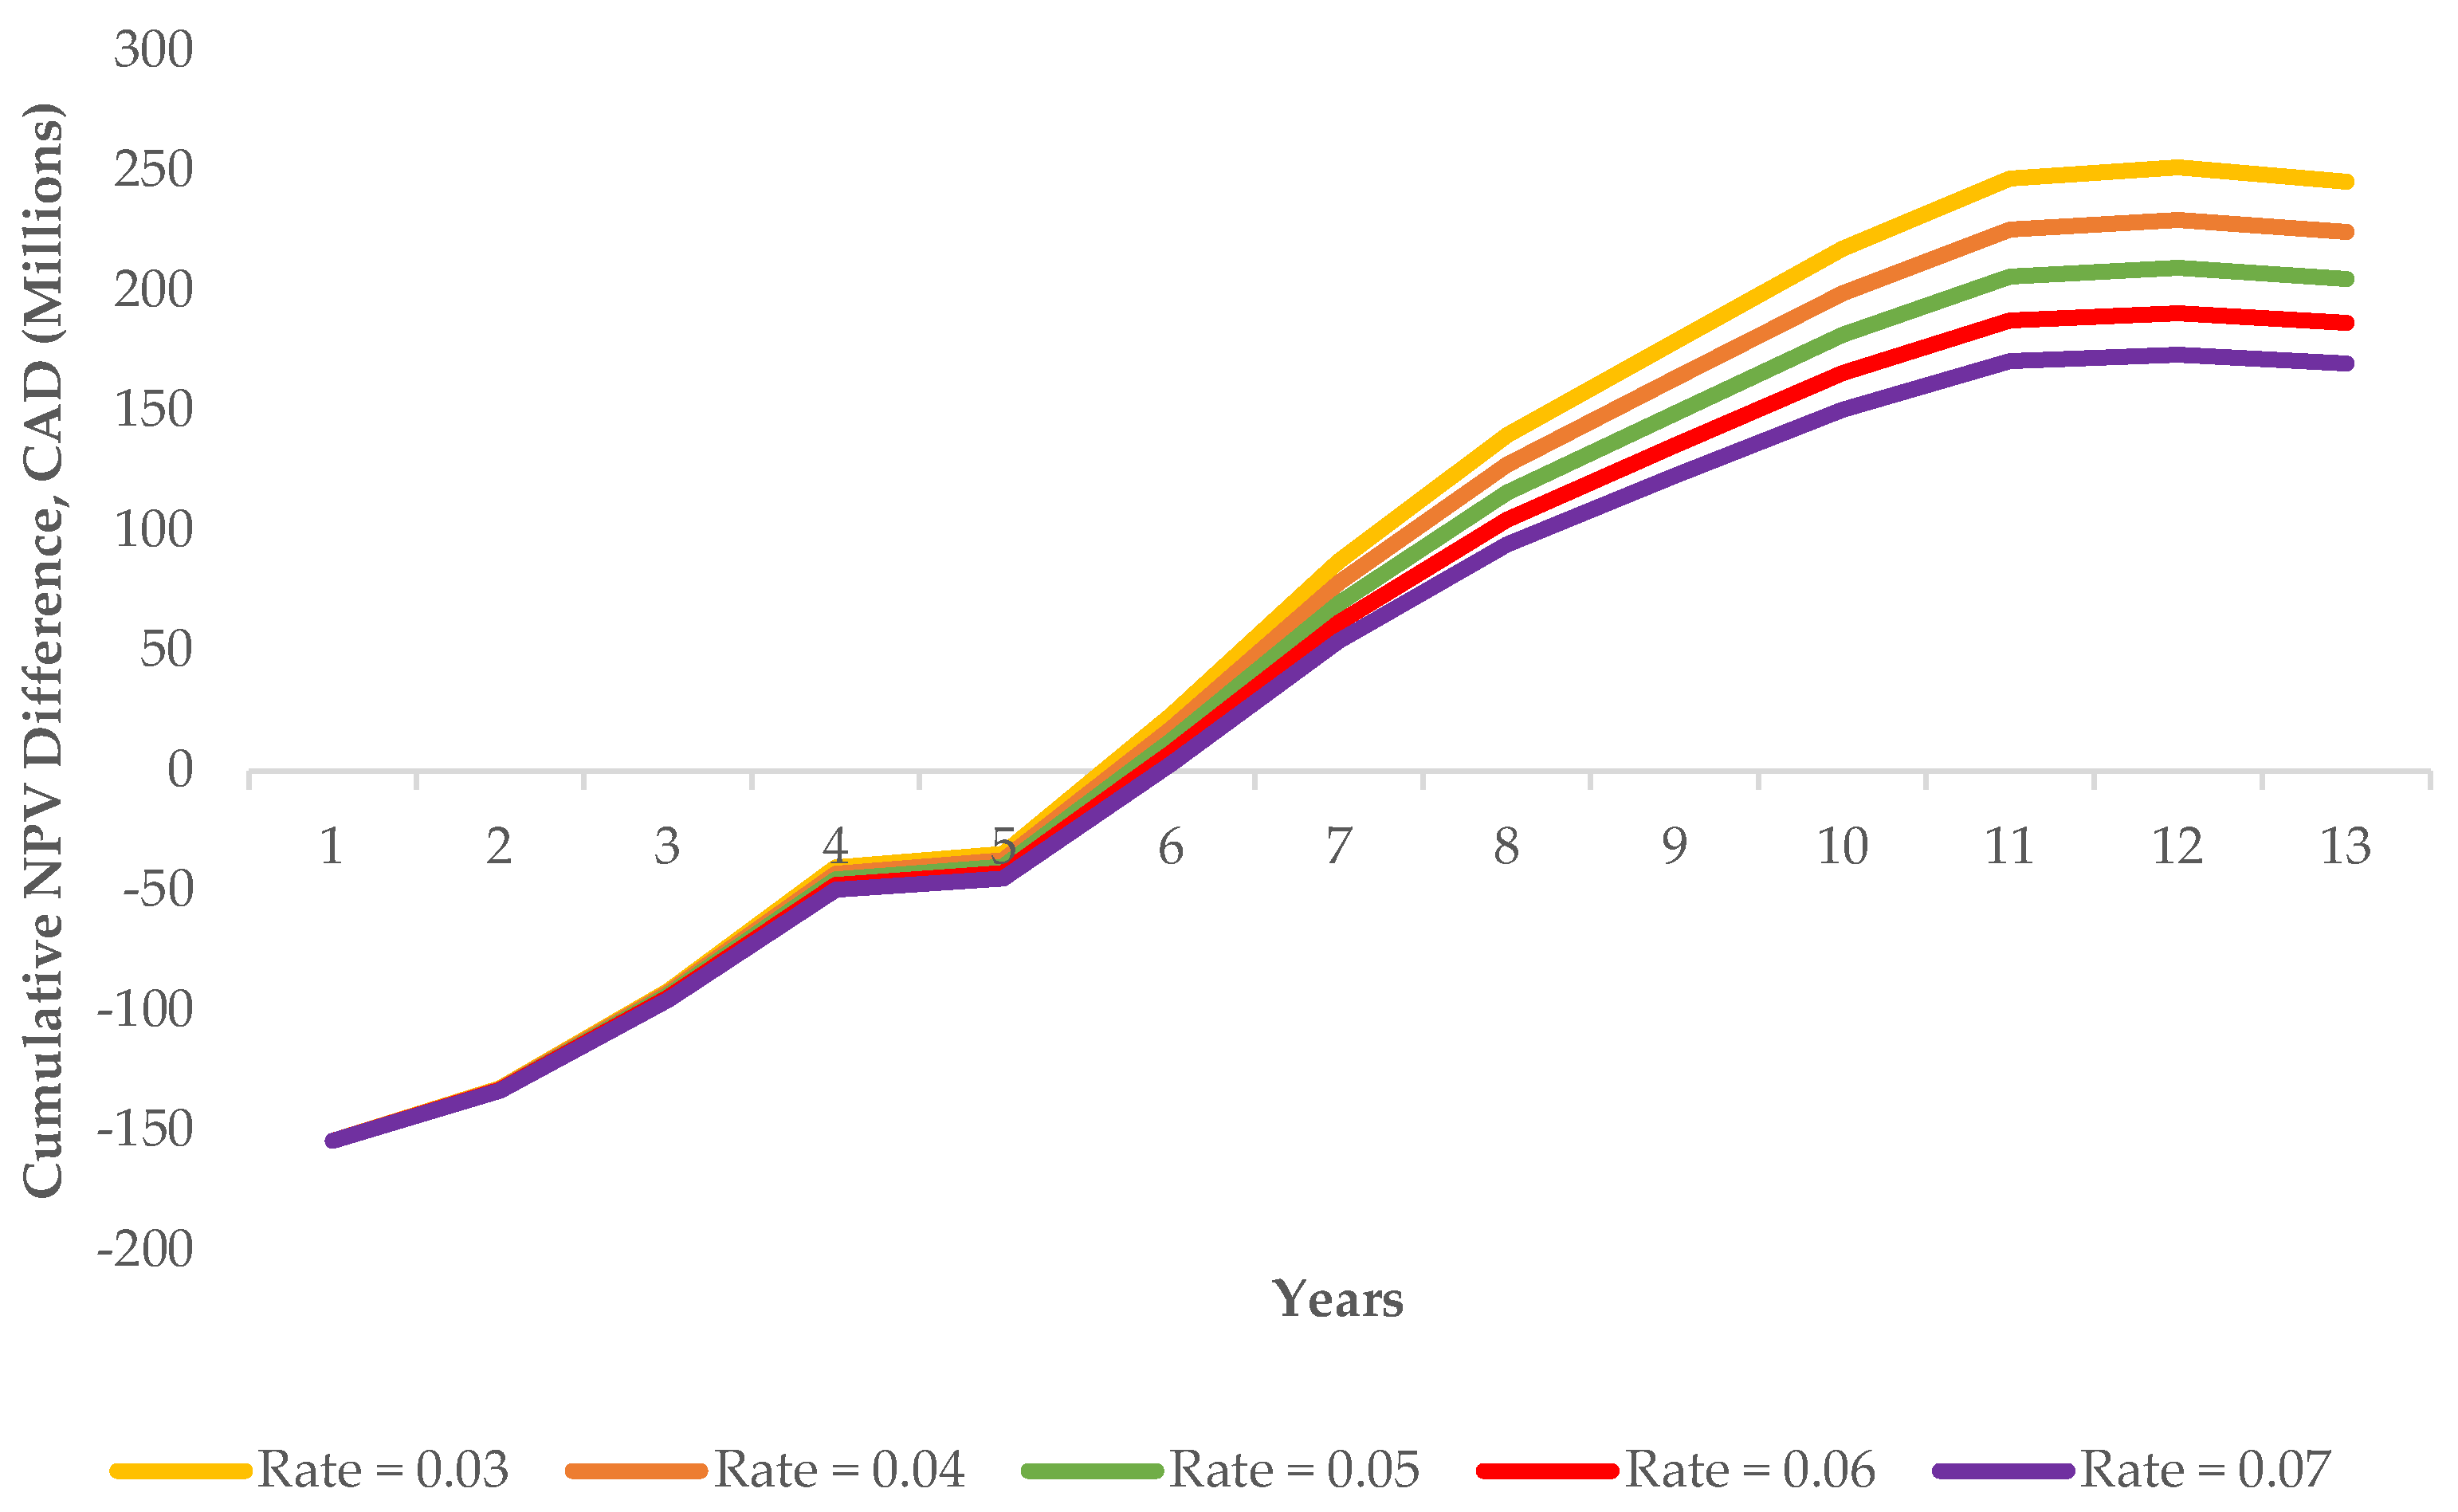
  • Cost of switching diesel haulage to an electric alternative.
  • Impact of the carbon intensity of power sources in GHG reduction in various jurisdictions.

3.5.1. Sensitivity Analysis

Different electricity emissions factors are used for the sensitivity analysis to calculate the cumulative CO2e emissions and discount rates to calculate the cumulative NPV difference between the diesel fleet (baseline) versus the electrified case (conveyor system). Figure 9 shows that the model presents the difference in cumulative emissions with British Columbia, Quebec, Ontario, and Nunavut grid electricity emission factors, which are 7.8 tCO2e/GWh, 1.9 tCO2e/GWh, 28 tCO2e/GWh, and 800 tCO2e/GWh, respectively.
Figure 10 shows the different discount rate-based NPV comparisons of diesel truck and conveyor cases. The model gives relevant results for different discount rates over LOM. Thus, the emission calculated with the model and the cost aspects of the two system comparisons are sensitive to different variables.

3.5.2. Scenario Analysis

The final step of the methodology is to determine and evaluate the impact of electrification of haulage in an open-pit mine and the impact of low carbon-intense energy sources in decarbonization efforts in the same open-pit copper mine in different jurisdictions. To study the impact of electrification of material movement on decarbonization, integrating an overland conveyor into the mining operation instead of using diesel haulage trucks is determined as the scenario for this study.
  • Impact of electrification of a haulage system on CO2e emissions in an open-pit copper mine
The scenario of replacing the diesel haul truck fleet with an electric overland conveyor system to move the waste material from the pit’s exit to the waste dump site is analyzed with SDM. As the mine considered is assumed to be in British Columbia, Canada, the scenario is run based on jurisdictional characteristics, including the grid connection of the operations, the emission factor of the electricity, carbon tax, and fuel costs. The findings are shown in Figure 11.
The use of an overland conveyor system to haul the waste material from the pit exit to the waste dump site can reduce CO2e emissions by half during LOM compared to using diesel haulage trucks.
  • Cost of switching diesel haulage to an electric alternative
In addition to emission reduction, SDM is used to compare the feasibility of the electrification option as the conveyor system requires more initial investment than the diesel truck fleet. Figure 12 shows that the payback period of the overland conveyor system is five years. However, the conveyor system becomes more cost-effective after the break-even point, considering the amount and distance of material movement, operational costs, and carbon tax in the specific jurisdiction.
  • Impact of the carbon intensity of an energy source on CO2e emissions in an open-pit copper mine
The developed SDM is also used to compare the effect of the emission factor on the decarbonization of the studied open-pit copper mine as an example to evaluate the effect of different design and operational parameters on the decarbonization alternatives. Figure 13 presents the significance of the carbon intensity of the electricity used to minimize GHG emissions via electrification in the mining sector. Due to hydropower-based electricity generation, Quebec and British Columbia are some of the greenest grid electricity available jurisdictions globally. On the contrary, Nunavut is a Canadian territory where electricity is generated with heavy fuel due to its remote location, Arctic climate conditions, and limited infrastructure. Running the model for electricity with different carbon intensities in Figure 13 clearly shows that electrification of systems in a mining site will not reduce CO2e emissions unless it is low-carbon electricity or non-emitting sources.

4. Results and Discussion

The findings shown in Figure 13 in Section 3.5.2 show that electrification will not deliver emission reduction unless the operations can access low-carbon electricity. Grid accessibility is a significant limitation for mining operations in order to lower diesel dependency. However, grid accessibility will not contribute to building low-carbon mines and decarbonizing production unless it is a low-carbon intensity grid, as the findings in Figure 13 present the diesel versus overland conveyor system cumulative GHG emissions in British Columbia versus Nunavut, Canada.
Considering the major impact of an energy source’s carbon intensity on a mining site, mining operations should evaluate the energy source, especially green electricity accessibility or generation potential, before considering any decarbonization technologies, mainly electrification options such as conveyor systems, battery-electric trucks, and trolley-assist trucks.
The economics of the electrification option, a conveyor system for material haulage in this study, is promising and will likely be feasible when the options are considered and compared before the final mine design and development starts. The NPV comparison of the two options for different discount rates in Figure 10 shows that the conveyor system is a competitive option with clear decarbonization potential and low-carbon electricity options even though it requires higher CAPEX. In this study, the NPV for the baseline case is CAD 889 million, whereas the NPV for the conveyor system case is CAD 680M. NPV discount rates between 3% and 7% give between six and seven years of the rate of return for the electric option. Thus, investors and governments should motivate mining companies to consider such technologies with low-carbon power accessibility by providing them incentives.
Considering low-carbon production options at the feasibility and design stage clearly gives competitive advantages over updating the systems later, where the infrastructure is limited, and production and processing characteristics may not be suitable or considerably costly for such updates.
Modeling all value chains of metals and minerals clearly helps us understand the most feasible cost per tonne of CO2e mitigation stage based on a numeric analysis. Such understanding is necessary to mobilize the finance to lower cumulative emissions instead of focusing on less effective and costly stages within the full value chain. This is significantly critical when the high risk and CAPEX characteristics of mining are considered. By pushing electrification technologies to mining operations where low-carbon intensity electricity is not available or limited, investing in any electrification option will not decarbonize mining (Figure 13). This is a major aspect of financing low-carbon technologies, considering the public funding programs in Canada, the USA, and other countries to help the sector lower carbon emissions.

5. Conclusions

System dynamics modeling (SDM) was used as the method to analyze the carbon mitigation potential of conveyor systems to move material in an open-pit copper mining system with respect to the emission factor of fuel, i.e., diesel and electricity, and capital and operational costs. The findings clearly showed that the electrification of material movement promises considerable decarbonization potential if the power onsite has a low emission factor.
The fact that low-carbon electricity is the primary determinant of decarbonization emphasizes the necessity of transition in mining, which should include the efforts of central and regional governments, mining companies, and their local partners. One way to tackle this interdependency is to examine potential microgrid investments and evaluate the low-carbon energy resources at particular locations.
The carbon tax value positively impacts integrating high capital cost-required electrification options, like overland conveyor systems, into open-pit mining operations. In this regard, the SDM analyses also show that the major limitations of electrification in an open-pit mine are the considerable capital cost difference between electrification and diesel options, in addition to clean electricity accessibility.
The method outlined in this study can assist change and innovation leaders in the mining industry in effectively communicating the potential, costs, and risks within the sector. Furthermore, to tackle these challenges, this research emphasizes the key factors necessary for successful decarbonization initiatives in extractive industries:
  • It is essential for governments to promote the development of low-carbon power generation, enhance clean technology integration, and boost energy efficiency.
  • It is important for mining companies to consider energy-efficient options such as modifying process elements like reducing grinding, implementing dry stacking, utilizing high-pressure grinding rolls, incorporating a SAG mill for fine grinding rather than a ball mill, and using on-demand ventilation for underground operations.
  • Minerals and metals with low carbon intensity should be priced differently from those produced using energy and carbon-intensive methods and those with higher environmental and social impacts.
  • Additional research should prioritize technologies such as in-pit crushing and conveying autonomous equipment, alternative fuels, low-carbon on-site power generation and storage, and the seamless integration of these technologies by reducing uncertainty and risks through digital platforms like digital twins.
  • Educators and consultants should prioritize the core aspects of mining engineering, such as mine design, process design, resource estimation, and project valuation, in relation to energy and carbon intensity. They should also consider environmental and social impacts before the feasibility study phase of a mining project to reduce additional costs in the development and production phases.

Author Contributions

Conceptualization, K.A., E.D.Y. and F.A.; Methodology, K.A. and F.A.; Software, K.A. and S.D.; Validation, E.D.Y.; Formal analysis, K.A. and F.A.; Investigation, E.D.Y.; Resources, S.D. and E.D.Y.; Data curation, K.A. and F.A.; Writing—original draft, E.D.Y.; Writing—review & editing, S.D.; Visualization, K.A.; Supervision, S.D.; Project administration, S.D.; Funding acquisition, S.D. All authors have read and agreed to the published version of the manuscript.

Funding

This research received no external funding.

Institutional Review Board Statement

Not applicable.

Informed Consent Statement

Not applicable.

Data Availability Statement

The data presented in this study are available on request from the corresponding author.

Conflicts of Interest

Author Evren Deniz Yaylaci was employed by the company SysEne Consulting Inc., and he declares that the research was conducted in the absence of any data-related, commercial or financial relationships with his employer or the projects he worked on. The remaining authors declare that the research was conducted in the absence of any commercial or financial relationships that could be construed as a potential conflict of interest.

References

  1. Legge, H.; Müller-Falcke, C.; Nauclér, T.; Östgren, E. Creating the Zero-Carbon Mine. 2021. Available online: https://www.mckinsey.com/industries/metals-and-mining/our-insights/creating-the-zero-carbon-mine (accessed on 14 March 2022).
  2. Azadi, M.; Northey, S.A.; Ali, S.H.; Edraki, M. Transparency on greenhouse gas emissions from mining to enable climate change mitigation. Nat. Geosci. 2020, 13, 100–104. [Google Scholar] [CrossRef]
  3. Delevingne, L.; Glazener, W.; Grégoir, L.; Henderson, K. Climate Risk and Decarbonization: What Every Mining CEO Needs to Know. 2020. Available online: https://www.mckinsey.com/business-functions/sustainability/our-insights/climate-risk-and-decarbonization-what-every-mining-ceo-needs-to-know (accessed on 14 March 2022).
  4. Heinrich, L.; Koschinsky, A.; Markus, T.; Singh, P. Quantifying the fuel consumption, greenhouse gas emissions and air pollution of a potential commercial manganese nodule mining operation. Mar. Policy 2020, 114, 103678. [Google Scholar] [CrossRef]
  5. Barrick. Barrick Updates Its Evolving Emissions Reduction Target. 2021. Available online: https://www.barrick.com/English/news/news-details/2021/barrick-updates-its-evolving-emissions-reduction-target/default.aspx (accessed on 8 March 2022).
  6. BHP. Climate Transition Action Plan. 2021. Available online: https://www.bhp.com/-/media/documents/investors/annual-reports/2021/210914_bhpclimatetransitionactionplan2021.pdf (accessed on 8 March 2022).
  7. Copper Alliance. 2021. Available online: https://sustainablecopper.org/best-practice-indicator/climate-action/ (accessed on 8 March 2022).
  8. Freeport-MecMoran. 2022 Climate Report. 2023. Available online: https://www.fcx.com/sites/fcx/files/documents/sustainability/2022-Climate-Report.pdf (accessed on 8 January 2024).
  9. Newmont. Newmont Corporation Climate Strategy Report. 2021. Available online: https://s24.q4cdn.com/382246808/files/doc_downloads/sustainability/2020-report/Newmont-Climate-Strategy-Report.pdf (accessed on 8 March 2022).
  10. Rio Tinto. Climate Change Report. 2022. Available online: https://www.riotinto.com/en/sustainability/climate-change (accessed on 8 March 2022).
  11. Purhamadani, E.; Bagherpour, R.; Tudeshki, H. Energy consumption in open-pit mining operations relying on reduced energy consumption for haulage using in-pit crusher systems. J. Clean. Prod. 2020, 291, 125228. [Google Scholar] [CrossRef]
  12. International Energy Association (IEA). The Role of Critical World Energy Outlook Special Report Minerals in Clean Energy Transitions. 2022. Available online: https://www.iea.org/reports/the-role-of-critical-minerals-in-clean-energy-transitions/the-state-of-play (accessed on 8 November 2023).
  13. Duzgun, H. The Integration of Systems Engineering and Data Analytics for Enhancing the Resiliency and Transparency of Mineral Supply Chains. In Proceedings of the Critical Minerals Symposium, Golden, CO, USA, 21–22 September 2023. [Google Scholar]
  14. Coalition for Energy Efficient Comminution (CEEC). Mining Energy Consumption 2021. 2021. Available online: https://www.ceecthefuture.org/resources?task=download&file=publication_file&id=3701 (accessed on 9 February 2024).
  15. OECD. ESG Investing and Climate Transition: Market Practices, Issues and Policy Considerations. Paris. 2021. Available online: https://www.oecd.org/finance/ESG-investing-and-climate-transition-Market-practices-issues-and-policy-considerations.pdf (accessed on 3 March 2022).
  16. Feng, Y.; Liu, Q.; Li, Y.; Yang, J.; Dong, Z. Energy efficiency and CO2 emission comparison of alternative powertrain solutions for mining haul truck using integrated design and control optimization. J. Clean. Prod. 2022, 370, 133568. [Google Scholar] [CrossRef]
  17. Bulk, A.; Shoukas, G.; Faramarzi, R. Industrial Conveyor Motor Performance Evaluation. ComEd Energy Efficiency Program National Renewable Energy Laboratory. 2021. Available online: https://www.nrel.gov/docs/fy21osti/80051.pdf (accessed on 15 January 2024).
  18. The International Copper Association. Copper—The Pathway to Net Zero. 2023. Available online: https://copperalliance.org/wp-content/uploads/2023/03/ICA-GlobalDecar-202301-English-Final-singlepgs.pdf (accessed on 8 November 2023).
  19. Natural Resources of Canada (NRCAN). Copper Facts. 2023. Available online: https://natural-resources.canada.ca/our-natural-resources/minerals-mining/minerals-metals-facts/copper-facts/20506 (accessed on 8 December 2023).
  20. World Bank (WB). Minerals for Climate Action—The Mineral Intensity of the Clean Energy Transition. 2020. Available online: https://pubdocs.worldbank.org/en/961711588875536384/Minerals-for-Climate-Action-The-Mineral-Intensity-of-the-Clean-Energy-Transition.pdf (accessed on 10 December 2023).
  21. Natural Resources of Canada (NRCAN). Critical Minerals List. 2021. Available online: https://natural-resources.canada.ca/sites/nrcan/files/mineralsmetals/pdf/Critical_Minerals_List_2021-EN.pdf (accessed on 1 February 2024).
  22. International Energy Association (IEA). Critical Minerals List 2021. 2022. Available online: https://www.iea.org/policies/15698-critical-minerals-list-2021 (accessed on 1 February 2024).
  23. The United States Department of Energy (DOE). What Are Critical Materials and Critical Minerals? 2023. Available online: https://www.energy.gov/cmm/what-are-critical-materials-and-critical-minerals#:~:text=Critical%20materials%20for%20energy%20(%E2%80%9Cthe,silicon%2C%20silicon%20carbide%20and%20terbium (accessed on 1 February 2024).
  24. International Copper Study Group. World Copper Factbook 2023. 2023. Available online: https://icsg.org/copper-factbook/ (accessed on 15 January 2024).
  25. Chesnokov, Y.N.; Lisienko, V.G.; Holod, S.I.; Anufriev, V.P.; Lapteva, A.V. Estimation of CO2-Equivalent Emission under the Copper Fire Refining Process. IOP Conf. Ser. Earth Environ. Sci. 2017, 72, 012013. [Google Scholar] [CrossRef]
  26. Sparshott, E.; Walls, M. Copper Miners Go Underground. Wall Str. J. 2009. Available online: https://www.wsj.com/articles/SB10001424052748704201404574589941445376718 (accessed on 14 January 2024).
  27. Cooper Development Association, n.d. Mining Methods. Available online: https://copper.org/education/copper-production/2.html (accessed on 30 January 2024).
  28. Yearworth, M. A Brief Introduction to System Dynamics Modelling; University of Bristol: Bristol, UK, 2014; p. 15. Available online: https://www.grounded.systems/wp-content/uploads/2015/02/SD-Introduction-MY-241014.pdf (accessed on 10 June 2023).
  29. Li, Q.; Zhang, W.; Li, H. CO2 emission trends of China’s primary aluminum industry: A scenario analysis using systems dynamics model. Energy Policy 2017, 105, 225–235. [Google Scholar] [CrossRef]
  30. Aranoglu, F.; Flamand, T.; Duzgun, S. Analysis of Artisanal and Small-Scale Gold Mining in Peru under Climate Impacts Using System Dynamics Modeling. Sustainability 2022, 14, 7390. [Google Scholar] [CrossRef]
  31. Einhäupl, P.; Van Acker, K.; Peremans, H.; Van Passel, S. The conceptualization of societal impacts of landfill mining—A system dynamics approach. J. Clean. Prod. 2021, 296, 126351. [Google Scholar] [CrossRef]
  32. Aranoglu, F.; Flamand, T.; Duzgun, S.; Martinez, G.; Smith, N. Integrated System Dynamics Modeling and Optimization for Artisanal and Small-scale Gold Supply Chains. IISE Trans. 2024, 1–19. [Google Scholar] [CrossRef]
  33. Dai, S.S.; Li, L.H.; Xu, H.G.; Pan, X.L.; Li, X.M. A system dynamics approach for water resources policy analysis in arid land: A model for Manas River Basin. J. Arid Land 2013, 5, 118–131. [Google Scholar] [CrossRef]
  34. McAvoy, S.; Grant, T.; Smith, C.; Bontinck, P. Combining Life Cycle Assessment and System Dynamics to improve impact assessment: A systematic review. J. Clean. Prod. 2021, 315, 128060. [Google Scholar] [CrossRef]
  35. Phan, T.D.; Bertone, E.; Stewart, R.A. Critical review of system dynamics modelling applications for water resources planning and management. Clean. Environ. Syst. 2021, 2, 100031. [Google Scholar] [CrossRef]
  36. Jiang, H.; Simonovic, S.P.; Yu, Z.; Wang, W. A system dynamics simulation approach for environmentally friendly operation of a reservoir system. J. Hydrol. 2020, 587, 124971. [Google Scholar] [CrossRef]
  37. Sun, L.; Niu, D.; Wang, K.; Xu, X. Sustainable development pathways of hydropower in China: Interdisciplinary qualitative analysis and scenario-based system dynamics quantitative modelling. J. Clean. Prod. 2021, 287, 125528. [Google Scholar] [CrossRef]
  38. Sverdrup, H.U.; Ragnarsdottir, K.V.; Koca, D. On modelling the global copper mining rates, market supply, copper price and the end of copper reserves. Resour. Conserv. Recycl. 2014, 87, 158–174. [Google Scholar] [CrossRef]
  39. Tian, Y.; Govindan, K.; Zhu, Q. A system dynamics model based on evolutionary game theory for green supply chain management diffusion among Chinese manufacturers. J. Clean. Prod. 2014, 80, 96–105. [Google Scholar] [CrossRef]
  40. Dace, E.; Bazbauers, G.; Berzina, A.; Davidsen, P.I. System dynamics model for analyzing effects of eco-design policy on packaging waste management system. Resour. Conserv. Recycl. 2014, 87, 175–190. [Google Scholar] [CrossRef]
  41. Dehghan, H.; Amin-Naseri, M.R.; Nahavandi, N. A system dynamics model to analyze future electricity supply and demand in Iran under alternative pricing policies. Util. Policy 2021, 69, 101165. [Google Scholar] [CrossRef]
  42. Li, J.; Nian, V.; Jiao, J. Diffusion and benefits evaluation of electric vehicles under policy interventions based on a multiagent system dynamics model. Appl. Energy 2022, 309, 118430. [Google Scholar] [CrossRef]
  43. Xiao, S.; Dong, H.; Geng, Y.; Tian, X.; Liu, C.; Li, H. Policy impacts on Municipal Solid Waste management in Shanghai: A system dynamics model analysis. J. Clean. Prod. 2020, 262, 121366. [Google Scholar] [CrossRef]
  44. Ye, F.; Xiong, X.; Li, L.; Li, Y. Measuring the effectiveness of the Chinese Certified Emission Reduction scheme in mitigating CO2 emissions: A system dynamics approach. J. Clean. Prod. 2021, 294, 125355. [Google Scholar] [CrossRef]
  45. Ansari, N.; Seifi, A. A system dynamics model for analyzing energy consumption and CO2 emission in Iranian cement industry under various production and export scenarios. Energy Policy 2013, 58, 75–89. [Google Scholar] [CrossRef]
  46. Datola, G.; Bottero, M.; de Angelis, E.; Romagnoli, F. Operationalizing resilience: A methodological framework for assessing urban resilience through System Dynamics Model. Ecol. Model. 2022, 465, 109851. [Google Scholar] [CrossRef]
  47. Liu, X.; Mao, G.; Ren, J.; Li, R.Y.M.; Guo, J.; Zhang, L. How might China achieve its 2020 emissions target? A scenario analysis of energy consumption and CO2 emissions using the system dynamics model. J. Clean. Prod. 2015, 103, 401–410. [Google Scholar] [CrossRef]
  48. Stasinopoulos, P.; Shiwakoti, N.; Beining, M. Use-stage life cycle greenhouse gas emissions of the transition to an autonomous vehicle fleet: A System Dynamics approach. J. Clean. Prod. 2021, 278, 123447. [Google Scholar] [CrossRef]
  49. Tseng, C.H.; Chen, L.L.; Su, S.M. Development of a system dynamics model for dioxin flow and its application to the energy sector. Heliyon 2021, 7, e08361. [Google Scholar] [CrossRef] [PubMed]
  50. Yang, H.; Li, X.; Ma, L.; Li, Z. Using system dynamics to analyse key factors influencing China’s energy-related CO2 emissions and emission reduction scenarios. J. Clean. Prod. 2021, 320, 128811. [Google Scholar] [CrossRef]
  51. Ahmad, S.; Mat Tahar, R.; Muhammad-Sukki, F.; Munir, A.B.; Abdul Rahim, R. Application of system dynamics approach in electricity sector modelling: A review. Renew. Sustain. Energy Rev. 2016, 56, 29–37. [Google Scholar] [CrossRef]
  52. Environment and Climate Change Canada (ECCC). Emission Factors and Reference Values: Version 1.0. 2022. Available online: https://publications.gc.ca/collections/collection_2022/eccc/En84-294-2022-eng.pdf (accessed on 5 June 2023).
Figure 1. Stages involved in the production of copper cathode from ROM ore.
Sustainability 16 06232 g001
Figure 2. Systems thinking-based research methodology.
Sustainability 16 06232 g002
Figure 3. System boundary for analyzing GHG emissions in an open-pit copper mine.
Sustainability 16 06232 g003
Figure 4. SDM modules for both the baseline and electrification cases.
Sustainability 16 06232 g004
Figure 5. CO2e emission quantification for the baseline case—diesel truck haulage of waste material.
Sustainability 16 06232 g005
Figure 6. Emission stock-flow diagrams.
Sustainability 16 06232 g006aSustainability 16 06232 g006b
Figure 7. Cost stock-flow diagrams.
Sustainability 16 06232 g007
Figure 8. Ore and waste mine production during life-of-mine.
Sustainability 16 06232 g008
Figure 9. Cumulative CO2 emissions of the conveyor haulage case with different electricity emission factors.
Sustainability 16 06232 g009
Figure 10. NPV change of diesel case vs. electric case according to discount rates.
Sustainability 16 06232 g010
Figure 11. CO2e emission comparison of a diesel truck versus an electric overland conveyor system haulage of materials.
Sustainability 16 06232 g011
Figure 12. NPV comparison of a diesel truck fleet versus an overland conveyor system during the LOM.
Sustainability 16 06232 g012
Figure 13. CO2e emission difference of baseline and electrification cases based on various electricity emission factors in four Canadian jurisdictions.
Sustainability 16 06232 g013
Table 1. GHG emission quantification variables for Scope 1 emissions.
VariableNotationUnitDescription
Activity dataADL or kWhThe total amount of fuel consumption as a result of an activity, e.g., haulage
Emission factorEFkg/L, kg/kWh, g/kWhThe emission factor of the fuel type used
CO2e emissionsECO2tonnesThe total amount of CO2e emissions from
Conversion factorcf Kg to t, kWh to GWh, g to tonne
Table 2. Operational aspects.
ParameterValueUnit
Life of Mine (LOM)12Year
Total Production430.5Tonne
Overall Stripping Ratio1:10Tonne:Tonne
Operating Hours7500Hours/Year
Average Run of Mine (ROM)3.3Million Tonnes/Year
Number of Haulage Trucks at Peak Production Year44Count
Capacity of Haulage Truck150Tonne
Fuel Consumption of Haulage Trucks95Liter/Hour
Number of Hydraulic Shovels2Count
Capacity of Hydraulic Shovels22Cubic-meter
Number of Front-End Loaders (FELs)3Count
Capacity of Front-End Loaders (FELs)11.5Cubic-meter
Capacity of Processing Plant3.7Million Tonnes/Year
Mechanical Availability of Processing Plant86%
Waste Rock Crushing PlantMain Crusher Capacity5000Tonnes/Hour
Secondary Crusher Capacity3000Tonnes/Hour
Table 3. Emission factors used in the study.
UnitEmission Factor
Grid electricity, Quebec, CanadatCO2e/GWh1.9
Grid electricity, British Columbia, CanadatCO2e/GWh7.8
Grid electricity, Ontario, CanadatCO2e/GWh28
Grid electricity, Nunavut, CanadatCO2e/GWh800
Diesel Emission Factor
(off-road heavy mobile equipment)
kg CO2e/L2.786
Emulsion Emission Factorkg CO2e/ton170
ANFO Emission Factorkg CO2e/ton189
Table 4. Economic parameters used to analyze NVP of baseline and electric cases in the study.
ItemUnitCost (Canadian Dollar)
Grid electricity cost$/kWh0.06
Diesel Cost$/L1.28
Carbon tax, first five years$/tCO275
Carbon tax, Year-6 to Year-12$/tCO2100
150-t truck CAPEX$3,500,000
150-t truck (lease)$/year875,000
The conveyor system (construction, conveyor and discharge) CAPEX$130,000,000
Loading station (two crushers, feeder, construction) CAPEX$38,000,000
150-t truck non-fuel operational cost, including maintenance, parts, tires, oil/lubricants$/hour143
Conveyor system non-electricity operational cost, including maintenance, parts etc.$/year5,400,000
The inflation rate%3
Net Present Value discount rate%5
Disclaimer/Publisher’s Note: The statements, opinions and data contained in all publications are solely those of the individual author(s) and contributor(s) and not of MDPI and/or the editor(s). MDPI and/or the editor(s) disclaim responsibility for any injury to people or property resulting from any ideas, methods, instructions or products referred to in the content.

