Article

Coupling and Coordinated Development of Carbon Emission Efficiency in Industrial Enterprises and the Digital Economy: Empirical Evidence from Anhui, China

1
Business School, Suzhou University, Suzhou 234000, China
2
School of Economics and Management, China University of Mining and Technology, Xuzhou 221000, China
3
School of Management, Suzhou University, Suzhou 234000, China
*
Author to whom correspondence should be addressed.
Sustainability 2024, 16(14), 6248; https://doi.org/10.3390/su16146248
Submission received: 13 June 2024 / Revised: 14 July 2024 / Accepted: 20 July 2024 / Published: 22 July 2024
(This article belongs to the Topic Energy Economics and Sustainable Development)

Abstract

:
To delve into the interrelationship between the green transformation of industry and the economy’s high-quality development, to promote the coordinated development of industrial carbon emission efficiency and digital economy, to expand the scope and research ideas related to economic and social sustainable development, and to provide scientific reference for the low-carbon sustainable development of regional economy, this article introduced a data-centric methodology for evaluating the collaborative advancement of both industrial enterprises’ carbon emission efficiency and the digital economy. To accurately gauge the carbon footprint of industrial enterprises, models focusing on carbon emissions as well as carbon emission intensity were employed. To enhance the precision of evaluation outcomes and mitigate biases stemming from subjective weighting factors, we employed the entropy weight method to objectively assign weights to each indicator. Furthermore, the super-efficient slack-based model (SBM) can solve the problem that the conclusions are biased, due to the different radial. Subsequently, a carbon-emission efficiency slack-based measure model, and models for coupling degree and coupling-coordination degree were formulated. Anhui, as a central province in China, is also an important province in the Yangtze River Delta integration development. Coordinated development of its carbon emission efficiency and digital economy has important implications for the sustainable economy advancements of other regions in China, and even other countries or regions in the world. Therefore, Anhui was selected to be the empirical research sample. The results showed that the comprehensive levels of these two systems followed an increasing trend, while the digital economy lagged. Their coupling degree fluctuated and reached its highest point in 2021, whereas their coupling-coordination degree increased, showing high coupling and low coordination overall. This study proposes specific countermeasures and suggestions for the relevant decision-makers.

1. Introduction

The relentless rise in carbon emissions has given rise to grave environmental challenges, impeding sustainable global development. Globally, the mitigation of carbon emissions has emerged as a paramount issue of significant importance [1,2]. As a major contributor to global carbon emissions, China has committed to reaching a peak in its carbon emissions by 2030 and ultimately achieving carbon neutrality by 2060, underscoring its responsible stance towards mitigating climate change [3,4]. China is currently advocating for a high-quality development pattern in economy. It is crucial to create a pattern of low-carbon development for achieving the goal of “dual carbon” [5]. Low-carbon development requires a shift from an economy dependent on resources to one driven by low-carbon technologies [6]. According to the technology bias theory [7], the green innovation of technologies is key to low-carbon development [8]. The digital economy has promoted continuous innovation in new information technology [9,10], which effectively empowered industry’s low-carbon development, improved energy efficiency, and accelerated carbon emission reduction [11,12]. The digital economy has undergone rapid development in China. “The White Paper on Global Digital Economy 2023” notes that, as of 2022, China’s digital economy has obtained a compound 14.2% growth every year, which is 1.6 times the combined digital economies of America, Germany, Japan and South Korea in the same period, and is gradually increasing in various fields [13]. The digital economy is a vital factor in advancing the construction of ecological civilization [14]. It provides technical support for low-carbon development and environmental governance [15,16]. New technologies such as information technologies and digital technologies should be used. Traditional industries should be promoted to transform into digital development, which can help improve energy efficiency [17]. The digital economy’s development has significantly improved the resource utilization rate, thus reducing energy consumption and carbon emissions, as well as improving carbon emission efficiency [18] and reducing environmental damage [19].
The digital economy also promotes lots of new business models, such as the short-video live-broadcasting economy and the sharing economy [20], forming an economic system with efficient operation and precise service, reducing society’s dependence on traditional industries, decreasing the energy consumed by heavy industries, and achieving carbon emissions reduction [21,22,23]. The live broadcasting economy fosters the transformation and enhancement of the manufacturing industry, acting as a driving force for modernization and innovation within the sector [24]. The sharing economy reduced the ecological footprint [25], prolonged the service life of the item [26], reduced carbon dioxide emissions [27], and improved environmental benefits [28]. Industrial enterprises are major carbon emitters [29]. Scientific and objective measurements of carbon emissions data from industrial enterprises are very important for governments to formulate policies. Exploring interrelationship between industrial enterprises’ carbon emission efficiency and the digital economy’s advancement facilitates enterprises achieving the carbon emission reduction target, and promotes technological innovation, which is of great importance. Therefore, relevant topics have drawn the attention of researchers.
First, studies on carbon emissions and the digital economy are rich in content and offer diverse perspectives. Carbon emission efficiency reflects the relationship between environmental, economic, and social benefits [30,31]. Different researchers have varying perspectives on the interrelationship between carbon emissions and the digital economy. Xie’s study [32,33] found the digital economy promotes carbon reduction through an improved energy mix, innovation efficiency, and technological progress. Han [34,35,36,37,38] found the digital economy is able to promote carbon emission efficiency and its reduction. Guo and Zhang [39] indicated that the digital economy can increase exponentially in carbon reduction. Ge et al. [40,41] pointed out that the digital economy and carbon emission had an “inverted U-shape” nonlinear relationship. The digital economy influence on carbon emission efficiency [42,43], the marginal carbon emission rate [30], and industry’s carbon emission efficiency [44,45,46,47] have also been studied. Other scholars have noted that no clear correlation existed between the two [13,48,49,50,51]. There is a scarcity of research that has analyzed the coordination between industrial enterprises’ carbon emission efficiency and the digital economy. Industrial enterprises, being the primary contributors to carbon emissions, are intricately linked with the digital economy. Thus, examining the coordination between the two is paramount. Such an endeavor holds immense significance for fostering low-carbon industrial development while ensuring the robust and sustainable growth of the digital economy.
Second, researchers have employed diverse methodologies to investigate the synchronized development of carbon emission and the digital economy. The carbon emission efficiency system and digital economy system can be viewed as two complex systems [42,44]. The coupling-coordination model is often employed as a tool to quantify the extent of interaction and interdependence between different systems [52,53]. This method has been applied in the digital economy, agriculture, and the logistics industries, and has achieved rich results [54,55]. Relationships among the following systems have been established using this method: low-carbon development and the digital economy [56,57], urbanization and carbon emissions [58,59], urbanization and digital finance [60,61,62], agricultural ecology and urbanization [63,64,65], innovative development and the economy [66,67], and the digital economy and logistics [68,69]. However, in the existing literature, the entropy weight method, the DEA model and the cooperation degree model of composite systems are seldom used. In this paper, the comprehensive use of these methods for research will be more scientific.
The relative research offers valuable insights that serve as a crucial foundation for investigating the coupling and coordination relationship that exists between carbon emission efficiency of industrial enterprises and the digital economy. However, current research still has the following deficiencies. Most studies analyzed the unidirectional effect of digital technology on carbon emissions. Additional research endeavors are necessary to delve deeper into the intricate coupling and coordination dynamics between the two systems. Specific research challenges are as follows.
  • Industrial enterprises’ carbon emission system and digital economy system can be seen as two complex systems that involve multidimensional indicators, multisource factors, and multiple units of measure. Hence, there is an urgent need for precise measurement and assessment of both industrial enterprises’ carbon emission efficiency and the digital economy, as this is crucial for fostering their coordinated development.
  • Many factors influence the coordinated development of the two systems. Scientifically conducting data processing and model development is paramount for formulating targeted strategies that can enhance industrial enterprises’ carbon emission efficiency and facilitate the growth of the digital economy.
  • Given the variations in regional resource endowments, as well as the differing levels of industrial enterprises’ and digital economy’s development, it is imperative to devise tailored policies and countermeasures for carbon emission reduction and the digital economy growth, taking into account local specificities.
To address these challenges, this study adopts the insights and methodologies employed by relevant researchers [30,42,44,53] as a foundation. The index system is more systematic than existing studies [42,44,70,71,72,73,74]. From the perspective of total factors, this study comprehensively considers the expected output of capital, human energy consumption, total profit, and the non-expected output of carbon emission intensity. Furthermore, a comprehensive digital-economy index system was devised, encompassing infrastructure construction, industrial digitization, digital industries, and digital technology innovation. We devised a data-centric methodology to assess and quantify the coordinated development between industrial enterprises and the digital economy. In this study, the validity of the method was verified with the data from Anhui, China. Anhui Province boasts geographical advantages, being situated in the central-eastern region. Consequently, the efficiency of an entity’s carbon emissions exerts a direct and substantial influence on promoting high-quality development within its adjacent regions. Finally, corresponding countermeasures and suggestions were proposed, based on the research results.
This study has significance both in theory and practice. First, we introduce a data-driven research methodology aimed at measuring, evaluating, and pinpointing the coupling and coordinated development of industrial enterprises’ carbon emission efficiency and the digital economy. This method gradually carries out the research according to the logical steps of model construction, data collection, data analysis and application, making the logic of the research more scientific and close. We comprehensively use the entropy weight method, the DEA model and the complex system cooperation degree model, which will provide a more scientific and reasonable method system for related research. Our data come from the statistical yearbook, which is more objective and reliable. We establish an index system that assesses the coordinated development degree of carbon emission efficiency and the digital economy. The index system we construct has good advantages in data availability, novelty of variables, comprehensiveness of the whole index system, and so on. This study provides a reference for industry and digital-economy-related evaluation research, and endeavors to enhance the theoretical understanding of low-carbon development, as well as coupling and coordinated development. Second, in practice, the research provides a quantitative foundation for policymakers to formulate pertinent regulations, and offers practical decision-making insights for individuals and organizations engaged in industrial carbon emission reduction and digital economy initiatives.

2. Materials and Methods

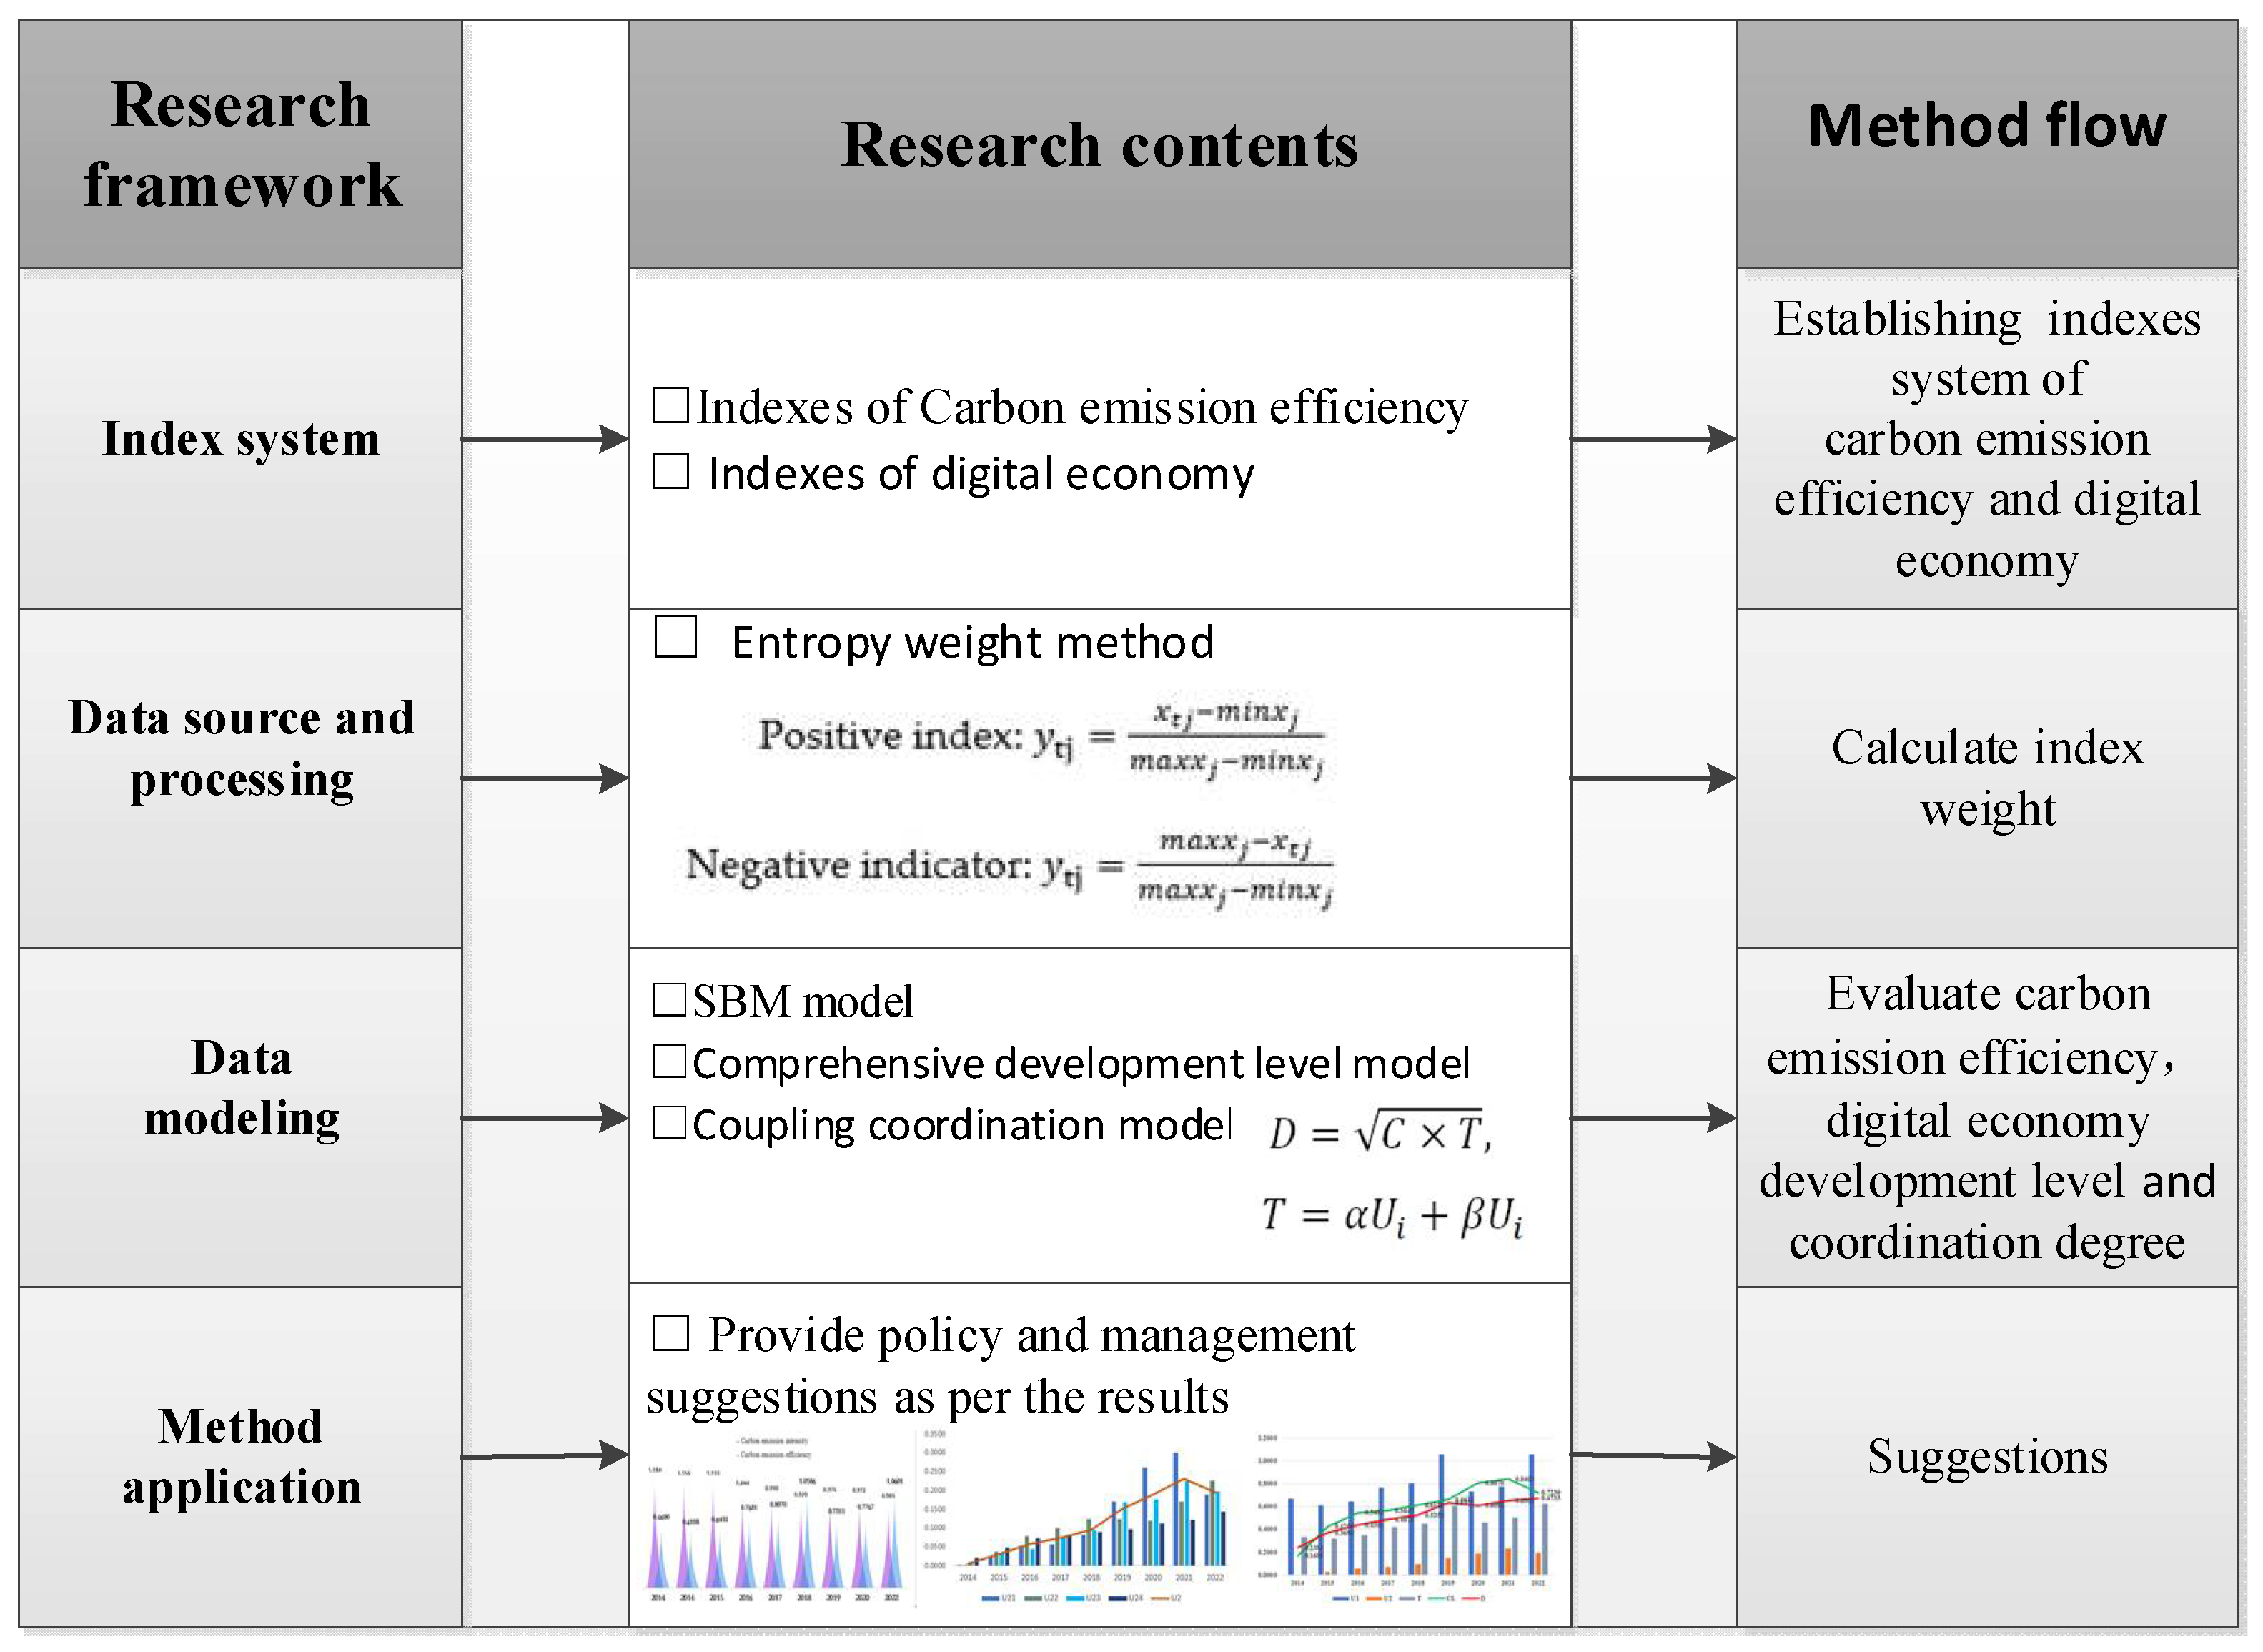
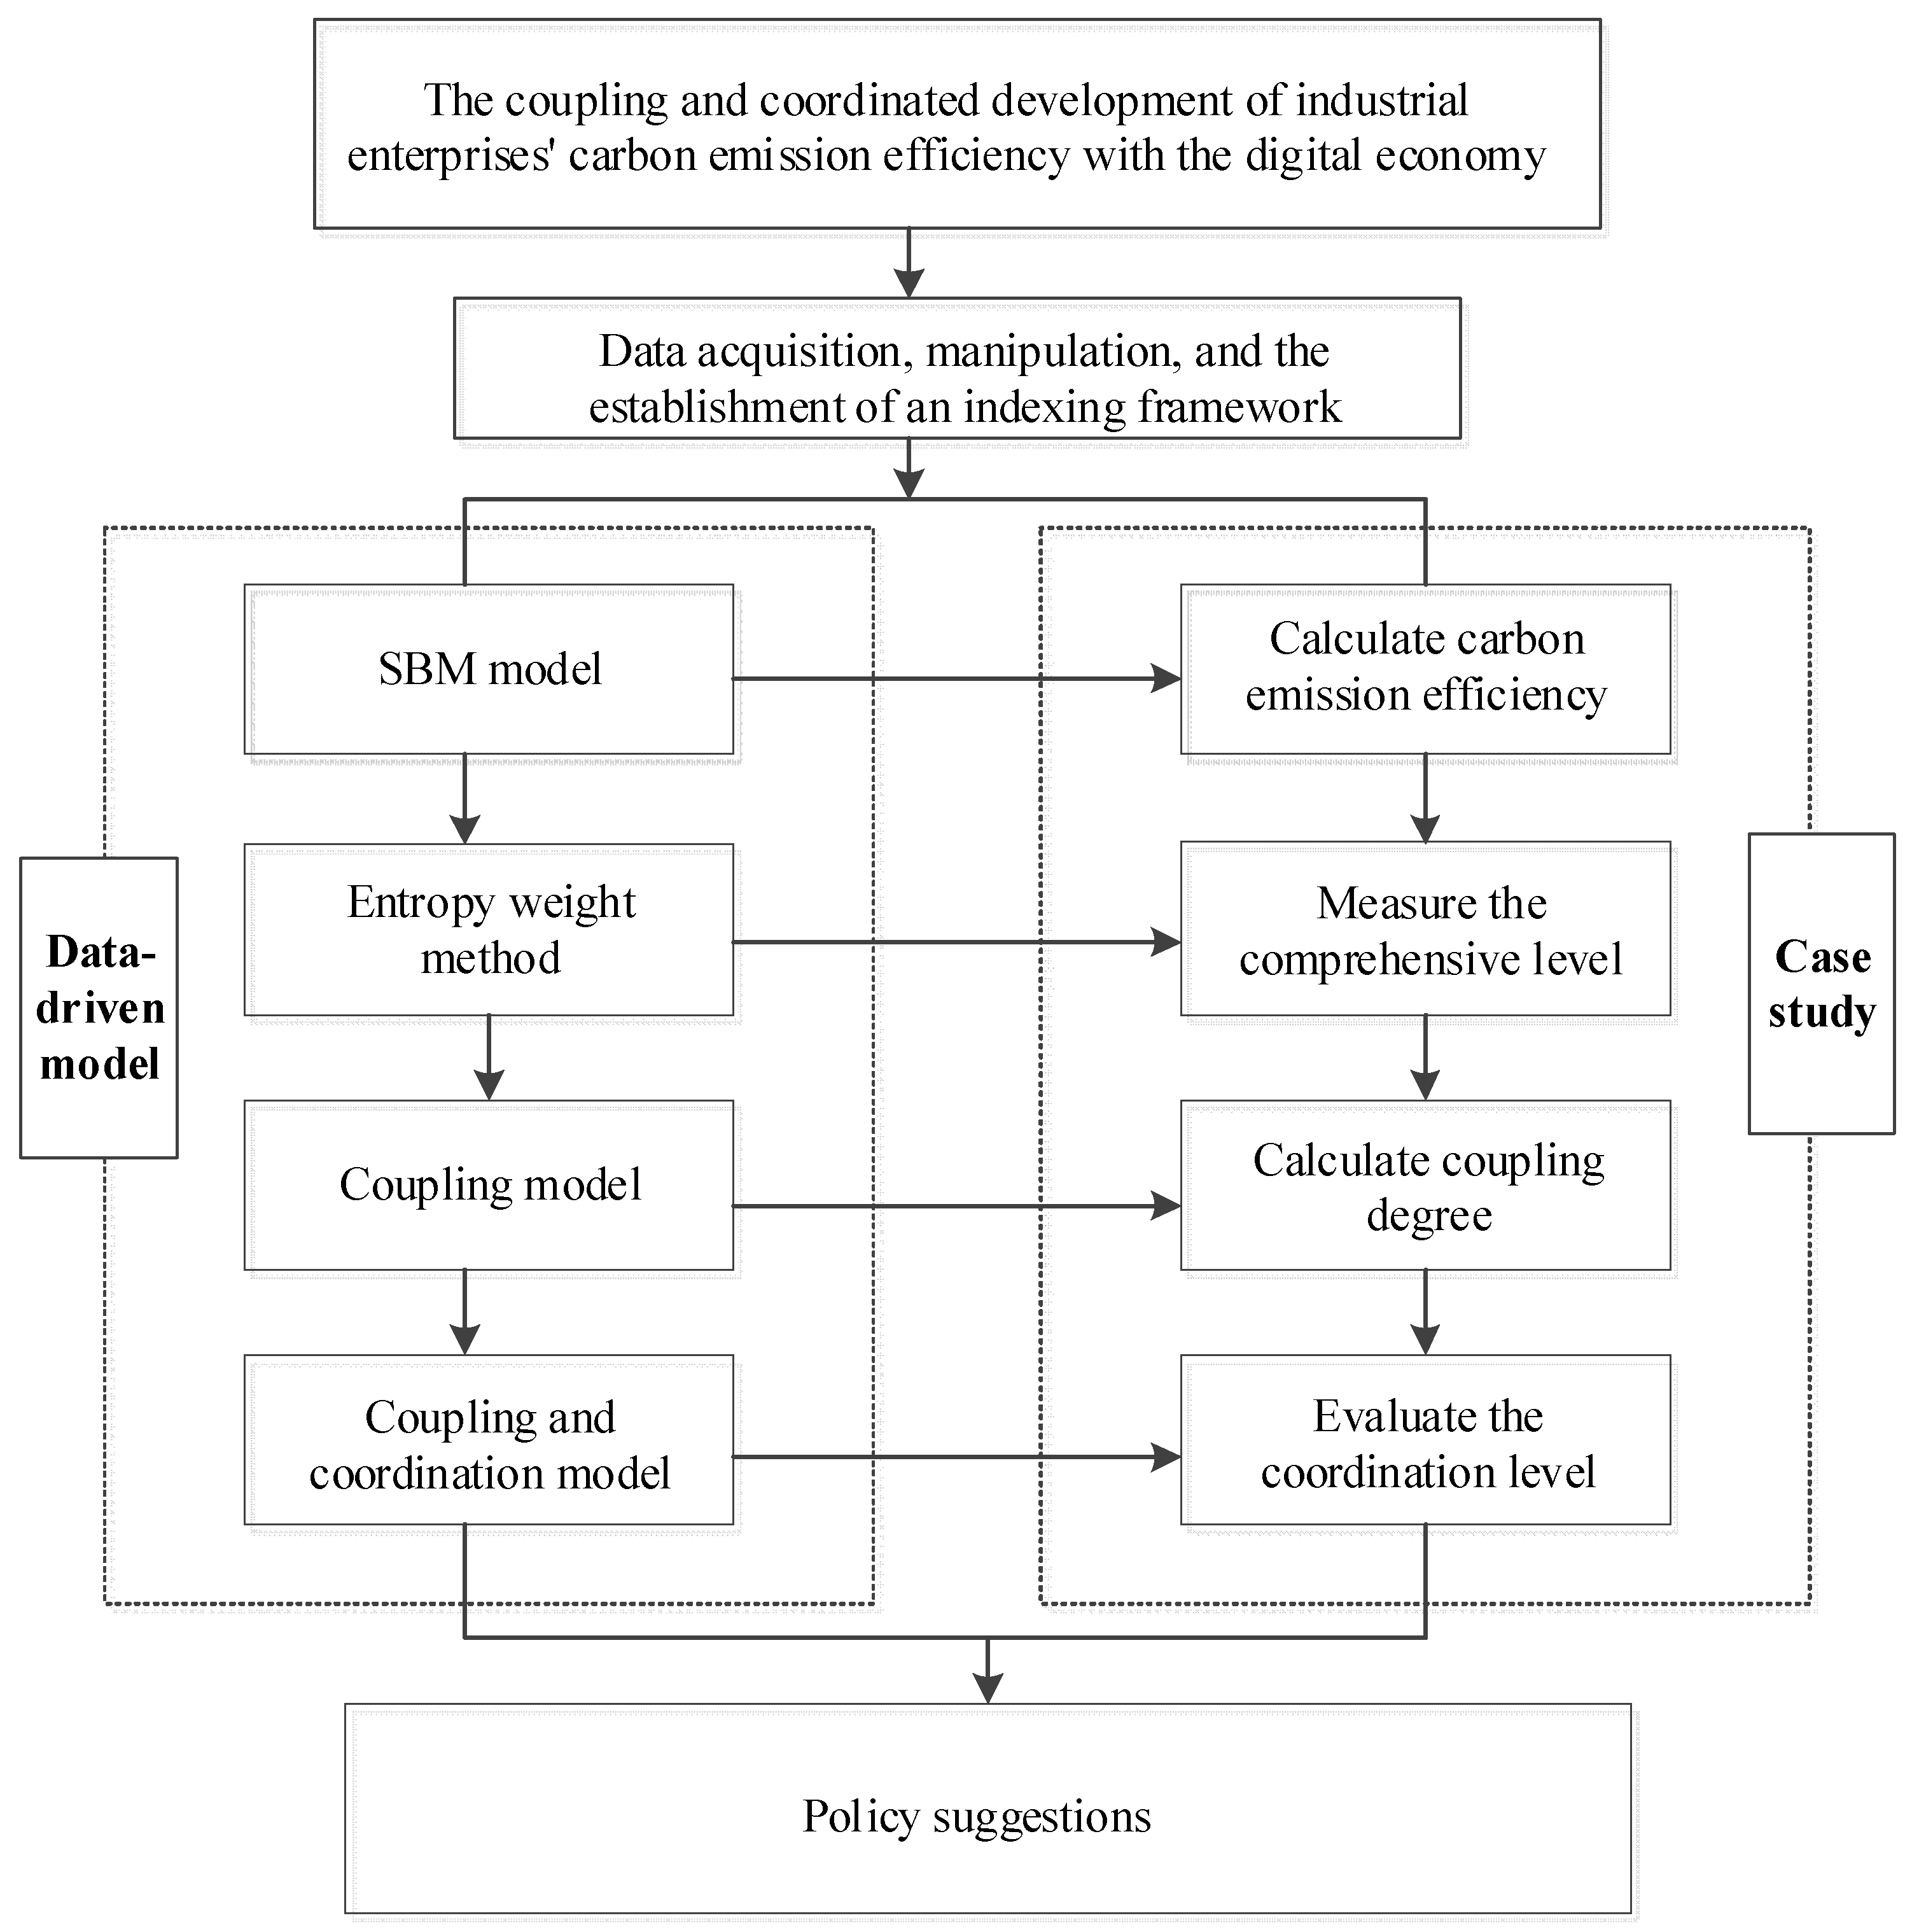
2.1. Research Framework

In the article, a logic method of data-driven was developed. Through processes such as data collection, processing, and modeling, we proposed actionable policy recommendations. In this study, the super-efficiency slack-based measure (SBM) model was employed to objectively assess industrial enterprises’ carbon emission efficiency, ensuring a more precise and unbiased evaluation. The entropy weight method was employed to empower and assess the digital economy’s advancement level, eliminating errors caused by the inconsistency of index dimensions, and evaluating the coordinated development degree by establishing coupling-coordination degrees. Based on these findings, suggestions were proposed to foster the coupling and coordinated advancement of the two. The sequential steps of this methodology are illustrated in Figure 1.

2.2. Index System

Most scholars believe that capital, manpower, and energy consumption are the most important input production factors [30,42,44], and each province is expected to obtain the maximum output and minimum carbon emissions. Therefore, business income and carbon emissions are selected as expected and non-expected output indicators [42,44,70]. Currently, there is a lack of a standardized framework for evaluating the digital economy. Various researchers have adopted distinct approaches, such as Liu and Wang [71], who assessed it based on internet penetration, workforce size, internet-related output, and inclusive finance development. Liao and Yang [72] constructed an index system encompassing infrastructure, development, and innovation aspects. Wei and Hou [73] focused on four key aspects: the digitization of industries, the industrialization of digital technologies, digital governance practices, and the valuation of data assets. Similarly, Guo et al. [69,74] devised an index system incorporating digital infrastructure, digital industrialization, technological innovation, and industrial digitalization.
Drawing upon the outcomes of prior investigations into carbon emission efficiency [30,42,44] and digital economy connotations and measurement [70,71,72,73,74], the indicators were selected in accordance with the principles of science and quantification. The index system, including 26 variables, was built.
The carbon-emission efficiency system index includes two aspects: input and output. The input index is selected based on three aspects: capital, labor, and energy. The output index includes economic benefits and environmental pollution as the expected and unexpected outputs, respectively. Compared with the indices used in previous studies [30,42,44], the average fixed asset investment is chosen as the capital index. The labor index is designated as the average count of industrial enterprises’ employees. The industrial enterprises’ energy consumption is designated as the energy index. The profit of industrial enterprises is designated as the expected output, whereas non-expected output is the carbon emission intensity of industrial enterprises above the designated size. The digital economy index system is based on existing research studies [70,71,72,73,74,75,76], encompassing aspects such as infrastructure development, digital innovation, digital industry advancement, and industrial digitization. The detailed index systems are outlined in Table 1.

2.3. Data Collection and Processing

The data regarding industrial enterprises’ carbon emission efficiency and the digital economy system were sourced from the relevant years’ editions of the China Internet Development Report and the Statistical Yearbook. In this study, nine years of data (2014–2022) from Anhui Province were used as statistical sample data. There are insufficient data for some indicators in 2021, and the missing-value processing method was adopted for completion [77]. The conversion of standard coal and the determination of carbon emission coefficients for fossil fuels were based on the guidelines provided by the Intergovernmental Panel on Climate Change (IPCC) for National Greenhouse Gas Emission Inventories [78].

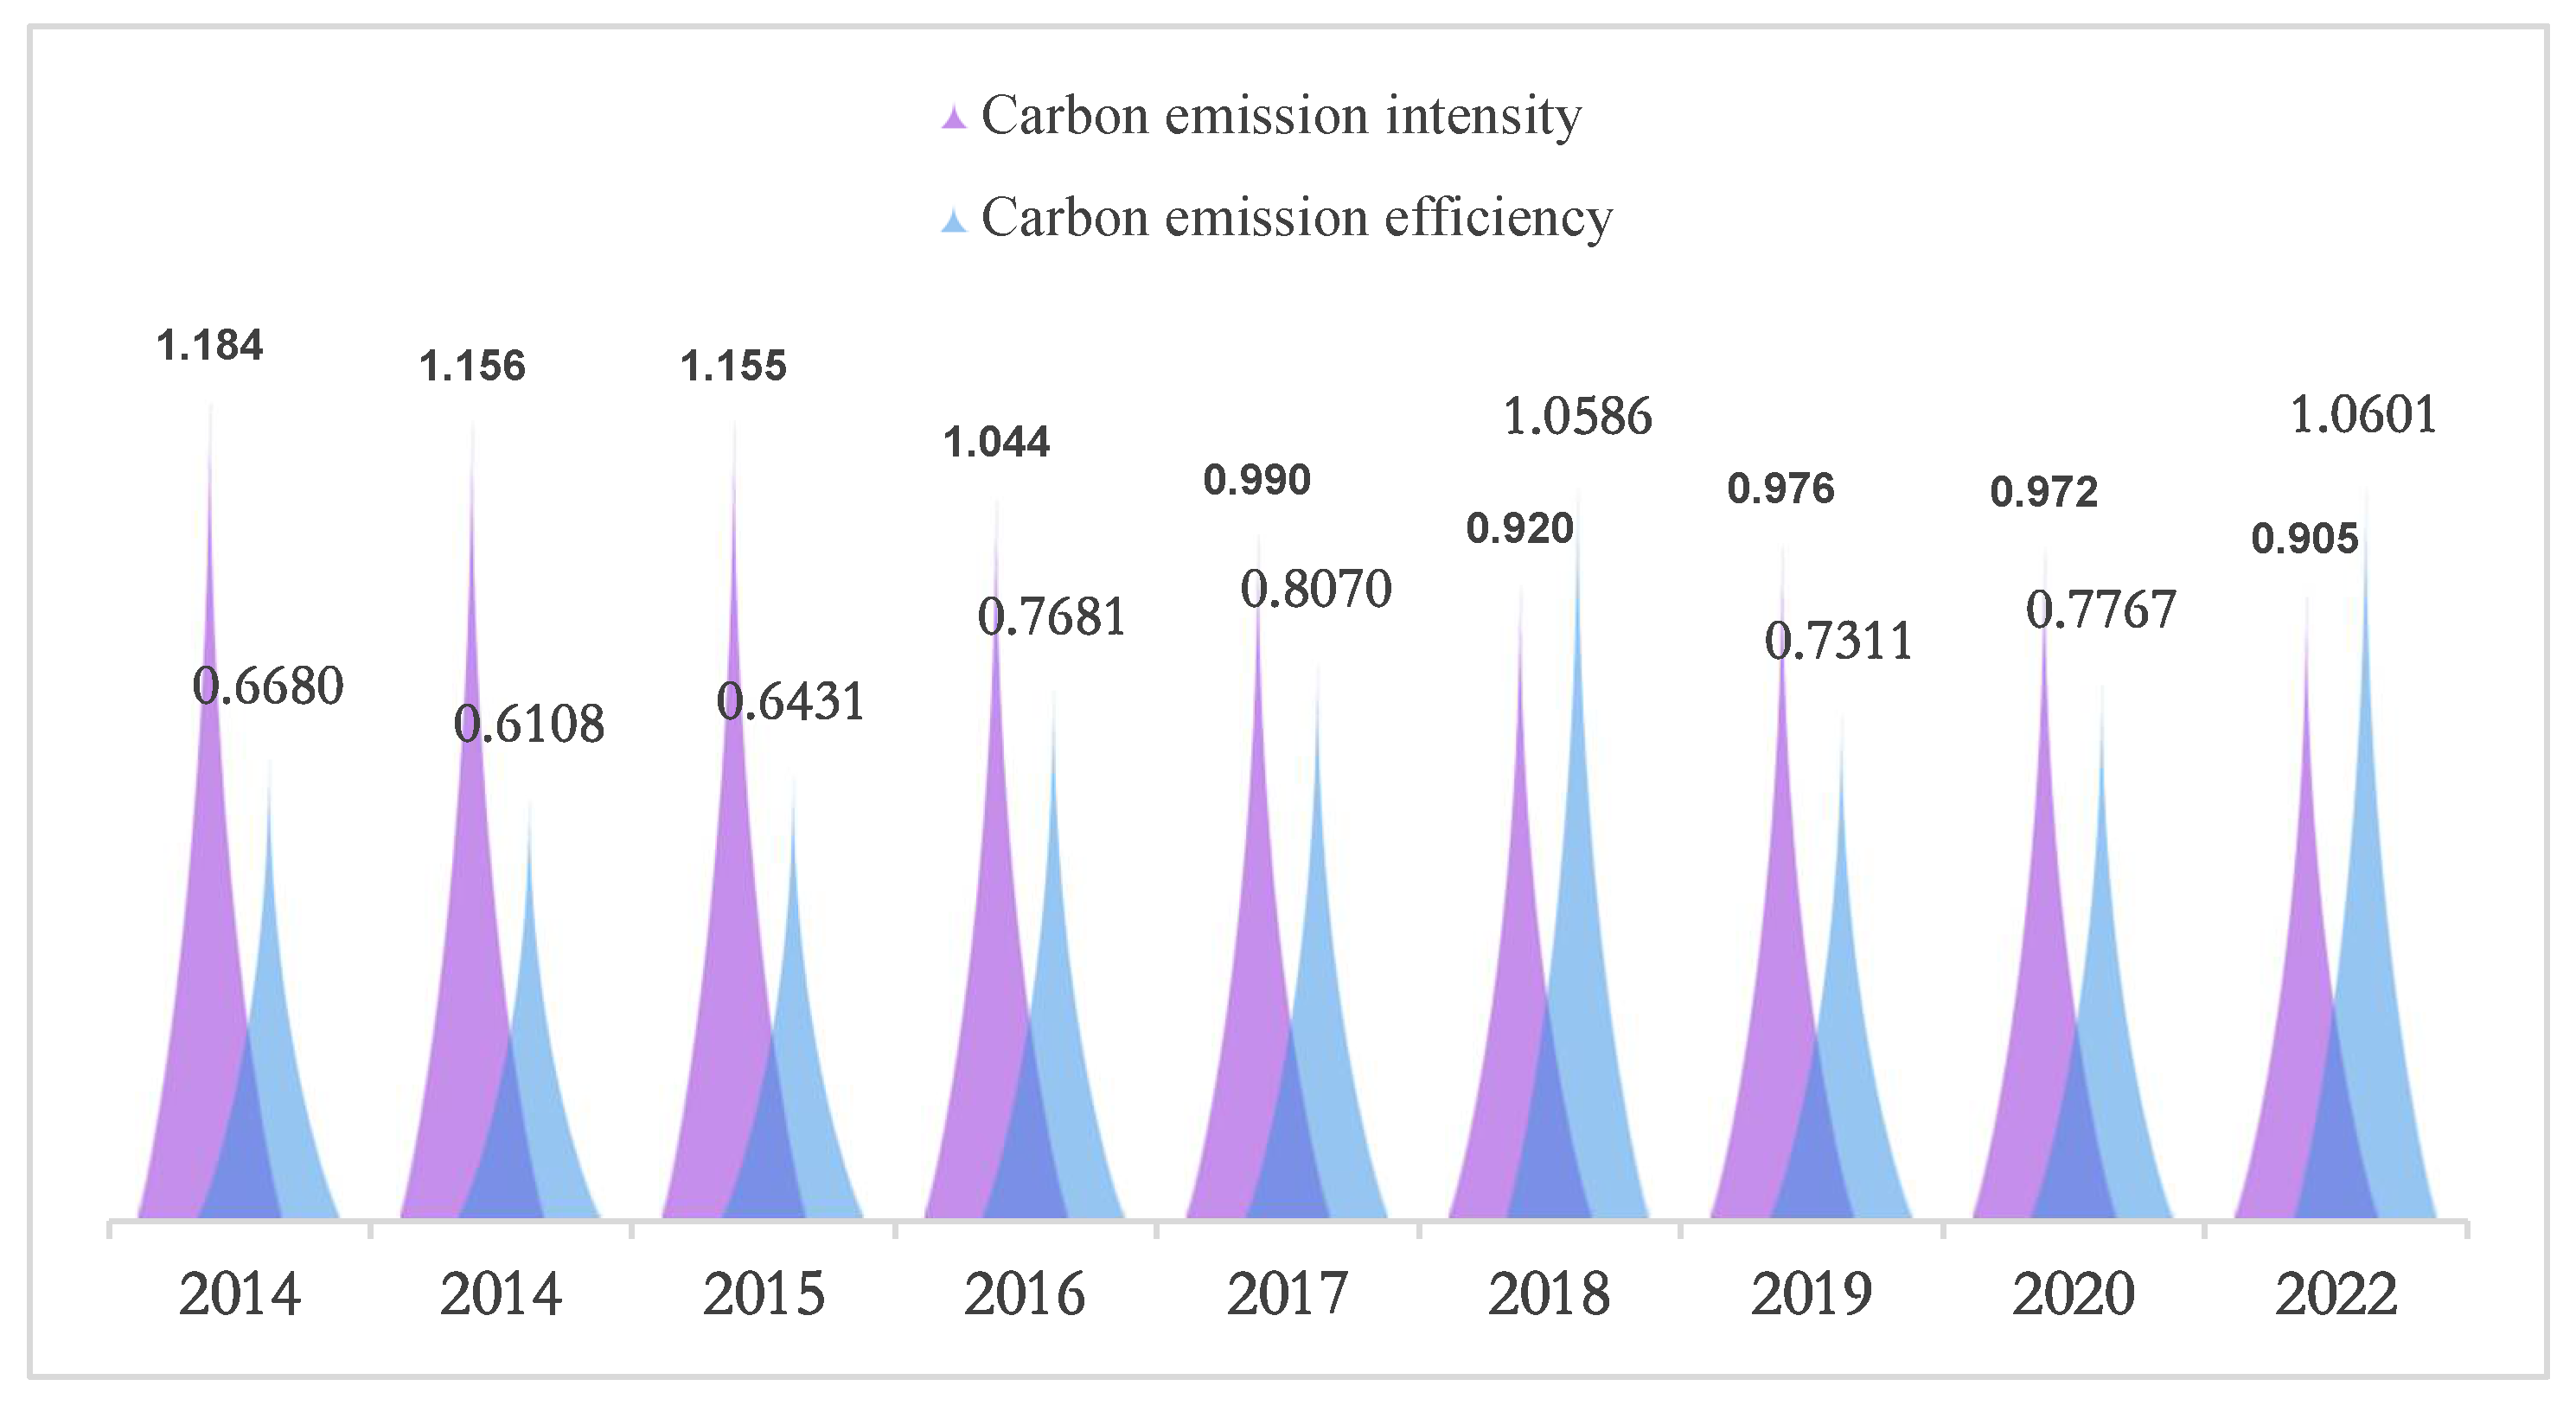
2.4. Calculating Carbon-Emission Intensity

The majority of carbon emissions stem from the consumption of fossil fuels. For the purpose of this study, six primary fossil energy sources were chosen: coal, coke, crude oil, gasoline, diesel, and natural gas [79]. The calculation of carbon emissions was conducted using the methods outlined by the IPCC in their guidelines (2006) [80]. Carbon emissions from fossil fuel consumption were calculated as Formula (1):
C = j = 1 6 E j   ×   S C C j × C E F j
where C is carbon emissions from fossil fuel consumption per 10,000 tons; j = 1, 2, …, 6 is the type of energy; S C C j represents the standard coal and C E F j represents the carbon emission coefficient of the j-type fossil energy, respectively.
The values of S C C j and C E F j are presented in Table 2:
Carbon emission intensity, a key metric for assessing the progress of an economy towards low-carbon development, refers to the quantity of carbon dioxide emissions produced per unit of GDP. This index is determined through the application of Equation (2):
I C = C G D P
IC represents the carbon intensity, while C denotes carbon emissions resulting from fossil fuel consumption. The carbon intensity result was utilized as an undesirable output in the calculation of carbon emission efficiency.

2.5. Calculating Index Weights of the Digital Economy System

To eliminate the bias of factors (e.g., subjective weight), the entropy weight method [81] was used to assign weights to the indices to assess the advancement of the digital economy. The calculation steps are outlined as follows.
First, dimensionless standardization of the raw digital economic data was performed using the range standardization method. Separate algorithms were employed for positive and negative indicators. The calculation formulae for this process are provided as follows:
Positive   index :   y t j = x t j m i n x j m a x x j m i n x j
Negative   indicator :   y t j = m a x x j x t j m a x x j m i n x j
where x t j and y t j ,   respectively, represent the data of the year t and index j of the digital economy subsystem (t = 1, 2, …, n; j = 1, 2, …, m) before and after dimensionless standardization. To avoid a situation of 0 and 1 after standardization, the result deviates from the actual value. Here, the m a x x j is 1.01 times the maximum value of the “j”th index data in the digital economy system, while m i n x j is 0.99 times the minimum value. It can be calculated using Equations (5) and (6), as follows:
m a x   x j = 1.01     m a x   x t j
m i n   x j = 0.99     m i n   x t j
The specific gravity P i j of the jth index Y t j in year t was then calculated as follows:
P t j = Y t j Y t j
The entropy e j of the index j is is subsequently computed utilizing Formula (8), as demonstrated below:
e j = k P t j
Given that k > 0, k = ( 1 / l n n ), where n represents the year, and e j 0 .
The calculation of entropy redundancy g j for index j is as follows:
g j = 1 e j
Finally, weight w j of indicator j is derived using the following formula:
w j = g j / g j
The index for each system was objectively weighted and then they were used to calculate the comprehensive advancement status of the digital economy.

3. Data Modeling

3.1. Calculation Model for Carbon-Emission Efficiency

The Data Envelopment Analysis (DEA) model is a non-parametric approach employed by researchers both domestically and internationally to evaluate the efficiency of similar decision-making units (DMUs) by analyzing their inputs and outputs. However, the traditional DEA model is unable to calculate the efficiency value of a DMU, whereas the super-efficiency DEA model can overcome these limitations. However, all DEA models are based on the radial method. All of them fail to consider the relaxation of both input and output. The super-efficiency SBM model adopts the nonradial method to measure efficiency, which can solve the problem of biased conclusions owing to different radial and angle selections [30,42,44]. Therefore, for the purpose of measuring efficiency in this study, we utilize the super-efficiency SBM model. The formula for calculating is shown in Equation (11):
m i n   ρ = 1 1 m i = 1 m s i _ x i k 1 + 1 q 1 + q 2 ( r = 1 q 1 s r g y r k g + r = 1 q 2 s r b y r k b ) s . t . X λ + s = x k Y g λ s g = y k g Y b λ + s b = y k b s , s g , s b , λ 0
ρ represents industrial enterprises’ carbon emission efficiency. When ρ = 1, it has reached the optimal frontier. A higher value of ρ indicates higher efficiency. K = 1,2, …, n, and, additionally, n denotes the overall amount of decision units. Within each DMU, m denotes the number of input elements, q 1 represents the number of expected output elements, and q 2 signifies the number of non-expected output elements. For a given DMU, x i k denotes the input vector, and y r k g denotes the expected output vector. y r k b represents the non-expected output. The matrices X, Y g and Y b ,respectively, represent the inputs, expected outputs, and non-expected outputs. λ is the column vector. The relaxation variables for input, expected output, and unexpected output are denoted as s , s g , s b .

3.2. Development-Level Measuring Model

In order to ascertain the carbon emission efficiency of industrial enterprises and gauge the comprehensive development level of the digital economy, we employed a multi-objective linear weighting approach. Formula (12) outlines the detailed computational procedure for this assessment:
U i = j = 1 m w j Y t j
A larger value of U i indicates a higher level of carbon emission efficiency for industrial enterprises (or a higher level of comprehensive development in the digital economy).

3.3. Model of Coupling Degree and Coupling-Coordination Degree

Coupling refers to the phenomenon in which two or more systems or modes of motion exhibit a mutual influence on each other through various interactions, leading to an interconnected and dependent relationship [69]. Coupling degree signifies how much a system or its elements influence another. The coupling degree is defined as the interaction degree between industrial enterprises’ carbon emission efficiency and the digital economy through coupling elements, representing the extent of interaction between the two systems. Based on this formula, we calculated their coupling degree using Equation (13):
C L = 2 U 1 U 2 2 U 1 + U 2
U 1 signifies the status or extent of the carbon emission efficiency system, while U 2 represents the developmental stage achieved by the digital economy. Coupling degree, denoted as CL, has a value that ranges from 0 to 1. There is a stronger correlation between the two systems if the CL value is larger and if they are closer to orderly development. In contrast, the two systems are more disordered.
However, there is a situation in which the degrees of comprehensive development of two systems are both low and close to each other, and their coupling degree is still high. Therefore, constructing a coupling-coordination degree model that precisely reflects the interaction levels between the two systems is crucial. It was used to assess the coupling-coordination development level of the two systems. The formulae are shown in Equations (14) and (15).
T = α U 1 + β U 2
D = C L × T
CL represents the coupling degree calculated from Equation (13), while T denotes the comprehensive development level of the two systems. The weights α and β are assigned to systems U1 and U2, respectively, and primarily measure their contribution degree. α and β have a sum of 1. Given the current status of the global economy, both industrial enterprises’ carbon emission efficiency and the digital economy contribute equally to economic and social development, hence the weights are set to be equal to 0.5. D is the degree of coupling coordination between the two systems. Its value is within the range [0, 1]. The larger the D, the more coordinated the two, and the closer the degree of mutual promotion between them. By contrast, the coordination between the two worsens.
Referring to relevant studies [45,52], the coordination state between industrial enterprises’ carbon emission efficiency and the digital economy is categorized into several levels, which are presented in Table 3.

3.4. Data Application

The global digital economy is rapidly developing. All industries should accelerate traditional industries’ development, integrated with the digital economy, constantly transforming or upgrading to achieve core competitiveness. The advancement of the digital economy contributes to reducing carbon emissions and fostering the coordinated development of the two, both of which are crucial for promoting high-quality regional economic development. The article provides a holistic view of the progression of industrial enterprises’ carbon emission efficiency and digital economy systems, establishing an evaluation index system comprising six primary indicators and twenty-six secondary indicators. This study first used the range method to process data to eliminate dimensions. The total-factor method was then adopted to measure carbon emission efficiency. This article aimed to precisely quantify the integration and coordinated growth level between the two systems. Drawing from its findings, the article offers recommendations intended to serve as decision-making guidance for professionals involved in both industrial enterprises and the digital economy. The data application process is as follows (Figure 2):
Second, the super-efficiency SBM model was applied to quantify industrial enterprises’ carbon emission efficiency, while the multi-objective linear weighting approach was utilized to calculate the advancement status of the digital economy. Furthermore, coupling degree and coupling coordination status were evaluated using the coupling-coordination degree model.
Finally, drawing upon these findings, the article proposes policy suggestions for both Anhui, China and other countries or regions.

4. Results

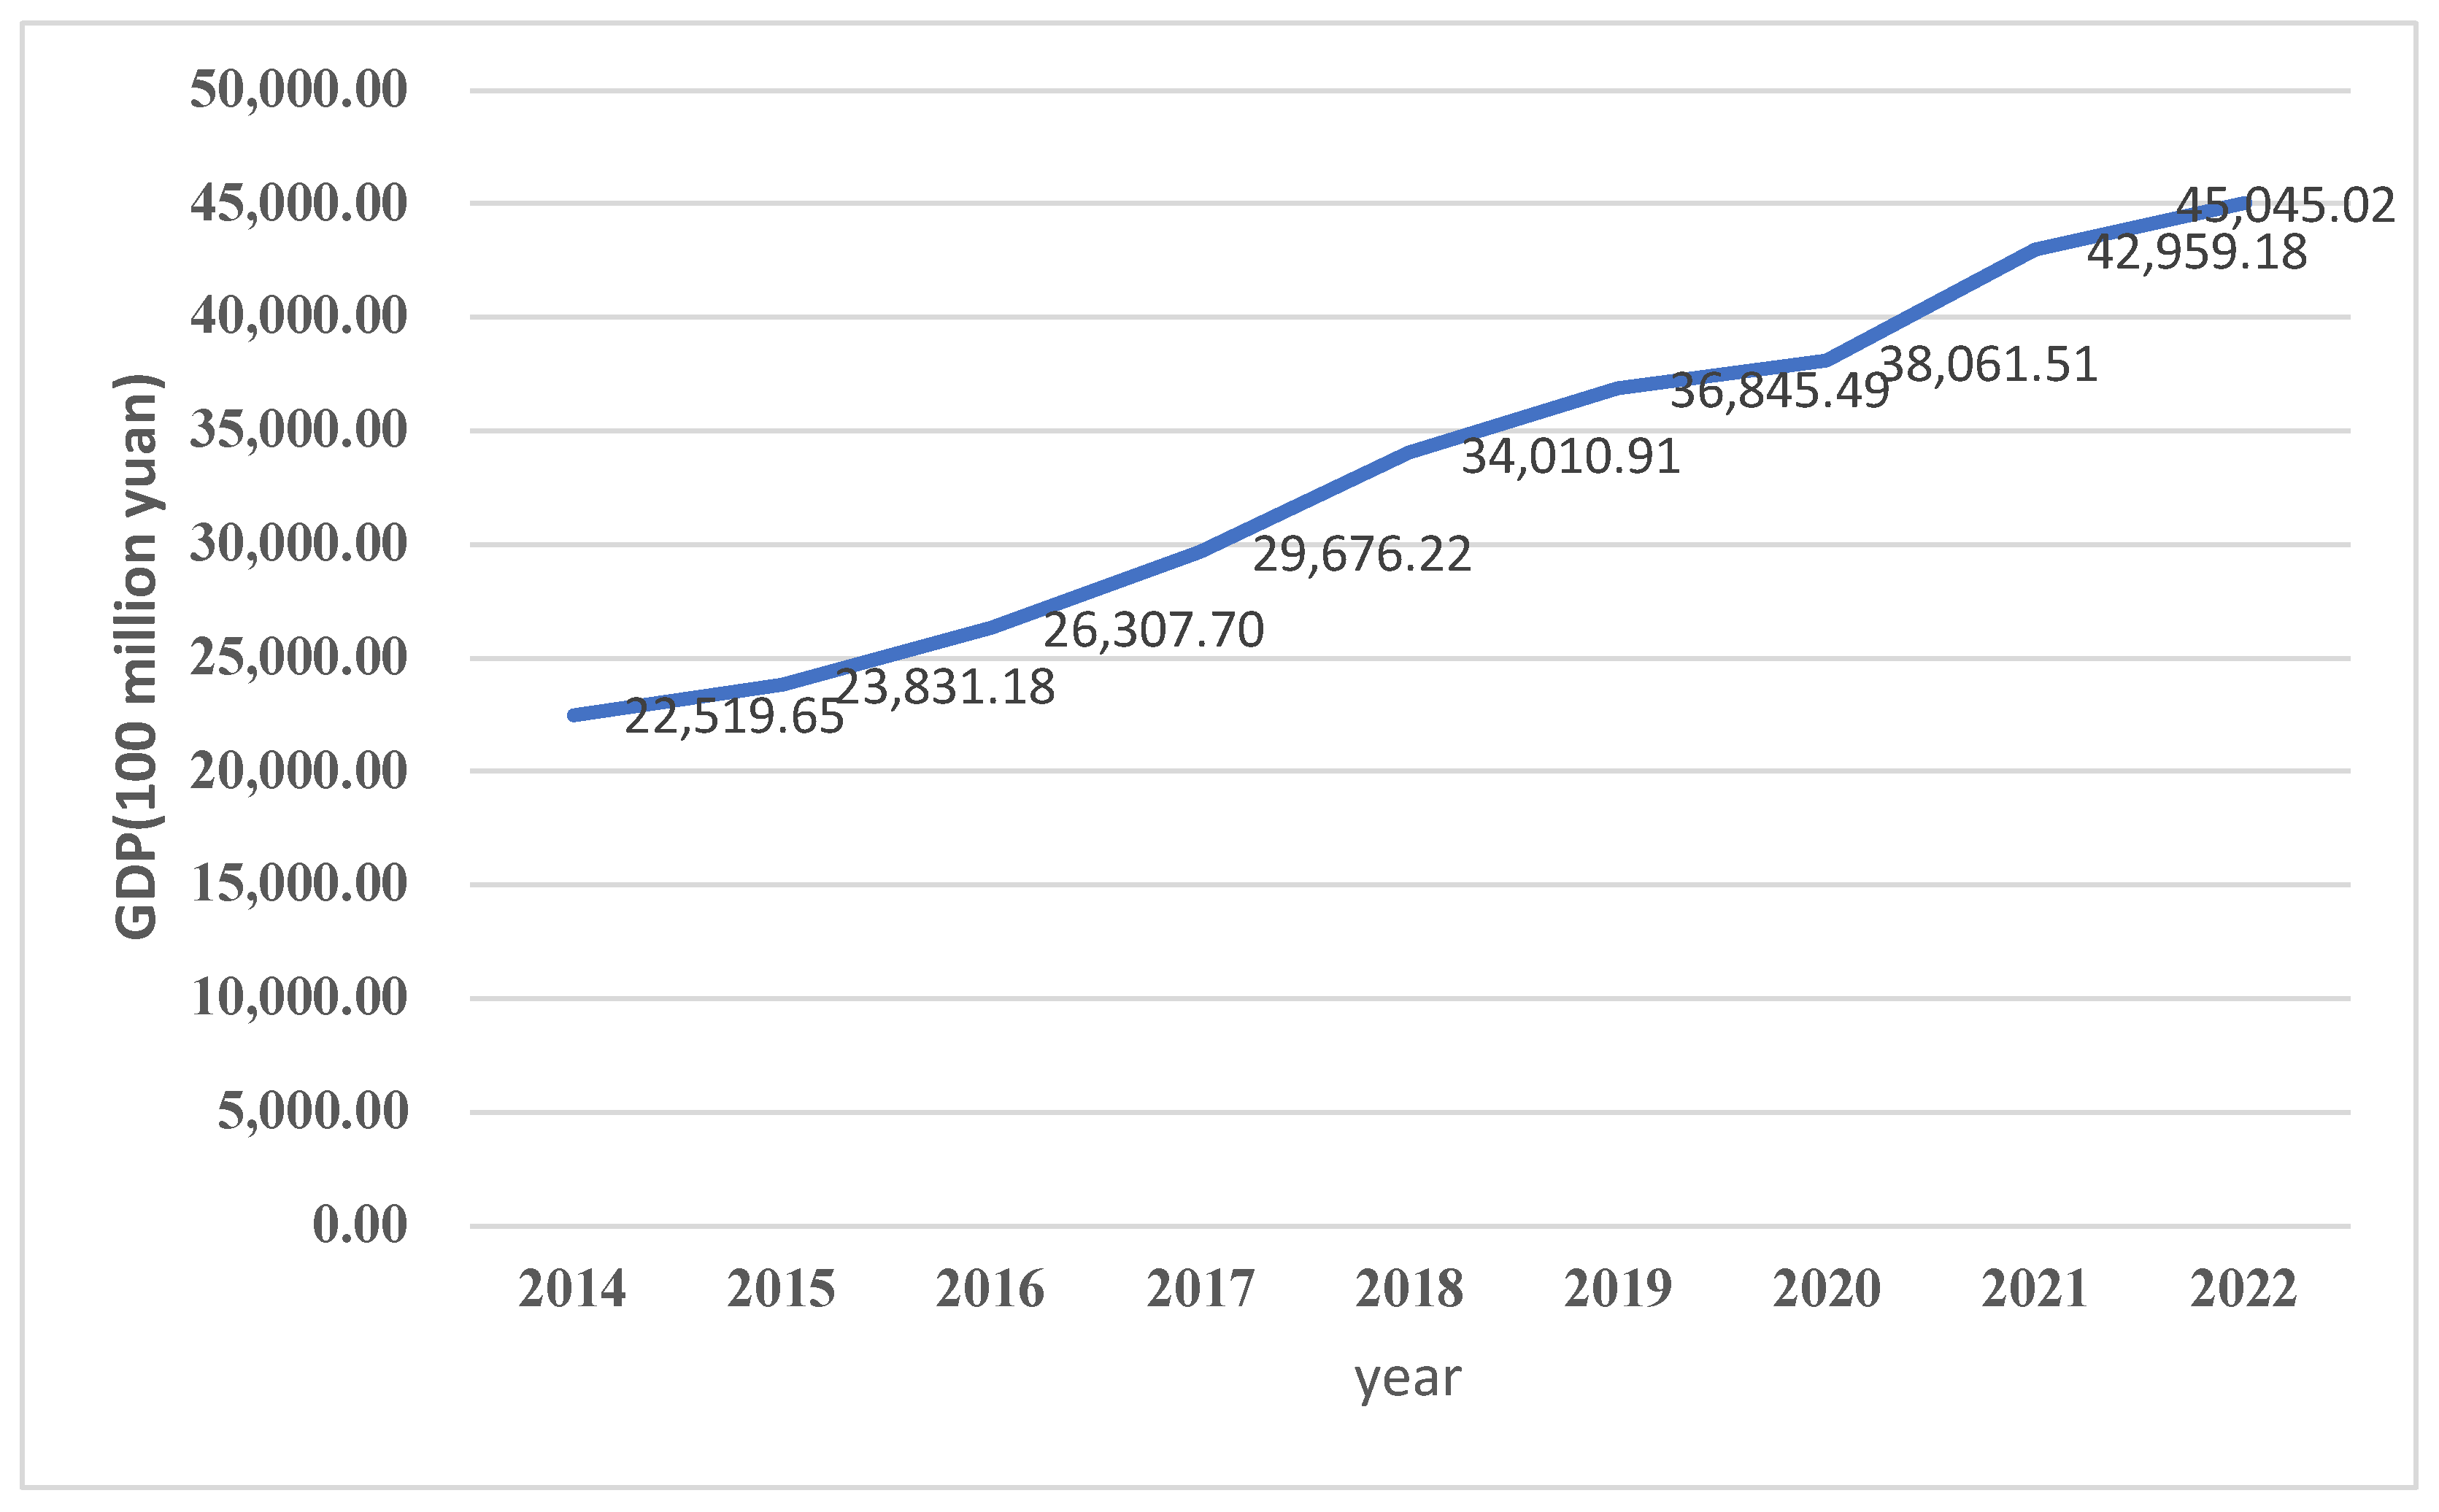
4.1. Study Case Introduction

This study delves into the synergistic development of carbon emission efficiency among industrial enterprises and the digital economy in Anhui, situated in the heart of China. It has been seamlessly integrated into the expansive advancement of the Yangtze River Delta region. It connects six provinces of Jiangsu, Zhejiang, Hubei, Henan, Jiangxi, and Shandong, with obvious location advantages. High-quality economic development significantly affects the development of surrounding areas. According to 2022 statistics, by the end of 2022, Anhui Province’s GDP had soared to CNY 4504.5 billion, while the profits generated by industrial enterprises exceeding the designated size amounted to CNY 238.66 billion. As of the conclusion of 2022, the aggregate energy consumption by industrial enterprises had reached 98.3544 million tons of standard coal. It becomes the main carbon emissions source. The value-added contribution of the sectors encompassing information technology services, information transmission, and software was CNY 106.3 billion, representing an increase of 7.6%. The number of fixed Internet broadband access users was 27.101 million, of which 24.77 million were fixed Internet optical-fiber broadband users, with an increase of 2.925 million. However, additional investigation is imperative to ascertain whether industrial enterprises’ carbon emission efficiency is in coordination with the progression of the digital economy. Drawing from the findings, this study offers recommendations for both Anhui and other countries or regions, which is very important for promoting the economy with high-quality development.

4.2. Analyzing Carbon-Emission Efficiency

Utilizing the data provided, the carbon emission efficiency and intensity were quantitatively determined through Equations (1), (2) and (11), as illustrated in Figure 3.
To demonstrate the economic development status, the GDP of Anhui Province from 2014 to 2022 is shown in Figure 4.
As seen in Figure 3 and Figure 4, the carbon emission intensity in Anhui Province followed a decreasing trend from 2014 to 2022, whereas the province’s GDP continued to grow. This shows that under the current economic development policy, a lower carbon emission intensity signifies a more favorable economic development scenario. The decrease in carbon emission intensity observed in 2021 compared to 2020 can primarily be attributed to the pandemic’s adverse impact on economic development, resulting in a slightly lower figure. The value of carbon emission efficiency fluctuated, exceeding 1 in 2018 and 2021, reaching the optimal frontier of development. The COVID-19 pandemic in 2019 and 2020 could have also contributed to the decline in carbon emission efficiency. By 2022, the economy had gradually regained momentum, leading to a slight increase in carbon emission efficiency, surpassing the pre-pandemic level of 2018.

4.3. Assessment and Analysis of the Digital-Economy Development-Level Measurement Outcomes

The entropy weight method was employed to process raw data in this article. Utilizing Equation (3) through (10), the weights for each index were determined, and subsequently, the advancement status of the digital economy was computed with Equation (12). The outcomes are presented in Figure 5.
Figure 5 depicts a steadily rising trend in the digital economy in Anhui from 2014 to 2021, reaching 0.2305 in 2021 at its highest level and declining to 0.1938 in 2022. The pandemic’s impact may lead to a decline in investments in digital infrastructure (U21) and the digital technology innovation level (U23), ultimately causing a reduction in the overall advancement level of the digital economy in 2022. Digital infrastructure investment (U21) was higher in 2020 and 2021, reaching 0.3001 in 2021, mainly due to the higher volume of post and telecommunications businesses during this period. The results show that the total system level is high only when the level of each subsystem is also high.

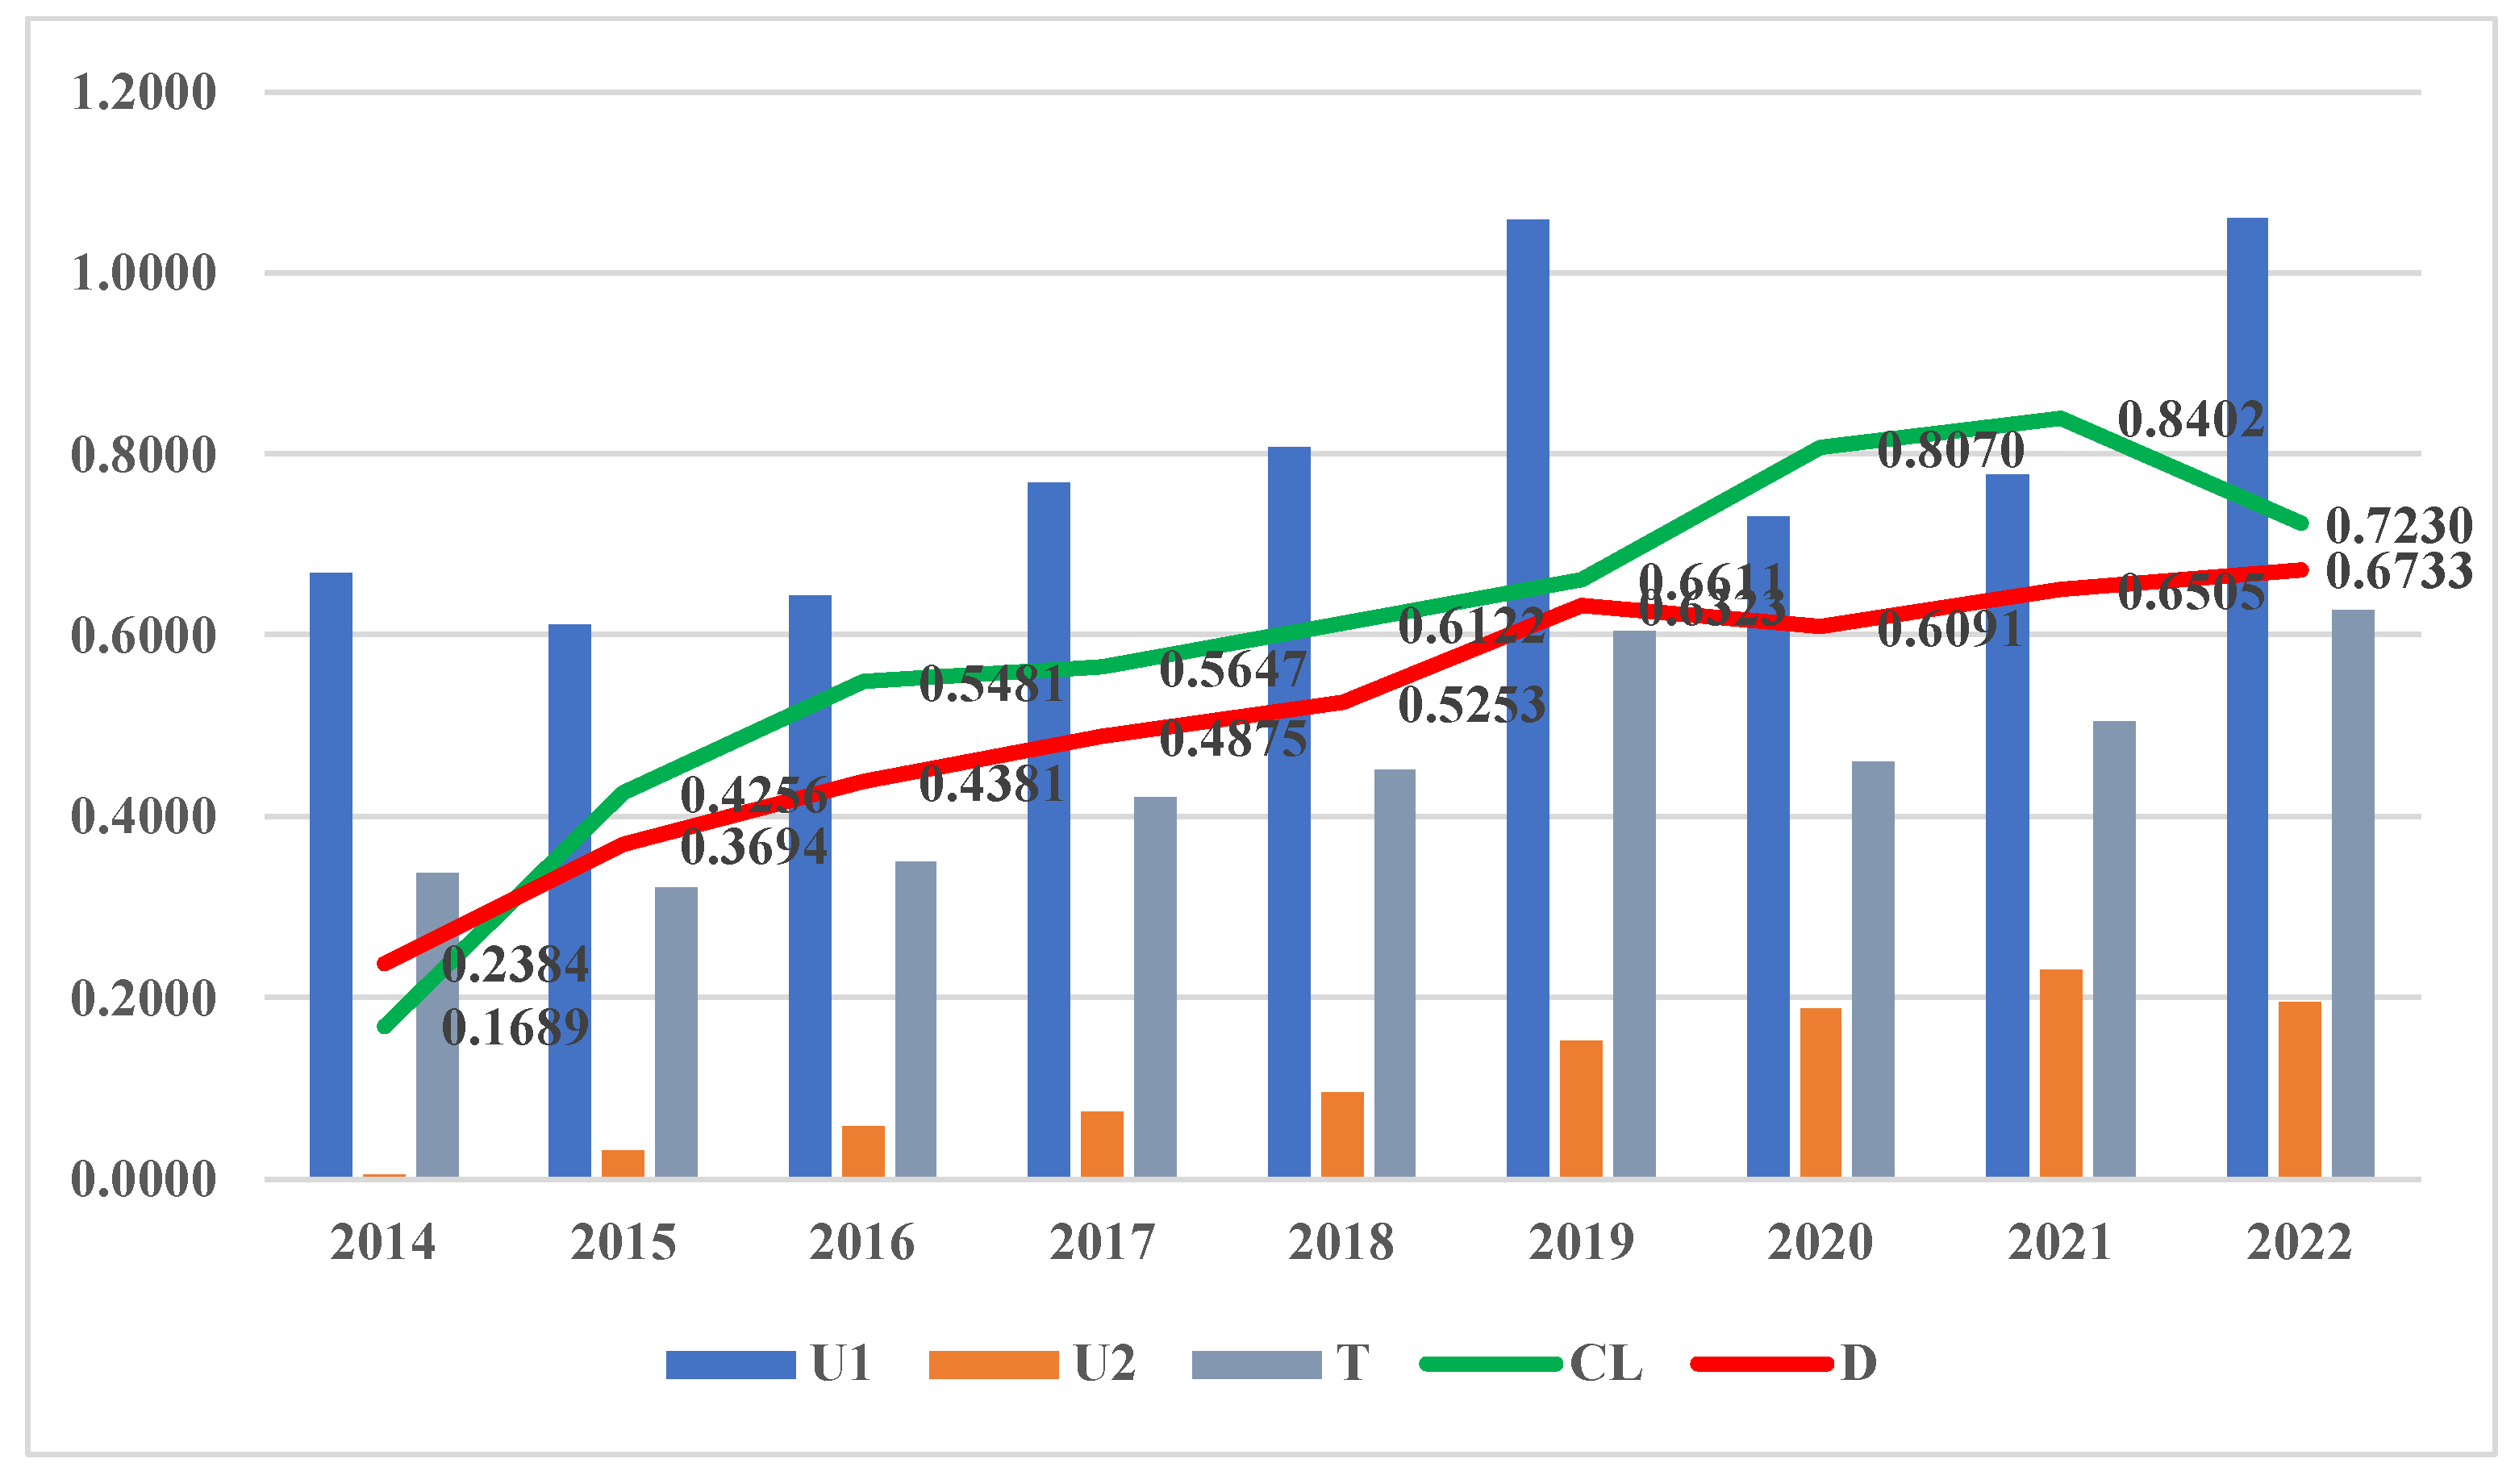
4.4. Analysis of Coupling Coordination between Carbon Emission Efficiency and the Digital Economy

The industrial enterprises’ carbon emission efficiency (U1) and the development level of digital economy (U2) in Anhui were input into Equations (13) to (15) to calculate their coupling degree (CL), comprehensive development level (T), and coupling coordination degree (D). These results are illustrated in Figure 6.
As shown in Figure 6, from 2014 to 2022, the carbon emission efficiency of industrial enterprises exhibited a fluctuating pattern, a continuously increasing trend from 2015 to 2019, and a significant decrease in 2020 and 2021. Between 2014 and 2021, the advancement status of the digital economy consistently improved, with a notable decline observed in 2022. However, the overall advancement status of the digital economy remained modest. Notably, in 2020 and 2021, while the digital economy expanded, the carbon emission efficiency experienced a decline. The COVID-19 pandemic might not have significantly impeded the digital economy’s growth, and, in fact, it could have contributed to a certain degree of acceleration in its development. Nonetheless, the pandemic had a pronounced influence on industrial enterprises’ carbon emission efficiency. COVID-19 has caused economic data distortion; many industrial enterprises have experienced production discontinuities, and local governments have temporarily lowered the requirements for reducing carbon emissions.
As depicted in Figure 6, the coupling degree between the two systems displayed a fluctuating trend from 2014 to 2022. The value was highest, at 0.8402, in 2021. However, the coupling-coordination degree at this time was 0.6505, which was not the highest value. In 2022, the CL declined, primarily due to the setback in the digital economy’s development level. The coupling-coordination degree between industrial enterprises’ carbon emission efficiency and the digital economy showed an increasing trend, reaching its highest value of 0.6733 in 2022. The overall comprehensive-evaluation index score generally trended upwards, with notable dips in 2020 and 2021, primarily attributed to the disruptions caused by the COVID-19 pandemic.
By analyzing Figure 6, which presents the coupling degree (CL) and coupling-coordination degree (D) between the two systems, alongside the distribution of carbon emission efficiency (U1) and the comprehensive advancement of the digital economy (U2), and by cross-referencing Table 3, we can discern the specific coupling and coordination patterns existing between these two systems. The coupling degree between industrial enterprises’ carbon emission efficiency and the digital economy in Anhui belonged to the low-level coupling stage in 2014, and the two gradually formed a coupling. At this time, industrial enterprises’ carbon emission efficiency was relatively high, and the digital economy had just begun to develop. As evident from Figure 6, when U1 exceeds U2, the coupling-coordination degree registers at 0.1689, indicating a state of severe discordance, with the digital economy lagging behind in its development. In 2015, the coupling degree was 0.4256, indicating an antagonistic period. The two systems promoted each other to a certain extent. However, their coupling-coordination degree was not high (0.3694), placing them in a mildly discordant stage. Between 2016 and 2019, the coupling degree of the two systems hovered within the range of 0.5 to 0.8, indicative of a smooth running-in phase. Despite favorable coupling development, the coupling-coordination degree remained modest. The coupling-coordination degree peaked at 0.6323 in 2019, signifying that the two systems had attained a primary level of coordination. In 2020 and 2021, the coupling degree exceeded 0.8, which corresponded to high-level coupling. The two were in the mutually reinforcing development stage, but their coordination levels were still not high, placing them at the primary coordination level. By 2022, the coupling degree was 0.7230, and the coordination degree was 0.6733. Despite achieving its highest coordination degree within the study period, it remained within the realm of being barely coordinated, where the carbon emission efficiency surpassed the advancement of the digital economy. In essence, this indicates that the digital economy’s growth was lagging behind.
In conclusion, the interplay between industrial enterprises’ carbon emission efficiency and the digital economy exhibits a pattern of high coupling but low coordination. Hence, there is a need to enhance the coupling-coordination degrees in Anhui. As efforts are made to advance both of the two systems, it is crucial to prioritize their coordinated development.

5. Discussion

Compared to the existing literature [30,42,44,82], the study boasts the following merits and contributions: firstly, the study establishes a comprehensive evaluation framework that assesses the coupling and coordinated development between industrial enterprises’ carbon emission efficiency and the digital economy. The index system includes a total factor index that reflects input and output levels. Four subsystems were devised to encapsulate the digital economy’s advancement status: digital infrastructure, digital industries, digital technological innovation, and industrial digitalization. Through the literature review, it is found that there is still little research on the measurement of the development level of the digital economy. There is no assessing index system that is generally highly recognized by researchers. Liu W. [71] evaluated the digital economy’s advancement status from four indicators: Internet penetration rate, number of employees, Internet-related output, and development of digital inclusive finance. However, each indicator was a single variable, which could not well cover the more abundant content of the digital economy system, and was difficult to accurately measure. Liao, X. et al. [72] measured three dimensions of infrastructure, industrial development and innovation. But each index only contained three variables, and some variables were no longer significant. Taking the variable of the number of Internet broadband-access households as an example, in China, with the increase in mobile users, the measurement of broadband-access data is no longer significant. Wei, L. et. al. [73] evaluated the digital economy’s development level from four dimensions, including “industrial digitalization, digital industrialization, digital governance and data value”. However, their index system is only for measuring the digital economy at the city level. The index is a little too micro, and is difficult to apply to a larger region. We constructed a measurement index system of the digital economy advancement status from four indicators, in which the digital infrastructure contained five variables, the digital industry contained six variables, digital technological innovation contained five variables, and industrial digitalization contained five variables. Therefore, the index system we build is more systematic and scientific. Secondly, the adoption of a data-driven approach [69,74] enables a more objective and scientific measurement and evaluation. This, in turn, offers valuable insights to inform decision-making processes. Lastly, this study proposes practical strategies to foster the coordinated progression of industrial enterprises, carbon emission efficiency, and the digital economy. This research holds practical implications for driving high-quality and sustainable regional economic development.
To attain low-carbon and high-quality growth for industrial enterprises, emphasis should be placed on strengthening digital transformation [42,44], embracing new technologies, fostering green technological innovations, and enhancing energy utilization efficiency [80]. The research on the European Union shows that the transformation of resource allocation brought about by the digital transformation of manufacturing enterprises gives birth to a more personalized and flexible production mode [83]. Research into new economies indicates that the digital economy plays a pivotal role in bolstering the economy, energy sector, and climate, by efficiently facilitating carbon reduction efforts. [84]. An exhaustive analysis spanning 21 years of data from 66 diverse countries has revealed a substantial and favorable influence of the digital economy on environmental resilience. [85]. A comprehensive study examining 25 years of data from the G7 Group reinforces the notion that the digital economy possesses the capability to reduce carbon emissions while simultaneously and significantly propelling economic growth [86]. An in-depth analysis of 14 years of data from the European Union, the USA, and China underscores the effectiveness of innovative endeavors within the digital economy in curbing carbon emissions [87]. Studies in selected African and Asian countries show that the application of digital technologies promotes the sustainability of industrial production and has a positive influence on environmental sustainability [88]. Efficient advancement of industrial enterprises underpins the advancement of the digital economy, which in turn benefits digital industries and infrastructure. By exploring and harnessing the reciprocal influence between these two subsystems, we can foster industrial integration and sustainable development, ultimately propelling the progress of the regional economy.
The synchronized growth of industrial enterprises’ carbon emission efficiency and modern information technology necessitates a clear understanding of the various factors that mutually influence, interact with, and shape their development status. Such insight enables the formulation of more precise countermeasures, effectively supporting the relevant governments and enterprises in their endeavors. Industrial enterprises are the primary source of carbon emissions. Utilizing digital technology and efficiently mitigating carbon emissions are pivotal strategies in attaining carbon neutrality and peaking targets [13]. These efforts are fundamental for fostering high-quality, environmentally sustainable, and socially responsible economic development [37]. Consequently, a thorough investigation into the coupling and collaborative growth dynamics between the two systems is highly warranted.

6. Suggestions

Drawing upon the research findings and subsequent discussions, we present tailored recommendations for Anhui, China, as well as other countries or regions.

6.1. Suggestions on Coupling and Coordinated Low-Carbon Development of Industrial Enterprises and the Digital Economy for Anhui, China

Between 2014 and 2022, Anhui witnessed an upward trajectory in the overall development of both industrial enterprises’ carbon emission efficiency and the digital economy. In particular, industrial enterprises’ carbon emission efficiency showed fluctuating growth, and the starting point of the digital economy was low, but grew rapidly. Thus, industrial enterprises’ carbon emission efficiency and the digital economy in Anhui are characterized by high coupling but low coordination. We offer policy recommendations for Anhui, China.

6.1.1. Enhance Industrial Enterprises’ Carbon Emission Efficiency and Boost the Comprehensive Development of the Digital Economy

For coupling and coordinated development to occur, it is imperative that each system attains a high level of development, thereby fostering an elevated degree of coordination in the overall development process. Notably, in both 2019 and 2022, industrial enterprises’ carbon emission efficiency in Anhui surpassed a significant benchmark of 1, reaching the optimal frontier; however, the total development level of the digital economy fluctuated at approximately 0.2. Although carbon emission efficiency reached the optimal frontier, coupling and coordinating development was still low, floating around 0.6, and the advancement of the digital economy was delayed. The Anhui government ought to prioritize bolstering the holistic development of both systems, with a particular emphasis on fostering the digital economy, to guarantee a higher level of coordinated development between them. Specific efforts can be made, such as accelerating the construction of 5G networks, promoting the construction of advanced computing centers and, by establishing data center clusters in Hefei and Wuhu, a robust digital infrastructure can be laid to underpin the growth of industrial enterprises and digital economy; moreover, expediting the expansion of the electronic information manufacturing sector and providing support for the establishment of big data industrial parks across Hefei, Wuhu, Suzhou, Huainan, and other cities. The same level of policy support should be provided for low-carbon development of industrial enterprises and digital economy. Policymakers should capitalize on the pivotal opportunities presented by the Yangtze River Delta’s integrated development strategy. They should devise a comprehensive plan that integrates the industrial and digital economy sectors into the region, thereby enhancing the coordinated development of the two in Anhui, China.

6.1.2. Intensify Efforts to Accelerate the Digital Economy’s Growth, with a Particular Focus on Industrial Digitization

As evident from Figure 5 and Figure 6, the digital economy’s development remained relatively modest, with its peak level in 2021 reaching merely 0.2305, while the level of industrial digitization lagged behind, achieving a mere 0.1215. The digital economy plays an increasingly significant part in low-carbon economy development. To achieve carbon peaking and neutrality, Anhui must capitalize on the opportunities presented by digitalization, prioritize developing digital industries, and foster the integrated growth of traditional and digital industries. Simultaneously, it is vital to uphold the sustainable development concept and facilitate the synchronized development of industrial digitalization and greenization. Policymakers should implement national policies to promote low-carbon transformation and the digital economy advancement, strengthen efforts towards the digital transformation of industry, and increase investments in digital technology innovations. Furthermore, they should accelerate the construction of key and specialized research institutions for digital technology and artificial intelligence, actively promote the application of research results, vigorously support digital industrial clusters, and support the blossoming of Chinese Sound Valley leading enterprises, such as iFlytek. Enterprises are encouraged to conduct various forms of e-commerce and realize electronic sales and procurements.

6.1.3. Promote Coupling and Coordinated Development of Industrial Enterprises’ Carbon Emission Efficiency and the Digital Economy

Between 2014 and 2022, a strong coupling was observed between industrial enterprises’ carbon emission efficiency and the digital economy in Anhui, peaking at over 0.8 during 2019–2021. This underscores the orderly progression of the two systems. However, the coordination degree was low, reaching its highest in 2022, at 0.6733. The two systems were only at the primary coordination level. The digital economy was lagged. There was significant room for progress. Countries worldwide are seizing opportunities to develop their digital economies and realize the digital transformation of traditional industries [42,44], thereby obtaining competitive advantages. Anhui must maintain its momentum, reinforcing the concerted development of the two systems to attain higher quality economic growth. Prioritizing the intelligent, green, and digital transformation of enterprise production is crucial, with robust support for the establishment of smart factories, digital workshops, and green factories. By embracing advanced manufacturing enterprises, industries can harness digital technology to its fullest potential, fostering a deep integration between industrial enterprises and the digital economy. This, in turn, promotes the coordinated and low-carbon development of both realms.

6.2. Suggestions on Coupling and Coordinated Low-Carbon Development of Industrial Enterprises and the Digital Economy for Countries or Regions

Based on the empirical research results of Anhui Province, combined with the literature review and discussion of some relevant research conclusions of other countries or regions, we put forward the following recommendations for fostering a collaborative, low-carbon advancement of industrial enterprises and the digital economy in other countries or regions:
Systematically promote the multi-dimensional growth of the digital economy. The digital economy constitutes an intricate system that necessitates a holistic and systematic approach to its promotion and development. Drawing upon the relevant literature and taking into account the current state of digital economy development, this paper establishes a comprehensive evaluation index for assessing the development level of the digital economy across four key dimensions: digital infrastructure, digital industry, digital technological innovation, and industrial digitalization. Decision-makers in relevant countries or regions can strategically propel the development of the digital economy by comprehensively addressing these four crucial dimensions.
Broaden the utilization of the digital economy within industrial enterprises and facilitate their digital-transformation journey. The application of the digital economy can improve industrial enterprises’ energy efficiency and, optimize energy structure, thereby improving their carbon emission efficiency, reducing carbon emission intensity, and promoting the low-carbon sustainable development of industrial enterprises.
Emphasize the synergetic development between industrial enterprises’ carbon emission efficiency and the digital economy. The higher the degree of coupling cooperation, the more significant the interaction between the two. To achieve coupled and collaborative development, it is imperative to maintain the same attention on the digital economy’ development when implementing low-carbon development of industrial enterprises. The focus should be on the digital transformation and enhancement of industrial enterprises. In fostering the digital economy, it is imperative to amplify its application within industrial enterprises, particularly with regards to enhancing their carbon emission efficiency, thereby achieving a coordinated reinforcing growth between the two systems.

7. Conclusions

As the digital economy flourishes globally at an accelerated pace, digital transformation of traditional industries has reached a pivotal juncture. In the context of global energy conservation efforts, carbon emission efficiency must align with the progression of the digital economy. Industrial enterprises, being the primary contributors to carbon emissions, necessitate the promotion of a harmonious and coordinated development between their carbon emission efficiency and the digital economy. This is an indispensable prerequisite for fostering high-quality regional economic growth. This study carries significant theoretical insights, as well as practical implications. In terms of its theoretical significance, firstly, leveraging systems theory, an evaluation framework was devised to assess the coupling and coordinated development between industrial enterprises’ carbon emission efficiency and the digital economy. The index system considers input indices of industrial enterprises’ capital, manpower, and energy consumption, as well as expected and unexpected outputs. The inclusion of four first-level indicators, each reflecting the maturity of the digital economy, enhances the comprehensiveness of coupling and coordination development index systems within relevant disciplines. The index data were then processed. Industrial enterprises’ carbon emission efficiency was calculated using the super-efficiency SBM model, considering total-factor carbon emission efficiency. Employing the entropy weight method for normalizing the index data pertaining to the digital economy ensures a more precise measurement of its overall development level. Furthermore, a tailored evaluation model was devised to assess the coupling and coordinated progression between the two systems. Drawing from relevant data, this research undertakes a quantitative examination of the synergy and coordinated growth between the two systems. Therefore, this is a scientific and objective approach. Regarding practical value, the results of this study can help managers of industrial and digital-economy-related enterprises consider problems from a quantitative perspective and make informed decisions. Second, it can guide local governments in promoting regional low-carbon green transformation development and digital economic-development planning strategies. Third, this study provides new insights for researchers on carbon emissions and the digital economy.
This study conducted an evaluation and analysis of the degree of coupling and coordination between industrial enterprises’ carbon emission efficiency and the digital economy, leading to the formulation of several insightful conclusions. However, it is acknowledged that due to the constraints of current knowledge and resources, this research has room for enhancement. Firstly, the multi-faceted index system could be further refined to improve its comprehensiveness. Secondly, regarding data acquisition and processing, given that 2023 data were unavailable at the time of writing, future endeavors should prioritize the incorporation of up-to-date information to ensure timeliness. Third, causal studies are valuable. Further investigation is necessary to delve into how the digital economy influences carbon emission efficiency, as well as to identify the key factors that significantly impact this metric. Finally, due to the research design limitation and the short period of the data collected, we did not adopt the econometric model. The chi-squared test, factor analysis, etc., methods used in this study. These are all important methods of empirical research. The comparative study with other provinces is also important. In the follow-up study, we will fully consider these limitations, conduct a more scientific research design, and carry out further relevant research.

Author Contributions

Conceptualization, F.H. and H.L.; methodology, F.H. and Y.G.; software, Y.G. and H.D.; validation, F.H., H.L. and Y.G.; formal analysis, K.W.; investigation, H.D. and K.W.; resources, F.H. and H.L.; data curation, K.W.; writing—original draft preparation, F.H. and Y.G.; writing—review and editing, F.H., H.L. and Y.G.; visualization, K.W.; supervision, H.L.; project administration, F.H., H.L. and Y.G.; funding acquisition, F.H. and K.W. All authors have read and agreed to the published version of the manuscript.

Funding

This research was supported by Anhui Province Social Science Innovation and Development Research Project 2022 (2022CX061), Key Project of Anhui University Outstanding Talents Plan (gxyqZD2020108), Anhui Provincial Philosophy and Social Sciences Planning Project (AHSKY2022D081), and Suzhou University Research Platform Project (2022ykf39).

Institutional Review Board Statement

Not applicable.

Informed Consent Statement

Not applicable.

Data Availability Statement

Data will be made available on request.

Conflicts of Interest

The authors declare no conflicts of interest.

References

  1. Cheng, Z.; Li, L.; Liu, J.; Zhang, H. Total-factor carbon emission efficiency of China’s provincial industrial sector and its dynamic evolution. Renew. Sustain. Energy Rev. 2018, 94, 330–339. [Google Scholar] [CrossRef]
  2. Qin, D.H. Climate change science and sustainable development. Prog. Geogr. 2014, 33, 874. [Google Scholar]
  3. Zhang, R.; Hanaoka, T. Deployment of electric vehicles in China to meet the carbon neutral target by 2060: Provincial disparities in energy systems, CO2 emissions, and cost effectiveness. Resour. Conserv. Recycl. 2021, 170, 105622. [Google Scholar] [CrossRef]
  4. Shi, X.; Zheng, Y.; Lei, Y.; Xue, W.; Yan, G.; Liu, X.; Cai, B.; Tong, D.; Wang, J. Air quality benefits of achieving carbon neutrality in China. Sci. Total Environ. 2021, 795, 148784. [Google Scholar] [CrossRef] [PubMed]
  5. Chen, J.; Lian, X.; Su, H.; Zhang, Z.; Ma, X.; Chang, B. Analysis of China’s carbon emission driving factors based on the perspective of eight major economic regions. Environ. Sci. Pollut. Res. 2020, 28, 8181. [Google Scholar] [CrossRef] [PubMed]
  6. Zhang, S.J.; Zhang, X.P.; Ge, W.; Shi, C.Y. Carbon neutral transformative technologies for industrial process. Bull. Chin. Acad. Sci. 2022, 37, 511. [Google Scholar]
  7. Acemoglu, D. Directed technical change. Rev. Econ. Stud. 2002, 69, 781–809. [Google Scholar] [CrossRef]
  8. Cao, W.; Zhao, W.; Si, Y.J. Impact of digital economy on low-carbon development: Moderating effect and threshold effect of green technology innovation. Soft Sci. 2023, 37, 47. [Google Scholar]
  9. Li, N.B. Has the digital economy effectively empowered the urban low-carbon development?—Explanation from the progress of low-carbon technology. J. Northeast Norm. Univ. (Philos. Soc. Sci.) 2023, 6, 71. [Google Scholar]
  10. Chen, J.D.; Wang, J.J. Industrial digitization, local market size and technological innovation. Mod. Econ. Res. 2021, 4, 97–107. [Google Scholar]
  11. Wu, C.X.; Gao, Y. Research on the mechanism and effect of digital economy driving the development of low-carbon industry. Guizhou Soc. Sci. 2020, 11, 155–161. [Google Scholar]
  12. Wei, L. Developing the digital economy to accelerate constructing a new development pattern—Reflections based on Marxist political economy. Seek. Truth 2020, 47, 1–9. [Google Scholar]
  13. Li, Z.; Wang, J. The dynamic impact of digital economy on carbon emission reduction: Evidence city-level empirical data in China. J. Cleaner Prod. 2022, 351, 131570. [Google Scholar] [CrossRef]
  14. Wang, X.; Zhong, M. Can digital economy reduce carbon emission intensity? Empirical evidence from China’s smart city pilot policies. Environ. Sci. Pollut. Res. Int. 2023, 30, 51749–51769. [Google Scholar] [CrossRef] [PubMed]
  15. Carlos, G.; Denis, H.; Sven, S.; Zoheir, S.; Conor, D.; Jasmin, P.; Thomas, U.; Paolo, M.; Kathairina, S.; Mike, K.; et al. Future internet technologies for environmental applications. Environ. Modell. Softw. 2016, 78, 1–15. [Google Scholar]
  16. Thorsten, K.; Josef, W. Seeing through the network: Competitive advantage in the digital economy. J. Organ. Des. 2017, 6, 6. [Google Scholar]
  17. Li, Y.; Yang, X.; Ran, Q.; Wu, H.; Irfan, M.; Ahmad, M. Energy structure, digital economy, and carbon emissions: Evidence from China. Environ. Sci. Pollut. Res. Int. 2021, 28, 64606–64629. [Google Scholar] [CrossRef] [PubMed]
  18. Li, W.W.; Wang, W.P.; Wang, Y.; Qin, Y. Industrial structure, technological progress and CO2 emissions in China: Analysis based on the STIRPAT framework. Nat. Hazards 2017, 88, 1545–1564. [Google Scholar] [CrossRef]
  19. Eddy, D.R.; Georg, S.; Hans, J.P.; Bruno, F. A review of the past, present and future of the European loss prevention and safety promotion in the process industries. Process Saf. Environ. Prot. 2014, 92, 280. [Google Scholar]
  20. Yang, Y.; Cai, W.J.; Wang, C. Industrial CO2 intensity, indigenous innovation and R&D spillovers in China’s provinces. Appl. Energy 2014, 131, 117. [Google Scholar]
  21. Cheng, S.; Qu, G. Research on the effect of digital economy on carbon emissions under the background of “double carbon”. Int. J. Environ. Res. Public Health 2023, 20, 4931. [Google Scholar] [CrossRef] [PubMed]
  22. Wang, H.; Li, Y.; Lin, W.; Wei, W. How does digital technology promote carbon emission reduction? Empirical evidence based on e-commerce pilot city policy in China. J. Environ. Manage. 2023, 325, 116524. [Google Scholar] [CrossRef] [PubMed]
  23. Mita, B.; Shuddhasattwa, R.; Sankar, B. The role of technology on the dynamics of coal consumption-economic growth: New evidence from China. Appl. Energy 2015, 154, 686–695. [Google Scholar]
  24. Yang, B. Analysis of the impact mechanism of sustainable development of live e-commerce on the transformation and upgrading of manufacturing industry. J. Commer. Econ. 2021, 12, 172–175. [Google Scholar]
  25. Heinrichs, H. Sharing Economy: A Potential New Pathway to Sustainability. GAIA—Ecol. Perspect. Sci. Soc. 2013, 22, 228–231. [Google Scholar] [CrossRef]
  26. Demailly, D.; Novel, A.S. The Sharing Economy: Make It Sustainable; IDDRI: Paris, France, 2014. [Google Scholar]
  27. Dai, Y.; Wang, X.; Tong, X. From the Sharing Economy to the low-carbon economy—Evidence from bike-sharing platforms. J. Quant. Technol. Econ. 2024, 41, 111–130. [Google Scholar]
  28. Momo. The State of European Car Sharing. Final Report D2.4 Work Package 2; momo Car-Sharing: Skopje, North Macedonia, 2010. [Google Scholar]
  29. Liu, X.L.; Xiong, X. Dynamic comparison of the decoupling relationship between industrial enterprises’ benefits and carbon emissions: Based on the data of ABS smelting company since the 11th five-year Plan. Public Fin. Res. 2015, 3, 16. [Google Scholar]
  30. Wang, Q.; GE, Y.; Li, R. Evolution and driving factors of ocean carbon emission efficiency: A novel perspective on regional differences. Mar. Pollut. Bull. 2023, 194, 115219. [Google Scholar] [CrossRef]
  31. Begum, R.A.; Sohag, K.; Abdullah, S.M.S.; Jaafar, M. CO2 emissions, energy consumption, economic and population growth in Malaysia. Renew. Sustain. Energy Rev. 2015, 41, 594–601. [Google Scholar] [CrossRef]
  32. Xie, Y.F. The effect and mechanism of digital economy on regional carbon emission intensity. Contemp. Econ. Manage. 2022, 44, 68. [Google Scholar]
  33. Mu, L.J.; Chen, J.; Fan, T.Z.; Lyv, Y.Q. The impact of digital economy development on carbon emissions—Based on panel data analysis of 278 prefecture-level cities. S. China Fin. 2022, 2, 45. [Google Scholar]
  34. Han, D.; Ding, Y.; Shi, Z.; He, Y. The impact of digital economy on total factor carbon productivity: The threshold effect of technology accumulation. Environ. Sci. Pollut. Res. Int. 2022, 29, 55691–55706. [Google Scholar] [CrossRef] [PubMed]
  35. Ma, T.; Cao, X. The effect of the industrial structure and haze pollution: Spatial evidence for China. Environ. Sci. Pollut. Res. Int. 2022, 29, 23578–23594. [Google Scholar] [CrossRef] [PubMed]
  36. Zhang, L.; Mu, R.; Zhan, Y.; Yu, J.; Liu, L.; Yu, Y.; Zhang, J. Digital economy, energy efficiency, and carbon emissions: Evidence from provincial panel data in China. Sci. Total Environ. 2022, 852, 158403. [Google Scholar] [CrossRef]
  37. Xu, Q.; Zhong, M.; Cao, M. Does digital investment affect carbon efficiency? Spatial effect and mechanism discussion. Sci. Total Environ. 2022, 827, 154321. [Google Scholar] [CrossRef] [PubMed]
  38. Cheng, C.; Ren, X.; Dong, K.; Dong, X.; Wang, Z. How does Technological innovation mitigate CO2 emissions in OECD countries? Heterogeneous analysis using panel quantile regression. J. Environ. Manag. 2021, 280, 111818. [Google Scholar] [CrossRef] [PubMed]
  39. Guo, A.J.; Zhang, C.B. How does the digital economy affect the intensity of carbon emissions—Based on the dual perspectives of industrial structure upgrading and rationalization. Sci. Sci. Manag. S. T 2023, 11, 1. [Google Scholar]
  40. Ge, L.Y.; Mo, L.J.; Huang, N.B. Development of digital economy, upgrading of industrial structure and urban carbon emission. Mod. Fin. Econ. J. Tianjin Univ. Fin. Econ. 2022, 42, 20. [Google Scholar]
  41. Jin, F.; Xu, C.L. Study on the nonlinear influence of digital economy development on carbon emission. Mod. Econ. Res. 2022, 11, 14–23. [Google Scholar]
  42. Xie, N.Y.; Zhang, Y. The impact of digital economy on industrial carbon emission efficiency: Evidence from Chinese provincial data. Math. Probl. Eng. 2022, 2022, 6583809. [Google Scholar] [CrossRef]
  43. Ford, S.; Despeisse, M. Additive manufacturing and sustainability: An exploratory study of the advantages and challenges. J. Cleaner Prod. 2016, 137, 1573–1587. [Google Scholar] [CrossRef]
  44. Liu, L.; Zhang, Y.; Gong, X.; Li, M.Y.; Li, X.; Ren, D.; Jiang, P. Impact of digital economy development on carbon emission efficiency: A spatial econometric analysis based on Chinese provinces and cities. Int. J. Environ. Res. Public Health 2022, 19, 14838. [Google Scholar] [CrossRef] [PubMed]
  45. Sorrell, S. Energy, economic growth and environmental sustainability: Five propositions. Sustainability 2010, 2, 1784. [Google Scholar] [CrossRef]
  46. Ishida, H. The effect of ICT development on economic growth and energy consumption in Japan. Telemat. Inform. 2015, 32, 79–88. [Google Scholar] [CrossRef]
  47. Jia, B.; Liu, H. Study on the decoupling of carbon emissions from energy consumption and economic development in Yunnan Province. Jiangsu Comm. Forum 2016, 12, 18–21. [Google Scholar]
  48. Tian, X.; Chang, M.; Shi, F.; Tanikawa, H. How does industrial structure change impact carbon dioxide emissions? A comparative analysis focusing on nine provincial regions in China. Environ. Sci. Policy 2014, 37, 243–254. [Google Scholar] [CrossRef]
  49. Wang, L.; Chen, L.; Li, Y. Digital economy and urban low-carbon sustainable development: The role of innovation factor mobility in China. Environ. Sci. Pollut. Res. 2022, 29, 48539–48557. [Google Scholar] [CrossRef] [PubMed]
  50. Soumyananda, D. A theoretical basis for the environmental Kuznetscurve. Ecol. Econ. 2004, 53, 403. [Google Scholar]
  51. Pan, W.; Tu, H.; Hu, C.; Pan, W. Driving forces of China’s multisector CO2 emissions: A log-mean divisia index decomposition. Environ. Sci. Pollut. Res. Int. 2020, 27, 23550–23564. [Google Scholar] [CrossRef]
  52. Lin, X.Q.; Tong, X. Analysis of provincial differences in industrial carbon emissions based on Theil index-A case study of five pilot provinces. Sci. Technol. Econ. 2016, 29, 106. [Google Scholar]
  53. Zhang, W.; Liu, X.; Wang, D.; Zhou, J. Digital economy and carbon emission performance: Evidence at China’s city level. Energy Policy 2022, 165, 112927. [Google Scholar] [CrossRef]
  54. Lin, B.; Du, C. The impact of factor market distortions on energy efficiency. Econ. Res. J. 2013, 48, 125. [Google Scholar]
  55. Pang, W.; Ma, Y.; Tang, Z. Study on the coupling relationship and coordinated development between tourism economy and ecological environment: A case study of Xi’an City. J. Northwest. Univ. (Nat. Sci. Ed.) 2011, 41, 1097. [Google Scholar]
  56. Bai, L.; Chen, H.; Gao, Q.; Luo, W. Project portfolio selection based on synergy degree of composite system. Soft Comput. 2018, 22, 5535–5545. [Google Scholar] [CrossRef]
  57. Zeng, Q.L.; Sun, Q.B. An empirical study on the coupling relationship between modern agriculture and logistics industry in China. Stat. Decis. 2016, 8, 94–97. [Google Scholar]
  58. Shi, T.; Yang, S.; Zhang, W.; Zhou, Q. Coupling coordination degree measurement and spatiotemporal heterogeneity between economic development and ecological environment: Empirical evidence from tropical and subtropical regions of China. J. Clean. Prod. 2020, 244, 118739. [Google Scholar] [CrossRef]
  59. Zhang, Z.; Xue, Q. Low-carbon economy, industrial structure and changes in China’s development mode based on the data of 1996-2009 in empirical analysis. Energy Procedia 2011, 5, 2025–2029. [Google Scholar]
  60. Xu, Z.; Ci, F. Spatial-temporal characteristics and driving factors of coupling coordination between the digital economy and low-carbon development in the Yellow River Basin. Sustainability 2023, 15, 2731. [Google Scholar] [CrossRef]
  61. Wu, C. The impact of urbanization on agricultural carbon emissions in China: An empirical study of inter-provincial data. Econ. Surv. 2015, 32, 12. [Google Scholar]
  62. Jiang, J.; Zhu, S.; Wang, W.; Li, Y.; Li, N. Coupling coordination between new urbanisation and carbon emissions in China. Sci. Total Environ. 2022, 850, 158076. [Google Scholar] [CrossRef]
  63. Chen, Y. Financial support for China’s new-type urbanization. Econ. Res. J. 2013, 48, 10. [Google Scholar]
  64. Xiong, X.; Xu, Z. Research on the influence of financial support in the process of new urbanization in China. J. Quant. Technol. Econ. 2015, 32, 73. [Google Scholar]
  65. Yao, F.; Xue, L.; Liang, J. Research on coupling coordination and influencing factors between urban low-carbon economy efficiency and digital finance: Evidence from 100 cities in China’s Yangtze River economic belt. PLoS ONE 2022, 17, e0271455. [Google Scholar] [CrossRef] [PubMed]
  66. Song, Y.; Hu, H.; Song, G. Empirical study on the relationship between agricultural technical efficiency improvement and urbanization: A case study of six provinces in central and western China. Stat. Inf. 2012, 27, 53. [Google Scholar]
  67. Wang, F.; Mao, A.; Li, H. Measurement and spatial difference analysis of urbanization quality in Shandong Province based on entropy method. Sci. Geogr. Sin. 2013, 33, 1323. [Google Scholar]
  68. Cai, J.; Li, X.; Liu, L.; Chen, Y.; Wang, X.; Lu, S. Coupling and coordinated development of new urbanization and agro-ecological environment in China. Sci. Total Environ. 2021, 776, 145837. [Google Scholar] [CrossRef] [PubMed]
  69. Guo, Y.; Ding, H. Coupled and coordinated development of the data-driven logistics industry and digital economy: A case study of Anhui Province. Processes 2022, 10, 2036. [Google Scholar] [CrossRef]
  70. Liu, C.; Wang, X.; Bai, Z.; Wang, H.; Li, C. Does digital technology application promote carbon emission efficiency in dairy farms? Evidence from China. Agriculture 2023, 13, 904. [Google Scholar] [CrossRef]
  71. Liu, W.; Wang, Y. Effect and mechanism of digital economy empowering urban green and high-quality development. S. China J. Econ. 2022, 8, 73–91. [Google Scholar]
  72. Liao, X.; Yang, Z. Effect measurement and realization path of transformation and upgrading of digital economy enabling manufacturing industry in the Yangtze River Delta. East China Econ. Manag. 2021, 35, 22. [Google Scholar]
  73. Wei, L.; Hou, Y. Research on the impact of China’s digital economy on urban green development. J. Quant. Technol. Econ. 2022, 39, 60. [Google Scholar]
  74. Guo, Y.; Mao, H.; Ding, H.; Wu, X.; Liu, Y.; Liu, H.; Zhou, S. Data-driven coordinated development of the digital economy and logistics industry. Sustainability 2022, 14, 8963. [Google Scholar] [CrossRef]
  75. Luo, D.; Liang, L.; Wang, Z.; Chen, L.; Zhang, F. Exploration of coupling effects in the economy-society-environment system in urban areas: Case study of the Yangtze River Delta urban agglomeration. Ecol. Indic. 2021, 128, 107858. [Google Scholar]
  76. Xu, M.; Hu, W.Q. A research on coordination between economy, society and environment in China: A case study of Jiangsu. J. Clean. Prod. 2020, 258, 120641. [Google Scholar] [CrossRef]
  77. Jiang, Y.; Lan, T.; Wu, L. A comparison study of missing value processing methods in time series data mining. In Proceedings of the International Conference on Computational Intelligence & Software Engineering, Wuhan, China, 11–13 December 2009; Volume 1. [Google Scholar]
  78. IPCC. Global Warming of 1.5 °C. An IPCC Special Report on the Impacts of Global Warming of 1.5 °C above Pre-industrial Levels and Related Global Greenhouse Gas Emission Pathways, in the Context of Strengthening the Global Response to the Threat of Climate Change, Sustainable Development, and Efforts to Eradicate Poverty. 2018. Available online: https://www.ipcc.ch/sr15/ (accessed on 28 March 2024).
  79. Cuiju, Z.; Zongyi, Z. Agglomeration effect and radiation effect of carbon emission intensity at provincial level in China. Acta Sci. Circum. 2017, 37, 1178. [Google Scholar]
  80. International Panel on Climate Change (IPCC). IPCC Guidelines for National Greenhouse Gas Inventories; IPCC/IGES: Hayama, Japan, 2006. [Google Scholar]
  81. Ren, F.; Yu, X. Coupling analysis of urbanization and ecological total factor energy efficiency: A case study from Hebei Province in China. Sustain. Cities Soc. 2021, 74, 103183. [Google Scholar] [CrossRef]
  82. Cai, A.; Zheng, S.; Cai, L.H.; Yang, H.; Comite, U. How does green technology innovation affect carbon emissions? A spatial econometric analysis of China’s provincial panel data. Front. Environ. Sci. Eng. 2021, 9, 813811. [Google Scholar] [CrossRef]
  83. Pradhan, R.P.; Arvin, M.B.; Nair, M.; Bennett, S.E. Sustainable economic growth in the European Union: The role of ICT, venture capital, and innovation. Rev. Financ. Econ. 2020, 38, 34–62. [Google Scholar] [CrossRef]
  84. Abbas, Q.; HongXing, Y.; Ramzan, M.; Fatima, S. Carbon reduction through renewable energy and digitalization in emerging economies: Moderating role of public debt. Environ. Sci. Pollut. Res. Int. 2024, 31, 43096–43116. [Google Scholar] [CrossRef]
  85. Ghezelbash, A.; Liu, J.; Fahimifard, S.H.; Khaligh, V. Exploring the Influence of the Digital Economy on Energy, Economic, and Environmental Resilience: A Multinational Study across Varied Carbon Emission Groups. Sustainability 2024, 16, 2993. [Google Scholar] [CrossRef]
  86. Yasmeen, R.; Tian, T.; Yan, H.; Shah, W.U.H. A simultaneous impact of digital economy, environment technology, business activity on environment and economic growth in G7: Moderating role of institutions. Heliyon 2024, 10, e32932. [Google Scholar] [CrossRef] [PubMed]
  87. Fernández, F.Y.; López, F.M.; Blanco, O.B. Innovation for sustainability: The impact of R&D spending on CO2 emissions. J. Clean. Prod. 2018, 172, 3459–3467. [Google Scholar]
  88. Kunkel, S.; Matthess, M. Digital transformation and environmental sustainability in industry: Putting expectations in Asian and African policies into perspective. Environ. Sci. Policy 2020, 112, 318–329. [Google Scholar] [CrossRef]
Figure 1. Method application flow.
Sustainability 16 06248 g001
Figure 2. The process of data utilization.
Sustainability 16 06248 g002
Figure 3. Carbon emission intensity and efficiency of Anhui China between 2014 and 2022. The original data came from the Anhui Provincial Statistical Yearbook. Equations (1), (2), and (11) were used to calculate the data shown in this figure.
Sustainability 16 06248 g003
Figure 4. GDP of Anhui from 2014 to 2022. Data from the Anhui Provincial Statistical yearbook.
Sustainability 16 06248 g004
Figure 5. Digital economy advancement trend in Anhui from 2014 to 2022. Raw data came from the Statistical Yearbook of Anhui and the China Internet Development Report. Equations (3)–(10), and (12) were used to calculate the data shown in this figure.
Sustainability 16 06248 g005
Figure 6. Results of U1, U2, CL, T, and D in Anhui from 2014 to 2022. The original data came from the Anhui Provincial Statistical Yearbook. Equations (13)–(15) were used to calculate the data shown in this figure.
Sustainability 16 06248 g006
Table 1. Assessment index framework.
SystemPrimary IndexVariables and InterpretationCodePositive/
Negative
Industrial enterprises’ carbon emission efficiency
(U1)
Input
(U11)
Average asset investment of industrial enterprises above designated size (CNY 100 million)
(Total assets divided by enterprise’s count)
x 11 +
Average count of industrial enterprises’ employees (10,000 persons/unit) x 12 +
Total energy consumption of industrial enterprises above designated size (10,000 tons of standard coal)
(Yearly consumption)
x 13
Expected output
(U12)
Profits of industrial enterprises above designated size (CNY 100 million)
(Yearly profit)
x 14 +
Non-expected output
(U13)
Carbon emission intensity of industrial enterprises above designated size (10,000 tons/CNY 100 million)
(Carbon emissions divided by output value)
x 15
Digital economy system
(U2)
Digital infrastructure
(U21)
Internet penetration (%)
(Proportion of Internet users to the total resident population)
x 21 +
Total telecommunications business (CNY 100 million)
(Total amount of various telecommunication services provided by telecommunication enterprises to the society, expressed in monetary form)
x 22 +
Cell phone penetration rate (units/100 persons)
(The proportion of the population using mobile phones)
x 23 +
Domain names per capita (PCs)
(Current total number of the statistical year)
x 24 +
Count of per capita web pages
(Current total number of the statistical year)
x 25 +
Digital industry
(U22)
Percentage of software revenue in GDP (%)
(Software revenue divided by GDP)
x 26 +
The proportion of GDP derived from information transmission, software, and information technology services revenue (%)
(Revenue divided by GDP)
x 27 +
The proportion of GDP derived from computer communications and other electronic equipment manufacturing revenues (%)
(Revenue divided by GDP)
x 28 +
Investment in fixed assets for information services (CNY 100 million)
(Annual amount of new investment)
x 29 +
Employment in the information transmission, software, and information technology services sector (10,000 persons)
(Total employment in statistical year)
x 210 +
Profit in the computer, communication, and other electronic equipment manufacturing industry (CNY 100 million)
(Yearly profit)
x 211 +
Digital technology innovation
(U23)
Employees working in the scientific research and technical services sector (10,000 persons)
(Total employment in statistical year)
x 212 +
Expenditure on research and experimental development (CNY 100 million)
(Yearly expenditure)
x 213 +
Number of qualifications of bachelor’s degree or above (person)
(Total number in statistical year)
x 214 +
The count of patent applications (items/10,000 persons)
(Annual number of new applications)
x 215 +
The percentage of GDP contributed by the output value of scientific research and technical services
(yearly value divided by GDP)
x 216 +
Industrial digitization
(U24)
The number of computers for every 100 people (units)
(Number of computers divided by the number of people)
x 217 +
The number of websites operated by every 100 companies
(Number of pages divided by the number of people)
x 218 +
Sales generated through electronic commerce (CNY 100 million)
(Revenue from e-commerce transactions in statistical year)
x 219 +
Number of e-commerce enterprises x 220 +
E-commerce purchases (CNY 100 million)
(The value of purchases made through electronic commerce in the statistical year)
x 221 +
Table 2. Values of SCC and CEF.
Fossil FuelSCCCEF
coal0.71430.7559
coke0.97140.855
crude oil1.42860.5538
gasoline1.47140.5921
diesel1.45710.6185
natural gas1.330.4483
The values of SCC and CEF are from the China Energy Statistical Yearbook, and the “IPCC Guidelines for National Greenhouse Gas Emission Inventories”. The value of SCC can be more than 1, according to the references.
Table 3. Coupling coordination level.
CLCoupling PhaseCoupling SpecificationDCoordination Level
(0.0, 0.3]Low coupling Coupling gradually(0.0, 0.1]Severely discordant
(0.1, 0.2]Severe discordant
(0.2, 0.3]Moderate discordant
(0.3, 0.6]AntagonismCertain degree of development(0.3, 0.4]Mild discordant
(0.4, 0.5]Borderline discordant
(0.5, 0.6]Barely coordinated
(0.6, 0.8]Running-inGood coupling development(0.6, 0.7]Primary coordination
(0.7, 0.8]Intermediate coordination
(0.8, 1.0]High coupling Mutually reinforcing development(0.8, 0.9]Well-coordinated
(0.9, 1.0]Highly coordinated
Disclaimer/Publisher’s Note: The statements, opinions and data contained in all publications are solely those of the individual author(s) and contributor(s) and not of MDPI and/or the editor(s). MDPI and/or the editor(s) disclaim responsibility for any injury to people or property resulting from any ideas, methods, instructions or products referred to in the content.

