
Soiling, Adhesion, and Surface Characterization of Concentrated Solar Power Reflectors: Insights and Challenges in the MENA Region

 , ,
, ,
Abstract
:1. Introduction
- -
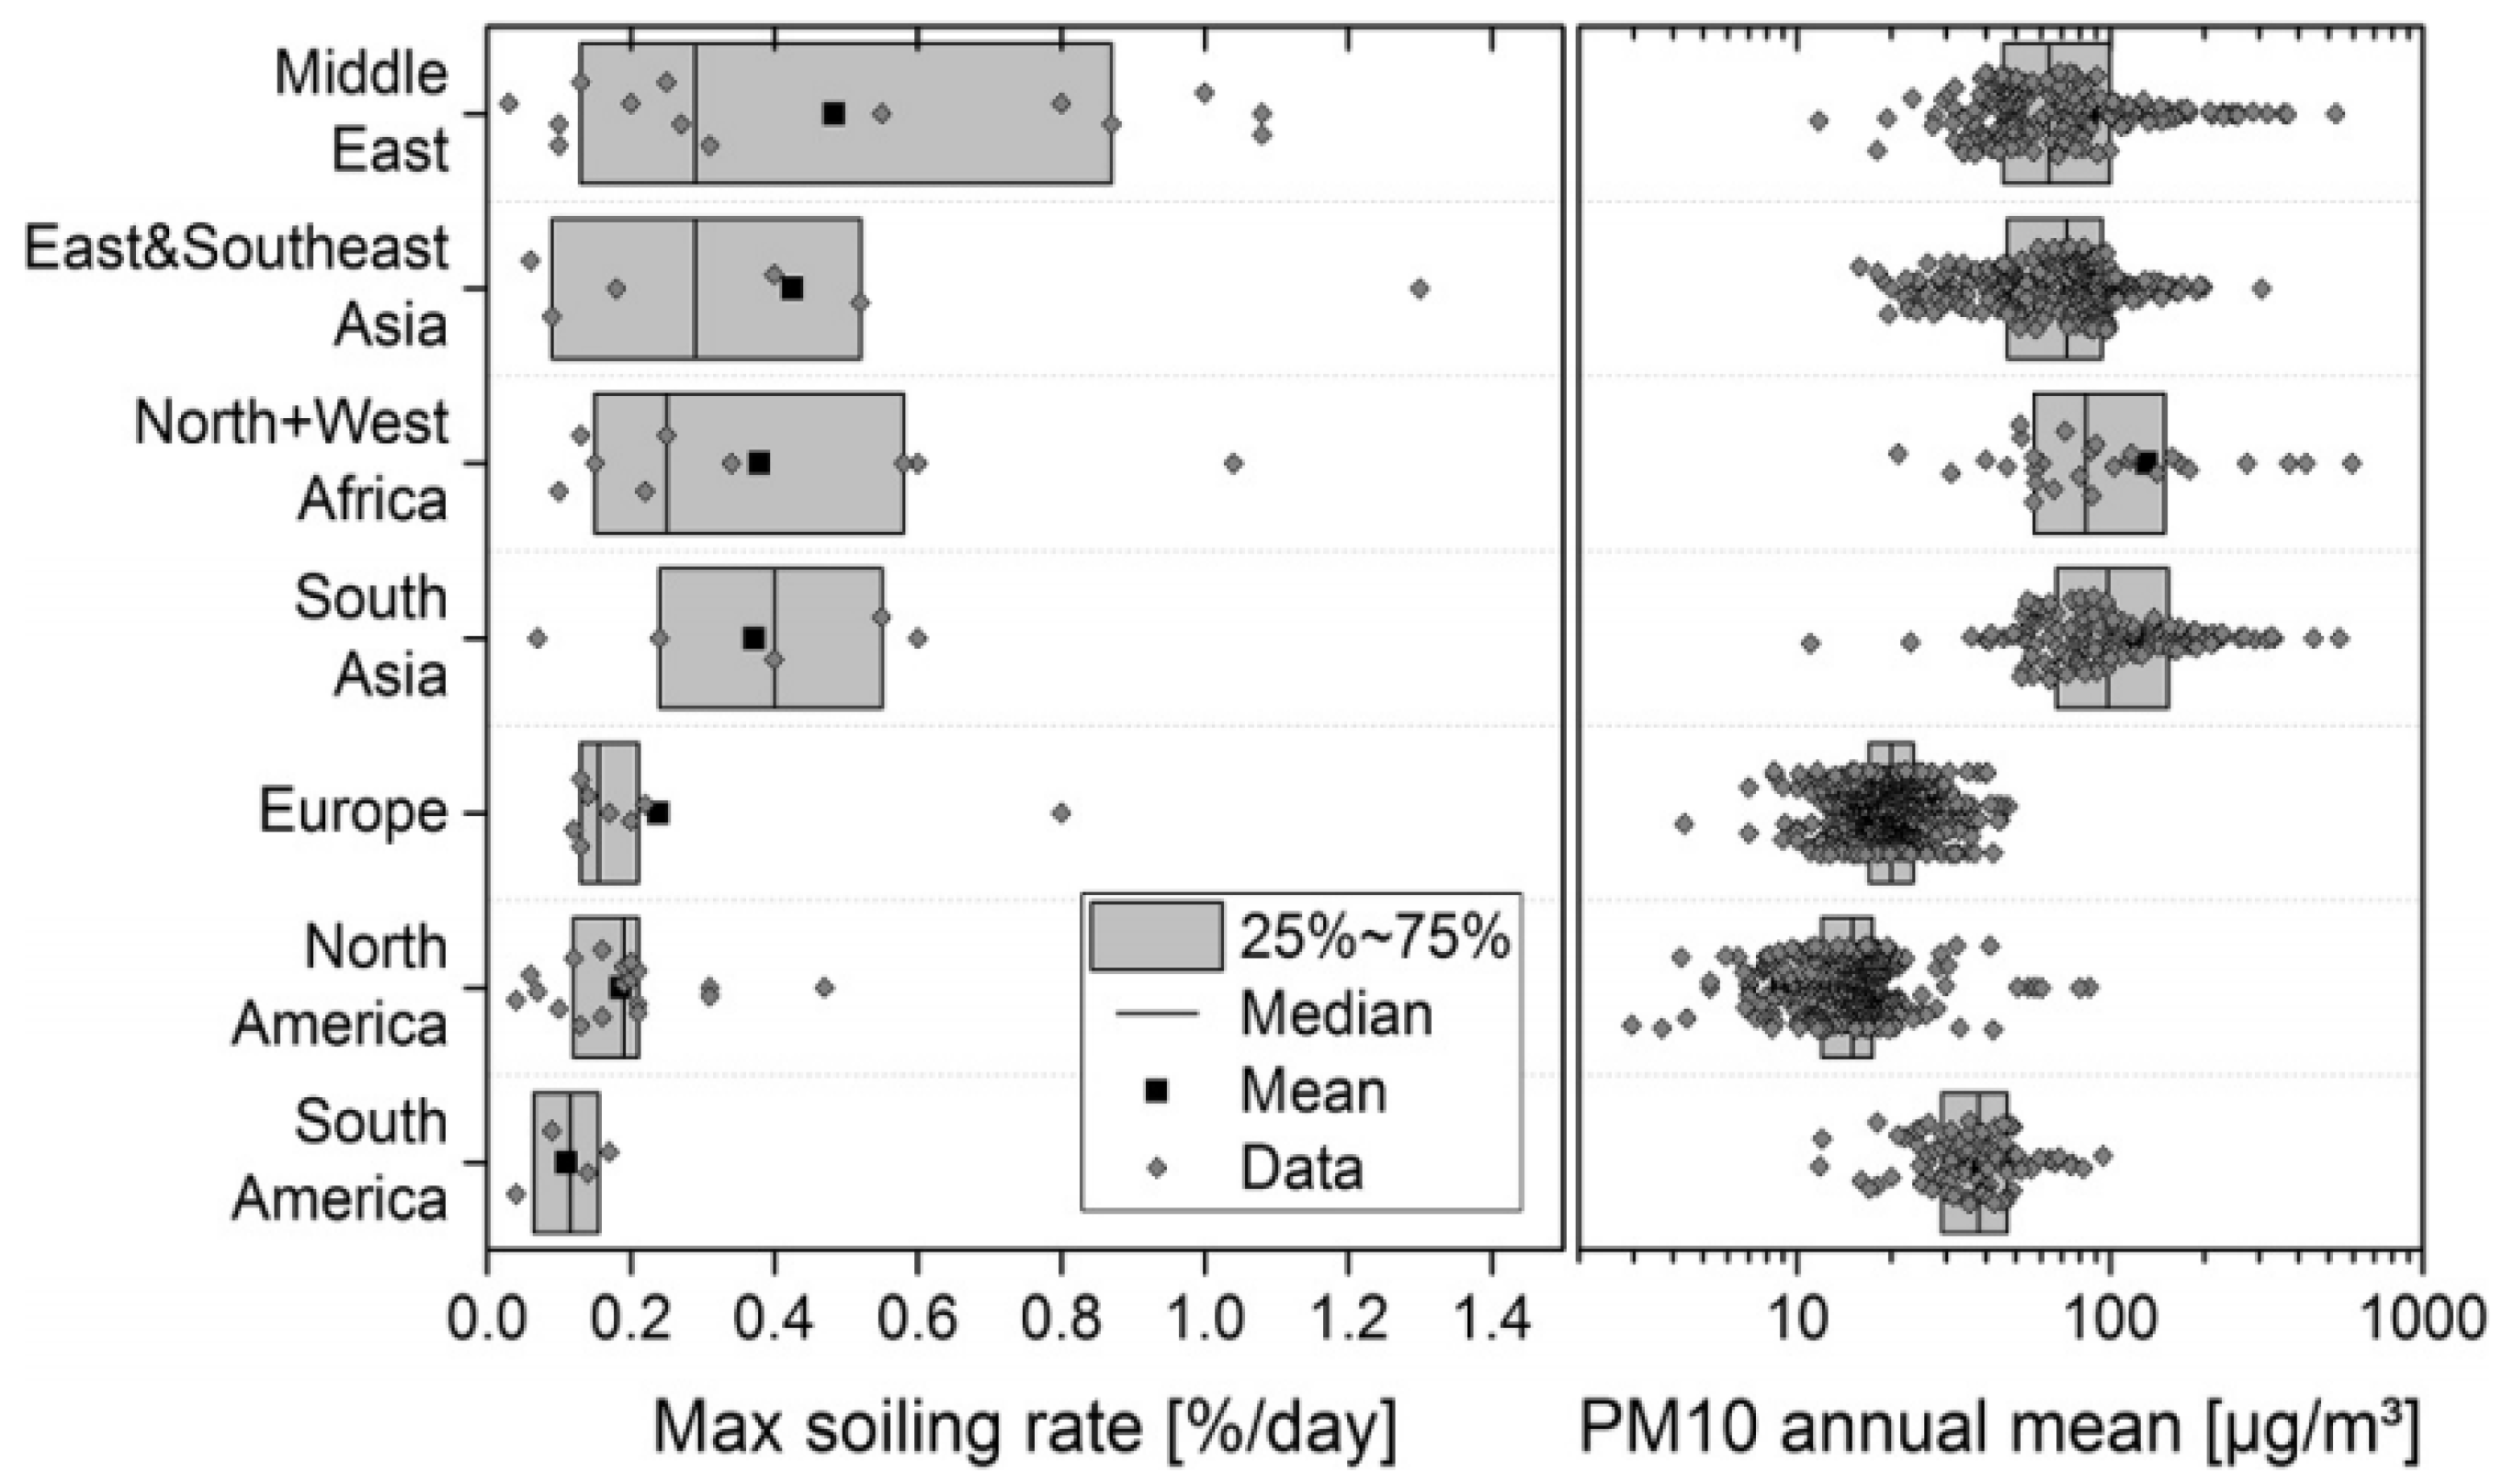
- Airborne dust concentration
- -
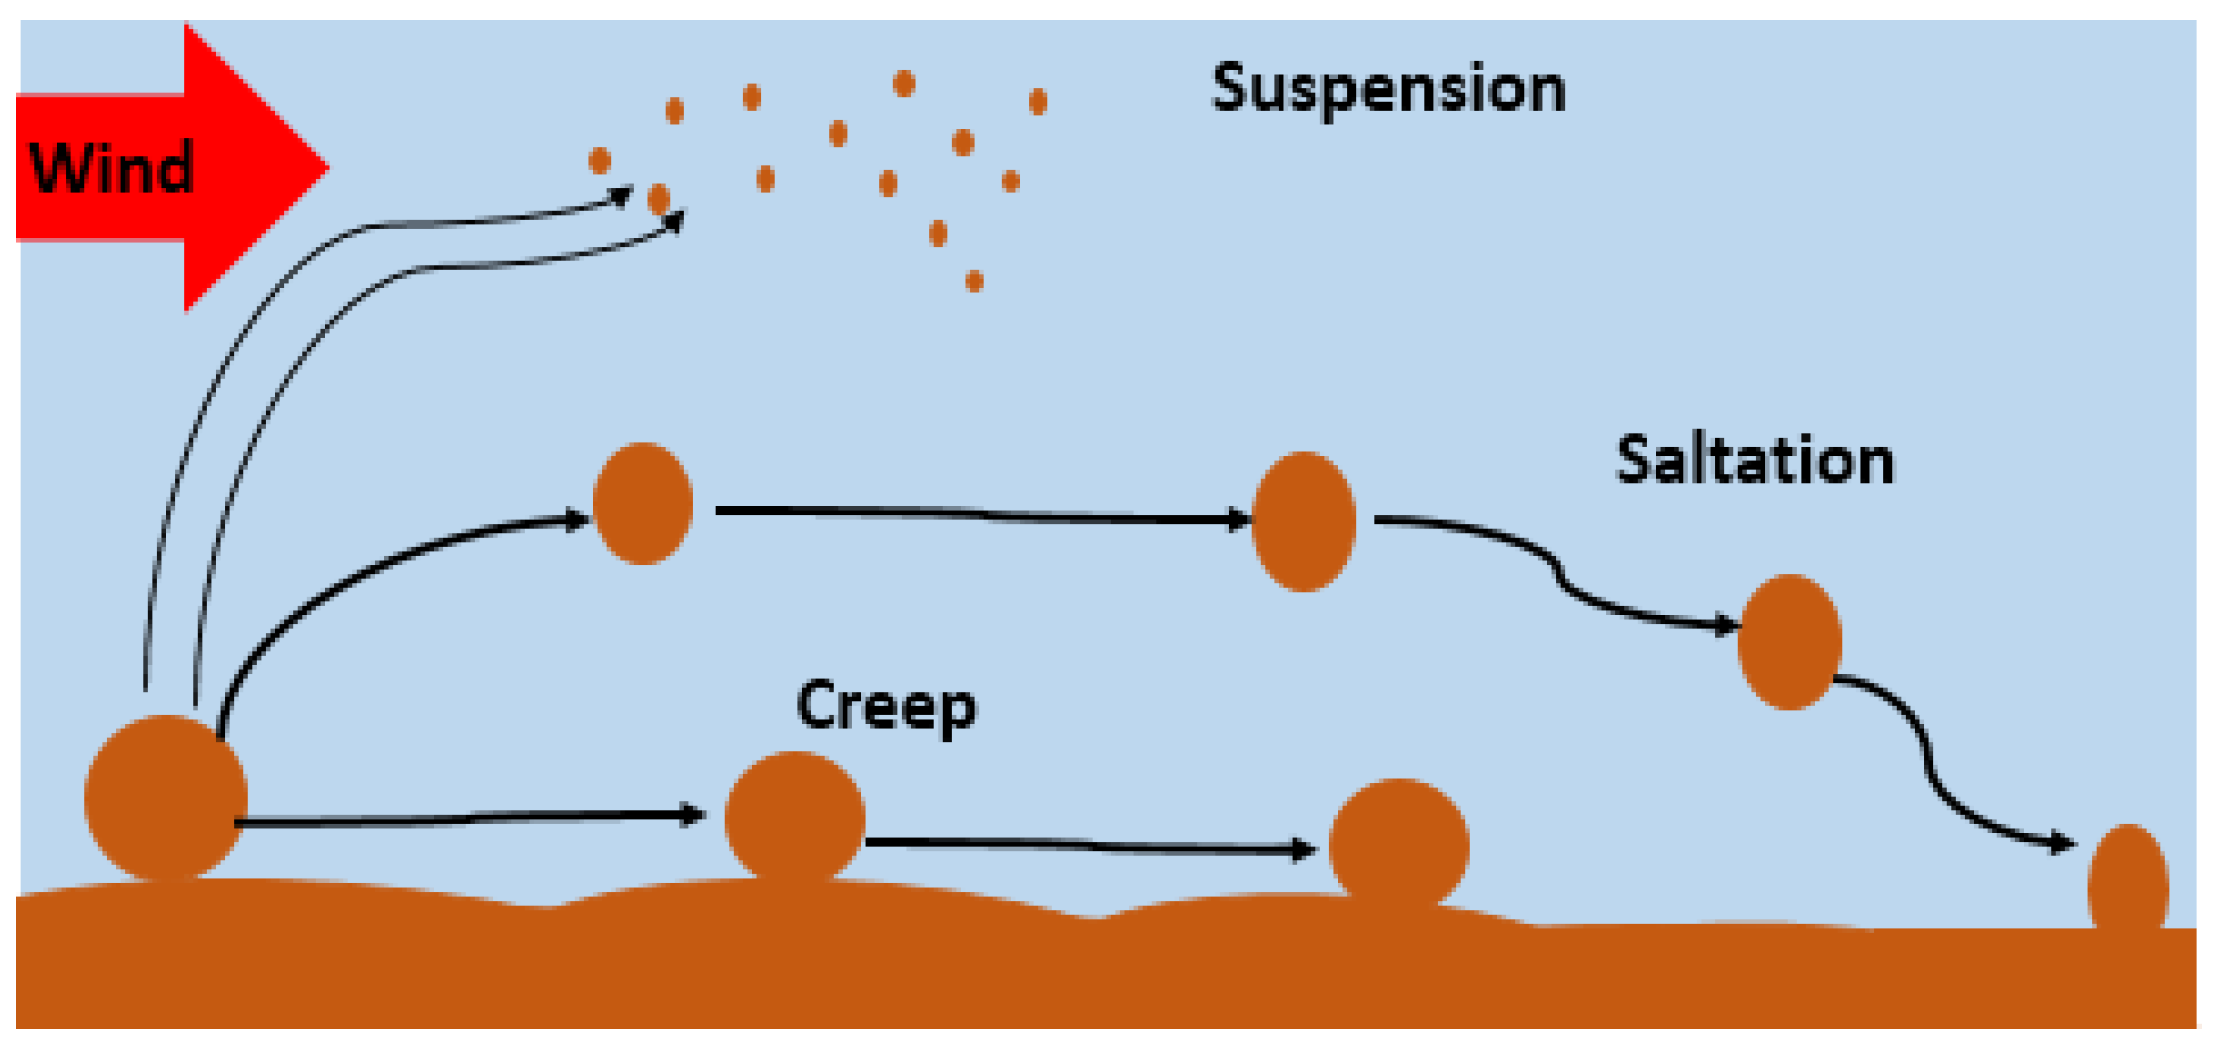
- Factors Contributing to Dust Accumulation
2. Challenges Facing CSP Projects in the MENA Region
3. Measurement of Soil and Dust Adhesion on CSP Surfaces
- -
- Soil mass and output of solar modules
- -
- Dust deposition on the surface of solar panels can reduce the efficiency of solar modules. Al-Hasan et al. [12] observed that soil mass accumulates proportionally with transmission loss and the output of photovoltaic (PV) panels. Characterizing soiling by soil mass is thus an effective method to measure soiling, allowing the determination of the size, texture, and composition of adhering dust particles and estimation of the amount of incident radiation scattered and absorbed. In addition to soil mass, the performance of PV panels is directly related to incident light affected by soil mass accumulation. Solar module output can be assessed using the soiling ratio, as described by the IEC 61724-1 standard [13], which calculates the short-circuit current of the soiled sample over that of the clean sample:
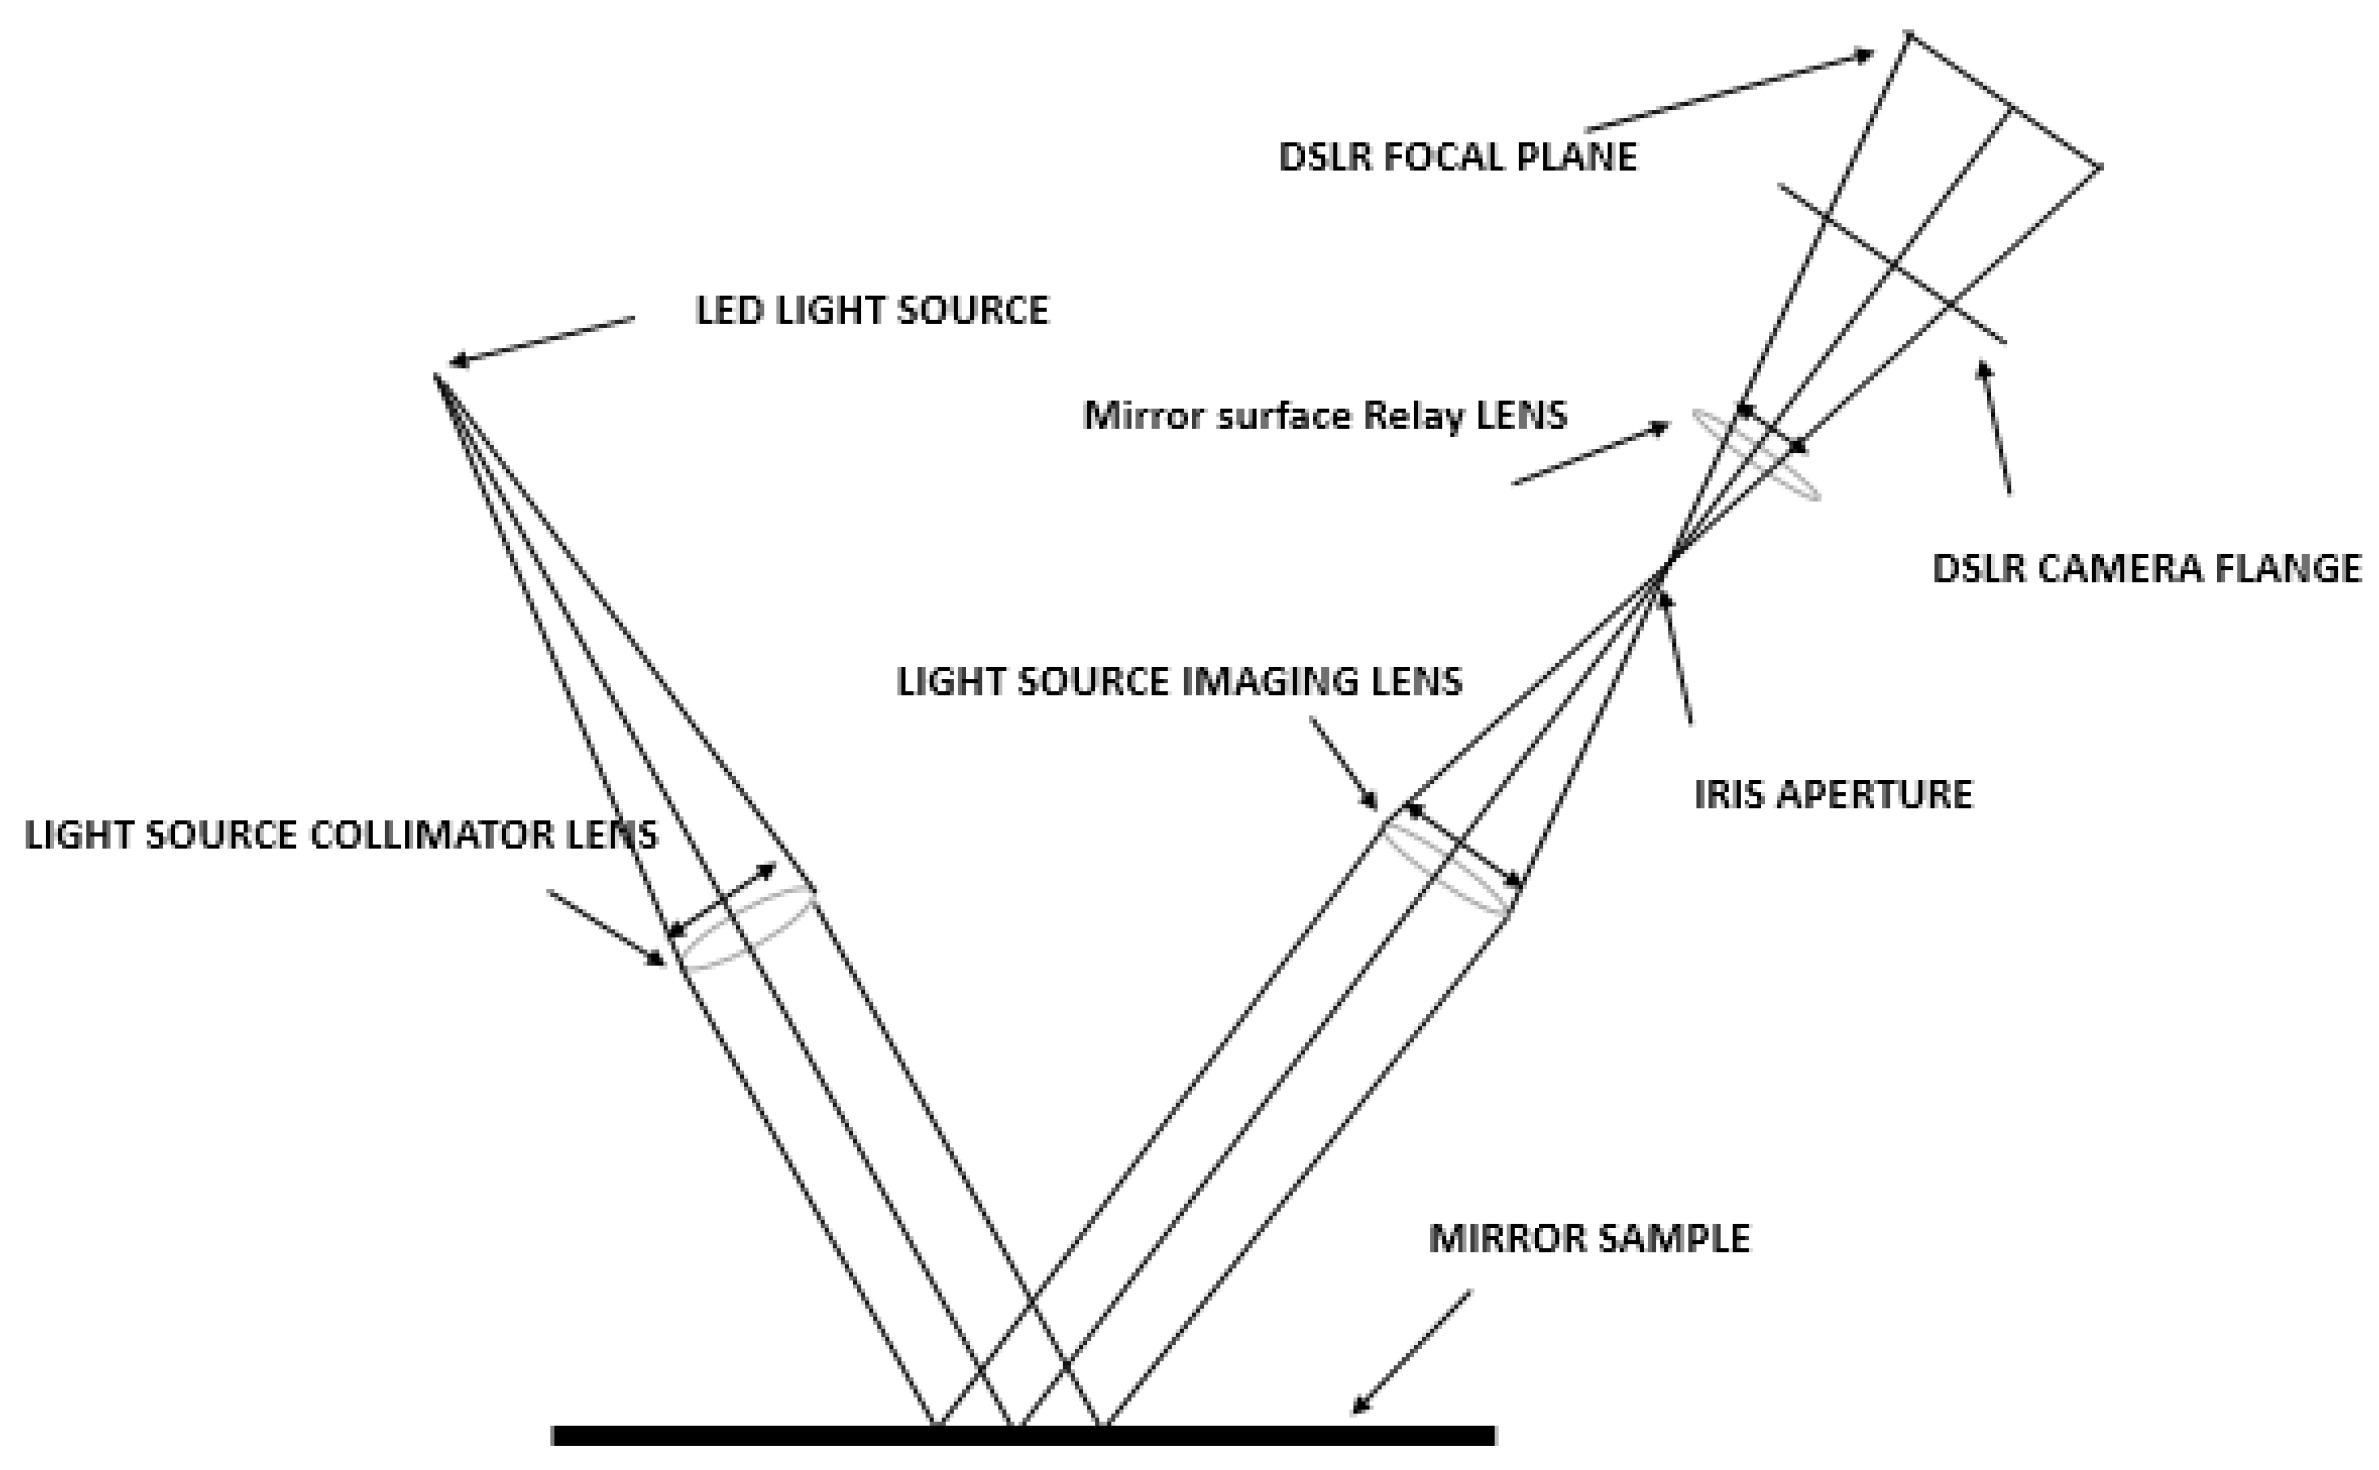
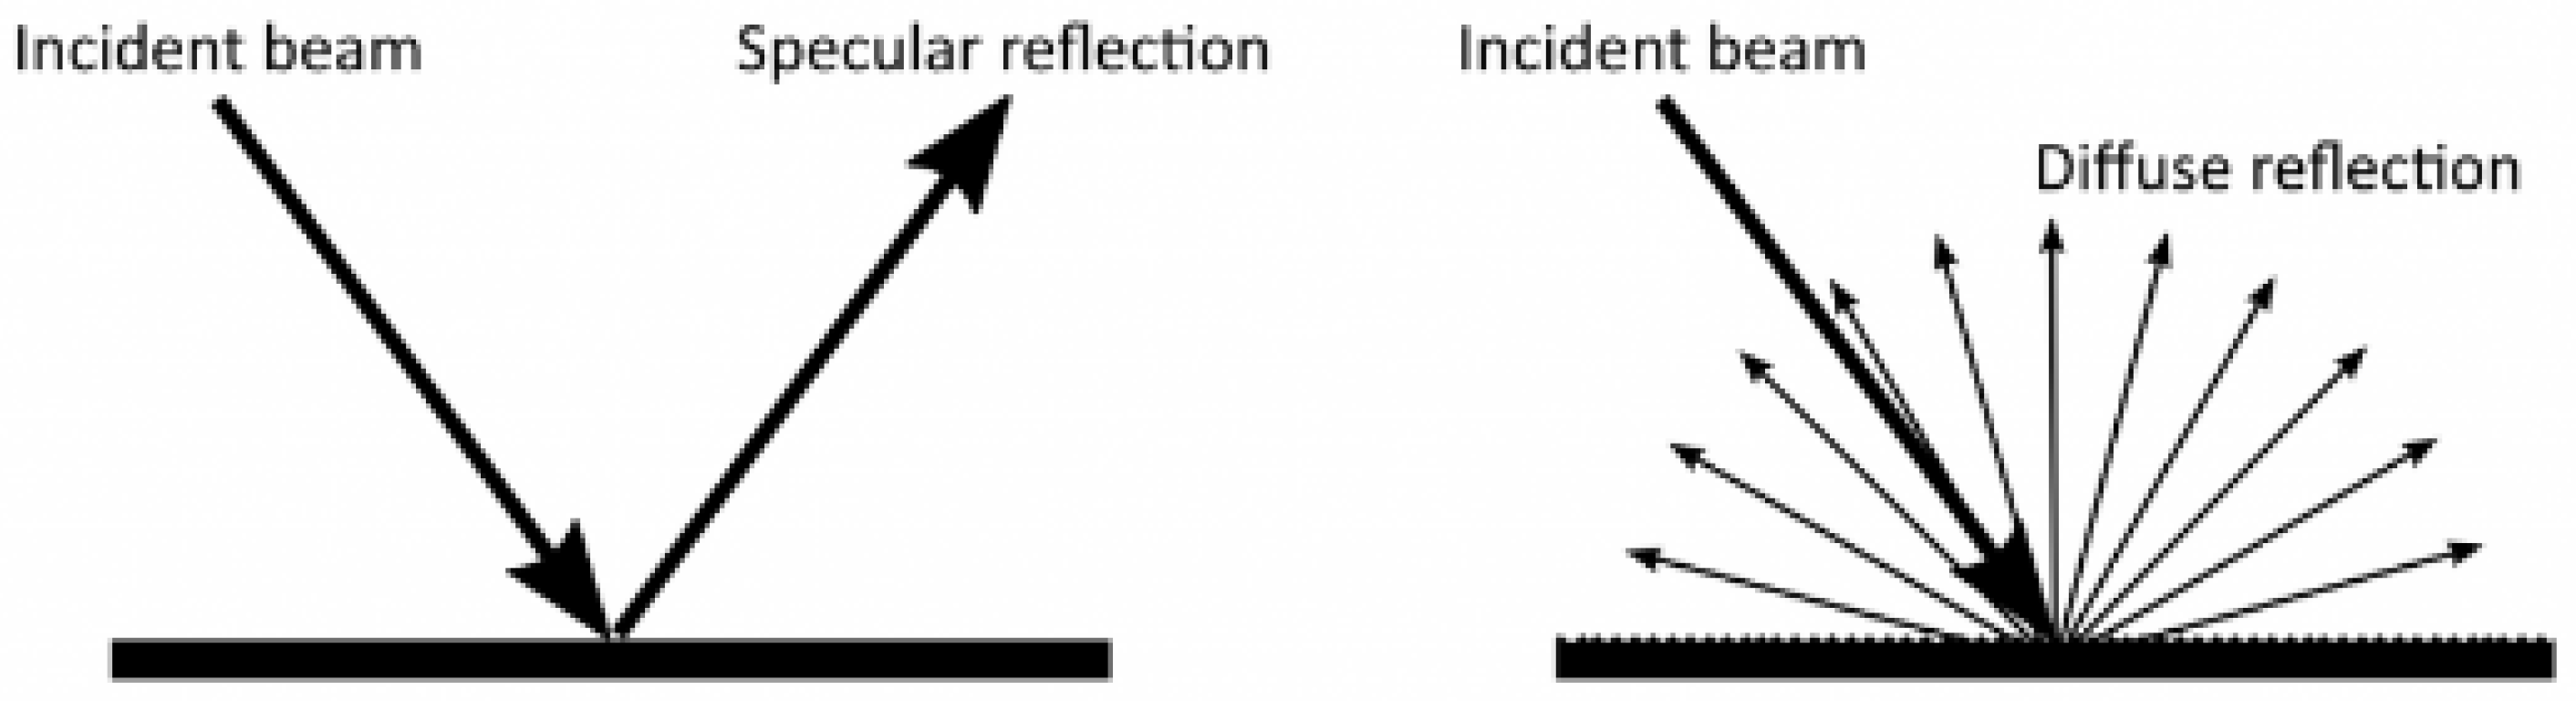
3.1. Light Transmission
- -
- Outdoor soiling microscopy
3.2. Dust Accumulation on CSP Reflector Surfaces
- -
- Surface Mirror
- -
- Second-surface Silvered Glass Mirrors
- -
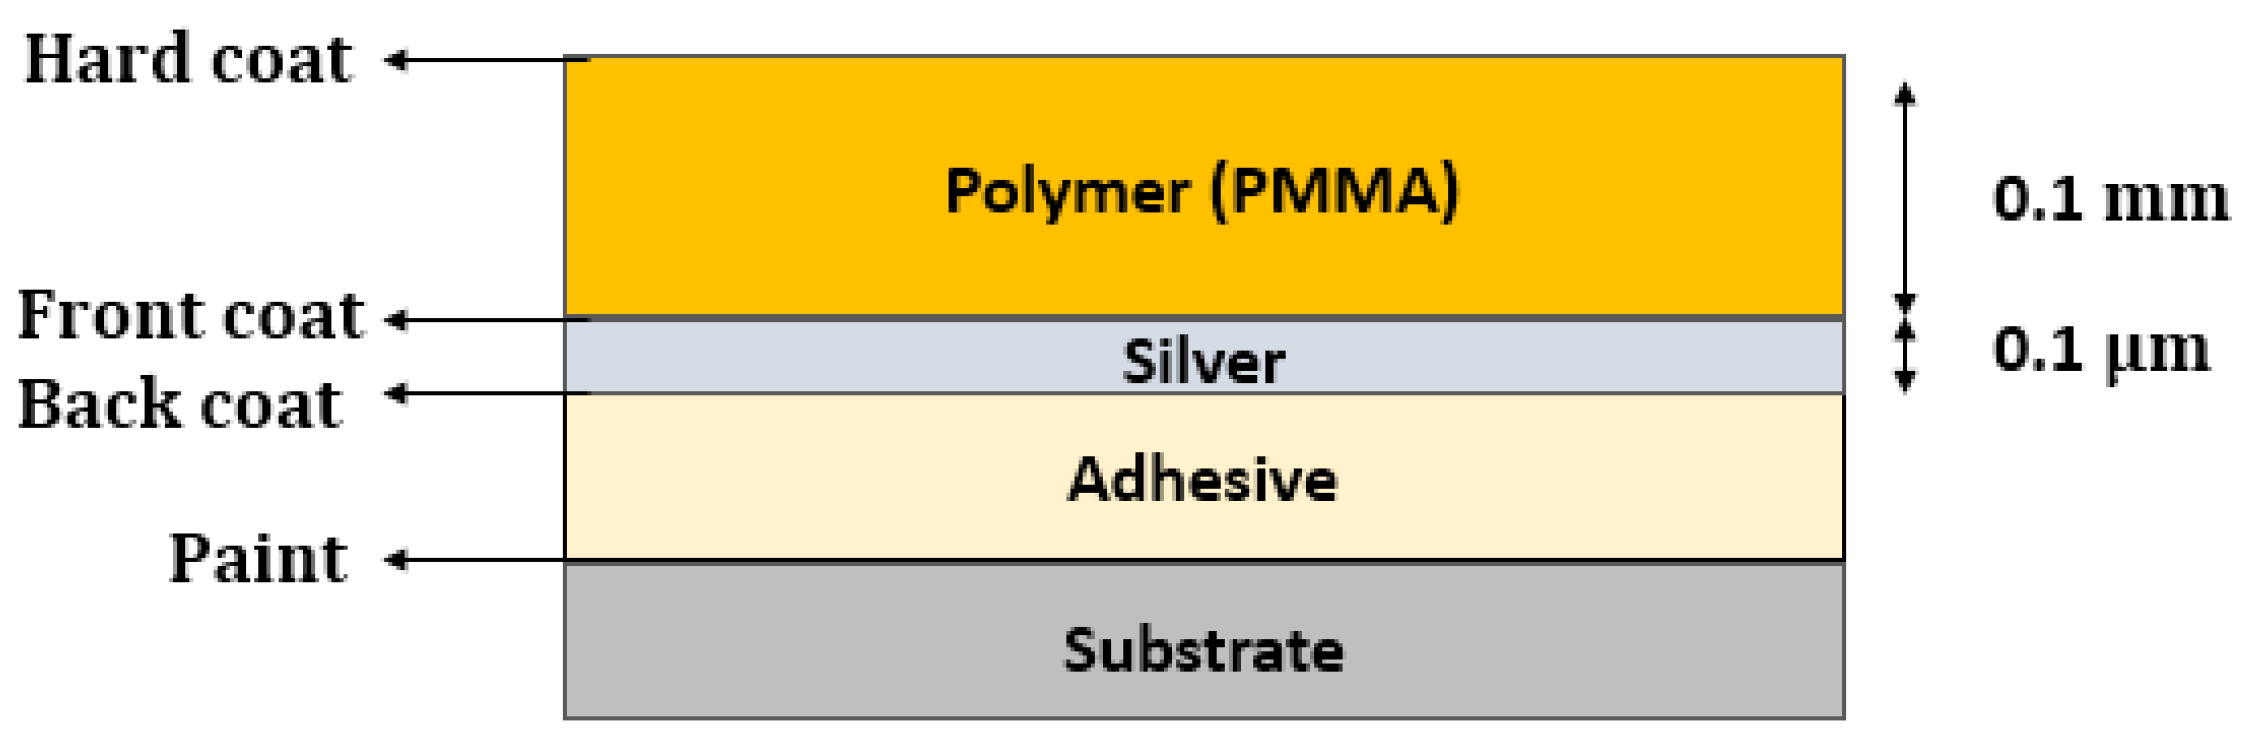
- Silvered Polymer Mirrors
- -
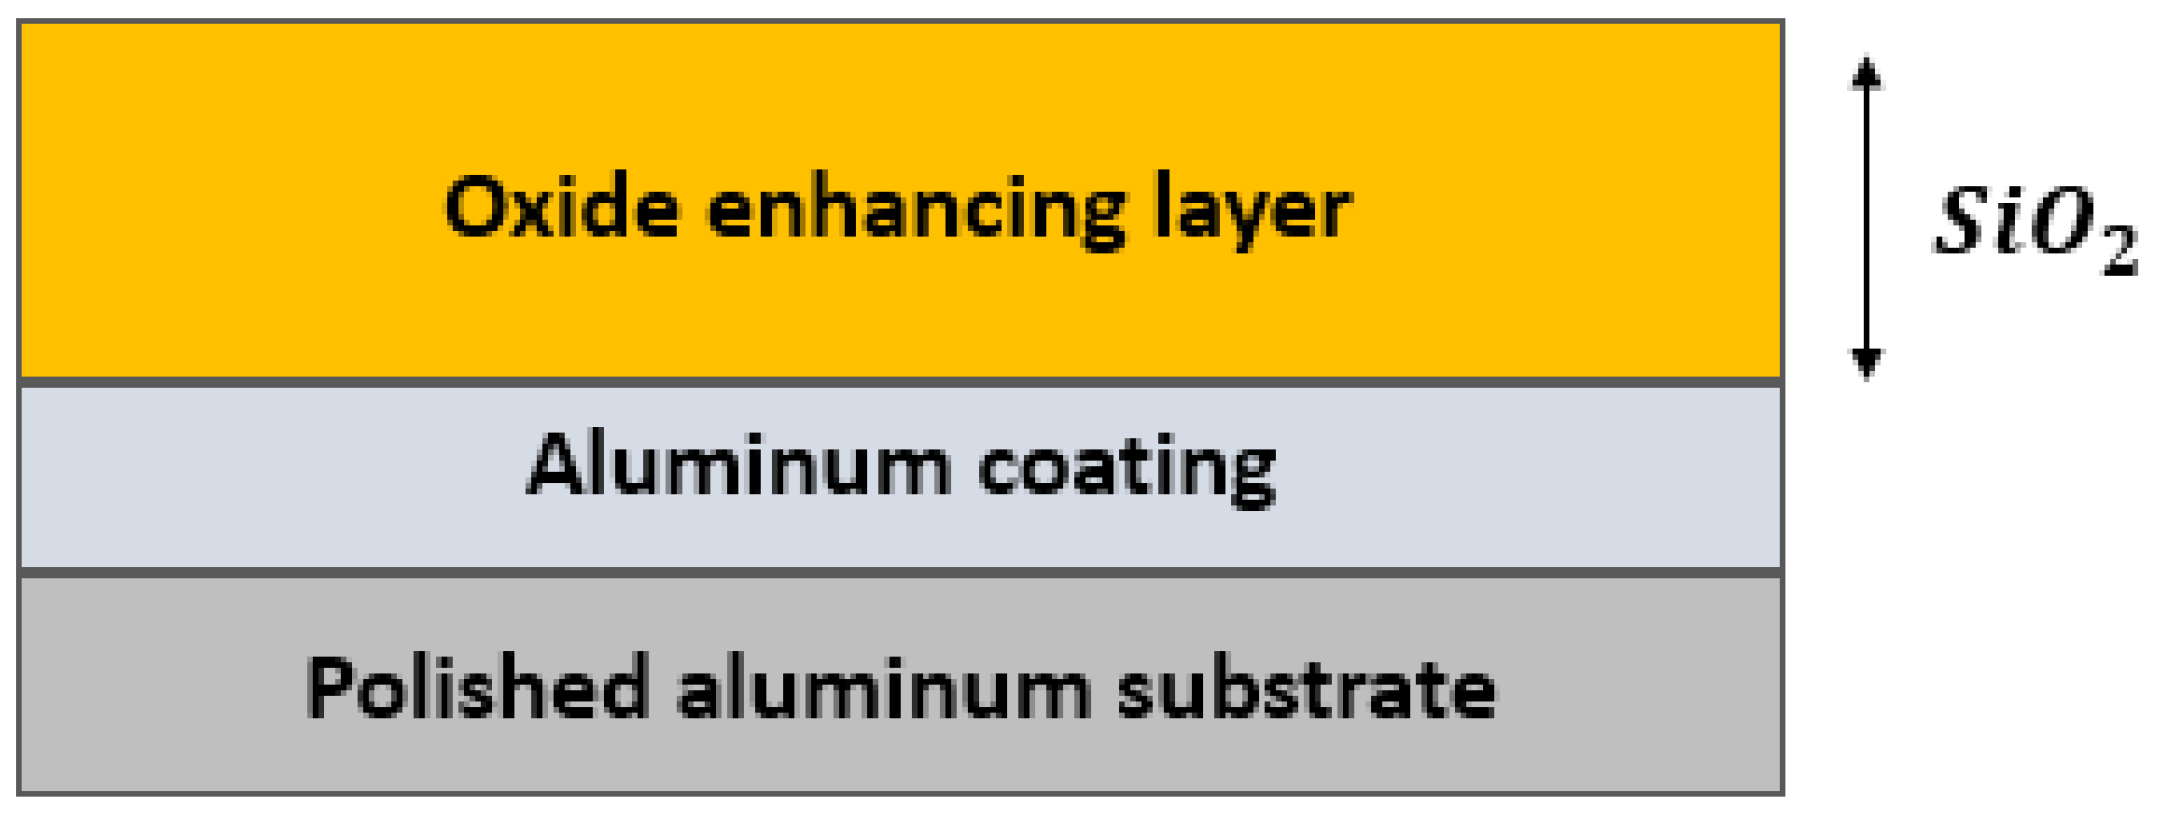
- Aluminum Mirrors
4. Anti-Soiling Coating and Thermodynamics of Self-Cleaning Coating
4.1. Anti-Soiling Coating for CSP Reflector Mirrors
4.2. Thermodynamics of Self-Cleaning Coating
4.3. Surface Roughness Factor
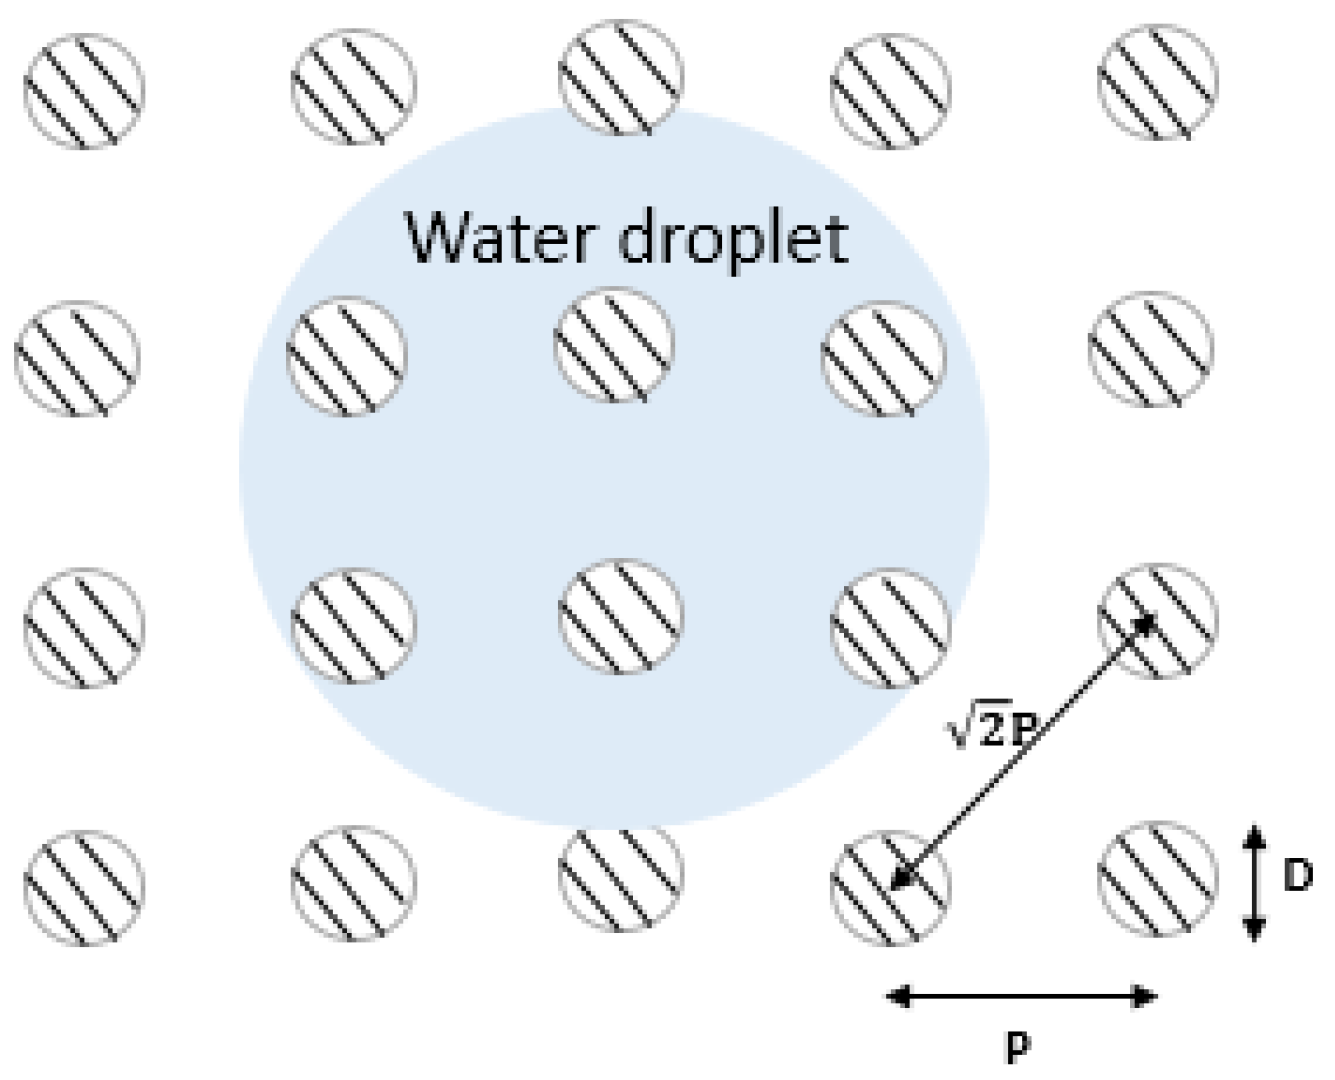
4.3.1. Cassie and Baxter to Wenzel Model Transition Criteria for Patterned Surfaces
- where H is the height of the pillars, P is the pitch, and D is their diameter. The Laplace equation governs the curvature of a droplet, describing the relationship between its maximum drop (δ), pitch (P), and pillar height (H) [37]. If the droplet is far larger than the depth of the cavities, it will make contact with the bottoms of the cavities between the pillars, leaving no air behind. This causes a shift from the Cassie–Baxter model to Wenzel’s model:if the greatest drop of a droplet is more than the height of pillars (). So, there was no air pocket between them, causing the transition from the Cassie–Baxter to the Wenzel regime [38].
4.3.2. Surface Roughness Measurement
5. Dust Adhesion Measurements
5.1. Dust Adhesion Measurement Based on Extended DLVO Theory
- where represents the Lewis-acid component and represents the Lewis-base component. The polar component of surface energy can exceed van der Waals components by up to two orders of magnitude and is most pronounced at distances less than 10 A°. Van der Waals interactions, while generally weaker than electrostatic interactions, exert influence over longer distances through [46].
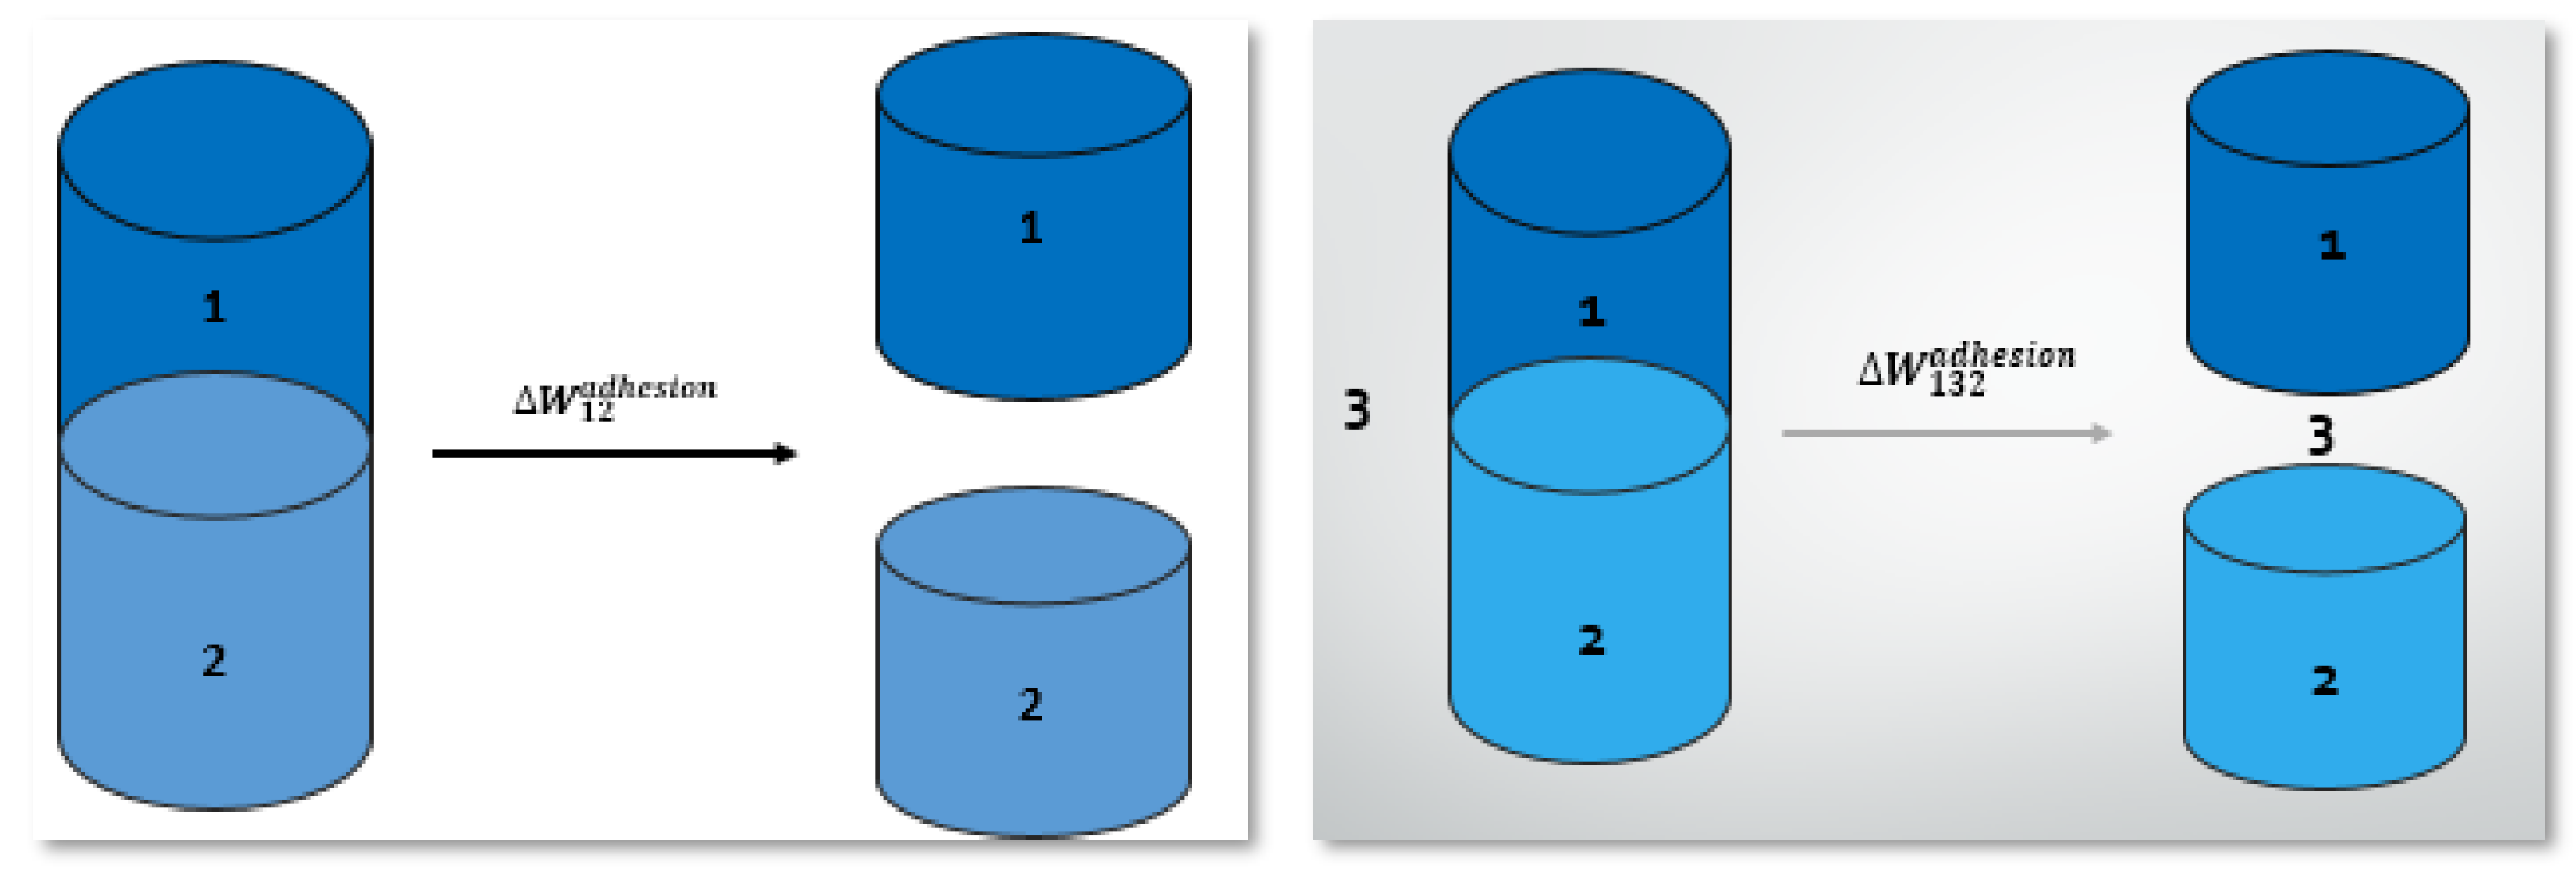
5.2. Work of Adhesion
5.3. Measurement of the Surface Energy and Surface Tension
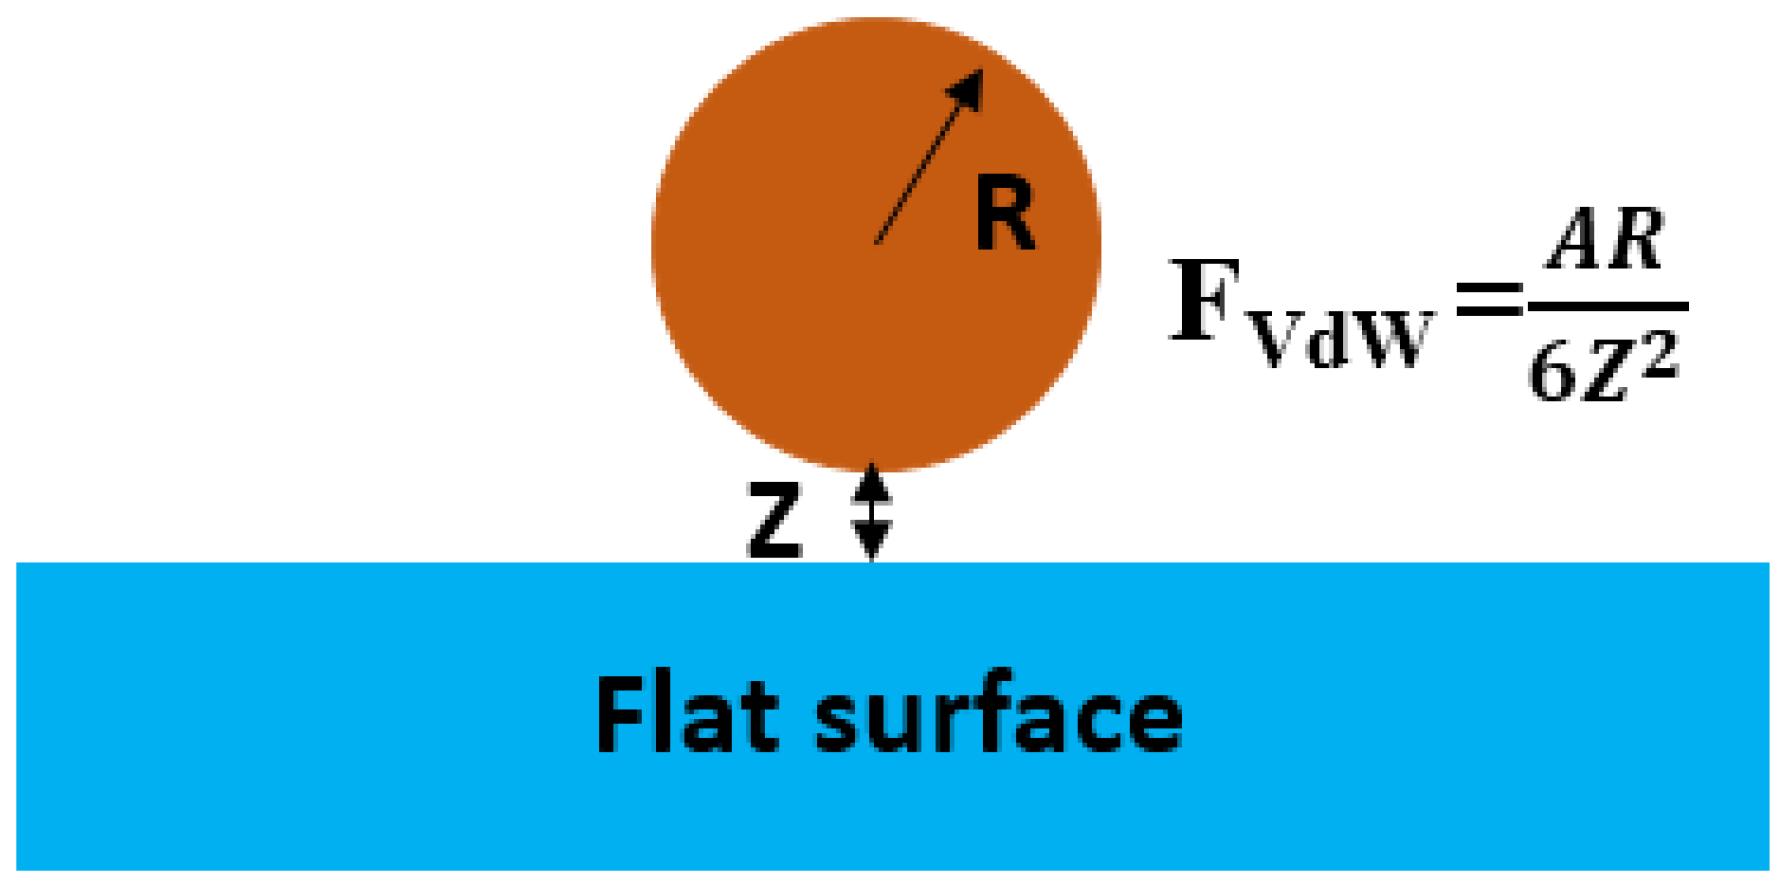
5.4. Adhesion Forces
6. Conclusions
Author Contributions
Funding
Institutional Review Board Statement
Informed Consent Statement
Data Availability Statement
Conflicts of Interest
References
- Figgis, B.; Ennaoui, A.; Ahzi, S.; Rémond, Y. Review of pv soiling particle mechanics in desert environments. Renew. Sustain. Energy Rev. 2017, 76, 872–881. [Google Scholar] [CrossRef]
- Sayyah, A.; Horenstein, M.N.; Mazumder, M.K. Energy yield loss caused by dust deposition on photovoltaic panels. Sol. Energy 2014, 107, 576–604. [Google Scholar] [CrossRef]
- Wentworth, C.K. A scale of grade and class terms for clastic sediments. J. Geol. 1930, 30, 377–392. [Google Scholar] [CrossRef]
- Beaudoin, S.; Jaiswal, P.; Harrison, A.; Laster, J.; Smith, K.; Sweat, M.; Thomas, M. Fundamental forces in particle adhesion. Part. Adhes. Remov. 2015, 1–79. [Google Scholar]
- Kok, J.F.; Parteli, E.J.; Michaels, T.I.; Karam, D.B. The physics of wind-blown sand and dust. Rep. Prog. Phys. 2012, 75, 106901. [Google Scholar] [CrossRef] [PubMed]
- Ilse, K.; Khan, M.Z.; Voicu, N.; Naumann, V.; Hagendorf, C.; Bagdahn, J. Advanced performance testing of anti-soiling coatings—Part ii: Particle-size dependent analysis for physical understanding of dust removal processes and determination of adhesion forces. Sol. Energy Mater. Sol. Cells 2019, 202, 110049. [Google Scholar] [CrossRef]
- Reza, M.; Hizam, H.; Gomes, C.; Amran, M.; Ismael, M.; Hajighorbani, S. Power loss due to soiling on solar panel: A review. Renew. Sustain. Energy Rev. 2016, 59, 1307–1316. [Google Scholar]
- Shao, Y.; Lu, H. A simple expression for wind erosion threshold friction velocity. J. Geophys. Res. 2000, 105, 437–443. [Google Scholar]
- Chentouf, M.; Allouch, M. Environmental energy security in the MENA region–An aggregated composite index. Environ. Dev. Sustain. 2022, 24, 10945–10974. [Google Scholar] [CrossRef]
- Gokon, N. Progress in Concentrated Solar Power, Photovoltaics, and Integrated Power Plants Towards Expanding the Introduction of Renewable Energy in the Asia/Pacific Region. Curr. Sustain. Renew. Energy Rep. 2023, 10, 250–263. [Google Scholar] [CrossRef]
- Ilse, K.K.; Figgis, B.W.; Naumann, V.; Hagendorf, C.; Bagdahn, J. Fundamentals of soiling processes on photovoltaic modules. Renew. Sustain. Energy Rev. 2018, 98, 239–254. [Google Scholar] [CrossRef]
- Al-Hasan, A.Y.; Ghoneim, A.A. A new correlation between photovoltaic panel’s efficiency and amount of sand dust accumulated on their surface. Int. J. Sustain. Energy 2005, 24, 187–197. [Google Scholar] [CrossRef]
- IEC 61724-1; Photovoltaic System Performance–Part 1: Monitoring. International Electrotechnical Commission: Geneva, Switzerland, 2017; Edition 1.0, 2017-03.
- Griffith, D.J.; Vhengani, L.; Maliage, M. Measurements of mirror soiling at a candidate CSP site. Energy Procedia 2014, 49, 1371–1378. [Google Scholar] [CrossRef]
- Shuttleworth, R.; Bailey, G.L.J. The spreading of a liquid over a rough solid. Discuss. Faraday Soc. 1948, 3, 16–22. [Google Scholar] [CrossRef]
- Fernandez-Garcia, A.; Sutter, F.; Martinez-Arcos, L.; Sansom, C.; Wolfertstetter, F.; Delord, C. Equipment and methods for measuring reflectance of concentrating solar reflector materials. Sol. Energy Mater. Sol. Cells 2017, 167, 28–52. [Google Scholar] [CrossRef]
- Smestad, G.P.; Germer, T.A.; Alrashidi, H.; Fernández, E.F.; Dey, S.; Brahma, H.; Sarmah, N.; Ghosh, A.; Sellami, N.; Hassan, I.A.; et al. Modelling photovoltaic soiling losses through optical characterization. Sci. Rep. 2020, 10, 58. [Google Scholar] [CrossRef] [PubMed]
- Figgis, B.; Ennaoui, A.; Ahzi, S.; Rémond, Y. Review of pv soiling measurement methods. In Proceedings of the 2016 International Renewable and Sustainable Energy Conference (IRSEC), Marrakech, Morocco, 14–17 November 2016; pp. 176–180. [Google Scholar]
- Figgis, B.; Ennaoui, A.; Guo, B.; Javed, W.; Chen, E. Outdoor soiling microscope for measuring particle deposition and resuspension. Sol. Energy 2016, 137, 158–164. [Google Scholar] [CrossRef]
- Lopes, D.; Concei, R.; Gon, H.; Aranzabe, E.; Pérez, G.; Collares-Pereira, M. Anti-soiling coating performance assessment on the reduction of soiling effect in second-surface solar mirror. Sol. Energy 2019, 194, 478–484. [Google Scholar] [CrossRef]
- Bethea, R.M.; Barriger, M.T.; Williams, P.F.; Chin, S.; Solar, C.; Project, P. Environmental effects on solar concentrator mirrors. Sol. Energy 1981, 27, 497–511. [Google Scholar] [CrossRef]
- Kennedy, C.E. Optical durability of candidate solar reflectors. ASME Trans. 2016, 1–10. [Google Scholar]
- Pina, A. Technical evaluation of an improved paint coating with nir pigments designed to reduce incident solar radiation: Application in the caribbean area. Energy Procedia 2017, 115, 463–479. [Google Scholar]
- Aytac, T.; Barshan, B. Surface differentiation by parametric modeling of infrared intensity scans. Opt. Eng. 2005, 44, 067202. [Google Scholar] [CrossRef]
- Garcia-Segura, A.; Fern, A.; Ariza, M.J.; Sutter, F.; Valenzuela, L. Durability studies of solar reflectors: A review. Renew. Sustain. Energy Rev. 2016, 62, 453–467. [Google Scholar] [CrossRef]
- Schissel, P. Silvered-pmma reflectors. Sol. Energy Mater. Sol. Cells 1994, 33, 183–197. [Google Scholar] [CrossRef]
- Asmatulu, R.; Khan, W.S.; Reddy, R.J.; Ceylan, M. Synthesis and Analysis of Injection-Molded Nanocomposites of Recycled High-Density Polyethylene Incorporated with Graphene Nanoflakes Department of Mechanical Engineering. Polym. Compos. 2015, 36, 1565–1573. [Google Scholar] [CrossRef]
- Almanza, R.; Herna, P. Development and mean life of aluminum first-surface mirrors for solar energy applications. Sol. Energy Mater. Sol. Cells 2009, 93, 1647–1651. [Google Scholar] [CrossRef]
- Latthe, S.S.; Sutar, R.S.; Kodag, V.S.; Bhosale, A.K.; Kumar, A.M. Self-cleaning superhydrophobic coatings: Potential industrial applications. Prog. Org. Coat. 2019, 128, 52–58. [Google Scholar] [CrossRef]
- Kulinich, S.A.; Farzaneh, M. Hydrophobic properties of surfaces coated with fluoroalkylsiloxane and alkylsiloxane monolayers. Surf. Sci. 2004, 573, 379–390. [Google Scholar] [CrossRef]
- Fujishima, A.; Rao, T.N.; Tryk, D.A. Titanium dioxide photocatalysis. J. Photochem. Photobiol. C Photochem. Rev. 2000, 1, 1–21. [Google Scholar] [CrossRef]
- Carrier, O.; Bonn, D. Droplet Wetting and Evaporation; Number 1950; Elsevier Inc.: Amsterdam, The Netherlands, 2015. [Google Scholar]
- Furmidge, C. Studies at phase interfaces. i. the sliding of liquid drops on solid surfaces and a theory for spray retention. J. Colloid Sci. 1962, 17, 309–324. [Google Scholar] [CrossRef]
- Marmur, A. Wetting on hydrophobic rough surfaces: To be heterogeneous or not to be? Langmuir 2003, 1, 8343–8348. [Google Scholar] [CrossRef]
- Jung, Y.C.; Bhushan, B. Wetting transition of water droplets on superhydrophobic patterned surfaces. Scr. Mater. 2007, 57, 1057–1060. [Google Scholar] [CrossRef]
- Mchale, G.; Aqil, S.; Shirtcliffe, N.J.; Newton, M.I.; Erbil, H.Y. Analysis of droplet evaporation on a superhydrophobic surface. Langmuir 2005, 21, 11053–11060. [Google Scholar] [CrossRef] [PubMed]
- Lafuma, A.; Quéré, D. Superhydrophobic states. Nat. Mater. 2003, 2, 457–460. [Google Scholar] [CrossRef] [PubMed]
- Techniques, A. Promising future processing technology. In Advances in CMP Polishing Technologies; William Andrew: Norwich, NY, USA, 2012; pp. 229–295. [Google Scholar]
- Quesnel, D.J.; Zeng, X.; Renshaw, P.F.; Helms, C.A.; Grisham, A.; Chin, J.; Fellers, T.; Lai, F.; Yoon, J.; Torralba, S.; et al. Aspects of particle adhesion and removal. In Developments in Surface Contamination and Cleaning, 2nd ed.; Elsevier Inc.: Amsterdam, The Netherlands, 2016; Volume 1, pp. 119–146. [Google Scholar]
- Isaifan, R.J.; Johnson, D.; Ackermann, L.; Figgis, B.; Ayoub, M. Evaluation of the adhesion forces between dust particles and photovoltaic module surfaces. Sol. Energy Mater. Sol. Cells 2019, 191, 413–421. [Google Scholar] [CrossRef]
- Zafar, U.; Hare, C.; Hassanpour, A.; Ghadiri, M. Drop test: A new method to measure the particle adhesion force. Powder Technol. 2014, 264, 236–241. [Google Scholar] [CrossRef]
- Kazmerski, L.L.; Diniz, A.S.A.; Maia, C.B.; Viana, M.M.; Costa, S.C.; Brito, P.P.; Campos, C.D.; Neto, L.V.M.; de Morais Hanriot, S.; de Oliveira Cruz, L.R. Fundamental studies of adhesion of dust to PV module surfaces. IEEE J. Photovolt. 2016, 6, 719–729. [Google Scholar] [CrossRef]
- Tan, C.L.C.; Gao, S.; Wee, B.S.; Asa-Awuku, A.; Thio, B.J.R. Adhesion of dust particles to common indoor surfaces in an air-conditioned environment. Aerosol. Sci. Technol. 2014, 6826, 541–551. [Google Scholar] [CrossRef]
- Churaev, N.V. The dlvo theory in russian colloid science. Adv. Colloid Interface Sci. 1999, 83, 19–32. [Google Scholar] [CrossRef]
- Bhattacharjee, S.; Elimelech, M.; Borkovec, M. Dlvo interaction between colloidal particles: Beyond derjaguin’s approximation. Croat. Chem. Acta 1998, 71, 5–8. [Google Scholar]
- Laskowski, J.; Kitchener, J.A. The hydrophilic–hydrophobic transition on silica. J. Colloid Interface Sci. 1968, 29, 670–679. [Google Scholar] [CrossRef]
- Van Oss, C.J.; Chaudhury, M.K.; Good, R.J. Interfacial lifshitz-van der Waals and polar interactions in macroscopic systems. Chem. Rev. 1988, 88, 927–941. [Google Scholar] [CrossRef]
- Chan, C.T.; Ho, K.M.; Bohnen, K.P. Surface reconstruction: Metal surfaces and metal on semiconductor surfaces. Phys. Struct. 1996, 1, 101–136. [Google Scholar]
- Marshall, S.J.; Bayne, S.C.; Baier, R.; Tomsia, A.P.; Marshall, G.W. A review of adhesion science. Dent. Mater. 2010, 6, 11–16. [Google Scholar] [CrossRef] [PubMed]
- Is, W.; Interface, A.N.; Tension, S. Surface tension and its measurement. In Adhesives Technology Handbook; William Andrew Publishing: Norwich, NY, USA, 2015; pp. 19–34. [Google Scholar]
- Rifai, A.; Abu, N.; Yilbas, B.S.; Khaled, M. Mechanics of dust removal from rotating disk in relation to self-cleaning applications of PV protective cover. Sol. Energy 2016, 130, 193–206. [Google Scholar] [CrossRef]
- Quan, Y.; Zhang, L.; Qi, R.; Cai, R. Self-Cleaning of Surfaces: The Role of Surface Wettability and Dust Types; Nature Publishing Group: Berlin, Germany, 2016; pp. 1–12. [Google Scholar]
- Butt, H.; Kappl, M. Normal capillary forces. Adv. Colloid Interface Sci. 2009, 146, 48–60. [Google Scholar] [CrossRef] [PubMed]
- Bowling, R.A. An analysis of particle adhesion on semiconductor surfaces. J. Electrochem. Soc. 1985, 157, 2208–2214. [Google Scholar] [CrossRef]
- Alexander, S.; Hellemans, L.; Marti, O.; Schneir, J.; Elings, V.; Hansma, P.K.; Longmire, M.; Gurley, J. An atomic-resolution atomic force microscope implemented using an optical lever. J. Appl. Phys. 1989, 65, 164–167. [Google Scholar] [CrossRef]
- Bhushan, B.; Marti, O. Scanning probe microscopy–principle of operation, instrumentation, and probes. In Nanotribology and Nanomechanics; Springer: Cham, Switzerland, 2011; pp. 37–110. [Google Scholar]


| Technique | Advantages | Limitations | Suitability for CSP Reflector Surfaces |
|---|---|---|---|
| Extended DLVO Theory | - Theoretical foundation for adhesion | - Requires accurate surface energy data - Assumes ideal conditions | - Provides a theoretical basis for understanding adhesion mechanisms but may not fully capture real-world conditions |
| Adhesion Force | - Quantifies individual forces (van der Waals, capillary, electrostatic) - Applicable to different particle sizes | - Complex calculations - Requires precise measurements of multiple parameters | - Useful for detailed analysis of dust adhesion dynamics - Can guide the development of tailored anti-soiling coatings |
| Atomic Force Microscopy | - High precision at micro/nano scale - Direct measurement of adhesion forces | - Expensive and time-consuming - Requires specialized equipment | - Suitable for detailed, high-resolution studies of dust adhesion on CSP surfaces - Can validate theoretical models |
Disclaimer/Publisher’s Note: The statements, opinions and data contained in all publications are solely those of the individual author(s) and contributor(s) and not of MDPI and/or the editor(s). MDPI and/or the editor(s) disclaim responsibility for any injury to people or property resulting from any ideas, methods, instructions or products referred to in the content. |
© 2024 by the authors. Licensee MDPI, Basel, Switzerland. This article is an open access article distributed under the terms and conditions of the Creative Commons Attribution (CC BY) license (https://creativecommons.org/licenses/by/4.0/).
Share and Cite
El Baraka, A.; En-nadir, R.; Basyooni-M. Kabatas, M.A.; Jorio, A.; Khaldoun, A. Soiling, Adhesion, and Surface Characterization of Concentrated Solar Power Reflectors: Insights and Challenges in the MENA Region. Sustainability 2024, 16, 6257. https://doi.org/10.3390/su16146257
El Baraka A, En-nadir R, Basyooni-M. Kabatas MA, Jorio A, Khaldoun A. Soiling, Adhesion, and Surface Characterization of Concentrated Solar Power Reflectors: Insights and Challenges in the MENA Region. Sustainability. 2024; 16(14):6257. https://doi.org/10.3390/su16146257
Chicago/Turabian StyleEl Baraka, Ayoub, Redouane En-nadir, Mohamed A. Basyooni-M. Kabatas, Anouar Jorio, and Asmae Khaldoun. 2024. "Soiling, Adhesion, and Surface Characterization of Concentrated Solar Power Reflectors: Insights and Challenges in the MENA Region" Sustainability 16, no. 14: 6257. https://doi.org/10.3390/su16146257