Article

Irrigation Water Quality Assessment in Egyptian Arid Lands, Utilizing Irrigation Water Quality Index and Geo-Spatial Techniques

by
Mohamed E. Fadl
1,*,
Doaa M. Abou ElFadl
2,
Elhussieny A. Abou Hussien
2,
Mohammedi Zekari
3,
Eltaher M. Shams
4,
Marios Drosos
5,
Antonio Scopa
5,* and
Hanaa A. Megahed
6
1
Division of Scientific Training and Continuous Studies, National Authority for Remote Sensing and Space Sciences (NARSS), Cairo 11769, Egypt
2
Soil Science Department, Faculty of Agriculture, Menoufia University, Menoufia, Shebin El-Kom 32512, Egypt
3
National Higher Agronomic School, El Harrach, Algiers 16200, Algeria
4
Geography and GIS Department, Faculty of Arts, Assiut University, Assiut 71526, Egypt
5
Scuola di Scienze Agrarie, Forestali, Alimentari ed Ambientali (SAFE), Università degli Studi della Basilicata, Via dell’Ateneo Lucano 10, 85100 Potenza, Italy
6
Division of Geological Applications and Mineral Resources, National Authority for Remote Sensing and Space Sciences (NARSS), Cairo 11769, Egypt
*
Authors to whom correspondence should be addressed.
Sustainability 2024, 16(14), 6259; https://doi.org/10.3390/su16146259
Submission received: 28 April 2024 / Revised: 28 June 2024 / Accepted: 20 July 2024 / Published: 22 July 2024

Abstract

:
This study focused on assessing surface water quality in the northwest part of the Egyptian Nile Delta (El-Menoufia Governorate) and evaluated water suitability for irrigation purposes using the Irrigation Water Quality Index (IWQI), Permeability Index (PI), Wilcox, United State Salinity (USSL) diagram, and Piper trilinear diagrams categories, taking into consideration various water quality parameters. The results showed that, based on the IWQI, most of the water samples (61.8%) in the investigated area fell under the no restriction water (NR) category. Furthermore, the Wilcox diagram demonstrated that most of the investigated water samples (93.6%) are categorized as doubtful water; this shows that those samples have a higher sodium content material. According to the USSL diagram, most of the water samples (70.9%) fell into the high salinity (C) and moderate sodium (S) content (C3S2) class. According to the PI index, 8.2% of the tested water samples fell into class II (suitable for irrigation) and 91.8% fell into class III (unsuitable for irrigation). Based on the Piper trilinear, the water type is Na-Cl-HCO3. According to these results, most of the water samples require more water regulations, are categorized as doubtful water that causes plants’ augmentation sensitivity if used for irrigation, and fell into the high salinity (EC) and sodium absorption ratio (SAR) magnitude, which might have negative outcomes on soil and plant health if used for irrigation, have extensive obstacles, and are improper for irrigation. Therefore, proper management practices and treatments may be vital to mitigate the adverse effects of salinity and SAR on soil and plant health in this study area. Therefore, addressing water deficiency and quality in Egypt’s northwest Nile delta is crucial for suitable irrigation purposes.

1. Introduction

Water scarcity is a significant global issue that affects many regions around the world where the demand for water exceeds its availability. This fact could lead to conflicts over water assets with impacts on agriculture and food supply. Moreover, climate change modifies rainfall patterns, causing greater, more frequent, and more severe droughts and floods. These alterations exacerbate water scarcity. To alleviate these challenging situations, sustainable water management practices are required; this can be accomplished by investment in infrastructure, conservation efforts, and coverage changes [1].
Many drainage canals are liable to pollutants from the discharges of untreated domestic and industrial wastewater; this may arise because of insufficient wastewater treatment systems or wrong disposal practices [2]. However, it is encouraging to understand that a portion of wastewater in rural areas is reused for irrigation purposes [3]. Reusing treated agricultural drainage water for irrigation is a sustainable practice that could assist in reducing the demand for freshwater sources. Imposing the proper remedy and regulation procedures for agricultural drainage water is critical to ensure that it is suitable for reuse. This may also include employing numerous remedy techniques, such as filtration, oxidation, or disinfection, to cast off contaminants and pathogens. Additionally, monitoring and testing of the water should be carried out to ensure compliance with relevant regulations and recommendations [4]. To make use of the capability of agricultural water as a non-traditional water resource, it is absolutely crucial to put into effect suitable remedy and regulation tactics, certifying the elimination of contaminants and pathogens.
Especially in Egypt, this could be essentially useful and could contribute to water scarcity challenges’ mitigation by providing sustainable water management practices within the country [5]. Utilizing drainage water for irrigation in Egypt may alleviate the growing demand for water in agriculture, decreasing the reliance on freshwater sources. This is important in a water-stressed environment, such as Egypt, in which freshwater sources are constrained. By reusing drainage water, farmers can optimize water usage and ensure the sustainability of agricultural production. This practice helps to conserve freshwater resources for other purposes and supports the overall economy by maintaining a strong agricultural sector [6]. Nevertheless, it also emphasizes the significance of implementing effective techniques in irrigation and water management to guarantee the optimal utilization of the available water resources [7,8].
Monitoring and maintaining water purity is important for achieving the safety and sustainability of water resources for human and environmental needs [9]. Indeed, the assessment of first-rate irrigation water is critical for sustainable agriculture and minimizing potential effects on crops. The Irrigation Water Quality Index (IWQI) is an index used to evaluate the suitability of water for irrigation purposes. It takes into consideration numerous parameters along with physical, chemical, and biological water characteristics [10].
Geographic information systems (GIS) and IWQI methods are potential management tools for providing monitoring data and spatial distribution maps for IWQI parameters and measuring water quality [11]. Monitoring tools for surface water quality can provide representative and reliable estimations, despite the challenges posed by spatial and temporal variations in water quality. GIS and IWQI methods can be used to generate monitoring reports and aid decision-makers in understanding the quality of surface water and optimizing its use in the future, and the concentration of various irrigation water quality parameters are important factors that affect human health and living organisms. It is a single value that defines irrigation water quality, simplifying the evaluation process compared to complex data intervals [12]. The IWQI is based on encouraged boundaries for continuous water utilization across different soil types, and the water quality index is a normally used tool to assess the overall water quality [13]. One of the primary demanding situations with the IWQI is the choice and weighting of parameters. Irrigation Water Quality Index (IWQI) models are used to evaluate the quality of water by integrating multiple water quality parameters into a single index. Different IWQI models may use exclusive parameters and assign unique weights to these parameters to suit specific objectives or environmental conditions [14]. The selection and weighting system might not be continually based primarily on scientific evidence or specific local conditions, which can limit the accuracy and relevance of the index. In reality, some parameters have a greater effect on water quality and human health. Ignoring this variability can result in an oversimplified and potentially deceptive representation of water quality [12]. Furthermore, the IWQI does not take into consideration the specific requirements and characteristics of various water uses. For example, first-rate water requirements for drinking water deviate from those for irrigation or leisure use. Failing to account for those precise necessities can lead to irrelevant management selections and the inadequate protection of water assets [15]. Furthermore, the IWQI does not take into consideration emerging contaminants or pollution that may not be included within the decided-on parameters [16]. Lastly, the IWQI is calculated using a complicated mathematical formulation and algorithms, which avert its expertise and accessibility for non-specialists and stakeholders. The loss of transparency and comprehensibility can restrict the usefulness and popularity of the IWQI as a decision-making tool [17]. The index-based total assessment of water quality for irrigation involves the usage of particular indices to evaluate the suitability of water for irrigation purposes. These indices are frequently based on diverse water quality parameters consisting of pH, EC, total dissolved solids (TDS), SAR, particular ion concentrations, and other indices such as Na%, which evaluates the sodium hazard in irrigation water, and the Kelly’s Ratio (KR), which assesses the suitability of water for specific crops, based at the ratio of sodium to calcium and magnesium ions [18].
In surface irrigation, it is important to reveal and examine diverse water quality parameters to ensure the suitability of water for agricultural functions. These parameters consist of pH, TDS, EC, turbidity, dissolved oxygen (DO), biochemical oxygen demand (BOD), nitrate and phosphate levels, pesticides, heavy metals, and microbiological indicators, which include total or fecal coliform bacteria [19].
The main object of this study was to provide spatial distribution maps for the IWQI parameters, such as water electric conductivity (EC), sodium absorption ratio (SAR), sodium ion concentration (Na+), chloride ion concentration (Cl), bicarbonate ion concentration (HCO3), and other relevant indicators in El-Menoufia Governorate, Egypt, to identify the water quality status throughout different areas of the study area.
In essence, the combination of irrigation water quality parameters, such as SAR, EC, Na%, chloride concentration, and permeability index (PI), can help to identify potential problems in water quality due to the current irrigation practices in the study area.
By using GIS zoning maps, the distribution of irrigation water quality of the study area was represented and combined with other water quality parameters and indices to identify “GIS Zones” that can serve as a guide for developing a sustainable groundwater management plan for agricultural purposes. Moreover, GIS maps can also be used to recommend suitable crops for different soil types in the study area, according to the irrigation water quality parameters.

2. Materials and Methods

2.1. Description of Study Area

El-Menoufia Governorate is located in the Nile Delta region of Egypt between 30°25′0″ to 31°18′7″ E and 30°8′23″ to 30°50′031″ N, with an area of 2460 km2 (Figure 1). The climate in El-Menoufia Governorate is assessed as a Mediterranean Sea climate. It is characterized by having a hot summer and mild winter. Regarding precipitation, El-Menoufia Governorate receives little or no rainfall, with an average annual precipitation of around 50 mm. Most of the rainfall falls partially during the winter months, mainly in December and January. According to the Koppen–Geiger climate classification scheme for the last 30 years [20], the annual average temperature in El-Menoufia Governorate ranges from 12.7 °C to 40.2 °C. The summer months (June to August) are the hottest, with average excessive temperatures achieving 26.45 °C. In contrast, the winter months (December to February) are distinctly moderate, with common excessive temperatures ranging from 13.7 °C to 22.3 °C. In the case of El-Menoufia Governorate in Egypt, evaporation happens due to the high temperatures and dry weather within the area. The high temperatures and dry climate lead to high evaporation rates from water sources such as canals and the Nile River, where the average daily evaporation rate reached 5.2 mm, indicating the continued loss of surface water in the study area. The lowest proportion of relative humidity is observed in April, with an average of 56.8%, and the highest proportion of relative humidity is observed in December, with an average of 65.13%, which indicates that the air during that month is relatively more humid. The soil temperature regime in El-Menoufia Governorate is classified as “Thermic”, indicating high soil temperatures; the soil moisture regime is defined as “Torric”, which signifies low soil moisture content [21]. In El-Menoufia Governorate surface irrigation, water is pumped from irrigation canals and distributed across the fields using basin or flood irrigation techniques. These methods are often used for crops that can tolerate semi-arid or moderate conditions, such as wheat, barley, faba bean, and lentil or certain types of vegetables, and can be relatively simple and cost-effective, especially in areas where water resources are readily available [22].

2.2. Samples’ Collection and Analysis

Collecting water samples is a critical step in assessing water quality and exploring the water characteristics of irrigated canals and drains. A total of 110 water samples were gathered with the use of plastic bottles (using 1 L pre-wiped, clean, polyethylene bottles that were rinsed very well with sampling water and sealed) from all irrigation canals within the examined area during September 2022 (Figure 1). By following the American Public Health Association guidelines (APHA, 1998) [23,24], water sampling is typically performed to research numerous parameters, which include water acidity (pH), water EC (µS cm−1), calcium (Ca2+), magnesium (Mg2+), sodium (Na+), potassium (K+), chloride (Cl), bicarbonates (HCO3), sulfate (SO42−), and sodium adsorption ratio (SAR), as shown in Table 1. The methods typically involve sample collection, preservation, and laboratory analysis, following specific steps and protocols for a comprehensive assessment of water quality and assessing the suitability of water for irrigation purposes using the IWQI [25].

2.3. Sodium Adsorption Ratio (SAR) Determination

SAR is a parameter used to assess the suitability of water for irrigation purposes and determine the potential of water to cause sodium-related problems in soil, such as soil structure degradation and reduced permeability. The SAR was calculated using Equation (1) [26]:
S A R = N a + C a 2 + + M g 2 + 2  
where Na+ represents the concentration of sodium ions and Ca2+ and Mg2+ constitute the concentrations of calcium and magnesium ions, respectively. The obtained SAR values (meq L−1)1/2 for water samples are represented in Table 2:

2.4. Sodium Percent (Na%) Determination

The classification of water based totally on Na% is a useful tool for evaluating its suitability for irrigation purposes. The classification was developed by Wilcox (1955) [27] and has been widely used in the preceding research. Water classification primarily based on Na% is separated into five classes [13]: excellent water (0 ≤ Na% ≤ 20%), good water (20% < Na% ≤ 40%), permissible water (40% < Na% ≤ 60%), doubtful water (60% < Na% ≤ 80%), and unsuitable water (80% <Na % ≤ 100%). The Na% was determined using Equation (2):
N a % = ( N a + + K + ) ( C a + 2 + M g + 2 + N a + + K + ) × 100
where Na% is the sodium percent and Na+, K+, Ca2+, and Mg2+ are the concentrations of the major cations in meq L−1. The study area water samples were classified into three classes: permissible water (4 samples), doubtful water (103 samples), and unsuitable water (3 samples) based on Na%, as shown in Table 3.

2.5. Capability of Water Movement in Soil (the Permeability Index (PI))

The permeability index (PI) is an index used to evaluate the suitability of water for irrigation depending on its effect on soil permeability. The PI index measures the long-term use of high salinity irrigation water by considering the effects of water ions such as Na+, Ca2+, Mg2+, HCO3, and others [28]. The permeability index (PI) categorizes water into three classes primarily based on its suitability for irrigation: class I (>75% of most permeability), class II (25–75% of maximum permeability), and class III (<25% of maximum permeability. The PI index was developed by Doneen (1975) [29] and calculated using Equation (3).
P I = N a + + H C O 3 C a 2 + + M g 2 + + N a + × 100

2.6. Irrigation Water Quality Index (IWQI)

To achieve the Irrigation Water Quality Index (IWQI), the subsequent five water quality parameters are taken into consideration: water EC, SAR, Na+, Cl, and HCO3 by the standardized classes of the water quality parameters (meq L−1). The IWQI is a weighted sum of individual water quality parameters (qi), with each parameter assigned a specific weight (Wi) based on its suitability for irrigation. The IWQI is classified into 5 levels, each representing a distinctive level of limit on irrigation water purposes: (1) No restriction (IWQI = 85–100): water of an excellent first-class condition that may be used without any regulations for irrigation purposes; (2) Low restriction (IWQI = 70–85): water that can have a few minor limitations but can nevertheless be used for irrigation with minimum effect on soil and plants; (3) Moderate restriction (IWQI = 55–70): water that poses moderate limitations on irrigation because of its quality, requiring some control practices to mitigate its poor effects on soil and plants; (4) High restriction (IWQI = 40–55): water that has significant limitations on irrigation and can require considerable management practices or treatment to minimize its destructive outcomes on soil and plants; (5) Severe restriction (IWQI = 0–40): water that is of very poor quality and should no longer be used for irrigation because of its high toxicity, which can be harmful to soil and plants. [12]. The irrigation water quality (qi) parameters alongside their proposed proscribing values are summarized in Table 4 [30].
Typically, in the evaluation of the IWQI, different water quality parameters are considered and the proposed limiting values for these parameters are determined based on the specific requirements and tolerance levels for irrigation. The water quality parameters (qi) were determined by Equation (4) (Table 5) using the water samples’ data in Table 6.
q i = q m a x x i j x i n f × q i m a p x i m a p
This equation involves the upper value of the corresponding class (qmax), the data points of the water parameters (Xij), the lower limit value of the parameter class (Xinf), the class amplitude for qi classes (qimap), and the class amplitude to which the parameter belongs (ximap).
To calculate the IWQI, Equation (5) was used, where n represents the number of water parameters, qi represents the value of a specific water quality parameter, such as electrical conductivity, etc., and wi refers to the weight assigned to each parameter [32].
I W Q I = 1 n q i w i

3. Results

3.1. Water Quality Assessment Using IWQI

According to the IWQI analysis results in this study, the type of irrigation water samples was as follows: 5.5% (6 samples) of the analyzed samples fell within the high restriction class (HR), 10.9% (12 samples) of the investigated samples were classified as being within the moderate restriction category (MR), and 21.8% (24 samples) of the analyzed samples fell within the low restriction category (LR). Finally, 61.8% (68 samples) of the total water samples were identified as being within the no restriction range (NR), as shown in Table 7. According to the Food Agriculture Organization (FAO) guidelines, the baseline level of water EC in the study area varied between 672 and 3348 μS cm−1. Additionally, the soil texture in the study area was reported as sandy to sandy loam. Considering these factors, the classification of the irrigation water samples using the IWQI becomes even more crucial and helps to determine the compatibility of the water quality with the existing soil conditions and the specific requirements of different crops (Table 8) [11].

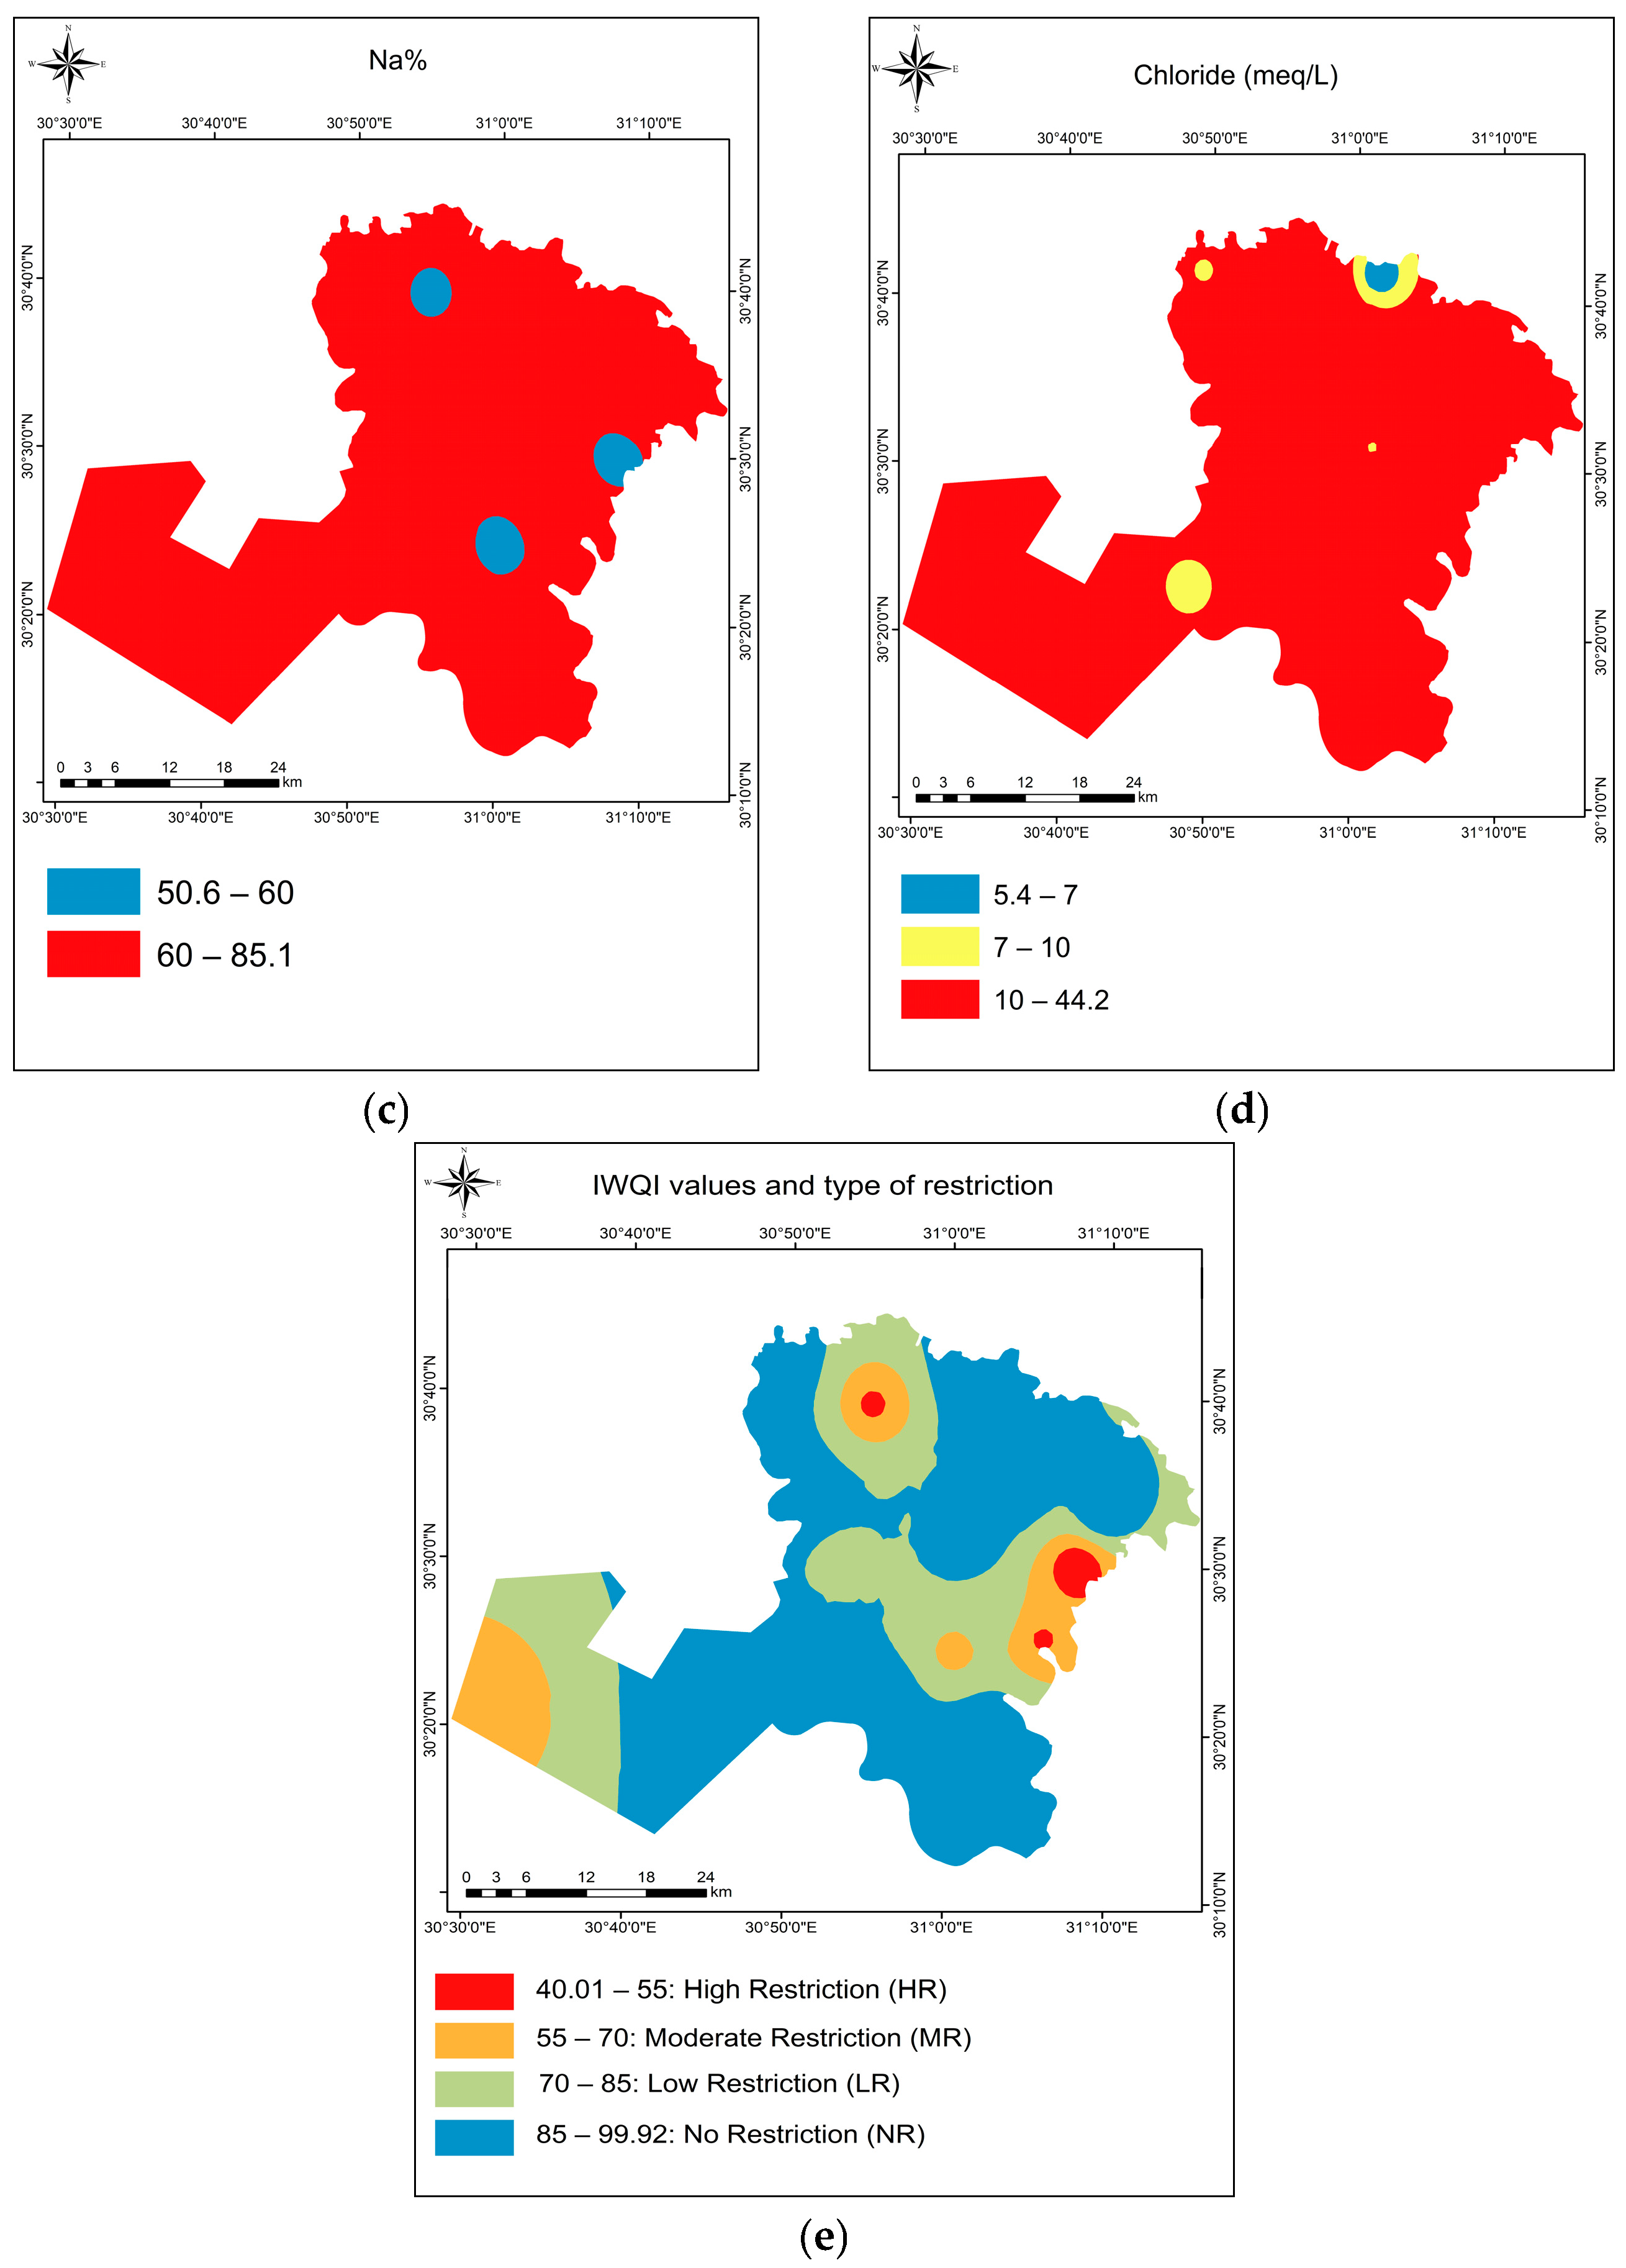
3.2. Water Quality Visualization

A GIS-zoning maps’ technique was used to visualize the water quality in the study area for irrigation purposes. GIS technology allows for the integration and analysis of spatial data using an ordinary kriging method, as shown in Figure 2. The study results showed that the IWQI values varied between 40.1 and 99.9; meanwhile, 38.5% of the investigated samples were classified as having a high to low restriction rating for irrigation purposes. On the other hand, 61.5% of the investigated samples were classified as having no restrictions (suitable for irrigation purposes, with no significant limitations or concerns).
According to Table 9 and the physicochemical parameters of the water samples that are presented in Table 6, the SAR values ranged from 4.8 to 10.3 with an average value of 6.3 (meq L−1)1/2, 10% of the investigated water samples were located within the first category (Excellent), and 90% were within the second category (Good). Based on EC values, 5%, 85%, and 10% of the investigated water samples fell within the first, second, and third categories, respectively. For chloride concentration, 100% of the water samples were categorized as excellent (first category).

3.3. Evaluation of Water Quality for Irrigation Purposes

According to the Wilcox diagram and water classification based on Na% in the water samples (Table 3), 3.6% (4 samples) of the water samples fell within the permissible category, 93.6% (103 samples) were classified as doubtful water, 2.7% (3 samples) were considered unsuitable for irrigation, and no samples were categorized as good or excellent water for irrigation. According to the information provided in Figure 3, it appears that the water samples investigated in the study area mostly fell within the permissible to doubtful range for irrigation purposes. None of the samples were categorized as unsuitable, while 7.3% (8 samples) fell in the doubtful to unsuitable range, 88.2% (97 samples) fell in the permissible to doubtful range, and 0.9% (1 sample) fell in the good to permissible range. Furthermore, 3.6% (4 samples) of the samples were categorized as being in the excellent to good range. These results are consistent with the high sodium content (Na%) values observed in the study, which ranged from 50.7% to 85.1%; EC values of the water samples ranged from 672 to 3348 μS/cm. These high-sodium and EC values indicate a potential risk for sodicity and salinity issues in the irrigated soil.
According to the U.S. Salinity (USSL) diagram, which appears in Figure 4, most of the water samples fell in the high salinity (EC) category and were classified as “Doubtful” for irrigation. The USSL diagram showed that 70.9% (78 samples) of the samples fell into the high salinity class and the moderate SAR class (C3S2), 11.8% (13 samples) were in C4S3, 9.1% (10 samples) were in C3S3, 6.4% (7 samples) were located in C3S1, 0.9% (1 sample) was in C2S1, and 0.9% (1 sample) was in C3S4 classes, respectively, as shown in Table 10.
According to the permeability index (PI) categorizers and based on the obtained results, 8.2% (9 samples) of the tested water samples fell into class II (Good). On the other hand, 91.8% (101 samples) of the samples fell into class III (Unsuitable), as shown in Figure 5.
According to the information supplied in Figure 6, the Piper trilinear diagram showed that the principal cations within the water samples were Na+ and K+, with higher concentrations compared to those of Ca2+ and Mg2+. On the other hand, the anions’ diagram indicated a combined dominance of anions, especially Cl and HCO3, in the water samples.

4. Discussion

4.1. Water Quality Assessment

The IWQI provides a comprehensive assessment of various water parameters, consisting of physical, chemical, and biological parameters, to determine irrigation water suitability [33]. According to the IWQI results, 5.5% of the water samples fell within the HR class, which means that those water samples had mild to high levels of salts and SAR (unsuitable for the irrigation of mild to excessive salt tolerance plants in permeable soils without compact layers [34]). Furthermore, 10.9% of the investigated samples were classified as being within the MR category. These samples had moderate levels of salts and SAR, limiting their use for moderate salt tolerance plants and recommended for use in moderately to highly permeable soils, considering moderate soil leaching processes [35]. A total of 21.8% of the analyzed samples fell within the LR category. These samples had lower levels of salts and SAR, suggesting that they can be used for irrigation while avoiding salt-sensitive plants [36]. The irrigated soil texture, permeability, and sodicity problems should be taken into consideration when using these samples [37]. A total of 61.8% of the total water samples were identified as being within the NR range. These samples can be used for most soils without causing salinity and sodicity hazards. However, it is still recommended to practice leaching within irrigation practices, except for soils with extremely low permeability [38]. It is indeed noteworthy that 61.8% of the soil in the study area was classified as naturally degraded due to the arid environmental conditions. This indicates that the soil quality has been adversely affected by factors such as low rainfall, high evaporation rates, and limited water availability. The baseline level of salinity in the study area water varied between 672 and 3348 μS/cm. This suggests that the soil already includes a moderately saline soil class, which can impact crop growth and productivity. High salinity levels can hinder water infiltration, affect nutrient availability, and cause osmotic stress to plants [39]. Therefore, irrigation practices using water resources without any prior treatment would increase the saline soil problems.

4.2. The Water Quality Mapping

Understanding the water quality and its suitability for irrigation, as indicated by the IWQI and GIS mapping using the ordinary kriging (OK) technique, can help to obtain decisions and to promote sustainable agriculture in the study region area. The GIS-IWQI map revealed different suitability zones for cultivating lands. According to the IWQI analysis results in this study, most of the total water samples were identified as being within the no restriction range (NR) [40,41]. Considering multiple irrigation water quality parameters such as SAR, EC, chloride, calcium, magnesium, and bicarbonate concentration, a comprehensive understanding was obtained and we achieved a complete evaluation of the water quality and its suitability for irrigation purposes according to FAO guidelines [42]. The investigated area can be categorized by comparing the measured values of SAR, EC, and chloride concentration, and the water quality can be assessed for irrigation purposes [43]. According to SAR values, 10% of the investigated samples fell within the first category (Excellent), indicating that it is improbable that problems would occur due to the use of this water for irrigation. Water with excellent quality is ideal for irrigation as it minimizes the risk of soil sodicity, salinity, and chloride toxicity. It ensures optimal water infiltration, nutrient uptake, and plant growth, leading to better crop productivity [44]. Furthermore, 90% of water samples fell within the second category (Good), where problems increasingly appear. This result indicates that the water had moderate to high levels of sodium, salinity, and chloride, which may pose some minor restrictions on crop growth but are generally acceptable. Water in these categories can still be used for irrigation, but certain crops may have varying degrees of tolerance to the moderate to high levels of salinity and sodicity present in the water, some crops may perform better than others, and proper water management practices, such as leaching and soil amendments, may be necessary to mitigate any potential negative effects [45]. Corresponding to EC values, the investigated water samples fell within first, second, and third categories, respectively (water in the third category had moderately high levels of sodium, salinity, and chloride), which may pose some restrictions on crop growth and productivity. Water with permissible quality can still be used for irrigation, but certain crops should be used and they must have limited tolerance to the elevated levels of salinity and sodicity present in the water. Careful water management practices, such as proper irrigation scheduling, leaching, and soil amendments, may be necessary to minimize the negative effects on crop performance [46]. Based on chloride concentration, 100% of the water samples were categorized as being in the first category, which indicates that the chloride levels in the samples were within permissible limits for irrigation use [47].

4.3. Evaluation of Water Quality for Irrigation Purposes

The sodium (Na%) content in irrigation water is an essential factor to consider when we evaluate its suitability for irrigation uses. Sodium can lead to sodicity problems in water that could negatively have affected soil permeability and ordinary soil health (Equation (2)). Sodium has a strong affinity for clay particles in the soil, and it is present in high concentrations in irrigation water [48]. According to the Wilcox diagram, 3.6% of the water samples fell within the permissible category, 93.6% were classified as doubtful water, indicating a higher sodium content that may have potential negative effects on soil permeability and plant growth, and 2.7% were considered as unsuitable for irrigation due to their high-sodium content. According to the data provided, it is notable that no samples were categorized as good or excellent water for irrigation. This indicates that there may be a need for management practices to mitigate the potential sodicity problems associated with the water used for irrigation. Implementing practices such as leaching, soil amendments, and selection of crops that are tolerant to high sodium levels can help address the challenges posed by the doubtful and unsuitable water categories [49,50]. Similar to Miró et al. (2004) [51] and based on the results, water samples in the study area mostly fell within the permissible to doubtful range for irrigation purposes, none of the samples were categorized as unsuitable, 7.3% of the water samples fell in the doubtful to unsuitable range, 88.2% fell in the permissible to doubtful range, and 0.9% fell in the good to permissible range. Moreover, 3.6% of the water samples were categorized as felling in the excellent to good range. The high sodium content in the water can be attributed to the presence of carbonate and bicarbonate ions, which tend to precipitate calcium and magnesium carbonate and increase the sodium concentration in the soil. This can lead to a decrease in soil permeability and damage to the soil structure. To mitigate the potential negative effects of a high sodium content, management practices such as leaching, soil amendments, and crop selection that are tolerant to sodicity should be considered [52,53]. Based on the USSL diagram, most of the water samples fell into the C3S2 class, indicating a high-salinity class (C3) and a moderate sodium content class (S2). This suggests that the water samples had relatively high salinity levels and a high sodicity hazard. Both the USSL and the Wilcox diagrams suggest that the water samples had higher salinity levels and some degree of sodicity hazard, which is in line with the classification mentioned earlier. Therefore, the alignment between the USSL diagram and the Wilcox diagram indicates consistency in the assessment of the water quality [54]. Furthermore, the spatial distribution map of SAR (Figure 2b) implies that a significant portion of the study area may have had water sources with a higher sodium content, which can pose challenges to soil permeability and soil structure [55].
According to the permeability index (PI), 8.2% of the tested water samples fell into class II, indicating that they may be suitable for irrigation, although some caution and management practices may be necessary. On the other hand, 91.8% of the samples fell into class III, suggesting that they may be unsuitable for irrigation due to the potential adverse effects on soil permeability and overall soil quality [56].
The Piper trilinear diagram was used to plot the mean concentrations of cations and anions in the water samples and represent the water types. Understanding the composition of cations and anions in water samples is important for assessing water quality and its suitability for irrigation purposes [57]. The cation diagram revealed that the principal cations within the water samples were Na+ and K+, with higher concentrations compared to Ca2+ and Mg2+. However, the concentration of K+ was found to be very low compared to the alternative primary cations. On the other hand, the anions’ diagram indicates a combined dominance of anions, especially Cl and HCO3− in the water samples [58]. Considering the dominance of sodium ion (Na+) within the cations and chloride ion (Cl) and bicarbonate (HCO3) within the anions, this result concluded that the study area water type was Na-Cl-HCO3, indicating a high concentration of sodium, chloride, and bicarbonate ions, which can have significant negative consequences. High sodium levels lead to soil sodicity, reducing drainage and nutrient availability, while chloride contributes to overall soil salinity. High bicarbonate levels increase water and soil alkalinity, affecting plant nutrient uptake. This combination can lead to reduced crop yields, soil degradation, and irrigation system issues due to scaling and clogging; this result is similar to that of El-Rawy et al., 2019 [59].
The discrepancy between the IWQI and other irrigation indices can be reconciled by considering the specific parameters and thresholds each index uses. The IWQI may prioritize certain factors, such as salinity, alkalinity, and specific ion concentrations, differently from other indices, which could include additional criteria such as the sodium absorption ratio (SAR), electrical conductivity (EC), or the presence of specific contaminants. Variations in the weightage of these parameters and the thresholds for suitability can lead to differing assessments. A comprehensive analysis should consider all relevant indices and parameters to provide a more holistic evaluation of the water’s suitability for irrigation such as (1) accurate irrigation management that provides a more precise understanding of water quality and helps optimize irrigation practices for specific crops and soil types, (2) minimizing the risks and identifying potential issues like salinity build-up or nutrient imbalances early on, allowing for preventative measures, and (3) enhanced sustainability through maximizing the suitability of available water resources and minimizing unnecessary water usage or contamination.
As potential limitations of this study, collecting water samples only once in each location may not provide a comprehensive understanding of the variability in water quality parameters over time. Water quality parameters can indeed vary with seasonal changes, weather patterns, agricultural activities, and other factors, and there are some main points to consider regarding the potential limitation of the study in relation to sampling frequency, including:
1. Seasonal Variability: Water quality parameters, such as nutrient levels, salinity, and contamination, can fluctuate throughout the year. Sampling only once may not capture these seasonal variations, leading to an incomplete assessment of water quality.
2. Impact of Agricultural Practices: Depending on the location and surrounding land use, water quality can be influenced by agricultural activities, pesticide applications, and fertilizer runoff. These factors can vary seasonally and affect the quality of water for irrigation.
3. Seasonal Variation Trends: By taking samples at different times of the year, researchers can observe long-term trends in water quality and identify any patterns or changes that may occur over time. This can provide valuable insights into the sustainability of water resources for irrigation.
4. Mitigation Strategies: Understanding the seasonal variability of water quality parameters is essential for implementing effective mitigation strategies. By monitoring water quality at multiple time points, researchers can develop targeted interventions to address specific issues identified during different seasons.

5. Conclusions and Recommendations

The IWQI was used in order to evaluate water resources in El-Menoufia Governorate for their irrigation suitability. The IWQI and GIS mapping illustrates spatial distribution along with other irrigation water quality parameters, such as SAR, Na%, EC, and chloride. Based on the category of the irrigation water samples, it could be concluded that most of water samples (61.8%) in the investigated area do not require any water restrictions (NR); this indicates that the first-class water within the region is suitable for irrigation without any significant limitations. The next highest class is LR (Low Restriction), which represents 21.8% of the analyzed water samples; these samples may also require some level of limitation, however not as severe as MR or HR. This indicates that a smaller part of the water samples requires some restriction measures. The MR (Moderate Restriction) category includes 10.9% of the entire samples. These samples require a moderate stage of water restriction, indicating that there may be greater widespread barriers or more problems related to those samples as compared to LR. The smallest category is HR (High Restriction), which accounts for 5.5% of the analyzed samples; these samples require considerable management practices or treatment to minimize water-destructive outcomes on soil and plants.
According to the results of the Wilcox diagram, it could be concluded that most of the investigated water samples (93.6%) are categorized as doubtful water. This shows that those samples have a higher sodium content material, which can also pose a problem on plants’ augmentation if used for irrigation. In addition, 3.6% of the water samples fell in the permissible class, suggesting that those samples have low sodium content, and are taken into consideration as suitable for irrigation use. Alternatively, 2.7% of the samples are considered unsuitable for irrigation because of their high sodium content. These samples may also pose a threat to plant health if used in soil for irrigation purposes. Moreover, none of the water samples have been categorized as excellent or extremely good water for irrigation.
Based on the USSL diagram, it may be concluded that most of the water samples (70.9%) fell into the high salinity and SAR magnitude (C3S2) class. This represents that these water samples have high salinity degrees and a moderate SAR. Furthermore, 6.4% of the samples fell into the C3S1 class, indicating excessive salinity stages but a low SAR; these samples may also have limitations but can be more suitable for irrigation compared to the C3S2 class. Furthermore, 9.1% of the samples fell into the C3S3 class, indicating moderate salinity degrees and a high SAR; these samples might not be suitable for irrigation. A smaller percentage of the samples (11.8%) fells into the C4S3 class, indicating very high salinity degrees and a high SAR; these samples are most possibly unsuitable for irrigation because of their excessive salinity and SAR values. A very small portion of the samples (0.9%) are located within the C2S1 class, indicating a slight salinity level and a low SAR; this sample may have better suitability for irrigation compared to the bulk of the sample. A very small percentage of the samples (0.9%) fells into the C3S4 class, indicating mild to excessive salinity degrees and very high SAR; these samples are also unsuitable for irrigation because of their high-salinity and SAR values.
According to the PI index, 8.2% of the examined water samples fell into class II, which suggests that these samples have mild barriers but are suitable for irrigation. However, the bulk of the water samples (91.8%) fell into class III, indicating that they have extensive obstacles and are improper for irrigation.
In conclusion, according to the IWQI results, a smaller part of the samples requires assessment, which suggest some degrees of restriction. Additionally, based on the Wilcox diagram, most of the investigated water samples are categorized as doubtful water, which can cause plants’ augmentation sensitivity. Moreover, based on the USSL diagram, most of the water samples fell into the moderate salinity and SAR magnitude (C3S2) class, which might have negative outcomes on soil and plant health. Furthermore, the PI index result represents that most of the water samples fell into class III, indicating that it has extensive obstacles and is improper for irrigation. Therefore, according to the USSL diagram and Permeability index, it is important to consider the salinity and SAR degrees of the water samples to determine their suitability for irrigation. Proper management practices and treatments may be vital to mitigate the poor effects of salinity and SAR on soil and plant health in this study area. And, based on the Piper trilinear and considering the dominance of Na+ within the cations and Cl + HCO3 within the anions, it can be concluded that the water type in the studied area is Na-Cl-HCO3.
As recommendations, this study emphasizes the importance of establishing a real-time monitoring system for water resources to ensure sustainable development. It also suggests the development of a risk management module that can assess water risks not only for agriculture but also for public health concerns. The ultimate goal is to incorporate this descriptive and sensitivity analysis into a risk management tool that can generate quick reports for policy- and decision-makers. This will aid in the better planning for groundwater sustainable use in El-Menoufia Governorate and in similar arid regions.

Author Contributions

Conceptualization: M.E.F., D.M.A.E., E.A.A.H., M.Z., E.M.S., M.D., A.S. and H.A.M.; methodology: M.E.F. and H.A.M.; software: M.E.F. and H.A.M.; validation: M.E.F., D.M.A.E., E.A.A.H., M.Z., E.M.S., M.D. and H.A.M.; formal analysis: M.E.F., D.M.A.E. and E.A.A.H.; investigation: M.E.F., D.M.A.E. and E.A.A.H.; data curation: M.E.F., D.M.A.E., E.A.A.H., M.Z., E.M.S., M.D. and H.A.M.; writing—original draft preparation: A.S. and M.E.F.; writing—review and editing: A.S. and M.E.F.; visualization M.E.F., D.M.A.E., E.A.A.H., M.Z., E.M.S., M.D. and H.A.M.; supervision: M.E.F., A.S. and H.A.M.; project administration: A.S. and M.E.F.; funding acquisition: M.E.F., D.M.A.E., E.A.A.H., M.Z., E.M.S., M.D., A.S. and H.A.M. All authors have read and agreed to the published version of the manuscript.

Funding

This research received no external funding.

Institutional Review Board Statement

Not applicable.

Informed Consent Statement

Not applicable.

Data Availability Statement

Data are contained within the article.

Acknowledgments

The manuscript presents a scientific collaboration among scientific institutions and universities in three countries (Egypt, Algeria, and Italy). The authors would like to thank the National Authority for Remote Sensing and Space Science (NARSS), El-Menoufia, Assiut universities, National Higher Agronomic School, and SAFE-University of Basilicata for funding the satellite data and the field survey.

Conflicts of Interest

The authors would like to hereby certify that they have no conflicts of interest in the data collection, analyses, and the interpretation in the writing of the manuscript and in the decision to publish the results.

References

  1. Gleick, P.H. The Human Right to Water. Water Policy 1998, 1, 487–503. [Google Scholar] [CrossRef]
  2. Rockstrom, J. Balancing Water for Humans and Nature: The New Approach in Ecohydrology; Routledge: London, UK, 2013; p. 247. [Google Scholar]
  3. Moss, B. Water pollution by agriculture. Philos. Trans. R. Soc. B Biol. Sci. 2008, 363, 659–666. [Google Scholar] [CrossRef] [PubMed]
  4. Evans, A.E.; Mateo-Sagasta, J.; Qadir, M.; Boelee, E.; Ippolito, A. Agricultural water pollution: Key knowledge gaps and research needs. Curr. Opin. Environ. Sustain. 2019, 36, 20–27. [Google Scholar] [CrossRef]
  5. Abdel-Satar, A.M.; Ali, M.H.; Goher, M.E. Indices of water quality and metal pollution of Nile River, Egypt. Egypt. J. Aquat. Res. 2017, 43, 21–29. [Google Scholar] [CrossRef]
  6. Abbas, H.; Abuzaid, A.S.; Jahin, H.; Kasem, D. Assessing the quality of untraditional water sources for irrigation purposes in Al-Qalubiya Governorate, Egypt. Egypt. J. Soil Sci. 2020, 60, 157–166. [Google Scholar] [CrossRef]
  7. Sowers, J.; Vengosh, A.; Weinthal, E. Climate change, water resources, and the politics of adaptation in the Middle East and North Africa. Clim. Chang. 2011, 104, 599–627. [Google Scholar] [CrossRef]
  8. Megahed, H.A.; GabAllah, H.M.; Ramadan, R.H.; Abdelrahman, M.A.E.; D’Antonio, P.; Scopa, A.; Darwish, M.H. Groundwater Quality Assessment Using Multi-Criteria GIS Modeling in Drylands: A Case Study at El-Farafra Oasis, Egyptian Western Desert. Water 2023, 15, 1376. [Google Scholar] [CrossRef]
  9. Brookes, J.D.; Carey, C.C. Ensure availability and sustainable management of water and sanitation for all. UN Chron. 2015, 51, 15–16. [Google Scholar] [CrossRef]
  10. Gautam, U.; Tiwari, V.; Tripathi, V.K. Evaluation of groundwater quality of Prayagraj city using entropy water quality index (EWQI) and new integrated water quality index (IWQI). Sustain. Water Resour. Manag. 2022, 8, 57. [Google Scholar] [CrossRef]
  11. Gidey, A. Geospatial distribution modeling and determining suitability of water quality for irrigation purpose using geospatial methods and water quality index (WQI) in Northern Ethiopia. Appl. Water Sci. 2018, 8, 82. [Google Scholar] [CrossRef]
  12. Aravinthasamy, P.; Karunanidhi, D.; Subba Rao, N.; Subramani, T.; Srinivasa Moorthy, K. Irrigation risk assessment of water in a non-perennial river basin of South India: Implication from irrigation water quality index (IWQI) and geographical information system (GIS) approaches. Arab. J. Geosci. 2020, 13, 1125. [Google Scholar] [CrossRef]
  13. Yıldız, S.; Karakuş, C.B. Estimation of irrigation water quality index with development of an optimum model: A case study. Environment. Dev. Sustain. 2020, 22, 4771–4786. [Google Scholar] [CrossRef]
  14. Şener, Ş.; Varol, S.; Şener, E. Evaluation of sustainable water utilization using index methods (WQI and IWQI), multivariate analysis, and GIS: The case of Akşehir District (Konya/Turkey). Environ. Sci. Pollut. Res. 2021, 28, 47991–48010. [Google Scholar] [CrossRef] [PubMed]
  15. El Behairy, R.A.; El Baroudy, A.A.; Ibrahim, M.M.; Kheir, A.M.; Shokr, M.S. Modelling and assessment of irrigation water quality index using GIS in semi-arid region for sustainable agriculture. Water Air Soil Pollut. 2021, 232, 352. [Google Scholar] [CrossRef]
  16. Marghade, D.; Malpe, D.B.; Duraisamy, K.; Patil, P.D.; Li, P. Hydrogeochemical evaluation, suitability, and health risk assessment of water in the watershed of Godavari basin, Maharashtra, Central India. Environ. Sci. Pollut. Res. 2021, 28, 18471–18494. [Google Scholar] [CrossRef] [PubMed]
  17. Tlili-Zrelli, B.; Hamzaoui-Azaza, F.; Gueddari, M.; Bouhlila, R. Geochemistry and quality assessment of water using graphical and multivariate statistical methods. A case study: Grombalia phreatic aquifer (Northeastern Tunisia). Arab. J. Geosci. 2013, 6, 3545–3561. [Google Scholar] [CrossRef]
  18. Singh, S.; Ghosh, N.C.; Gurjar, S.; Krishan, G.; Kumar, S.; Berwal, P. Index-based assessment of suitability of water quality for irrigation purpose under Indian conditions. Environ. Monit. Assess. 2018, 190, 29. [Google Scholar] [CrossRef] [PubMed]
  19. Akoto, O.; Adopler, A.; Tepkor, H.E.; Opoku, F. A comprehensive evaluation of surface water quality and potential health risk assessments of Sisa River, Kumasi. Water Sustain. Dev. 2021, 15, 100654. [Google Scholar] [CrossRef]
  20. Beck, H.E.; Zimmermann, N.E.; McVicar, T.R.; Vergopolan, N.; Berg, A.; Wood, E.F. Present and future Köppen-Geiger climate classification maps at 1-km resolution. Sci. Data 2018, 5, 180214. [Google Scholar] [CrossRef]
  21. Said, R. The River Nile Geology and Hydrology and Utilization; Pergamon Press: Oxford, UK, 1993; p. 320. [Google Scholar]
  22. Rashed, H.S. Utilizing Sustainable Land Management Model for Sustainability Index Assessment in El-Menoufia Governorate, Egypt. J. Soil Sci. Agric. Eng. 2020, 11, 81–90. [Google Scholar] [CrossRef]
  23. Clesceri, L.S. Standard Methods for Examination of Water and Wastewater; American Public Health Association: Washington, DC, USA, 1998; 9p. [Google Scholar]
  24. PerkinElmer, Inc. Analysis of Potable and Waste Waters by US EPA Method 200.7 Using the Optima 8300 ICP-OES and prepFAST Auto-Dilution/Calibration System. Application Notebook 2013, Volume 28, Issue 9. Available online: https://www.spectroscopyonline.com/view/analysis-potable-and-waste-waters-us-epa-method-2007-using-optima-8300-icp-oes-and-prepfast-auto-dil (accessed on 28 June 2024).
  25. El-Fattah Hassan, E.A.; Saeed, A.M.; Abdalla, N.A. Bacteriological and Physicochemical Screening of Some Irrigation Canals at Nile Delta, Egypt. Egypt. J. Exp. Biol. (Zool.) 2018, 14, 287–297. [Google Scholar] [CrossRef]
  26. Spandana, M.P.; Suresh, K.R.; Prathima, B. Developing an irrigation water quality index for Vrishabavathi command area. Int. J. Eng. Res. Technol. 2013, 2, 821–830. [Google Scholar] [CrossRef]
  27. Wilcox, L. Classification and Use of Irrigation Waters (No. 969); US Department of Agriculture, National Agricultural Library: Washington, DC, USA, 1955.
  28. Singh, V.K.; Kumar, D.; Kashyap, P.S.; Singh, P.K.; Kumar, A.; Singh, S.K. Modelling of soil permeability using different data driven algorithms based on physical properties of soil. J. Hydrol. 2020, 580, 124223. [Google Scholar] [CrossRef]
  29. Doneen, L. Notes on Water Science and Engineering; Department of Water Science and Engineering, University of California: Davis, CA, USA, 1964; Paper 4001. [Google Scholar]
  30. Makki, Z.F.; Zuhaira, A.A.; Al-Jubouri, S.M.; Al-Hamd, R.K.S.; Cunningham, L.S. GIS-based assessment of water quality for drinking and irrigation purposes in central Iraq. Environ. Monit. Assess. 2021, 193, 107. [Google Scholar] [CrossRef] [PubMed]
  31. Abbasnia, A.; Radfard, M.; Mahvi, A.H.; Nabizadeh, R.; Yousefi, M.; Soleimani, H.; Ali Mohammadi, M. Groundwater quality assessment for irrigation purposes based on irrigation water quality index and its zoning with GIS in the villages of Chabahar, Sistan and Baluchistan, Iran. Data Brief 2018, 19, 623–631. [Google Scholar] [CrossRef]
  32. Meireles, A.C.M.; de Andrade, E.M.; Chaves, L.C.G.; Frischkorn, H.; Crisostomo, L.A. A new proposal of the classification of irrigation water. Rev. Cienc. Agron. 2010, 41, 349–357. [Google Scholar] [CrossRef]
  33. Dhakate, R.; Guguloth, S.; Srinivas, B. Hydrochemical appraisal of groundwater quality for drinking and agricultural utility in a granitic terrain of Maheshwaram area of Ranga Reddy district, Telangana State, India. HydroResearch 2021, 4, 11–23. [Google Scholar] [CrossRef]
  34. Hamdy, A. Saline irrigation management for a sustainable use. In Non-Conventional Water Use: WASAMED Project; Hamdy, A., El Gamal, F., Lamaddalena, N., Bogliotti, C., Guelloubi, R., Eds.; CIHEAM/EU DG Research: Bari, Italy, 2005; pp. 3–42. [Google Scholar]
  35. Tomaz, A.; Palma, P.; Fialho, S.; Lima, A.; Alvarenga, P.; Potes, M.; Costa, M.J.; Salgado, R. Risk assessment of irrigation-related soil salinization and sodification in Mediterranean areas. Water 2020, 12, 3569. [Google Scholar] [CrossRef]
  36. El Mountassir, O.; Bahir, M. The assessment of the groundwater quality in the coastal aquifers of the Essaouira Basin, southwestern Morocco, using hydrogeochemistry and isotopic signatures. Water 2023, 15, 1769. [Google Scholar] [CrossRef]
  37. Qadir, M.; Sposito, G.; Smith, C.J.; Oster, J.D. Reassessing irrigation water quality guidelines for sodicity hazard. Agric. Water Manag. 2021, 255, 107054. [Google Scholar] [CrossRef]
  38. Kayikcioglu, H.H. Short-term effects of irrigation with treated domestic wastewater on microbiological activity of a Vertic xerofluvent soil under Mediterranean conditions. J. Environ. Manag. 2012, 102, 108–114. [Google Scholar] [CrossRef] [PubMed]
  39. Arif, Y.; Singh, P.; Siddiqui, H.; Bajguz, A.; Hayat, S. Salinity induced physiological and biochemical changes in plants: An omic approach towards salt stress tolerance. Plant Physiol. Biochem. 2020, 156, 64–77. [Google Scholar] [CrossRef] [PubMed]
  40. Abdel-Fattah, M.K. Reclamation of saline-sodic soils for sustainable agriculture in Egypt. In Sustainability of Agricultural Environment in Egypt: Part II; Negm, A., Abu-hashim, M., Eds.; The Handbook of Environmental Chemistry; Springer: Cham, Switzerland, 2018; Volume 77, pp. 69–92. [Google Scholar] [CrossRef]
  41. Sayed, Y.A.; Fadl, M.E. Agricultural Sustainability Evaluation of the New Reclaimed Soils at Dairut Area, Assiut, Egypt using GIS Modeling. Egypt. J. Remote Sens. Space Sci. 2021, 24, 707–719. [Google Scholar] [CrossRef]
  42. Zhang, Q.; Qian, H.; Xu, P.; Hou, K.; Yang, F. Groundwater quality assessment using a new integrated-weight water quality index (IWQI) and driver analysis in the Jiaokou Irrigation District, China. Ecotoxicol. Environ. Saf. 2021, 212, 111992. [Google Scholar] [CrossRef] [PubMed]
  43. Ayers, R.S.; Westcott, D.W. Water Quality for Agriculture; FAO, UNITED NATIONS: Rome, Italy, 1994; Volume 97. [Google Scholar]
  44. Karakuş, C.B.; Yıldız, S. Evaluation for irrigation water purposes of groundwater quality in the vicinity of Sivas City Centre (Turkey) by using GIS and an irrigation water quality index. Irrig. Drain. 2020, 69, 121–137. [Google Scholar] [CrossRef]
  45. Batarseh, M.; Imreizeeq, E.; Tilev, S.; Al Alaween, M.; Suleiman, W.; Al Remeithi, A.M.; Al Tamimi, M.K.; Al Alawneh, M. Assessment of groundwater quality for irrigation in the arid regions using irrigation water quality index (IWQI) & GIS-Zoning maps: Case study from Abu Dhabi Emirate, UAE. Groundw. Sustain. Dev. 2021, 14, 100611. [Google Scholar] [CrossRef]
  46. Taher, M.E.S.; Ghoneium, A.M.; Hopcroft, R.R.; ElTohamy, W.S. Temporal and spatial variations of surface water quality in the Nile River of Damietta Region, Egypt. Environ. Monit. Assess. 2021, 193, 128. [Google Scholar] [CrossRef] [PubMed]
  47. Dhanasekarapandian, M.; Chandran, S.; Saranya Devi, D.; Kumar, V. Spatial and temporal variation of groundwater quality and its suitability for irrigation and drinking purpose using GIS and WQI in an urban fringe. J. Afr. Earth Sci. 2016, 124, 270–288. [Google Scholar] [CrossRef]
  48. Gharaibeh, M.A.; Eltaif, N.I.; Shunnar, O.F. Leaching and reclamation of calcareous saline-sodic soil by moderately saline and moderate-SAR water using gypsum and calcium chloride. J. Plant Nutr. Soil Sci. 2009, 172, 713–719. [Google Scholar] [CrossRef]
  49. Mukhopadhyay, B.P.; Chakraborty, A.; Bera, A.; Saha, R. Suitability assessment of groundwater quality for irrigational use in Sagardighi block, Murshidabad district, West Bengal. Appl. Water Sci. 2022, 12, 38. [Google Scholar] [CrossRef]
  50. Singh, K.K.; Tewari, G.; Kumar, S. Evaluation of groundwater quality for suitability of irrigation purposes: A case study in the Udham Singh Nagar, Uttarakhand. J. Chem. 2020, 2020, 6924026. [Google Scholar] [CrossRef]
  51. Miró, M.; Estela, J.M.; Cerdà, V. Application of flowing-stream techniques to water analysis: Part II. General quality parameters and anionic compounds: Halogenated, Sulphur and metalloid species. Talanta 2004, 62, 1–15. [Google Scholar] [CrossRef] [PubMed]
  52. Sutradhar, S.; Mondal, P. Groundwater suitability assessment based on water quality index and hadrochemical characterization of Suri Sadar Sub-division, West Bengal. Ecol. Inform. 2021, 64, 101335. [Google Scholar] [CrossRef]
  53. Al-Bassam, A.M.; Khalil, A.R. Durov Pwin: A new version to plot the expanded Durov diagram for hydro-chemical data analysis. Comput. Geosci. 2012, 42, 1–6. [Google Scholar] [CrossRef]
  54. Tolera, M.B.; Choi, H.; Chang, S.W.; Chung, I.-M. Groundwater quality evaluation for different uses in the lower Ketar Watershed, Ethiopia. Environ. Geochem. Health 2020, 42, 3059–3078. [Google Scholar] [CrossRef] [PubMed]
  55. Shrestha, A.; Shrestha, S.M.; Pradhan, A.M.S. Assessment of spring water quality of Khandbari Municipality in Sankhuwasabha District, Eastern Nepal. Environ. Sci. Pollut. Res. 2023, 30, 98452–98469. [Google Scholar] [CrossRef] [PubMed]
  56. Aregahegn, Z.; Zerihun, M. Study on irrigation water quality in the rift valley areas of Awash river basin, Ethiopia. Appl. Environ. Soil Sci. 2021, 2021, 8844745. [Google Scholar] [CrossRef]
  57. Darwesh, N.; Allam, M.; Meng, Q.; Helfdhallah, A.A.; Naser Ramzy, S.; El Kharrim, K.; Al Maliki, A.A.; Belghyti, D. Using Piper trilinear diagrams and principal component analysis to determine variation in hydrochemical faces and understand the evolution of groundwater in Sidi Slimane Region, Morocco. Egypt. J. Aquat. Biol. Fish. 2019, 23, 17–30. [Google Scholar] [CrossRef]
  58. Igibah, C.E.; Tanko, J.A. Assessment of urban groundwater quality using Piper trilinear and multivariate techniques: A case study in the Abuja, North-central, Nigeria. Environ. Syst. Res. 2019, 8, 14. [Google Scholar] [CrossRef]
  59. El-Rawy, M.; Ismail, E.; Abdalla, O. Assessment of groundwater quality using GIS, hydrogeochemistry, and factor statistical analysis in Qena Governorate, Egypt. Desalination Water Treat. 2019, 162, 14–29. [Google Scholar] [CrossRef]
Figure 1. Location of the study area and water sampling sites, relative to Egypt map (Landsat-8; Path 177 and Row 39).
Sustainability 16 06259 g001
Figure 2. Zoning map of the study area: (a) EC, (b) SAR, (c) Na%, (d) chloride, and (e) IWQI.
Sustainability 16 06259 g002aSustainability 16 06259 g002b
Figure 3. Wilcox diagram illustrating the quality of water suitability for irrigation in the study area.
Sustainability 16 06259 g003
Figure 4. USSL diagram illustrating the water quality based on EC and SAR in the study area.
Sustainability 16 06259 g004
Figure 5. Permeability index (PI) diagram for classification of groundwater quality in the study area.
Sustainability 16 06259 g005
Figure 6. Piper triangle diagram representation of water samples in the study area.
Sustainability 16 06259 g006
Table 1. Water quality parameters and standard methods of analysis [23,24].
ParameterDetection/Reporting LimitMethod
pH field [-]-APHA 4500-H + B, 21st Ed.
EC [μS cm−1]1APHA 2510 B, 21st Ed.
Calcium [mg L−1]APHA 3500-Ca B, 21st Ed.
Magnesium [mg L−1]ICP-OES, EPA200.7 Rev 04
Sodium [mg L−1]0.05
Potassium [mg L−1]0.02
Chloride [mg L−1]0.2APHA 4110 B, 21st Ed.
Bicarbonate [mg L−1]1APHA 2320 B, 21st Ed.
Table 2. Water classification based on SAR in the water samples (FAO).
Value RangeWater ClassificationNumber of Samples
<6Excellent12
6–9Good54
>9Permissible44
Total110
Table 3. Water classification based on Na% in the water samples [27].
Value RangeWater ClassificationNumber of Samples
<20Excellent0
20–40Good0
40–60Permissible4
60–80Doubtful103
>80Unsuitable3
Total110
Table 4. Irrigation water quality parameters and limiting values [26,31].
qiEC (µS cm−1)SAR (meq L−1)1/2Na+ClHCO3
meq L−1
85–100200–750<32–3<41–1.5
60–85750–15003–63–64–71.5–4.5
35–601500–30006–126–97–104.5–8.5
0–35˂200 or ≥3000>12˂2 or ≥9>10˂1 or ≥8.5
Table 5. Weights for the IWQI parameters [32].
ParameterWeight (wi)
EC (µS cm−1)0.21
Na+0.20
HCO30.20
Cl0.19
SAR0.20
Total1.000
Table 6. Physicochemical parameters of water samples.
EC (µS cm−1)SAR (meq/L−1)1/2Na+ (meq L−1)Cl (meq L−1)HCO3 (meq L−1)
Minimum6724.88.15.41.7
Maximum334810.334.344.23.6
Average1311.96.316.216.12.2
Standard Deviation930.11.88.211.50.63
Table 7. Irrigation Water Quality Index (IWQI) characteristics [32].
IWQI Values and Type of RestrictionPercentage of
Water Samples
Recommendation for Crops and Soil
SoilType of Plants
85–100
No Restriction (NR)
61.8%May be used for the majority of soils with low probability of causing salinity and sodicity problems, being recommended for leaching within irrigation practices, except for in soils with extremely low permeability.No toxicity risk for most plants
70–85
Low Restriction (LR)
21.8%Recommended for use in irrigated soils with light texture or moderate permeability, being recommended for salt leaching. Soil sodicity in heavy texture soils may occur, being recommended to avoid its use in soils with high clay content.Avoid salt-sensitive plants
55–70
Moderate Restriction (MR)
10.9%May be used in soils with moderate- to high-permeability values, being suggested for moderate leaching of salts.Plants with moderate tolerance to salts may be grown
40–55
High Restriction (HR)
5.5%May be used in soils with high permeability without compact layers. High-frequency irrigation schedule should be adopted for water with EC above 2000 µS cm−1 and SAR above 7.0.Should be used for irrigation of plants with moderate to high tolerance to salts with special salinity control practices, except water with low Na, Cl, and HCO3 values
0–40
Severe Restriction (SR)
0% (0 samples)Should be avoided for irrigation under normal conditions. In special cases, may be used occasionally. Water with low-salt levels and high SAR requires gypsum application. In high saline content water, soils must have high permeability, and excess water should be applied to avoid salt accumulation.Only plants with high salt tolerance, except for waters with extremely low values of Na+, Cl, and HCO3
Table 8. Classification of the irrigation water samples using the IWQI.
qi ECqi SARqi Na+qi HCO3qi ClEC qi*wiSAR qiwiNa+ qi*wiHCO3 qi*wiClqi*wiIWQI
Min9.94.88.11.75.42.10.91.70.41.140
Max14.410.334.33.644.23.1.970.78.699.9
Average13.38.826.23.133.52.81.75.30.66.583.8
Standard
Deviation
1.61.88.20.6311.50.30.31.70.12.219.7
Table 9. Water quality categories for irrigation (according to FAO classification).
CategorySAR
(meq L−1)1/2
Water Samples (%)EC
(μS cm−1)
Water Samples (%)Chloride
(meq L−1)
Water Samples (%)
Excellent<1010<7005<70100
Good10–1890700–30008570–2500
Permissible18–2603000–400010250–3500
Doubtful26–3504000–60000350–4500
Unsuitable>350>60000>4500
Table 10. Distribution ratios of the investigated water samples based on the USSL diagram.
SARVery High-S4C1S4 = 0%C2S4 = 0%C3S4 = 0.9%C4S4 = 0%
High-S3C1S3 = 0%C2S3 = 0%C3S3 = 9.1%C4S3 = 11.8%
Middle-S2C1S2 = 0%C2S2 = 0%C3S2 = 70.9%C4S2 = 0%
Low-S1C1S1 = 0%C2S1 = 0.9%C3S1 = 6.4%C4S1 = 0%
Low-C1Middle-C2High-C3Very High-C4
EC
Disclaimer/Publisher’s Note: The statements, opinions and data contained in all publications are solely those of the individual author(s) and contributor(s) and not of MDPI and/or the editor(s). MDPI and/or the editor(s) disclaim responsibility for any injury to people or property resulting from any ideas, methods, instructions or products referred to in the content.

