Abstract
A gap exists between consumer adoption of sustainable purchasing habits and the behavioural changes required to significantly decrease planetary environmental impact. Current ecolabels do not enable purchasing based on environmental impact, and an effective labelling scheme is required to change purchasing priorities. Using focus groups, ecolabels with components varying in the depth of environmental information conveyed, visual features employed, as well as product comparability and scalability of design, were evaluated by consumers with differing levels of environmental awareness. Independent, credible information accessible to consumers of varying environmental awareness was a participant priority. In-depth data communicated through a bar or pie chart with an interpretable holistic message across all environmental factors was preferred. Colour-coded components offering product comparisons and scalable to the size of the packaging, product value, and lifetime were most likely to empower environmentally motivated purchasing. Insights can inform the development of an effective ecolabelling scheme that equips consumers to adopt more sustainable purchasing habits.
1. Introduction
Human activity is adversely impacting the balance of interconnected processes currently maintaining the Earth’s ecosystem [1]. In 2009, [2] proposed a framework of nine planetary boundaries to define the “safe operating space”—environmental limits within which critical Earth system processes will continue to remain in balance. Six are currently being exceeded; without rapid action, the risk of fundamentally and irreversibly changing the state of the global environment is high [3,4].
Products and services play a significant role in negatively impacting the environment [5]. Household purchases are estimated to be responsible for between 40 and 80% of environmental damage [6]. While policy can require manufacturing to be more sustainable, many policymakers are reluctant to place stringent requirements on national production for fear of losing competitive advantage [7]. As such, without market drivers, there is limited incentive for companies to change. Consumer adoption of more sustainable purchasing habits therefore has the potential to significantly influence the impact human activity has on Earth’s ecosystem [8].
For a behaviour to change, people must have capability, opportunity, and motivation [9]. There is strong evidence that motivation exists, with studies on global consumer behaviour highlighting that more than half of consumers report they would change purchasing habits for better environmental outcomes [10,11]. There has also been a significant increase in sustainability reporting and the disclosure of environmental commitments by businesses—more than 95% of Standard and Poor’s 500 stock market companies now report on their environmental efforts [12]. Many businesses are investing significant budgets into offering more environmentally friendly solutions [13,14]. This investment and reporting suggest that the opportunity to make better purchasing decisions exists.
However, the increase in motivation and opportunity is not currently matched by more environmentally friendly purchasing decisions [6,7,15,16,17]; there is a disconnect between consumer demand for ecolabels on products and their use by consumers to guide purchase decisions [18,19,20]. Consumers have reported they find ecolabels ‘hard to understand’ and ‘confusing’, with poor design, incomplete information, and a lack of clarity [21,22]. Studies attribute complexity, proliferation, and lack of clear credibility as barriers to ecolabel use for purchasing decisions [7,16,17]. More than 50% of consumers find environmental (and social) claims made by businesses confusing [23]. This confusion is not surprising given that there are now more than 450 ecolabels on the global market [24]. Most of these labels are only relevant to a small subset of products; only some are independently verified; none are compulsory; and the presence of multiple ecolabels with differing selective measures of sustainability on a product causes further confusion [10,16,22,25]. Further, the landscape of ecolabelling has been harmed by a lack of transparency and allegations of greenwashing, as well as a general lack of digestible information, credibility, and comparability, with consumers often confused by ecolabels and wary of their claims [10,16,26,27].
There are also significant barriers for manufacturers, as current ecolabels are costly to implement, often focus on binary achievements (e.g., organic), do not highlight positive efforts or differentiate top performers, and have poor market penetration [28]. Further, there is a strong market perception that sustainable products cost more. This is inaccurate for two reasons. Firstly, there are often hidden costs of unsustainability—both direct (e.g., increased energy use for appliances) and indirect (i.e., the social costs associated with the exceedance of planetary boundaries), meaning the purchasing price does not always reflect the real cost. Secondly, environmental performance is often measured in a way that rewards efforts that cost money—e.g., the cost of using higher-quality raw materials is costed as a sustainability feature, but the savings from using less material are not offset against these [29]. Manufacturers also face the barrier of ever-changing regulations that differ across markets [26].
Currently, ecolabelling is the primary tool manufacturers use to communicate sustainability messaging to consumers [26]. Many studies suggest that ecolabels have the potential to influence purchasing behaviour, provided consumers understand the information and place value in it [21,30,31]. The challenge is that existing labels do not meet consumer needs [32,33].
A singular labelling scheme (label plus additional information accessed through online or application (app) platforms) that provides consistent data across any product has the potential to reduce consumer confusion. Such a scheme has the potential, if adopted across all markets and geographies, to decrease legislation requirements for manufacturers, facilitating compliance with future government environmental regulations. Further testing in other jurisdictions would enable validation of this opportunity. If this label provided consistent and holistic environmental data in the context of Planetary Boundaries: “Environmental Facts”, this could eliminate consumer wariness regarding greenwashing through selective disclosure of impacts [32]. A label providing such information has the power to build consumer trust in brands with reliable, sustainable claims [26,27,34], increasing market cut-through for manufacturers.
However, while the planetary boundaries act as a gauge of the extent to which the safe operating limit may be reached or exceeded [4], they do not enable a resolution of the imbalance. The Planetary Accounting Framework translates the nine planetary boundaries into ten environmental impacts, or quotas, designed to be limits for human activity [1]. These environmental impacts are able to be scaled to different aspects of human activity, from that of individuals to larger companies and even countries, to inform how actions can be taken to mitigate environmental impacts and move beyond net zero to environmental restoration [1]. This framework enables the quantification of Environmental Facts (which they refer to as ‘Planetary Facts’).
An ecolabelling scheme based on this quantification of environmental facts as environmental impacts has the potential to provide consumers with the information, i.e., the capability, they need to make more sustainable purchasing decisions [9]. However, there is no consensus on the best practice ecolabel format, limited evidence of which current ecolabels are most effective, and limited indication of what components within ecolabels are effective [9]. For an ecolabelling scheme to be effective, there needs to be a greater understanding of the type of messaging that resonates with consumers. There is evidence that credible information is most effective [21], as well as a mechanism that provides an overall view [15]. In addition, eliciting positive emotions about the future of the planet can motivate pro-environmental behaviour [35]. However, presenting more in-depth data is also valued by some consumers [36]. As informed consumers tend to lead the way, providing detailed data can appeal to their nature, but it may alienate others.
Careful consideration of design features that ensure visibility on product, persuasiveness, and clarity of information is needed to ensure effective communication across all consumers [21,37]. While there is value in a “simple” design, this can risk undermining the information provided if there is a lack of clarity on the efficacy of the claims [38]. Communicating a single measure of sustainability (e.g., carbon footprint) could be viewed as less complex for the consumer to interpret; however, this does not significantly influence consumer decisions [39]. Ecolabels that present a more complete holistic measure or overview in a way that is quick to digest are meaningful to consumers and effective for guiding decisions [15]. The incorporation of traffic light colours as a quick visual summary of sustainability messaging can aid the interpretation of these complex measurements [40,41]. However, the effectiveness of a holistic overview in guiding consumer behaviour is increased when accompanied by additional sustainability information [36,39,42]. Studies have found clear statements to be effective compared to general claims such as ‘climate-friendly’ [43], while others used colour-coded scaling to communicate individual measures of environmental information alongside the holistic overview [42]. Other studies have revealed that a third of consumers would use a QR code on packaging to access sustainability information [26]. However, to date, there remains a lack of in-depth understanding of how effective individual components of ecolabels are at conveying their intended message to consumers and their effectiveness at equipping consumers with the information they need to guide purchase decisions.
To be effective, a singular environmental fact labelling scheme will need to incorporate components that communicate data across and in the context of planetary boundaries in a way that is useful and meaningful to consumers. Therefore, qualitative consumer-centric research utilising in-depth group interviews with consumers of different environmental awareness is needed to identify these components [44]. A range of techniques were applied in these focus group discussions to encourage participants to share their opinions [44]. As a novel approach, in this study, consumers considered ‘Planetary Facts’ information provided by a set of carefully designed, incomplete pre-concept labels in the context of consumer purchases varying in price, frequency of purchase and length of product use. This research aimed to: (1) identify current consumer understanding of environmental impacts related to planetary boundaries; (2) validate demand for environmental facts labelling of products such as ‘Planetary Facts’, (3) understand the key components enabling or limiting consumer engagement with a labelling scheme, and (4) assess whether these aspects varied according to environmental awareness. The data gathered aimed to inform the development of an environmental facts labelling scheme seeking to engage manufacturers and retailers and communicate environmental data across planetary boundaries in a format that engages all consumers.
2. Materials and Methods
Adopting a co-design approach, pre-concept label designs (pre-concepts) branded as ‘Planetary Facts’ were devised and evaluated in focus groups (FGs) to identify consumer demand for and garner and understand consumer opinion concerning components that could communicate environmental impacts effectively and be incorporated into an effective environmental facts labelling scheme.
2.1. Participant Recruitment
The study was assessed and considered low-risk following the Massey University Human Ethics Committee process (Human Ethics Notification Number 4000025094). All participants provided written informed consent to take part and were assigned a unique code to ensure anonymity. Participants were offered a shopping voucher to compensate for their time.
Consumers with two different levels of environmental awareness (‘Novice’ and ‘Aware’) were recruited for the FGs from the community local to Massey University, NZ. To screen current environmental awareness for this study, participants answered a set of nine environmental lifestyle choice questions during recruitment (Appendix A, Table A1), where each question was scored: strongly disagree (1); disagree (2); somewhat disagree (3); neither agree nor disagree (4); somewhat agree (5); agree (6); strongly agree (7). A total score of ≥35 was required for participation in the FGs. Participants were categorised into either Novice participant (NP) or Aware participant (AP) groups based on their responses as outlined in Table 1.

Table 1.
Definition of Novice and Aware participant groups and criteria for classifying participants into the groups based on responses to environmental lifestyle choice questions.
2.2. Experimental Approach
The study was conducted using a four-stage adaptive approach: Stage 1—researchers developed initial pre–concepts; Stage 2—initial pre-concepts were evaluated by FG participants and key themes/recommendations extracted from the discussion; Stage 3—researchers applied key themes/recommendations from Stage 2 to refine and devise new pre-concepts; Stage 4—new pre-concepts were evaluated with FG participants and key themes extracted to provide recommendations for an environmental facts labelling scheme.
2.2.1. Stage 1: Initial Pre-Concept Designs
Five initial pre-concepts (Figure 1), each with a different combination of key components (Table 2), were designed to provide imperfect communication of environmental impact data that would stimulate discussion regarding the effectiveness of each component.
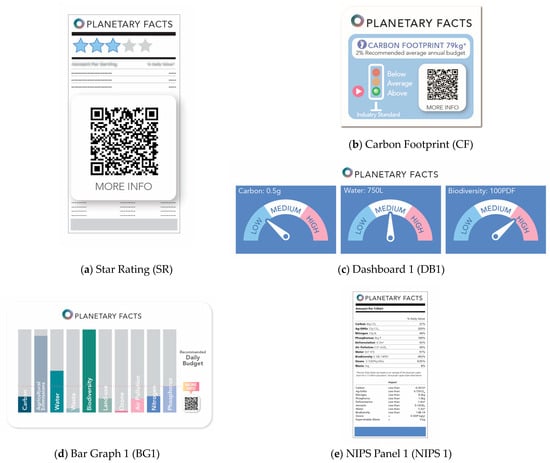
Figure 1.
Images of (a) Star Rating, (b) Carbon Footprint, (c) Dashboard 1, (d) Bar Graph 1, and (e) NIPS Panel 1 initial pre-concept designs developed at Stage 1 and evaluated in Stage 2 focus groups.
Table 2.
Initial pre-concepts developed in Stage 1 and evaluated in Stage 2 focus groups and their associated design components (●).
The environmental impact data communicated varied from an overall summary on ‘star rating’ (SR), a single specified impact on ‘carbon footprint ‘(CF), three impacts on ‘dashboard 1’ (DB1), and all environmental impacts on ‘Bar Graph 1’ (BG1) and ‘NIPS Panel 1’ (NIPS1). Environmental impact data were displayed numerically on three pre-concepts (CF, DB1, and NIPS1) and/or represented by different visual tools (DB1, BG1, and SR). In addition, scientific context (annual/daily budget or % value) was provided in three pre-concepts as either a numeric value (CF, NIPS1) or visual cue (BG1), while a visual representation of an industry benchmark was also evaluated (CF, DB1). A digital link (QR code) was included on three pre-concepts (SR, CF, and BG1) and explicitly excluded from others (DB1, NIPS 1).
2.2.2. Stage 2: Consumer Co-Design Process with Initial Pre-Concept Designs
Two FGs (n = 6–8 participants per FG) lasting approximately 120 min were conducted for each participant group. In each FG, one principal researcher acted as moderator, with a second observing via video link. A technician assisted with notetaking and props.
FGs were divided into three parts: (i) icebreaker, (ii) environmental impacts warm-up, and (iii) initial pre-concept co-design discussion. The icebreaker consisted of a self-introduction where participants shared a decision based on environmental concerns. The warm-up introduced and tested participants’ familiarity with the ten environmental impacts [1] (deforestation, carbon emissions, waste, biodiversity loss, water pollution (from nitrogen and phosphorus run-off), ozone layer depletion, air pollution, water consumption, and agricultural greenhouse gas emissions) that relate to the planetary boundaries via planetary accounting [3]. Visual and interactive exercises were used to test participants’ current environmental awareness as well as their consideration of environmental issues in their current purchasing decisions. Participants were first shown a video introduction to planetary accounting (https://vimeo.com/294481611?embedded=true&source=vimeo_logo&owner=90479278 accessed on 22 and 23 February 2022) and were asked to identify, from a collection of 12 illustrated and labelled cards, which were environmental impacts and which were not. Mentimeter (https://www.mentimeter.com accessed on 22 and 23 February 2022), an interactive online tool, was used to create a collective word cloud from one- or two-word responses to the question “which of your consumer purchase decisions are influenced by environmental impacts?”. This was followed by a check-all-that-apply question where participants were able to select from all ten environmental impacts to indicate “which environmental impacts currently influence their purchase decisions?”.
For the co-design discussion, pre-concepts were presented alongside consumer purchase props as an enabling technique that is known to support better outcomes in FG discussions [44]. Participants worked in pairs to consider two consumer purchase items, each with one of the initial pre-concepts. The item-pre-concept pairings were designed to create contrast and generate discussion, e.g., a 2 L carton of milk with DB1 (three environmental impacts presented for a low cost, regular purchase, but lacking agricultural emissions) and a smartphone with CF (a single environmental impact for a high cost, long-term purchase). Other pairings included: 60 g chocolate bar with SR and white t-shirt with BG1; washing machine with NIPS1 and 1 kg washing powder with CF; flight to Fiji with BG1 and white t-shirt with NIPS1; takeaway coffee with SR and aerosol deodorant with DB1. To gain specific insight and promote co-design participants considered the questions: “What information is provided?”; “What are the disadvantages, advantages or improvements?”. A group discussion followed that captured participant views regarding the effectiveness of pre-concept components in conveying environmental information stimulated by the item-pre-concept pairings.
FGs were recorded, and the main discussion elements related to current awareness of environmental impacts and demand for product labelling; the effectiveness of components for communicating environmental impact data; and how consumers would like to interact with that information were transcribed, and key themes and associated quotes were extracted and categorised to inform Stage 3.
2.2.3. Stage 3: Refined and New Pre-Concept Designs
The researchers reviewed key themes and recommendations from Stage 2 to refine the initial pre-concepts, resulting in six pre-concepts (Figure 2, Table 3) designed for use in follow-up FGs (Stage 4). The Dashboard, Bar Graph, and NIPS formats were refined with key components including colours (‘Dashboard 2’, DB2), colour intensity (‘Bar Graph 2’, BG2), and type of digital link (QR code or website) adjusted. A new pre-concept (‘Planetary Labels’ (PL) 1, 2, and 3) was also designed to be scalable, incorporate planet imagery to link to the environment and simplify the full set of environmental impacts by including categories of air, land, and water. Additional components adjusted from Stage 2 feedback included scientific context as a recommended limit (BG2, NIPS2, and PL series), explanation of units unfamiliar to participants in Stage 2 (DB2, NIPS2, and PL3), and definition of GHGs (DB2, NIPS2, and PL3). The inclusion of a positive impact component (BG2 and PL2) and whole-of-life statements (DB2, NIPS2, PL2, and PL3) were also evaluated.
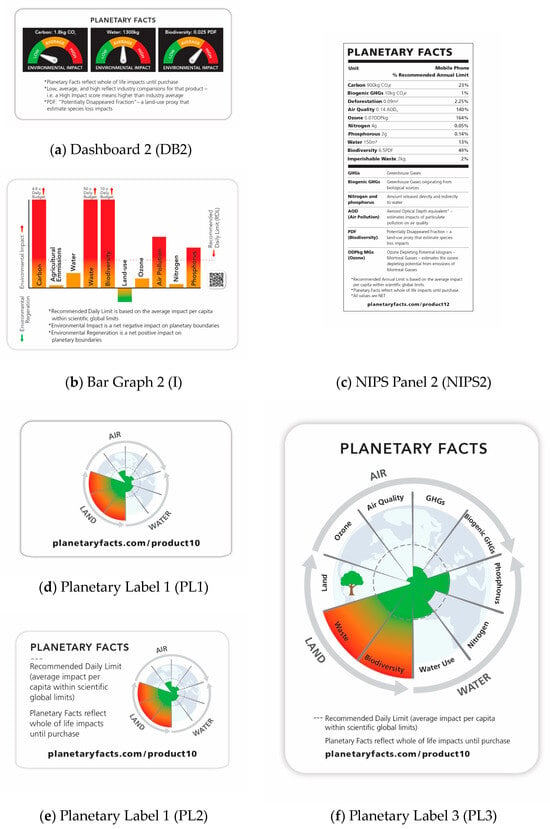
Figure 2.
Images of refined: (a) Dashboard 2, (b) Bar Graph 2, (c) NIPS Panel 2, and new (d–f) Planetary Labels 1, 2, and 3, respectively, pre-concept designs developed in Stage 3 and evaluated in Stage 4 focus groups.
Table 3.
Refined and new pre-concept designs (Stage 3) evaluated in Stage 4 focus groups and their associated design components (●).
2.2.4. Stage 4: Consumer Co-Design Process with Refined and New Pre-Concept Designs
At Stage 4, further FGs lasting approximately 90 min were conducted for each participant group, with six novice and seven aware participants from Stage 2 invited back. The protocol for Stage 2 (Section 2.2.2) was followed, except FGs comprised four parts: (i) icebreaker; (ii) co-design discussion of refined pre-concepts (DB2, BG2, NIPS2); (iii) co-design discussion of new pre-concepts (PL1, PL2, and PL3); and (iv) statement discussion.
As the icebreaker, participants were asked to share what was memorable about, or that they had done differently because of, their previous FG. Participants then worked in pairs to discuss refined item-pre-concept pairings that were deliberately either congruent or incongruent to stimulate discussion. For part (ii), the pairings were: 2 L milk with DB2 and a smartphone with NIPS2; 60 g chocolate bar with DB2 and a white t-shirt with BG2; an overseas flight with BG2 and a white t-shirt with NIPS2; aerosol deodorant with DB2 and a washing machine with NIPS2. For part (iii), each pair was presented with item pairings using the new pre-concepts: a 60 g chocolate bar with PL1, a white t-shirt with PL2 and a washing machine with PL3. To aid discussion in parts (ii) and (iii), participants considered the following questions: “What’s different about the new version?”; “What do you understand from the changes?”; “Is the new/different information and format helpful? Why or why not?” and “What is unnecessary or missing?”. For part (iii), participants were also asked if they had “Any specific comments on the air/land/water infographic as information for this product?”.
Using Mentimeter, participants then voted for their favourite pre-concept and how important capturing the positive impact of a product was to them (not needed; a nice to have; slightly important; moderately important; very important). To close (iv), the moderator facilitated a discussion on participant understanding of statements appearing on some labels, including: ‘Recommended daily limit’, ‘Recommended annual limit’, ‘Environmental impact is a net negative impact on planetary boundaries’, ‘Environmental regeneration is a net positive impact on planetary boundaries, ‘all values are NET’, and ‘Planetary Facts’ reflect the whole of life impacts until purchase’.
2.3. Data Analysis
To compare the extent of environmental considerations between Novice and Aware participant groups, participant responses to the environmental lifestyle choice questions (Section 2.1) were collected, categorised as either Novice or Aware and the arithmetic mean was calculated. Mentimeter responses regarding consideration of the environment for current purchasing decisions were also compared.
The FG recordings were reviewed by the principal researcher, key quotes were transcribed, and patterns were identified using an inductive approach. Reflexive thematic analysis [45] was then applied to define key themes, with sub-themes used to further clarify different aspects within each theme. Key exemplar quotes from both Novice and Aware participants were collected under each theme/sub-theme and the analysis was reviewed by two further principal researchers to cross-validate and enrich the interpretation.
Participant quotes related to the perception of consumer demand for an environmental facts labelling scheme were collected from the “warm-up” in Stage 2 FGs. Discussion from both Stage 2 and Stage 4 FGs yielded quotes regarding key themes related to components perceived to enable or limit consumer engagement with pre-concept ‘Planetary Facts’ labels. Additional themes were collected from these discussions, as well as the statement understanding discussion in Stage 4 FGs, to further inform effective future environmental facts label design and implementation of a labelling scheme. Finally, quotes from the Novice and Aware groups under each theme were compared to uncover similarities or differences between participant groups.
3. Results
Novice and Aware participant groups were similar in demographic composition, which is summarised as follows: Novice participants (n = 3 male, 11 female) were 21 to 63 years old (mean 44), and Aware participants (n = 5 male, 10 female) were 26 to 63 years old (mean 42). Only 3 participants earned over NZ$120K, and notably, in both groups, most had a graduate or postgraduate degree.
3.1. Novice vs. Aware Participant Environmental Considerations
The Novice group exhibited a lower mean score for each environmental lifestyle choice question compared to the Aware group, consistent with a lower environmental awareness at the time of recruitment (Appendix A, Table A1). Both groups reported taking environmental impacts into consideration when making purchases (Stage 2), with key differences consistent with their declared level of knowledge of environmental issues. Aware participants cited a more diverse range of purchasing decisions (e.g., power rating of appliances, clothing from natural sources, and skincare products) influenced by environmental impacts compared to Novice participants. However, for both groups, plastic packaging reduction and related topics were the top priorities (Appendix B, Figure A1). When identifying which environmental impacts influenced their purchasing decisions, more Aware participants selected each environmental impact compared to Novice participants (Figure 3), except for water pollution-related impacts, which were scarcely selected by either group.
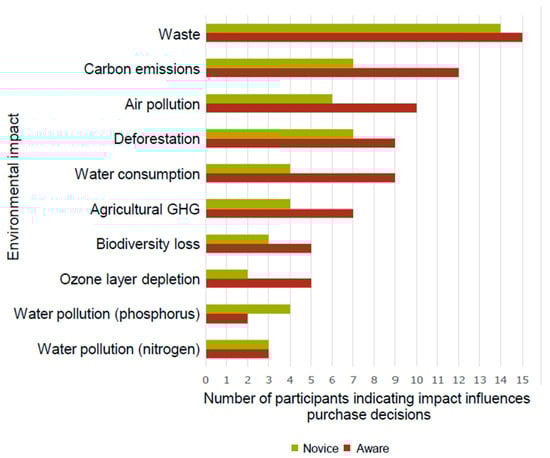
Figure 3.
Number of participants per group selecting each environmental impact when asked: “Which (if any) environmental impacts influence your purchase decisions?”. Data were extracted from the Mentimeter online tool.
3.2. Perceived Consumer Demand for Environmental Facts Labels
Participants generally viewed ‘Planetary Facts’ labels as a concept that many consumers would use. Key overarching themes related to consumer label use are presented in Table 4. Note that throughout the results section, numbers preceded by Q in brackets relate to key quotes exemplifying themes listed in Table 4, Table 5, Table 6, Table 7, Table 8 and Table 9.
Table 4.
Overarching themes representing participant views on consumer expectation for a ‘Planetary Facts’ label and exemplar quotes from Novice (N) or Aware (A) participants in stage 2 (S2) or stage 4 (S4) focus groups.
Both Novice and Aware participants thought labels would enable an informed choice by consumers based on overall environmental impact [Q1, Q2]. They felt they would be used by consumers provided the information presented was easy to interpret [Q3, Q4, Q5, Q6) and from a trustworthy source [Q7, Q8, Q9). A complementary publicity campaign to promote the interpretation and use of such labels [Q10] and raise awareness of environmental issues [Q11], was also felt necessary for successful implementation. However, it was stressed that some consumers would likely prioritise cost over environmental performance for purchasing decisions [Q12, Q13]. Participant perception was generally that products and services with lower environmental impact would incur a higher price, which is not necessarily the case [29]. Participants also highlighted that some consumers would not have time (or would not take time) to consider labels [Q14, Q15].
3.3. Key Considerations for an Effective Environmental Facts Label
Participant evaluation of pre-concept components revealed key themes related to label appearance (Table 5) as well as key features perceived to be important for an effective ‘Planetary Facts’ label (Table 6).
3.3.1. Label Appearance
Key themes relating to label appearance were that to be effective, labels should be ‘distinctive’ with a simple design. For example, participants reported that while systems like star ratings are easy to read [Q16], stars could be confused with existing labels [Q18, Q19], such as the health star rating [Q20]. Instead, they proposed an innovative or proprietary graphic [Q19, Q17]. They emphasised that the imagery and title should clearly indicate that the label is about environmental health [Q21]. For example, they suggested including the term “Impacts” on the label [Q21] and suggested mini-globes as an alternative to stars [Q17]. This feedback was further tested by incorporating an image of the Earth as the background to the PL pre-concepts at Stage 4. Several participants noted the effectiveness of this image in communicating an immediate environmental association [Q22, Q23, Q24].
‘Simple Design’ included several sub-themes, with participants highlighting the value of visual communications, logical colour selection, familiar imagery, and simplification by arranging environmental impacts by category of effect (air, land or water) to enable easy and quick understanding of labels. Visual representation of data was preferred to numbers by some to facilitate easy decision-making [Q25] and comprehension [Q26, Q27], particularly if this leveraged familiar imagery such as traffic lights [Q34] or vehicle dashboards [Q35]. The use of a bar chart (BG1) was preferable to numbers [Q27] for some, whilst others thought this visual tool was confusing and suggested a pie chart instead [Q36]. The use of colour to convey overall impact was discussed as an opportunity to provide a quick communication tool for consumers “in a hurry” [Q40]. Colour was also preferable to numbers [Q29] for some, however, critically, the colours needed appropriate connotation. For example, green shading of the biodiversity bar in the initial pre-concept BG1 was mistakenly assumed by some to have a positive impact (i.e., improving biodiversity) [Q30, Q31]. Some participants suggested that the incorporation of increasing colour intensity could be used to emphasise a warning [Q28]. The combination of traffic light colours and increasing intensity in pre-concepts (BG2 and the PL series) developed at Stage 3 was declared as significantly aiding comprehension of these labels [Q32, Q33].
A few participants preferred pre-concepts, such as NIPS1, that provided detailed information for all environmental impacts [Q37], while others thought this displayed too many impacts, suggesting grouping impacts to aid message communication [Q38]. This suggestion was tested through the PL pre-concept series, which was commended for classifying impacts under “air, land, or water” [Q39].
Table 5.
Key themes and sub-themes regarding factors related to label appearance for an effective ‘Planetary Facts’ label and exemplar quotes from Novice (N) or Aware (A) participants in stage 2 (S2) or stage 4 (S4) focus groups.
Table 5.
Key themes and sub-themes regarding factors related to label appearance for an effective ‘Planetary Facts’ label and exemplar quotes from Novice (N) or Aware (A) participants in stage 2 (S2) or stage 4 (S4) focus groups.
| Theme | Sub-Theme | Description | Example Quote(s) |
|---|---|---|---|
| Distinctive | Readily identifiable | Imagery provides environmental association/stands out | “The stars are easy to read.” [A-S2]Q16 “They could do little globes instead.” [N-S2]Q17 |
| Unique | Not similar to other rating systems | “Yet another star system. I didn’t like this at all.” [N-S2]Q18 “Need a more innovative way than star system.” [N-S2]Q19 “Stars could be confused with health rating.” [N-S2]Q20 | |
| Appropriate environmental graphic/language | Linked with environmental connotations | “A name other than Planetary Facts would make it more clear for me, Planetary Impacts?” [A-S2]Q21 “I like that you can see easily that you are talking about the planet.” [N-R2]Q22 “Perhaps too obvious to mention, but shows it’s about planet Earth.” [N-R2]Q23 “It was definitely the Earth.” [N-R2]Q24 | |
| Simple design | Visual | Graphic tool, not numbers | “Gives a quick visual decision-making tool.” [N-S4]Q25 “Visual so a lot easier to read than a lot of stats.” [N-S2]Q26 “Pictures grab me more than numbers.” [N-S2]Q27 |
| Logical colour association -intensity | Graduating intensity from light to dark | “Colour scale could go from light red to really dark red to give you a warning.” [A-S2]Q28 | |
| Logical colour association—hue | Using colours associated with “safe” or “warning” | “The bottom half could be a colour code instead of numbers, so for water, it could be red.” [A-S2]Q29 “When we see green, we do not think of it as a bad thing, here for biodiversity is this a good thing to be green and high?” [A-S2]Q30 “They seem to have gone with random colours and the biodiversity one is green, which suggests it’s good, but I suspect it’s not.” [N-S2]Q31 “Traffic light system colour good especially yellow below, red above-dotted line.” [N-S4]Q32 “Use of red and green makes sense, is vibrant.” [A-S4]Q33 | |
| Familiar image | Use of visual communication tool that consumers can readily understand | “The traffic light is informative.” [N-S2]Q34 “Easy to understand scale, because it’s the sort of thing you see on a car dashboard.” [A-S2]Q35 “Presenting in a bar is confusing, use a pie chart.” [A-S2]Q36 | |
| Categorise impacts | Group impacts into categories to simplify design or message expression | “I like how it breaks things down into different [impacts].” [A-S2]Q37 “This is a very long list of factors, could they be combined?” [A-S2]Q38 “I don’t know what individual factors are but can understand effects are on air, land and water.” [N-S4]Q39 | |
| Easy to use/not time-consuming | Simple enough to understand quickly | “Just an overall impact with a colour rating because people are in a hurry at the supermarket.” [A-S2]Q40 |
Table 6.
Key themes and sub-themes regarding key features to incorporate for effective ‘Planetary Facts’ labels and exemplar quotes from Novice (N) or Aware (A) participants in stage 2 (S2) or stage 4 (S4) focus groups.
Table 6.
Key themes and sub-themes regarding key features to incorporate for effective ‘Planetary Facts’ labels and exemplar quotes from Novice (N) or Aware (A) participants in stage 2 (S2) or stage 4 (S4) focus groups.
| Theme | Sub-Theme | Description | Example Quote(s) |
|---|---|---|---|
| Backed by scientific and credible data | Independent/trustworthy source | Reliable data source | “This should be independent, not something companies produce themselves.” [N-S2]Q41 “A government standard or lined up with a government target.” [N-S2]Q42 “NZ standard, that would make it more legitimate.” [N-S2]Q43 “Industry standard is open to manipulation by the industry and may not be that good for the environment, so have to have an external authority to set the standards.” [A-S2]Q44 “If it is up to each brand to calculate things rather than a central place there are all sorts of questions around who/what you trust.” [N-S4]Q45 |
| Numbers | Inclusion of numerical values | “Written values along top are good because someone always wants to know that.” [N-S2]Q46 “People keen on environmental issues would look closely at it; it would provide the information they want.” [N-S2]Q47 “I love this. I think in terms of numbers, tables and budgets, this is what I want to see.” [N-S2]Q48 “Do not understand all the terms. Too technical for many consumers.” [A-S2]Q49 “Do consumers need all this level of scientific detail.” [A-S4]Q50 “Way too overwhelming.” [A-S4]Q51 | |
| Measurements/units | Inclusion of units/meaning of numbers | “But [the numbers] are confusing because they don’t specify what it is for—per litre or per bottle.” [N-S2]Q52 “The units need to be explained.” [N-S2]Q53 “Too technical, people will not understand the units.” [A-S2]Q54. “Units clearly expressed—liked definitions panel—Understand what PDF means now.” [N-S4]Q55 “Would expect to use litres, not kg for liquid (milk).” [A-S4] Q56 | |
| QR code/website to access data | Means to access data behind the label, rather than inclusion on the label | “I would find this interesting to access from a QR code, particularly for people who want to read into it.” [N-S2]Q57 “The QR code that you can scan to look up more info is an advantage.” [N-S2]Q58 “You would not scan a QR code when buying chocolate.” [A-S2 and N-S2]Q59 “Would you really [access a website] at the supermarket.” [A-S4]Q60 “QR code is useful, but would take too much time in the supermarket.” [A-S2]Q61 “Disadvantage of QR code is the older generation may not look at it.” [N-R1]Q62 “Use a QR code to give more definition.” [N-S4]Q63 | |
| Clear message | Plain language | Use of consumer-accessible terminology | “Do not understand all the terms, too technical.” [A-S2]Q64 “Difficult to understand the meaning of statements.” [N-S4]Q65 “I’m trying to consider if I can interpret this information and use it in my purchasing decision. I would want to ask the person in the store for help.” [N-S4]Q66 |
| Appropriate detail of information | Enough information to facilitate consumer comprehension | “Nothing was explained, did not provide any information.” [A-S2]Q67 “It’s overwhelming.” [A-S4]Q68 “A lot of information, but not a lot about how to interpret it so we found that not terribly helpful.” [N-S2]Q69 “People keen on environmental issues would look closely at it, it would provide the information they want.” [N-S2]Q70 | |
| Clear information: resonate | Information presented in a way that is comprehendible to consumers | “Assume low is good and high is bad, but isn’t high biodiversity good?” [N-S2]Q71 “Who is average and who specified what the annual budget is. Is it across the world?” [N-S2]Q72 “Clearer, like recommended values.” [A-S4]Q73 “I like that more information is presented in the new label (BG2).” [A-S4]Q74 “ [Air, land and water] adds a layer of context between this is environmental stuff and the complicated facts.” [A-S4]Q75 | |
| Clear information: Annual/daily limit | Indication of contribution to an overall limit | “% daily consumption is something that the average consumer can have a go at understanding” [A-S2]Q76 “What does 2% recommended annual budget actually mean?” [N-S2]Q77 “What does the recommended daily budget refer to?” [A-S2]Q78 “Having the word limit, helps you understand what they are talking about as opposed to value. A limit makes it clear—that is the limit to work for.” [N-S4]Q79 “Expressing things as % recommended annual limit versus just % daily value/daily limit. A slight difference, but it is still easier to interpret without the seemingly random units.” [N-S4]Q80 “Annual line is a very good idea” [N-S4]Q81 | |
| Comparable | Method of comparison: | Carbon footprint | “I like this one, the carbon footprint is useful. You can compare across products and make your purchasing decision based on carbon footprint.” [N-S2]Q86 “It gives some numbers for carbon footprint which you would be able to compare across different phones.” [N-S2]Q87 “Medium carbon means nothing to me. Is low good or is high good?” [A-S2]Q88 “Gives you carbon impact information that people already understand.” [A-S2]Q89 “Not everyone knows what carbon footprint means.” [A-S2]Q90 |
| Independently determined scientific comparison method | “Industry standard is a useful comparison.” [N-S4]Q91 “It actually says that it is industry standard for that product, which gives you a better idea, you can pick up the products and compare.” [N-S4]Q92 “What does the industry standard actually mean? It could be quite bad anyway.” [N-S2]Q93 “Is it good to be above the industry standard or below? [N-S2]Q94 “What are the rules around assessing this standard?” [A-S2]Q95 “Industry standard is open to manipulation by the industry and may not be that good for the environment, so have to have an external authority to set the standards.” [A-S2]Q96 “Put the safe limit on it.” [A-S2]Q97 “Put the ideal limit, then you can see how far away it is from the ideal.” [A-S2]Q98 | ||
| Comparison across products using annual/daily limit | “Broken line is the limit—if not up to that it is good.” [A-S4]Q99 “Clearer, like recommended values.” [N-S4]Q100 “% Recommended annual limit helps -much better limit, was much clearer.” [N-S4]Q101 | ||
| Scalable | Suits the value of the product | More data for higher value product | “Washing machine has a lot of info but it is a long-term use so more interested in it.” [N-S4]Q102 “It would be useful on a large purchase that you do more research on” [N-S2]Q103 “People are more likely to use this for large purchases like a washing machine where they do research.” [N-S2]Q104 |
| Suits available packaging space | Scaled to size of product or display method | “Too much information for a tag.” [N-S2]Q105 “I would suggest this is something to link with a QR code, because how will they put this information on a T-shirt?” [N-S2]Q106 “It’s OK because the [coffee] cup is small, it has basic facts, and you can access the QR code if you want to know more.” [N-S2]Q107 “Broken line is the limit—if not up to that it’s good –very obvious for medium and large—not so good for chocolate. Small size is an issue. There is space for a key at least.” [A-S4]Q108 “Easily scalable so you can use it on different products.” [N-S4]Q109 “Can be best in very small space compared to bar graphs.” [A-S4]Q110 “The small one is lacking information, you are trying to squeeze it, but it lacks information.” [A-S4]Q111 | |
| Suits type and frequency of product use | Impulse, consumed quickly vs long-term purchase. Also, regular vs one-off purchases | “The type of label could be determined by the product—if it is a product you would use daily for a long time (e.g., deodorant) you are more likely to read the information, so perhaps more should be provided. But with the coffee cup, you would only need basic information because you will dispose of it.” [N-S2]Q112 “When buying a bottle of milk need something quick and easy to understand.” [A-S2]Q113 “You would not scan a QR code when buying chocolate.” [A-S2]Q114 “Where would it go on a chocolate bar—would you notice it?” [N-S4]Q115 “This is recommended daily. I think forthe t-shirt annual is better.” [N-S4]Q116 |
3.3.2. Key Design Features to Incorporate
Participants highlighted four key features perceived to be important for environmental facts labels: that labels are backed by scientific and credible data, provide a clear message, are comparable (between products), and are scalable (to adapt to the size and/or complexity of the related product).
Backed by Scientific and Credible Data
It was frequently expressed that label information should be scientifically derived, include a scientific context (to highlight what is “good enough”), and be produced by a recognisable body independent from manufacturers [Q41]. It was felt the data communicated should be aligned with a government standard [Q42], which was perceived as “legitimate” [Q43] compared to industry standards [Q44, Q45]. Concern was expressed that manufacturers might select data presenting their product in a favourable light compared to competitors rather than the full environmental impact [Q44].
Including numerical data was considered useful because it would be available for consumers who wanted that depth of information [Q46]. In particular, NIPS1 would appeal to environmentally aware consumers because it would provide all the environmental information they would want to make a purchase decision [Q47]. One participant recounted that numbers and budgets were appealing to them [Q48]. However, there was a tangible risk that numbers could be perceived by some consumers as “too technical” [Q49], provide too much “scientific detail” [Q50], and potentially be “way too overwhelming” [Q51]. To improve their effectiveness, participants suggested that the context of the numbers [Q52] and their units [Q53, Q54] could be explained. Including unit definitions (DB2, NIPS2) was stated to be an improvement in the refined pre-concepts [Q55], although concern over the choice of kg rather than litres for a liquid purchase (milk) was expressed [Q56].
The presence of a QR code or website to provide access to more detailed information, such as that on the NIPS-type pre-concepts [Q57], was welcomed [Q58], particularly in the context of the CF, SR initial, and PL1 new pre-concepts. This was noted to be an “advantage” if the item was of high cost but relatively small size, e.g., a smartphone [Q58]. However, the worth of QR codes or websites for impulse or supermarket purchases was questioned [Q59, Q60, Q61]. Reliance on a QR code or website for information may be a disadvantage for consumers who do not use them [Q62], but the absence of a way to get more information on some pre-concepts was noted [Q63].
Provide a Clear Message
Many participants felt a label needed accessible terminology [Q64] to facilitate consumer interpretation [Q65, Q66]. Terminologies such as “high biodiversity” (DB1) [Q71] and “daily/annual budget” (CF, BG1) [Q72, Q77, Q78] were particularly noted as difficult to comprehend, with “% daily value” (NIPS1) thought to be more consumer-friendly [Q76]. Initial pre-concepts were also considered difficult to interpret if they did not include enough information (SR) [Q67], but also if they had too much information but lacked any explanation (NIPS 1) [Q68, Q69]. Nevertheless, it was highlighted that lots of information may appeal to environmentally knowledgeable consumers [Q70]. In general, refined pre-concepts were thought to be more effective than initial pre-concepts, even when a high level of detail was being presented [Q74], due to the inclusion of descriptions [Q74] as well as the implementation of more accessible terminology [Q73]. In particular, participants regularly discussed that the incorporation of a recommended limit [Q76] would be easier to interpret for consumers (NIPS2) [Q79, Q80], especially when it was indicated as a line (BG2) [Q81, Q82]. The new pre-concepts were praised for assigning “air, land, and water” categories to the environmental impacts, as it was expected to aid comprehension of “complicated facts” [Q75].
Allow Comparison across Products
Pre-concept designs (CF, SR, DB1, and DB2) that enabled comparison across products received positive comments [Q83, Q84, Q85]. In general, carbon footprint was thought to be a useful comparison tool [Q86], with a numerical value enabling a direct comparison across products (CF) [Q87], while the indication of low, medium, and high compared to an industry standard (DB1) was deemed less useful [Q88]. However, there were conflicting views on whether all consumers would relate to carbon footprint information [Q89, Q90]. The inclusion of an industry standard was thought to be a useful tool to enable consumers to compare products [Q91, Q92]. However, there were concerns regarding whether an industry standard was “good” or not [Q93, Q94], and there was a lack of trust for industry standards in general [Q95, Q96]. An independently determined, scientific ideal limit was a frequently mentioned preferred option [Q96, Q97, Q98], with the indicative line in BG2 and PL pre-concepts often cited as clear for consumers [Q99, Q100, Q101].
Scalable Design
The prop and pre-concept pairings triggered discussion regarding the ability to scale a ‘Planetary Facts’ label such that it was appropriate for the size of the item as well as its cost, frequency of purchase, and longevity of use. Pre-concepts that communicated information across all the environmental impacts were viewed as appropriate for high-cost, long-term purchases, e.g., washing machines [Q102], where consumers might take time and do more research before buying [Q103, Q104]. While such high-level detail was deemed impractical to “squeeze” onto smaller-sized labels [Q105], it was suggested such data could be accessed through a QR code for purchases such as mobile phones [Q58] and clothing [Q106]. A further theme linked information presented regarding the item and frequency of purchase, with participants in favour of a quick visual summary (SR or PL1) for small-sized “disposable” items, purchased frequently, such as takeaway coffee [Q107], while more detailed was deemed appropriate for items that consumers use for longer, e.g., deodorant [Q112]. Due to time constraints when shopping, food items were considered to require labels that were quick and easy to understand [Q113], as it was believed consumers were unlikely to scan a QR code [Q114] and perhaps not notice this sort of label [Q115] when “doing the weekly shop”. The type of information communicated by pre-concept components was also mentioned to be product-dependent, with, e.g., an annual rather than daily recommended limit preferred for a t-shirt [Q116].
The new pre-concepts (PL1, 2, and 3) were praised for being scalable for both physical size and depth of information [Q109], with the visual component highlighted as more appropriate for scaling to fit product size than a bar graph [Q110]. However, there was concern that the least detailed version (PL1) was not as effective at communicating its message [Q108, Q111].
3.4. Calculation Methodology
Key themes related to environmental impact calculation methodology as well as associated aspects consumers may consider during purchase are presented in Table 7. Pre-concepts indicated environmental impact up to the point of purchase (cradle to gate), but participants discussed the importance of also incorporating the environmental impact of disposal [Q117] or recycling [Q118, Q119]. Some also wanted to incorporate aspects relating to lifespan (for example, mobile phone battery [Q120]) and use (for example, washing machine [Q121]) of the product, as they perceived this to have a greater influence on differentiating the environmental impact of items across the product range than manufacturing aspects would [Q120]. Others wanted clarity around whether the product packaging was included for food items [Q122].
Aspects related to net environmental impacts that consumers might consider when comparing potential purchases were also discussed. Two of the refined pre-concepts (BG2 and PL2) included positive and negative impacts, which some participants regarded as important [Q123, Q124] and may present consumers with “hope” [Q125]. Other participants did not think this was important to show [Q126] and felt there was a risk of it being perceived as greenwashing [Q127]. Some participants highlighted that data related to product lifespan (e.g., children’s shoes [Q128]) would impact their purchasing decisions beyond environmental impact considerations, highlighting the inclusion of this information as a potential lever to improve engagement. In addition, the value of providing information to inform a choice between whether it would be better for the environment to continue using an old, less efficient appliance (e.g., a washing machine) or purchase a new one was also discussed [Q129].
Table 7.
Key themes and sub-themes regarding key features to incorporate for effective ‘Planetary Facts’ labels and exemplar quotes from Novice (N) or Aware (A) participants in stage 2 (S2) or stage 4 (S4) focus groups.
Table 7.
Key themes and sub-themes regarding key features to incorporate for effective ‘Planetary Facts’ labels and exemplar quotes from Novice (N) or Aware (A) participants in stage 2 (S2) or stage 4 (S4) focus groups.
| Theme | Sub-Theme | Description | Example Quote(s) |
|---|---|---|---|
| Calculation methodology | Cradle-to-gate versus Cradle to grave | Include impact data beyond the point of purchase | “Add some information about disposal—is that considered in the impacts?” [N-S4]Q117 “Products are produced with parts that have different capabilities for recycling and different costs. If you are deciding impact to planet, up to sale is one part but so is when you’ve finished with it.” [N-S4]Q118 “Is recycling of t-shirts included?” [A-S2]Q119 |
| Use/longevity of product | Include impact data relating to product use and longevity | “Some smartphones use recycled parts or have longer-lasting batteries, could this information be included?” [A-S2]Q120 “For me, a washing machine is a long-term purchase. So I am a lot more interested in the energy saving, water and power use for the average user and its average lifetime rather than the things in the production which may not vary across products.” [N-S4]Q121 | |
| Packaging | Include impact data relating to packaging | “Are these facts related to the packaging (e.g., milk bottle) or the production of the product (e.g., milk)?” [A-S2]Q122 | |
| Net Planetary Impact | Positive vs. negative | Depict positive as well as negative Planetary Impacts? | “The bar graph [was best because] it has the ability to show positive impacts.” [A-S4]Q123 “The positivity is good and some people definitely look for green credentials as opposed to red ones.” [N-S4]Q124 “I think psychologically it’s nice to have a positive rather than always a negative. Some hopeful aspects. Some people might look for products that have that aspect.” [N-S4]Q125 “I don’t mind if we don’t have this, just show the major impacts that are high.” [A-S4]Q126 “I have this fear of greenwashing and I would want to be sure that it was actually positive and not just greenwashing.” [N-S4]Q127 |
| Longevity of product | Assessment of net impact relative to use prior to purchase | “There is an assumption that each product has an equal lifetime. But we only know that in hindsight. E.g., For children’s shoes, the cheaper ones tend to fall apart quicker, but how do I judge if I will get twice out of a more expensive pair.” [N-S4]Q128 “If a washing machine is old and getting inefficient, is it better to keep using it? How does it compare to the energy cost of producing a new machine.” [N-S4]Q129 |
3.5. Factors Perceived to Affect Consumer Engagement
Discussions revealed that while participants thought environmental impact information would influence consumer purchase decisions, there were other factors that could override this as a first priority, including time, cost, comprehension, brand loyalty, and consumption experience (Table 8).
3.5.1. Purchases with Time Pressures
Participants believed that consumers would be less likely to consider product environmental impacts whenunder time pressure. Pre-concepts that relied on a QR code were perceived to be time-consuming [Q130], particularly in the supermarket [Q131]. Engagement with environmental impact information when making an impulse purchase such as a chocolate bar was also expected to be low, especially if scanning a QR code was necessary to access the information [Q132].
3.5.2. Reliance on Technology
The usefulness of a QR code was also thought to be limiting at point of purchase where technology was not available, such as in the absence of internet access [Q133] and/or a smartphone [Q134]. A website address was expected to be more accessible for consumers without smartphones [Q135] and “older” consumers [Q136], as well as enabling consumers to access information at home [Q137] where they would have more time, although it was acknowledged that this would be after purchase.
3.5.3. Consumer Inability to Interpret
There was a perception that all initial pre-concepts, except the SR, would be difficult to interpret for some consumers. The stating of select (DB1 and CF) or all (NIPS1, BG1) environmental impacts was expected to be difficult for many consumers because of their unfamiliarity with environmental impact terminology [Q138, Q139]. The use of “carbon footprint” was also perceived to be a concept that many consumers would not understand [Q140]. The inclusion of numbers on the initial pre-concept DB1 was mentioned by some participants as confusing, particularly when a low number was not always associated with a low on the gauge [Q141]. Unfamiliar units, such as PDF, also caused confusion [Q142]. The lower half of the initial pre-concept NIPS1 was particularly difficult for people to “make sense of” because it presented “too much information” [Q143] with measurements that were “unfamiliar” [Q144]. In contrast, the refined pre-concepts were frequently indicated as “improved” due to “definitions” [Q145] clarifying the message. The lower half of NIPS2 was particularly viewed as improved [Q146]. The new pre-concepts were believed to facilitate “lay” consumer comprehension even further by categorisation of environmental impact as either air, land or water. It was described as adding a “level of context” for environmental impact information and therefore improving understanding [Q147].
Notably, it was frequently mentioned across all FGs that an education campaign would be important to support the launch of a ‘Planetary Facts’ labelling scheme [Q144, Q145, Q148]. Participants felt that the new pre-concepts were in particular need of an education campaign as the way the information was communicated was not as “intuitive” as a bar graph [Q149]. That said, a publicity campaign was expected to improve overall familiarity and support pre-concepts such as PL1, where fewer cues were present due to its smaller size [Q150].
Table 8.
Key themes and sub-themes regarding key features to incorporate for effective ‘Planetary Facts’ labels and exemplar quotes from Novice (N) or Aware (A) participants in stage 2 (S2) or stage 4 (S4) focus groups.
Table 8.
Key themes and sub-themes regarding key features to incorporate for effective ‘Planetary Facts’ labels and exemplar quotes from Novice (N) or Aware (A) participants in stage 2 (S2) or stage 4 (S4) focus groups.
| Theme | Sub-Theme | Description | Example Quote(s) |
|---|---|---|---|
| Barriers to label use | Purchases made under time pressure | Lack of time during shopping to interact with or consider the information | “Having to scan a QR code each time to get some useful information would be very time-consuming.” [N-S2]Q130 “QR code is useful, but would take too much time in the supermarket.” [A-S2]Q131 “You would not scan a QR code when buying chocolate.” [A-S2 and N-S2]Q132 |
| Reliance on technology | Lack of access or ability to apply technology to engage with the information | “What if there is no internet connection.” [A-S2]Q133 “QR code is useful, but only if you have a smartphone.” [A-S2]Q134 “Web address for me because I don’t have a mobile phone.” [N-S4]Q135 “Older might prefer the website.” [A-S4]Q136 “Gave a website at the bottom so if you were interested you could go and look it up.” [A-S4] Q137 | |
| Consumer inability to interpret | Unable to understand the information presented | “Too technical for many consumers.” [A-S2]Q138 “Do not understand all the terms, too technical.” [A-S2]Q139 “Carbon footprint is too technical, what does it mean for most people?” [A-S2]Q140 “I do not understand the numbers, a high number for water is ‘low’, but a low number for carbon is ‘medium’. This will confuse consumers.” [A-S2]Q141 “What does PDF mean for biodiversity?” [A-S2]Q142 “The second half was too technical, too much information, most of which was useless with no criteria to refer to, the average person would not make much sense of it.” [A-S2]Q143 “It uses measurements that a lot of people are unfamiliar with so you would need a lot of education to read and understand the label.” [A-S2]Q144 “Improved as has definitions but would need a lot of education for consumers to use.” [A-S4]Q145 “In general between the 2 we found the new one the units were clearly expressed and you have a better definition. I really like that definition panel at the bottom. I remember PDF from last time now it’s explained, great.” [N-S4]Q146 “Lay person can pick up on some basics if don’t know a lot of the words, but the category is great for layperson—adds a layer of context between environment v detail.” [A-S4]Q147 “Needs education to use.” [A-S4]Q148 “You will need education to read the label because it is not intuitive. A bar chart is intuitive but this is not and it requires you to stop and think and interpret it.” [A-S4]Q149 “Better use of space—for small one less information but if regular buying they will get familiar with what they are—education again.” [A-S4]Q150 | |
| Perceived cost | Expectation that environmental impact would negatively affect the cost of products | “Some people will not be able to afford this.” [A-S2]Q151 “Who are the target consumers—many will just go on cost.” [N-S4]Q152 | |
| Brand loyalty/consumption experience | Competing preference for preferred brand and preferred consumption experience | “Would the environmental impact be relevant for a bar of chocolate?” [N-S4]Q153 “For small products, like chocolate, the label may not affect decision as much as a brand.” [N-S4]Q154 “Some people will buy the chocolate bar for the flavour or the nutrition, why will they be looking for this? If you want chocolate and love the taste you will definitely buy it even if it is in the higher ranges.” [A-S4]Q155 “I would rather pay more money to purchase something that has a positive impact than something that tastes better.” [A-S4]Q156 |
3.5.4. Perceived Cost
There was a perception, if not necessarily accurate, that products with a lower overall environmental impact would cost more and hence be unaffordable to choose [Q151] by the many consumers basing purchase decisions on cost [Q152].
3.5.5. Brand Loyalty/Consumption Experience
Participants also discussed that consumers would not consider environmental impacts for small purchases such as a bar of chocolate [Q153], where brand [Q154] and flavour [Q155] were thought to be more likely to influence the purchase decision. However, one Aware participant declared that environmental impact considerations would influence their personal purchase decision ahead of flavour or price [Q156].
3.6. Perceived Effects of an Effective Environmental Facts Labelling Scheme
Participants also expressed views regarding the perceived effects implementation of a ‘Planetary Facts’ labelling scheme would have on consumer, manufacturer, and retailer behaviour (Table 9).
3.6.1. Consumer Behaviour
It was perceived that ‘Planetary Facts’ labels would influence consumers at the point of purchase in terms of intent and emotion, as well as facilitate environmental education and budgeting.
Purchase Intent
It was thought that effective ‘Planetary Facts’ labels would lead consumers to reassess their original intent to purchase “a new t-shirt” when they considered there was an environmental impact associated with the purchase [Q157]. It was thought that, at present, label consideration might be selective, for example, consumers might use it to influence the purchase of a “phone”, but not at the “supermarket” [Q158]. However, the labels would allow consumers to select items of lower impact [Q159], while the presence of labels on products purchased regularly would increase “familiarity” [Q160] and be more likely to influence their purchase item choice [Q161].
Purchase Emotion
It was suggested by several participants that the labels would instil a positive emotion in consumers when they used the environmental impact information provided to purchase an item that was of lower environmental impact because they were “making a difference” [Q162]. However, there was also the possibility of instilling guilt when items with high environmental impacts were purchased [Q163].
Provide Education
Participants discussed that currently, consumers are not necessarily aware of all the environmental impacts [Q164] and how purchases might influence these [Q165]. ‘Planetary Facts’ labels were expected to make consumers more aware and potentially think more about their behaviours. It was also thought labels might empower consumers with the ability to “make a difference” [Q162], by identifying products of “lower impact” [Q162].
Personal Environmental Budgeting
Discussions across both stage 2 and stage 4 FGs highlighted the potential for ‘Planetary Facts’ label data to be recorded in an app [Q166] so that consumers could have their own “personal budget” [Q167]. An alternative option where carbon footprint numbers could be recorded via a website so that you can “keep track of your carbon footprint in a day or a year” [Q168] was also mentioned by some participants. Indeed, it was felt by some that a method to track your impacts would be key to the success of the ‘Planetary Facts’ labels as without this option “most people wouldn’t care.” [Q169].
3.6.2. Manufacturer Behaviour
Change Manufacturing and Supply Practices
A few participants highlighted that the information presented on ‘Planetary Facts’ labels may prompt manufacturers to implement changes in manufacturing/supply chain practices to reduce the environmental impacts of their products [Q170].
Avoidance
The initial pre-concept CF prompted a participant to suggest that manufacturers might be less likely to put this type of traffic light visual on their product “if it was red” [Q171]. In addition, a few participants suggested that manufacturers may not use ‘Planetary Facts’ labels as it might detract from “branding”, particularly for small items such as chocolate bars where space is limited [Q172].
3.6.3. Retailer Behaviour
The presence of ‘Planetary Facts’ labels on consumer products might impact retailer behaviour due to consumers seeking help to understand the environmental impact information. One Novice participant mentioned that they would “ask the retailer for help” to interpret the refined pre-concept NIPS2 [Q173].
Table 9.
Key themes and sub-themes regarding key features to incorporate for effective ‘Planetary Facts’ labels and exemplar quotes from Novice (N) or Aware (A) participants in stage 2 (S2) or stage 4 (S4) focus groups.
Table 9.
Key themes and sub-themes regarding key features to incorporate for effective ‘Planetary Facts’ labels and exemplar quotes from Novice (N) or Aware (A) participants in stage 2 (S2) or stage 4 (S4) focus groups.
| Theme | Sub-Theme | Description | Example Quote(s) |
|---|---|---|---|
| Consumer behaviour | Purchase intent | Influence consumer purchase decisions | “I do think it would make me think again about buying a t-shirt when I saw a high impact on biodiversity.” [A-S2]Q157 “I would scan it for a phone, but not at the supermarket.” [N-S2]Q158 “People are unlikely to live within a carbon budget but provides the option of consumers to make a choice for products with a lower carbon impact.” [A-S2]Q159 “If people are regularly buying products with these labels they will become familiar with it over time.” [A-S4]Q160 “Get the people on board that aren’t currently thinking about this kind of stuff.” [N-S2]Q161 |
| Consumer emotion | Feeling positive or negative emotions at the point of purchase | “This is very good; it tells you the impact on the environment is up to you and you can make a huge difference. Gives you the power to make a difference, is encouraging.” [A-S2]Q162 “It could make you feel bad if all you could afford was $10 for a shirt and all the bars were off the scale, but it is all you can afford.” [N-S2]Q163 | |
| Enable education | Provide consumers opportunities to be more environmentally aware | “Currently we don’t think about our direct impact on biodiversity or deforestation.” [N-S2]Q164 “Making you aware and think about your actions.” [A-S2]Q165 | |
| Personal environmental budgeting | Used to direct lifestyle choices | “I like the idea of scanning because for me because I will be able to scan at home and that could be collected on an App.” [N-S4]Q166 “In time there will be an app where you can scan everything, and it will go into your own personal budget.” [N-S2]Q167 “Carbon footprint is quantifiable; you can input the numbers into a carbon footprint website and keep track of your carbon footprint in a day or year.” [N-S2]Q168 “Without an app for tracking most people wouldn’t care.” [N-S4]Q169 | |
| Consumer perception of Manufacturer behaviour | Change behaviour | Encourage companies to decrease the planetary impacts of their products | “This might encourage a company to change.” [N-S2]Q170 |
| Avoidance | Avoidanceof using labels that might highlight either that they were less good than competitors, or that it might detract from their brand | “Would they have put it on there [the packaging] if they were red?” [N-S2]Q171 “Manufacturers would not want it to take up branding space.” [A-S2]Q172 | |
| Consumer perception of retailer behaviour | Support label | Retailers may be required to educate staff to understand the label and provide information to consumers | “I’m trying to consider if I can interpret this information and use it in my purchasing decision. I’d be asking the person in store—will they know how to explain.” [N-S4]Q173 |
3.7. Aware Versus Novice Views of Pre-Concepts
The division of participants into Novice and Aware groups with respect to their perceived current lifestyle choices enabled a comparison regarding patterns of discussion in FGs. While many of the key themes were discussed by both Novice and Aware participants, there were some differences regarding the type and extent of the discussion in some key areas.
Both groups were in favour of an environmental facts labelling scheme, with the Aware group more familiar in general with the concept of ecolabels. However, although the importance of trust in the scientific data behind ‘Planetary Facts’ labels was equally discussed, it was only the Aware group that expressed concern that data should be industry-independent to avoid ‘manipulation’ of data by manufacturers.
What constitutes an effective label also varied across groups. The Novice group tended to discuss the visual component of the pre-concepts in more detail, for example, the use of environmentally linked images rather than stars, and they were generally more sceptical of the information presented and did not want “too much maths”. They generally felt detailed information was only relevant to high-cost, longer-use purchases such as washing machines. In contrast, the Aware group generally wanted access to more detailed data across all purchases but was concerned about the ability of the average consumer to comprehend it. Although the Novice group did not want too much data, they did recognise that others may desire it, and this was true of the Aware group. The Aware group also felt that the feature indicating a positive environmental impact was important, whereas the Novice group did not.
While both groups discussed the need for education concerning the new labelling system, the Aware group tended to highlight other factors, such as brand or product experience, that might compete with the overall environmental impact in the eventual purchase decision.
4. Discussion
The results of the study confirmed that, while participants were not aware of the planetary boundaries framework, they were aware of most of the environmental impacts that could contribute to their exceedance. Participants stated that they were already considering or trying to consider some environmental impacts in their purchasing decisions. Results confirmed a demand for the disclosure of product environmental impact data in the context of global scientifically-derived environmental limits (the planetary boundaries)—‘planetary facts’.
Environmental priorities varied across participants, with waste, carbon emissions, air pollution, and deforestation ranking highest as considerations for purchasing decisions, followed by water consumption and agricultural greenhouse gas emissions. This is consistent with consumers wanting increasingly detailed information about the products they purchase and their desire to include a range of sustainability factors in their purchasing decisions [46].
The results of the study suggested that a singular, comprehensive environmental facts labelling scheme incorporating all environmental impacts, such as ‘Planetary Facts’, applied across products and services spanning multiple sectors could meet this demand for disclosure of data and drive more sustainable purchasing habits. While our study demonstrated a strong demand for an environmental facts labelling scheme, it also highlighted barriers and competing motivations that currently impact consumer adoption of more sustainable purchasing habits.
4.1. Environmental Facts Labelling Scheme to Drive Change
Results indicated that for an environmental facts labelling scheme to be effective in driving change, it would need to provide a holistic disclosure of environmental performance, be contextualised by environmental need, provide consistent data between and across a broad spectrum of different product categories, and be independently managed and verified.
4.1.1. Holistic Disclosure Enhances Credibility
A lack of holistic information about the environmental impacts of products, coupled with differing consumer environmental priorities, causes confusion and erodes consumer confidence in the information presented [47]. In agreement, the current study’s results revealed a demand for comprehensive data encompassing broad environmental impacts up to and even beyond the point of purchase. Previous research has indicated that presenting limited environmental data does not provide consumers with the confidence to make informed purchasing decisions. This can be because the data provided does not align with their environmental priorities. It can also cause concerns regarding greenwashing, where consumers believe data is being selectively shared. As such, limited environmental disclosures present a barrier to adopting more sustainable purchasing practices [48,49]. Therefore, a labelling scheme that quantifies the impacts of products through production and up to the point of purchase against the planetary boundaries, such as the pre-concepts tested in this study, would provide a mechanism for consumers to align purchasing decisions with their sustainability goals [37,47].
4.1.2. Independent Methodology and Verification
Existing literature suggests there is much work to be done to rebuild consumer trust in current ecolabels [19]. In this study, environmentally Aware participants highlighted severe mistrust of manufacturer claims, industry-derived environmental rating schemes, and unverified ecolabels. The distrust of ecolabels found in these FGs is perhaps not surprising given the many examples where industries have focused on a single positive environmental performance measure to deliberately distract from a general lack of sustainability of a product [50]. This has led to consumer mistrust in general of eco-friendly claims, with consumers ex-pecting such claims to be intentionally misleading or greenwashing [10,16,50,51]. Here, one study participant emphasised the extent of mistrust; when asked whether product labels should show a net positive impact on the environment, they replied that “they would consider this to be greenwashing”. This mistrust of industry-derived schemes stems from the association of such schemes with industrial protectionism rather than environmental protection [52].
Encouragingly, ecolabels backed by independent, robust certification schemes that consumers trust have the potential to rebuild consumer trust in sustainable messaging [9,53]. Ecolabels endorsed by organisations consumers trust have greater effectiveness than those without [9,20,37]. Evidence indicates consumers trust environmental organisations and independent bodies ahead of government initiatives, while industry-led labels are least trusted [38,54].
4.1.3. The Importance of Scientific Context
In addition to independence, this study highlighted the value of presenting environmental impact data in context rather than just as a number. Participants strongly preferred scientific context, i.e., relative to environmental need, as opposed to industry context, i.e., relative to competitors and services. They wanted to know what “good” looks like and highlighted the lack of value when purchasing against a potentially poor industry standard.
The newly established European Commission, LCA Product Environmental Footprint (PEF) labels are backed by scientific calculations from an independent organisation. However, PEF labels do not include context or enable comparison across product categories, which limits their effectiveness in driving better purchasing decisions [55].
This study confirmed the importance of context to enable the relatability of environmental data for consumers. Ecolabels with environmental impacts, such as carbon footprint, without context, are unrelatable for consumers and therefore ineffective in influencing purchase decisions [41]. In contrast, consumers have a positive attitude towards labels that offer interpretable contexts [36,41,42], particularly if they facilitate comparability across products [42,56]. The use of scientific context to derive a “recommended daily limit” tested well in this study across all FGs. Moreover, the added advantage of framing such as “recommended daily limit” enabled participants to draw comparisons not only within a product category but also across different products—e.g., a chocolate bar versus a trip to Europe. This finding is supported by other studies, which have also shown that interpretable context for holistic environmental impact can be applied by consumers to identify the most eco-friendly products across categories [56].
4.1.4. A Single, Accessible Scheme
The findings in the current study suggested that one of the greatest advantages of a comprehensive environmental facts labelling scheme, such as ‘Planetary Facts’ tested in this study, would be the consistent presentation of information across any product. Participants hypothesised that consistency would raise awareness of product environmental impacts and promote consumer willingness to invest time in understanding the information provided, thus increasing the likely impact on purchasing decisions.
Frequent exposure to such messaging could be an effective “nudge” to increase environmentally sustainable purchasing decisions. While consumers may not initially understand every scientific element, it has the potential to, at a minimum, spark curiosity amongst consumers to learn more or to increase general knowledge.
Exposure strategies are most effective when information is made more accessible, particularly for consumers with little environmental knowledge [49,57]. Environmentally Novice participants in this study highlighted the value of the labelling scheme adopting distinguishing, environmentally linked branding that resonates with consumers. This inspired the most popular graphic, which incorporated an image of planet Earth augmented by logical colours to indicate impact. Familiar colour schemes, most notably traffic light colours, have been found to provide consumers with a quick visual cue for deciphering scientific data in previous studies [36,41,42,58].
Participants in this study confirmed that the applicability of the labelling scheme would vary across purchasing scenarios based on the level of consumer environmental awareness. Thøgersen et al. [37] pointed out that even environmentally aware consumers may not incorporate environmental impacts into impulse or timepressured purchasing decisions, particularly if the messaging is hard to decipher or identify. Uniform messaging that is easy to understand “at a glance” has the potential to mitigate this [59].
Thus, frequent exposure to an easy-to-recognise and interpret labelling scheme has the potential to create a virtuous cycle of increasing knowledge and, concomitantly, planet-conscious purchasing decisions [60].
4.2. Challenges and Opportunities
4.2.1. Use Phase Impacts
Consumer desire for the inclusion of use phase and end-of-life phase data in the environmental impact calculation was highlighted by every FG in this study. It would be impossible for manufacturers to estimate these impacts robustly, as they depend heavily on user decisions. However, participants agreed that access to further information regarding the environmental impact of product use via a website or QR code would increase engagement across consumer groups.
4.2.2. Building Consumer Capability
Participants highlighted the potential for an environmental facts labelling scheme to improve consumer understanding of the environmental impacts of their purchases and of the breadth of environmental impacts that warrant consideration. They proposed that a publicity campaign that accompanied the launch of an environmental facts labelling scheme would accelerate public awareness of the scheme and the corresponding increase in consumer knowledge. Similarly, the literature shows that the impact of ecolabels on purchasing decisions increases with increased consumer awareness and understanding [9,61] and that consistent messaging is linked to improved effectiveness [22].
Participants agreed that online tools to access more detailed information would increase consumer capability. They suggested that dedicated apps to collect and personalise environmental impact purchase data would further increase engagement with data provided by environmental facts labelling schemes and drive better purchasing decisions. Nutrition labels provide a useful parallel to further understand the potential value and challenges of disclosing environmental data on products. Nutritional Facts labels disclose consistent data in a standardised format and, unlike current ecolabels, include scientific context (recommended daily intake of each nutrient). A 2011 literature review of 120 studies on label use across the world found that self-reported use of nutrition labels use was high, with the USA at 75%, Canada at 57%, the EU at 47%, and New Zealand at 82% [62]. However, when consumer purchase patterns were assessed, the ability to understand and synthesise the data to understand overall nutrition was found to be a limitation to using these labels for healthier purchasing choices [58,63]. Other studies have signalled that only when the consumer has a good understanding of nutritional information or quantitative skills can they obtain the perceived benefits [64]. Apps such as MyFitnessPal, which aggregates the nutritional data of dietary choices over time, help consumers understand the implications of these choices and thus make better decisions [65]. An environmental facts labelling scheme would create an opportunity for similar apps that aggregate the environmental data of purchasing decisions and enhance consumer understanding of the impacts of their choices.
One participant shared that for small products, such as chocolate bars, they would not consider environmental impacts in their purchasing decisions because “they are so minor”. However, past studies suggest that chocolate has a relatively high environmental impact [66]. Therefore, this participant’s perspective highlights the opportunity for a labelling scheme to increase understanding of the relative impacts of products.
Participants were given one label that showed positive as well as negative environmental change. A few participants agreed this was valuable information; one was highly suspicious, indicating that they would see this as greenwashing, but the majority were relatively agnostic to this information. This lack of perceived value highlights the role an environmental fact labelling scheme could have in educating consumers about the need to go beyond zero impact to a point of environmental restoration and regeneration [67].
One key challenge discussed during FGs was the selection of a normalisation factor. While the “Recommended Daily Limit” tested well during the FGs, it was discussed that this was confusing for products that are used for years, such as the washing machine. There are also challenges associated with the scale of the impact. The impacts of a chocolate bar may not even register on a Recommended Annual Limit scale, but a washing machine is likely to be off the scale for a Recommended Daily Limit. Many of these challenges could be resolved with online tools, but on-product communication of this complexity warrants further consideration.
4.2.3. Barriers for Manufacturers
Participants in the study believed that an environmental facts labelling scheme had the potential to encourage manufacturers to participate and gain market advantage, but speculated that cost, poor product performance, and limited label real estate could discourage uptake.
The authors believe aligning data and methodologies underpinning environmental facts labelling scheme, such as ‘Planetary Facts’, with existing methodologies and international standards could reduce the additional cost and effort required by manufacturers to adopt these labels. Where specific data or eco-labels may be required due to regional legislation, alignment with international standards could support the uptake of an environmental facts labelling scheme as a mechanism to add contextualisation and interpretability to legislated information.
Given the complexity of the current ecolabelling landscape, the authors postulate that a singular labelling scheme across different product categories would be well received by environmentally leading manufacturers already directing substantial funds towards certifications and ecolabels without gaining a clear market advantage. If this was supported by market and/or regulatory drivers, it would increase uptake [28]. Current environmental reporting requirements by stakeholders have the potential to drive change by manufacturers in specific areas, such as greenhouse gas emissions [68]. However, our study suggests that pressure to expand beyond these select measures will come from consumers.
A label that scaled ”with’ product size and complexity, such as the most popular ‘Planetary Labels’ tested here, would help mitigate space limitations. A scheme linking physical labels to more comprehensive data online via a QR code or web address could also address this real estate challenge, with an additional benefit for manufacturers who could use this online depository as a mechanism to direct buyers to their products in the first place.
4.2.4. The Role of Retailers
Participants highlighted that retailers may become a key driver for the uptake of an environmental facts labelling scheme. Shoppers could be motivated to change their purchase behaviour if retailers provided “nudges” in-store that aligned with an education campaign [9]. If environmentally conscious shoppers were drawn to products disclosing data such as that provided by ‘Planetary Facts’, retailers may start to seek out these products, elevating market pressure and demand by increasing consumer and brand awareness of the scheme. In addition, retailers that implement strategies to aid consumer understanding of the scheme could create a positive loop, increasing the success of the labelling scheme [9,17] and further feeding into the demand for products.
Participants suggested that the ‘Planetary Facts’ label pre-concepts applied in this study may prevent some shoppers from buying products with poor environmental performance. This could further influence retailer choices regarding product selection, thus generating additional pressure on manufacturers to achieve good environmental performance.
5. Conclusions
There was a clear demand for the disclosure of environmental impact information about products to provide consumers with an informed basis for purchasing decisions and enable the adoption of more sustainable purchasing patterns. However, factors that affected whether consumers would use this information included consumer-specific factors such as their level of environmental awareness, label-specific factors such as the accessibility of the information, time factors, willingness to pay, and purchase type. The likelihood of consumers engaging with the scheme was expected to be impacted by the effectiveness of the label in conveying its message as well as consumer trust in the scheme. An aligned publicity campaign was deemed necessary to support such a scheme. Challenges that a labelling scheme would face included consumer priorities when shopping and manufacturer buy-in. However, it was expected that additional benefits would include improved manufacturing practices as well as education for retailers and the general public in environmental matters. This study was conducted with New Zealand consumers; therefore, it is recognised that further refinement of communication features as well as quantitative testing across broad cultures and demographics (within and beyond New Zealand) would further enhance the ability to inform and develop an environmental facts labelling scheme that drives change.
There is perhaps also a unique opportunity here to embrace technology and think beyond a physical label by reimagining how consumers select their purchase, interact with it, and dispose of it via access to information online. However, the challenge for consumers of how to prioritise essential versus discretionary purchases and activities and potentially live within a sustainability budget is also worth further investigation.
While this study focused on the consumer perspective, many transactions in the supply chain are ‘business to business’ indicating further studies on environmental facts labelling schemes with a business lens are warranted to complement the findings of this investigation. There is the potential for labelling across all manufacturing stages to encourage alignment of corporate practices to take into account all environmental impacts rather than select ones that only provide an incomplete message. There is the potential for market drivers to pressure manufacturers to adopt more sustainable practices, encouraging other manufacturers to do the same, and driving innovation and improvements across manufacturing sectors.
Author Contributions
Conceptualization, K.M. and J.H.; methodology, C.H., K.M. and J.H.; validation, C.H., K.M., G.R.-C. and J.H.; formal analysis, C.H., K.M. and J.H.; investigation, C.H. and J.H.; resources, J.H.; data curation, C.H. and J.H.; writing—original draft preparation, C.H.; writing—review and editing, C.H., K.M., G.R.-C., J.P.H. and J.H.; supervision, K.M. and J.H.; project administration, C.H., K.M. and J.H.; funding acquisition, K.M. and J.H. All authors have read and agreed to the published version of the manuscript.
Funding
This research was funded by the Riddet Institute under grant number RM23455.
Institutional Review Board Statement
The study was assessed and considered low-risk following the Massey University Human Ethics Committee process (Human Ethics Notification Number 4000025094).
Informed Consent Statement
All participants provided written informed consent prior to taking part in the study.
Data Availability Statement
Data sharing is not permitted by the research ethics committee that approved this study.
Acknowledgments
The authors would like to acknowledge Ellie Chia and Rosie Linklater for their support in running the focus groups and Rachel Dance (Beca Ltd.) for artwork and graphic design.
Conflicts of Interest
Although Catriona Hay and Jeremy P. Hill work with Fonterra Co-operative Group Ltd., this article has no conflict of interest with this company. Kate Meyer and Gabriella Rutherford-Carr work at the not-for-profit Planetary Accounting Network, which is leading an initiative to encourage businesses to disclose Planetary Facts onabout their products. Kate Meyer is also a director at Planetary Insights Ltd which digitises Planetary Facts assessments.
Appendix A
Table A1.
Participant group mean score to environmental lifestyle choice statements incorporated into the recruitment questionnaire (1 = strongly disagree to 7 = strongly agree).
Table A1.
Participant group mean score to environmental lifestyle choice statements incorporated into the recruitment questionnaire (1 = strongly disagree to 7 = strongly agree).
| Environmental Lifestyle Choice Questions | Novice (n = 11) | Aware (n = 10) |
|---|---|---|
| I perceive my lifestyle to be environmentally sustainable | 4.1 | 5.7 |
| I consider environmentally sustainable options in my consumer choices | 4.8 | 5.8 |
| I eat less meat because I believe it helps the sustainability of the environment | 4.4 | 5.0 |
| I actively avoid wasting food | 5.9 | 6.9 |
| I take public transport, carpool, cycle or walk to work | 4.1 | 5.5 |
| I often buy seasonal products | 5.9 | 6.2 |
| I often buy local products | 5.1 | 6.1 |
| I recycle glass, paper and/or plastic | 6.5 | 6.8 |
| I avoid products with imported ingredients | 3.5 | 4.1 |
Appendix B

Figure A1.
Word clouds displaying the collective one- or two-word responses to the question “which of your consumer purchase decisions are influenced by environmental impacts” by (a,b) Aware and (c,d) Novice participants in Stage 2 focus groups.
Figure A1.
Word clouds displaying the collective one- or two-word responses to the question “which of your consumer purchase decisions are influenced by environmental impacts” by (a,b) Aware and (c,d) Novice participants in Stage 2 focus groups.
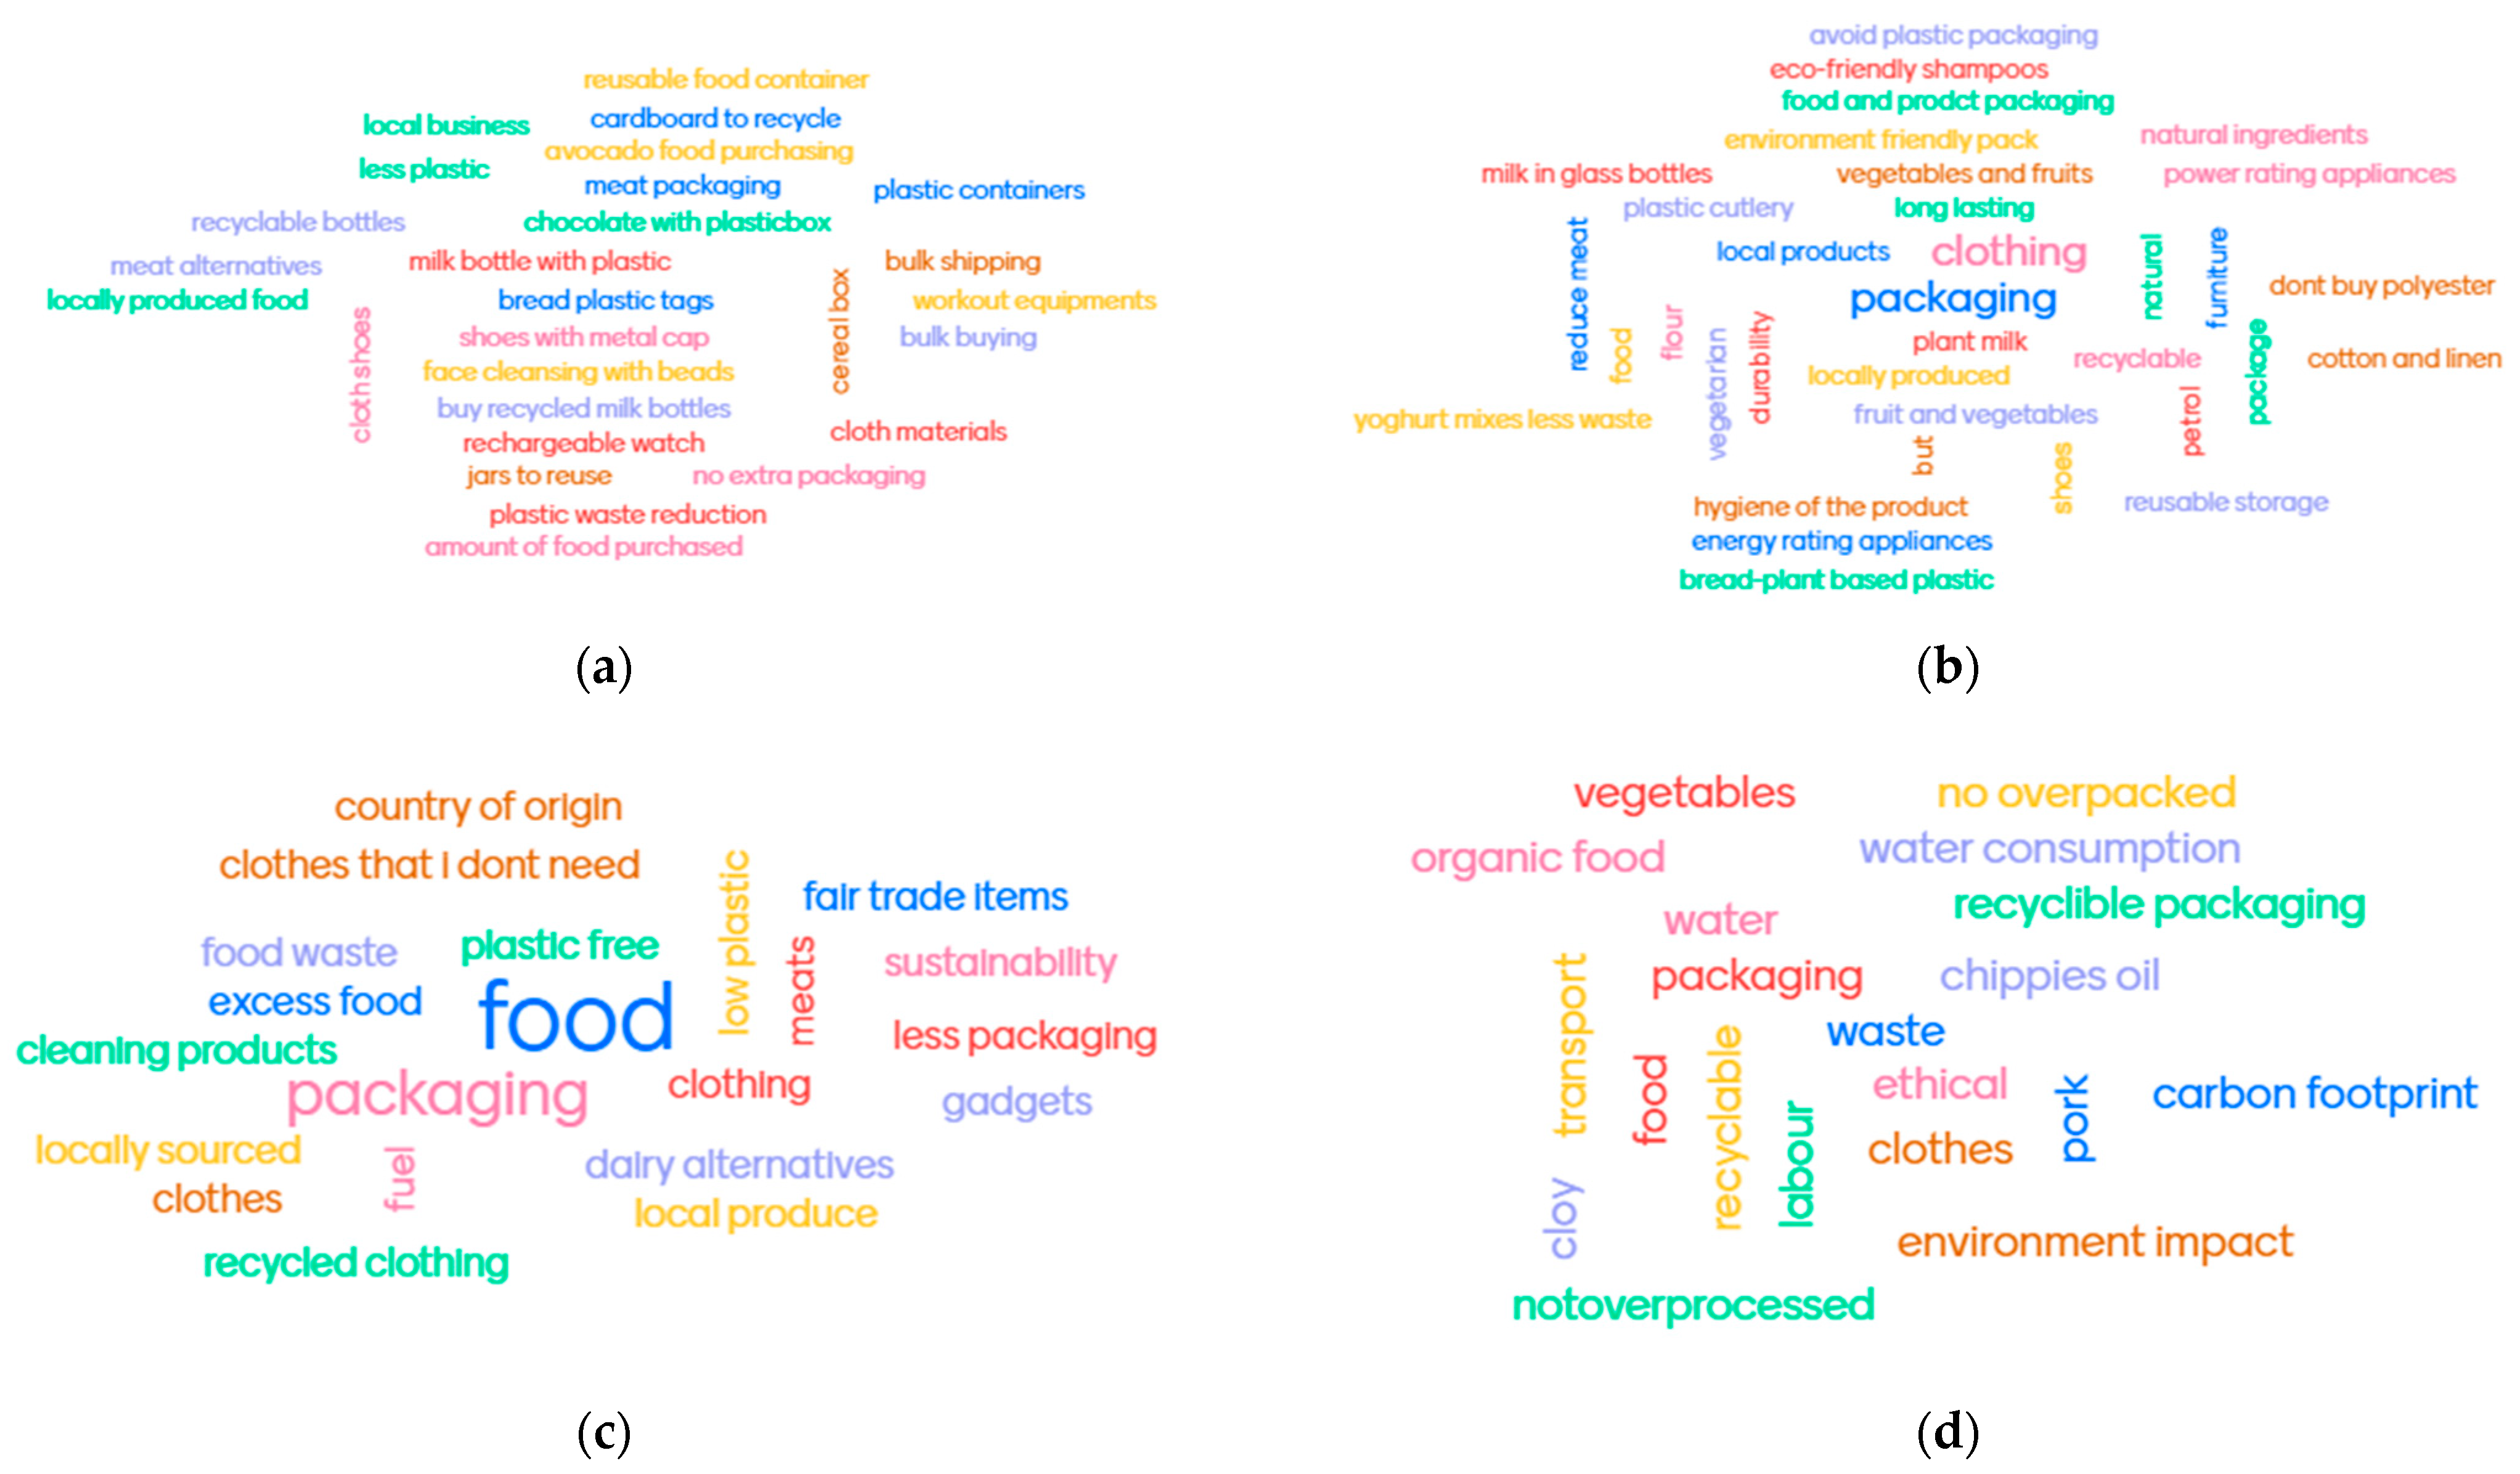
References
- Meyer, K.; Newman, P. The Planetary Accounting Framework: A novel, quota-based approach to understanding the impacts of any scale of human activity in the context of the Planetary Boundaries. Sustain. Earth 2018, 1, 4. [Google Scholar] [CrossRef]
- Rockström, J.; Steffen, W.; Noone, K.; Persson, A.; Chapin, F.S., III; Lambin, E.F.; Lenton, T.M.; Scheffer, M.; Folke, C.; Schellnhuber, H.J.; et al. A safe operating space for humanity. Nature 2009, 461, 472–475. [Google Scholar] [CrossRef] [PubMed]
- Steffen, W.; Richardson, K.; Rockstrom, J.; Cornell, S.E.; Fetzer, I.; Bennett, E.M.; Biggs, R.; Carpenter, S.R.; de Vries, W.; de Wit, C.A.; et al. Sustainability. Planetary boundaries: Guiding human development on a changing planet. Science 2015, 347, 1259855. [Google Scholar] [CrossRef]
- Richardson, K.; Steffen, W.; Lucht, W.; Bendtsen, J.; Cornell, S.E.; Donges, J.F.; Drüke, M.; Fetzer, I.; Bala, G.; von Bloh, W.; et al. Earth beyond six of nine planetary boundaries. Sci. Adv. 2023, 9, eadh2458. [Google Scholar] [CrossRef]
- Ivanova, D.; Stadler, K.; Steen-Olsen, K.; Wood, R.; Vita, G.; Tukker, A.; Hertwich, E.G. Environmental Impact Assessment of Household Consumption. J. Ind. Ecol. 2016, 20, 526–536. [Google Scholar] [CrossRef]
- Joshi, Y.; Rahman, Z. Factors Affecting Green Purchase Behaviour and Future Research Directions. Int. Strateg. Manag. Rev. 2015, 3, 128–143. [Google Scholar] [CrossRef]
- Yokessa, M.; Marette, S. A Review of Eco-labels and their Economic Impact. Int. Rev. Environ. Resour. Econ. 2019, 13, 119–163. [Google Scholar] [CrossRef]
- Elhoushy, S.; Jang, S. How to maintain sustainable consumer behaviours: A systematic review and future research agenda. Int. J. Consum. Stud. 2023, 47, 2181–2211. [Google Scholar] [CrossRef]
- Potter, C.; Bastounis, A.; Hartmann-Boyce, J.; Stewart, C.; Frie, K.; Tudor, K.; Bianchi, F.; Cartwright, E.; Cook, B.; Rayner, M.; et al. The Effects of Environmental Sustainability Labels on Selection, Purchase, and Consumption of Food and Drink Products: A Systematic Review. Environ. Behav. 2021, 53, 891–925. [Google Scholar] [CrossRef]
- Haller, K.; Lee, J.; Cheung, J. Meet the 2020 Consumers Driving Change; IBM Institute for Business Value: Armonk, NY, USA, 2020. [Google Scholar]
- Rogers, K. EY Future Counsumer Index: When Talk Turns into Action, Be Set for Change; EY: London, UK, 2023; Available online: https://www.ey.com/en_nz/consumer-products-retail/when-talk-turns-into-action-be-set-for-change (accessed on 13 September 2023).
- Sustainability Reporting in Focus: Examining 2021 Trends of Companies on the S & P 500 + Russell 1000; Governance & Accountability Institute, Inc.: New York, NY, USA, 2022.
- Shoemaker, B. Microsoft Takes Another Key Step to Reduce Data Centre Emissions in ANZ. Available online: https://news.microsoft.com/en-au/features/microsoft-takes-another-key-step-to-reduce-data-centre-emissions-in-anz/ (accessed on 13 September 2023).
- Roxburgh, T. Steamer Turns 110, Fuel Change Ahead. Available online: https://www.odt.co.nz/regions/queenstown/steamer-turns-110-fuel-change-ahead (accessed on 13 September 2023).
- Meis-Harris, J.; Klemm, C.; Kaufman, S.; Curtis, J.; Borg, K.; Bragge, P. What is the role of eco-labels for a circular economy? A rapid review of the literature. J. Clean. Prod. 2021, 306, 127134. [Google Scholar] [CrossRef]
- Langer, A.; Eisend, M.; Ku, A. The impact of eco-labels on consumers Less information more confusion? Eur. Adv. Consum. Res. 2007, 8, 338–339. [Google Scholar]
- Nilsson, H.; Tunçer, B.; Thidell, Å. The use of eco-labeling like initiatives on food products to promote quality assurance—Is there enough credibility? J. Clean. Prod. 2004, 12, 517–526. [Google Scholar] [CrossRef]
- Duckworth, J.J.; Randle, M.; McGale, L.S.; Jones, A.; Doherty, B.; Halford, J.C.G.; Christiansen, P. Do front-of-pack ‘green labels’ increase sustainable food choice and willingness-to-pay in U.K. consumers? J. Clean. Prod. 2022, 371, 133466. [Google Scholar] [CrossRef]
- Brown, K.A.; Harris, F.; Potter, C.; Knai, C. The future of environmental sustainability labelling on food products. Lancet Planet Health 2020, 4, e137–e138. [Google Scholar] [CrossRef] [PubMed]
- Hameed, I.; Waris, I. Eco Labels and Eco Conscious Consumer Behavior: The Mediating Effect of Green Trust and Environmental Concern. J. Manag. Sci. 2018, 5, 86–105. [Google Scholar] [CrossRef]
- Taufique, K.; Polonsky, M.J.; Vocino, A.; Siwar, C. Measuring consumer understanding and perception of eco-labelling: Item selection and scale validation. Int. J. Consum. Stud. 2019, 43, 298–314. [Google Scholar] [CrossRef]
- Gossen, M.; Jäger, S.; Hoffmann, M.L.; Bießmann, F.; Korenke, R.; Santarius, T. Nudging Sustainable Consumption: A Large-Scale Data Analysis of Sustainability Labels for Fashion in German Online Retail. Front. Sustain. 2022, 3, 922984. [Google Scholar] [CrossRef]
- Colmar Brunton and Sustainable Business Council. Better Futures 2021: Monitoring the Issues New Zealanders Care Most Deeply About. Kantar: London, UK, 2021. Available online: https://www.kantarnewzealand.com/wp-content/uploads/2019/05/Better-Futures-Report-2021.pdf (accessed on 14 August 2023).
- Ecolabel Index; Big Room Inc.: Vancouver, Canada; Available online: https://www.ecolabelindex.com/ecolabels/ (accessed on 11 August 2023).
- Gosselt, J.F.; van Rompay, T.; Haske, L. Won’t Get Fooled Again: The Effects of Internal and External CSR ECO-Labeling. J. Bus. Ethics 2017, 155, 413–424. [Google Scholar] [CrossRef]
- Nes, K.; Antonioli, F.; Ciaian, P. Trends in sustainability claims and labels for newly introduced food products across selectedEuropean countries. Agribusiness 2023, 40, 371–390. [Google Scholar] [CrossRef]
- Policarpo, M.C.; Apaolaza, V.; Hartmann, P.; Paredes, M.R.; D’Souza, C. Social cynicism, greenwashing, and trust in green clothing brands. Int. J. Consum. Stud. 2023, 47, 1950–1961. [Google Scholar] [CrossRef]
- Iraldo, F.; Griesshammer, R.; Kahlenborn, W. The future of ecolabels. Int. J. Life Cycle Assess. 2020, 25, 833–839. [Google Scholar] [CrossRef]
- Abushanab, A.; Alnahhal, W. Life cycle cost analysis of sustainable reinforced concrete buildings with treated wastewater, recycled concrete aggregates, and fly ash. Results Eng. 2023, 20, 101565. [Google Scholar] [CrossRef]
- Taufique, K.; Siwar, C.; Talib, B.; Sarah, F.; Chamhuri, N. Synthesis of Constructs for Modeling Consumers’ Understanding and Perception of Eco-Labels. Sustainability 2014, 6, 2176–2200. [Google Scholar] [CrossRef]
- Prieto-Sandoval, V.; Alfaro, J.A.; Mejía-Villa, A.; Ormazabal, M. ECO-labels as a multidimensional research topic: Trends and opportunities. J. Clean. Prod. 2016, 135, 806–818. [Google Scholar] [CrossRef]
- Rutherford-Carr, G.; Meyer, K. The Value of ‘Planetary Facts’ science-based product data and disclosures beyond carbon. Policy Q. 2023, 19, 19–28. [Google Scholar] [CrossRef]
- Watkins, L.; Aitken, R.; Robertson, K.; Thyne, M.; Williams, J.; van Kerkhof, R. Challenge, Constraint and Commitment to Change: A New Zealand Consumer Lifestyles Study; University of Otago, Lifestyles Research Group: Otago, New Zealand, 2020; Available online: http://www.otago.ac.nz/marketing/reserach/lifestyles (accessed on 14 November 2023).
- Sustainability Claims Impact on Consumer Purchases; William Reed Ltd.: Crawley, UK, 2023; Available online: https://www.foodnavigator.com/Product-innovations/Sustainability-Claims-Impact-on-Consumer-Purchases (accessed on 14 November 2023).
- Lagomarsino, M.; Lemarié, L. Hope for the environment: Influence of goal and temporal focus of emotions on behavior. Int. J. Consum. Stud. 2024, 48, e13020. [Google Scholar] [CrossRef]
- Stampa, E.; Zander, K. Backing biodiversity? German consumers’ views on a multi-level biodiversity-labeling scheme for beef from grazing-based production systems. J. Clean. Prod. 2022, 370, 133471. [Google Scholar] [CrossRef]
- Thøgersen, J.; Haugaard, P.; Olesen, A. Consumer responses to ecolabels. Eur. J. Mark. 2010, 44, 1787–1810. [Google Scholar] [CrossRef]
- Horne, R.E. Limits to labels: The role of eco-labels in the assessment of product sustainability and routes to sustainable consumption. Int. J. Consum. Stud. 2009, 33, 175–182. [Google Scholar] [CrossRef]
- Emberger-Klein, A.; Menrad, K. The effect of information provision on supermarket consumers’ use of and preferences for carbon labels in Germany. J. Clean. Prod. 2018, 172, 253–263. [Google Scholar] [CrossRef]
- Feucht, Y.; Zander, K. Consumers’ preferences for carbon labels and the underlying reasoning. A mixed methods approach in 6 European countries. J. Clean. Prod. 2018, 178, 740–748. [Google Scholar] [CrossRef]
- Meyerding, S.; Schaffmann, A.-L.; Lehberger, M. Consumer Preferences for Different Designs of Carbon Footprint Labelling on Tomatoes in Germany—Does Design Matter? Sustainability 2019, 11, 1587. [Google Scholar] [CrossRef]
- Vlaeminck, P.; Jiang, T.; Vranken, L. Food labeling and eco-friendly consumption: Experimental evidence from a Belgian supermarket. Ecol. Econ. 2014, 108, 180–190. [Google Scholar] [CrossRef]
- Sirieix, L.; Delanchy, M.; Remaud, H.; Zepeda, L.; Gurviez, P. Consumers’ perceptions of individual and combined sustainable food labels: A UK pilot investigation. Int. J. Consum. Stud. 2013, 37, 143–151. [Google Scholar] [CrossRef]
- Ares, G.; Varela, P. Consumer-Based Methodologies for Sensory Characterization. In Methods in Consumer Research, Volume 1: New Approaches to Classic Methods; Woodhead Publishing: Sawston, UK, 2018. [Google Scholar]
- Byrne, D. A worked example of Braun and Clarke’s approach to reflexive thematic analysis. Qual. Quant. 2021, 56, 1391–1412. [Google Scholar] [CrossRef]
- Torma, G.; Thøgersen, J. A systematic literature review on meta sustainability labeling—What do we (not) know? J. Clean. Prod. 2021, 293, 126194. [Google Scholar] [CrossRef]
- Gutierrez, A.; Thornton, T. Can Consumers Understand Sustainability through Seafood Eco-Labels? A U.S. and UK Case Study. Sustainability 2014, 6, 8195–8217. [Google Scholar] [CrossRef]
- Eldesouky, A.; Mesias, F.J.; Escribano, M. Perception of Spanish consumers towards environmentally friendly labelling in food. Int. J. Consum. Stud. 2020, 44, 64–76. [Google Scholar] [CrossRef]
- Cerri, J.; Testa, F.; Rizzi, F. The more I care, the less I will listen to you: How information, environmental concern and ethical production influence consumers’ attitudes and the purchasing of sustainable products. J. Clean. Prod. 2018, 175, 343–353. [Google Scholar] [CrossRef]
- de Freitas Netto, S.V.; Sobral, M.F.F.; Ribeiro, A.R.B.; Soares, G.R.D.L. Concepts and forms of greenwashing: A systematic review. Environ. Sci. Eur. 2020, 32, 19. [Google Scholar] [CrossRef]
- Delmas, M.A.; Burbano, V.C. The Drivers of Greenwashing. Calif. Manag. Rev. 2011, 54, 64–87. [Google Scholar] [CrossRef]
- Galarraga Gallastegui, I. The use of eco-labels: A review of the literature. Eur. Environ. 2002, 12, 316–331. [Google Scholar] [CrossRef]
- Gorton, M.; Tocco, B.; Yeh, C.-H.; Hartmann, M. What determines consumers’ use of eco-labels? Taking a close look at label trust. Ecol. Econ. 2021, 189, 107173. [Google Scholar] [CrossRef]
- Cologna, V.; Berthold, A.; Siegrist, M. Knowledge, perceived potential and trust as determinants of low- and high-impact pro-environmental behaviours. J. Environ. Psychol. 2022, 79, 101741. [Google Scholar] [CrossRef]
- Elsen, M.; van Giesen, R.; van den Akker, K.; Dunne, A. Consumer testing of alternatives for communicating the Environmental Footprint profile of products. Final Rep. Eur. Comm. 2019. Available online: https://www.nogreenwashing.cz/wp-content/uploads/2022/03/Consumer-testing-alternatives-PEF-2019.pdf (accessed on 14 November 2023).
- Dihr, M.; Berthold, A.; Siegrist, M.; Sütterlin, B. Consumers’ knowledge gain through a cross-category environmental label. J. Clean. Prod. 2021, 319, 128688. [Google Scholar] [CrossRef]
- Lehner, M.; Mont, O.; Heiskanen, E. Nudging—A promising tool for sustainable consumption behaviour? J. Clean. Prod. 2016, 134, 166–177. [Google Scholar] [CrossRef]
- Cecchini, M.; Warin, L. Impact of food labelling systems on food choices and eating behaviours: A systematic review and meta-analysis of randomized studies. Obes. Rev. 2016, 17, 201–210. [Google Scholar] [CrossRef]
- Perrini, F.; Castaldo, S.; Misani, N.; Tencati, A. The impact of corporate social responsibility associations on trust in organic products marketed by mainstream retailers: A study of Italian consumers. Bus. Strategy Environ. 2010, 19, 512–526. [Google Scholar] [CrossRef]
- Darnall, N.; Aragón-Correa, J.A. Can Ecolabels Influence Firms’ Sustainability Strategy and Stakeholder Behavior? Organ. Environ. 2014, 27, 319–327. [Google Scholar] [CrossRef]
- Grunert, K.G.; Hieke, S.; Wills, J. Sustainability labels on food products: Consumer motivation, understanding and use. Food Policy 2014, 44, 177–189. [Google Scholar] [CrossRef]
- Campos, S.; Doxey, J.; Hammond, D. Nutrition labels on pre-packaged foods: A systematic review. Public Health Nutr. 2011, 14, 1496–1506. [Google Scholar] [CrossRef] [PubMed]
- Croker, H.; Packer, J.; Russell, S.J.; Stansfield, C.; Viner, R.M. Front of pack nutritional labelling schemes: A systematic review and meta-analysis of recent evidence relating to objectively measured consumption and purchasing. J. Hum. Nutr. Diet. 2020, 33, 518–537. [Google Scholar] [CrossRef] [PubMed]
- Gracia, A.; Loureiro, M.; Nayga, R.M. Do consumers perceive benefits from the implementation of a EU mandatory nutritional labelling program? Food Policy 2007, 32, 160–174. [Google Scholar] [CrossRef]
- Braz, V.N.; Moraes Lopes, M.H.B. Evaluation of mobile applications related to nutrition. Public Health Nutr. 2019, 22, 1209–1214. [Google Scholar] [CrossRef]
- Hosseinzadeh-Bandbafha, H.; Kiehbadroudinezhad, M. Environmental Impacts of Chocolate Production and Consumption. In Trends in Sustainable Chocolate Production; Galanakis, C.M., Ed.; Springer: New York, NY, USA, 2022; Volume 1, pp. 229–258. [Google Scholar]
- McDonough, W.; Braungart, M. The Upcycle: Beyond Sustainability—Designing for Abundance; Macmillan: New York, NY, USA, 2013. [Google Scholar]
- 978-1-56973-772-9; Greenhouse Gas Protocol: Corporate Value Chain Accounting Reporting Standard. World Resources Institute and World Business Council for Sustainable Development: Washington, DC, USA, 2011. Available online: https://www.wri.org/research/greenhouse-gas-protocol-corporate-value-chain-scope-3-accounting-and-reporting-standard (accessed on 14 November 2023).
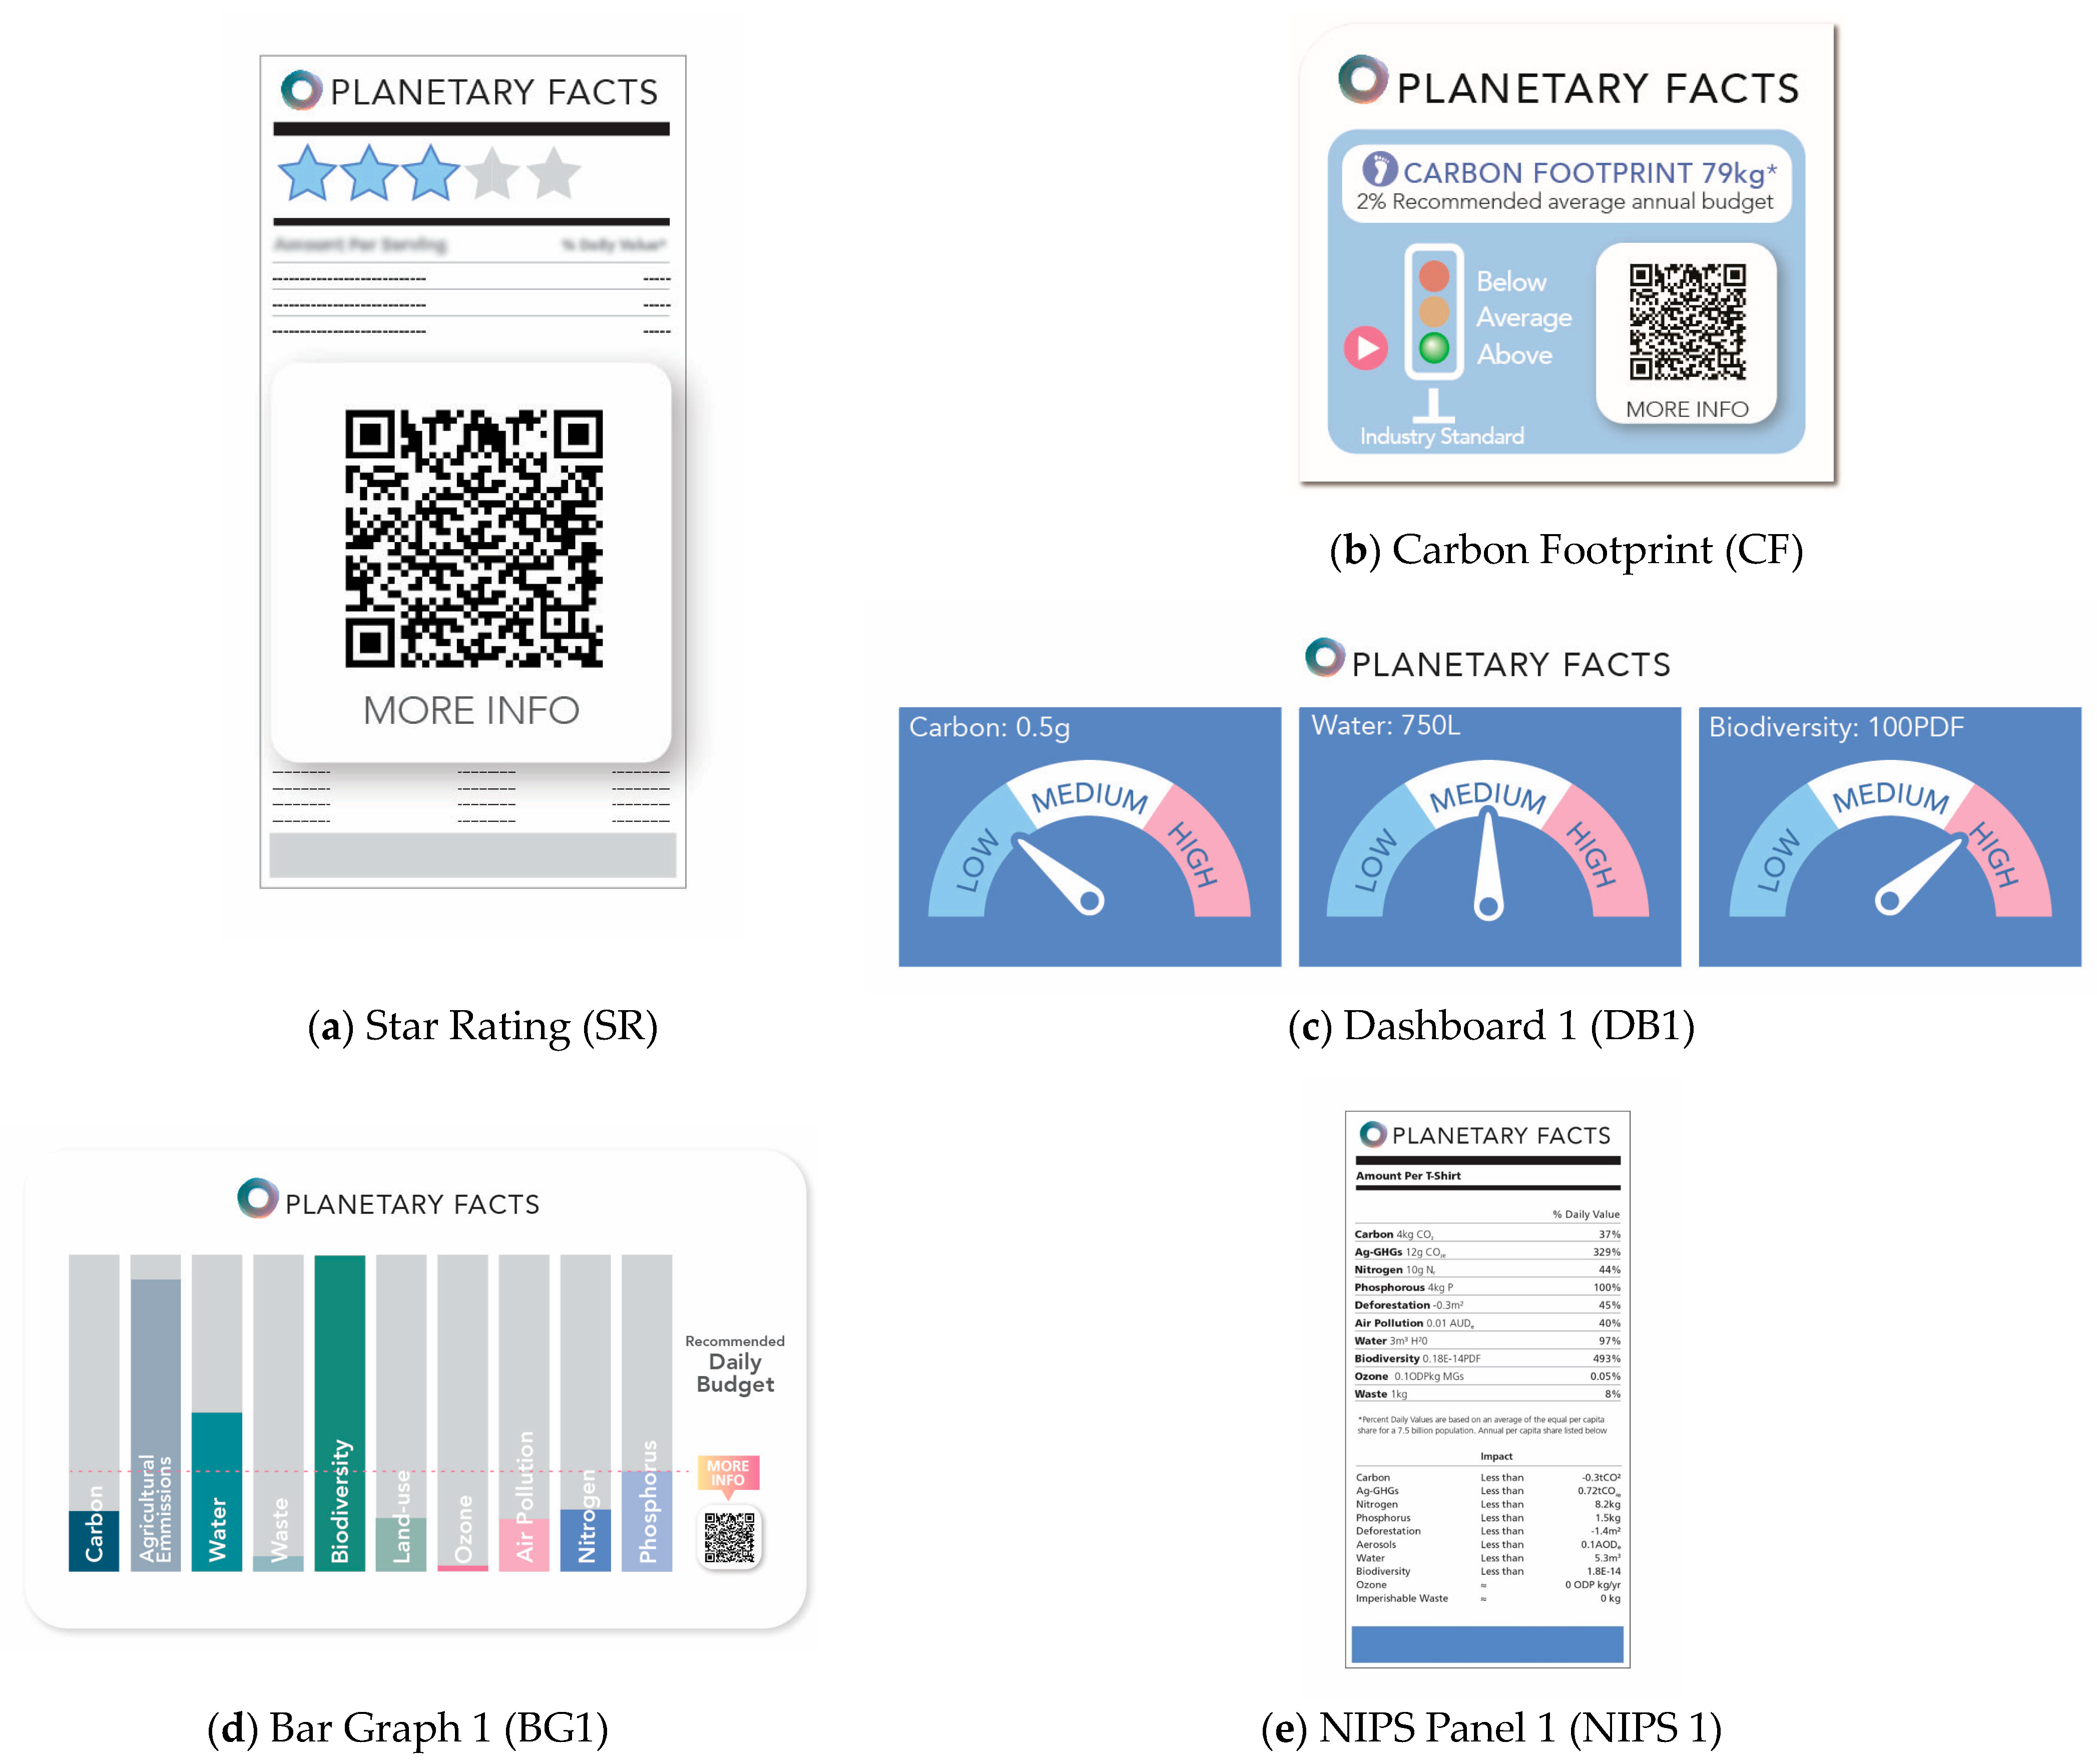
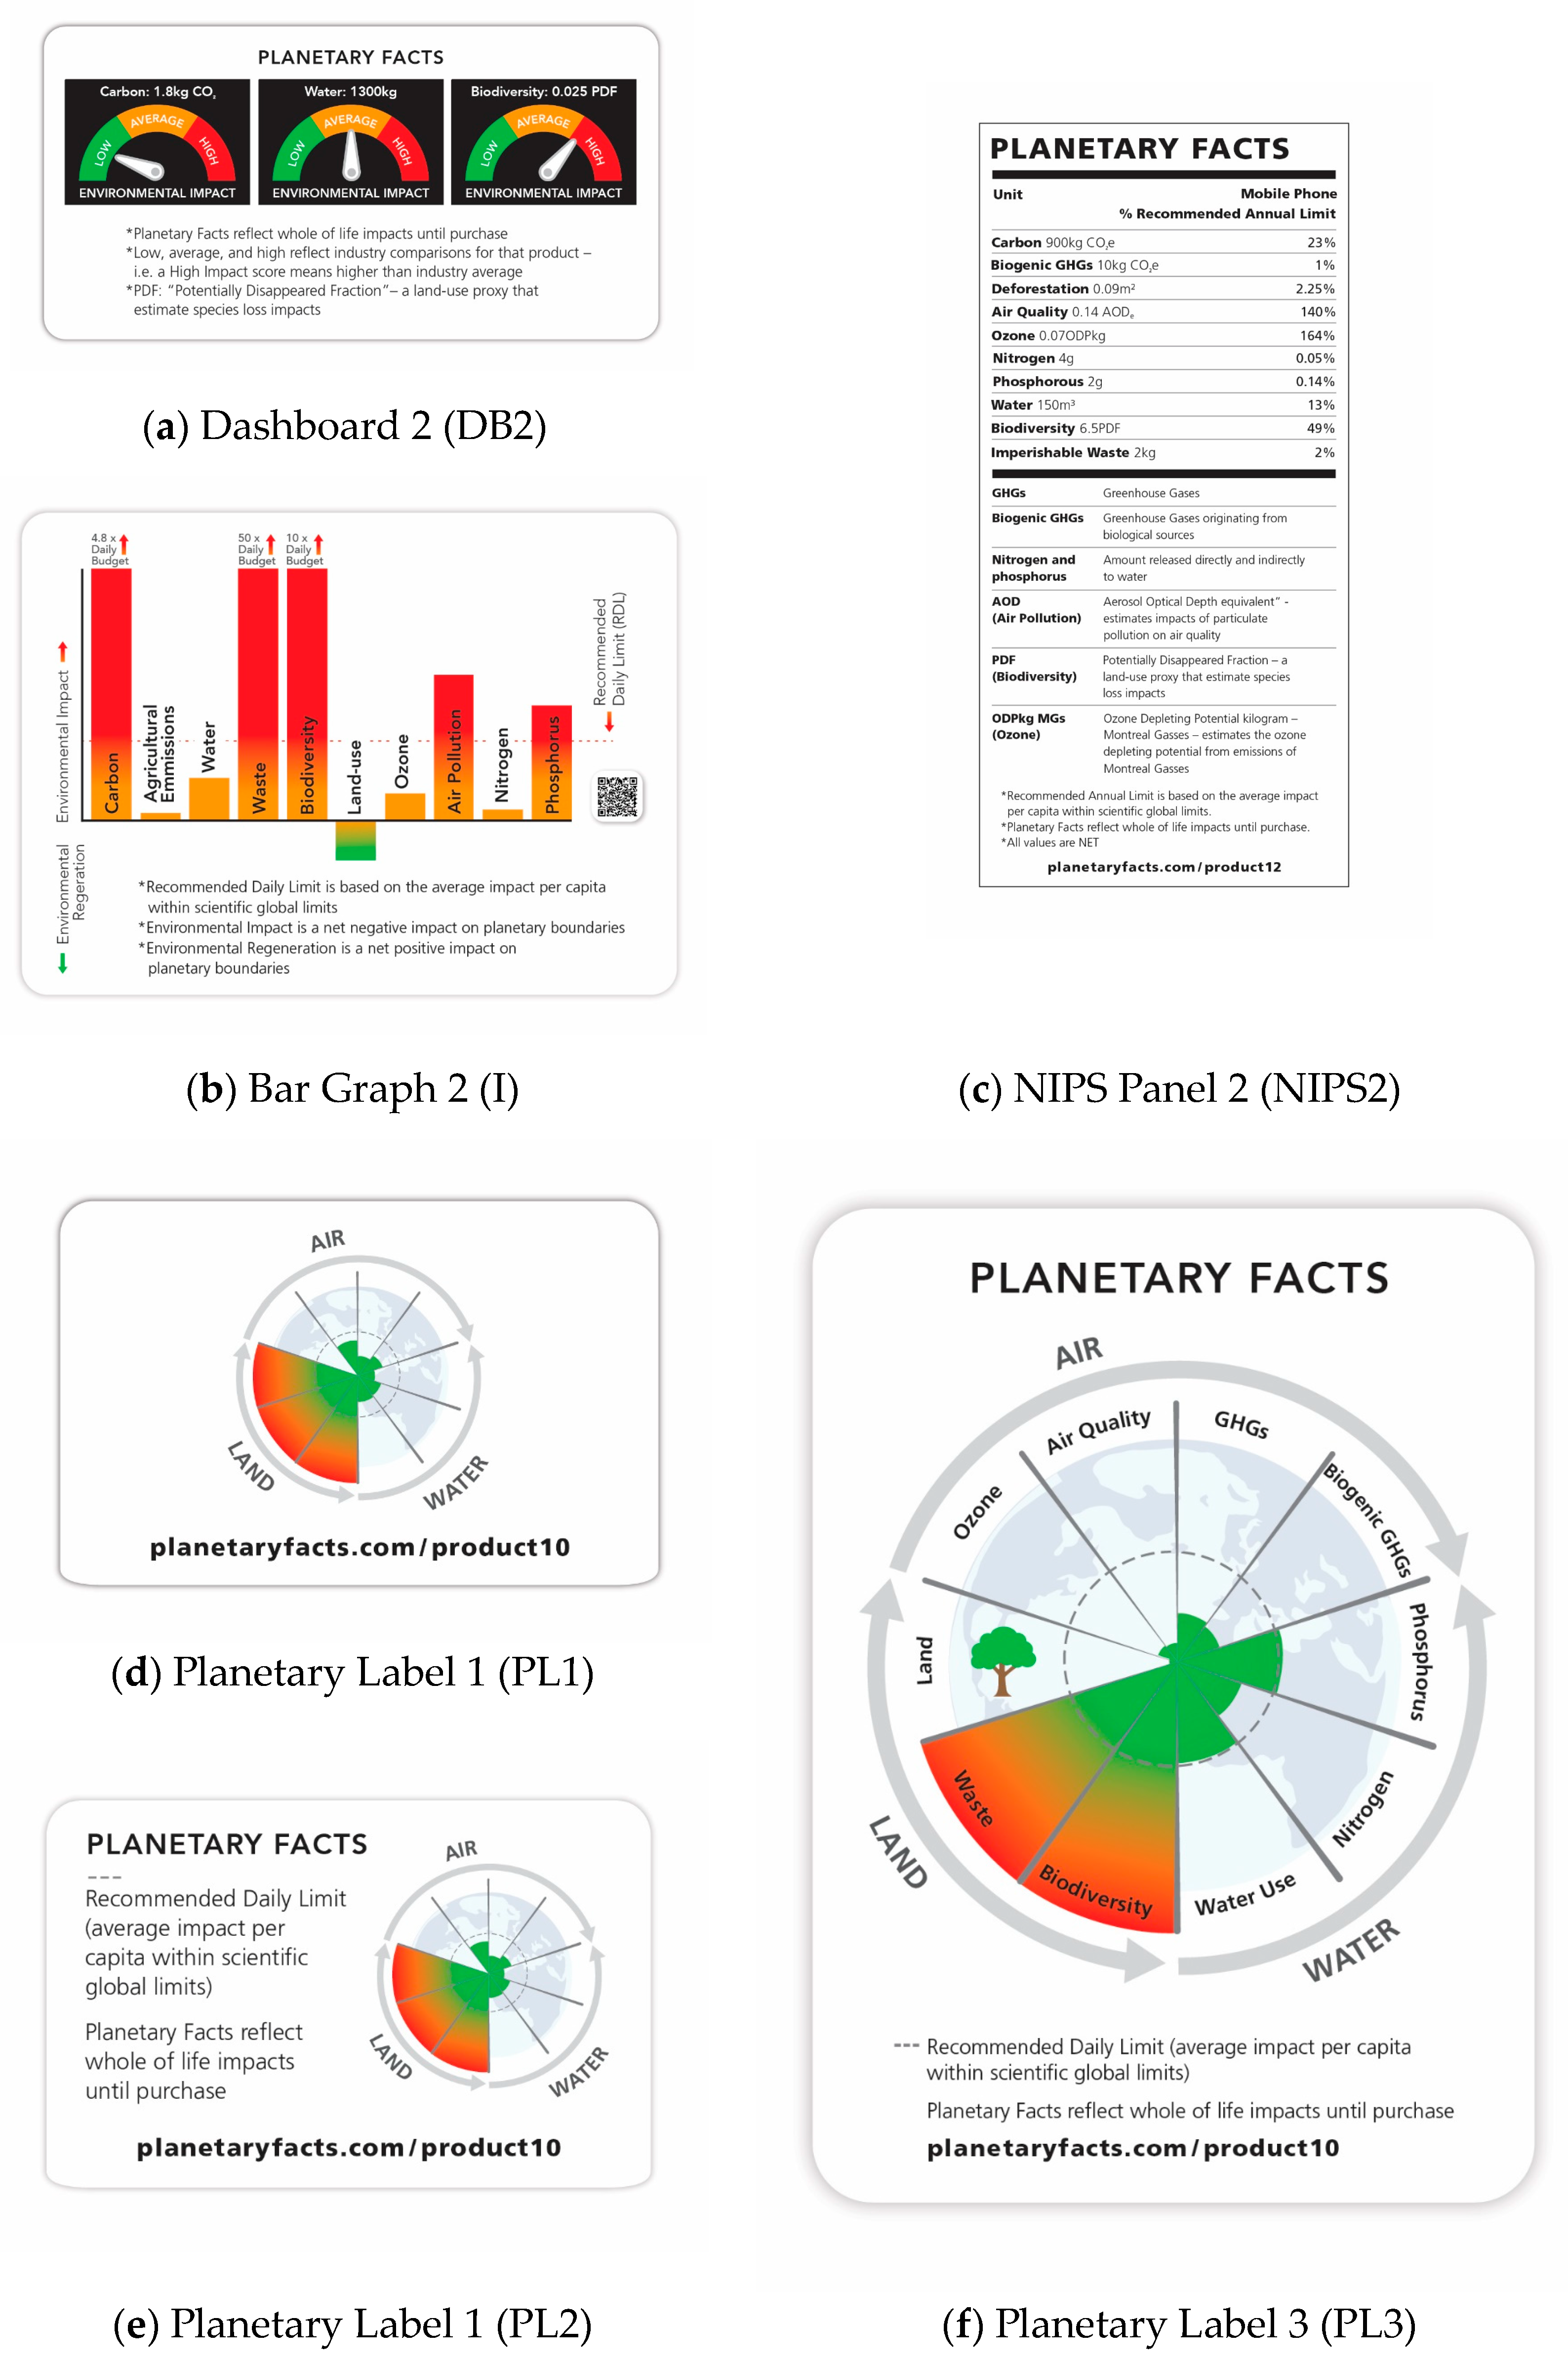
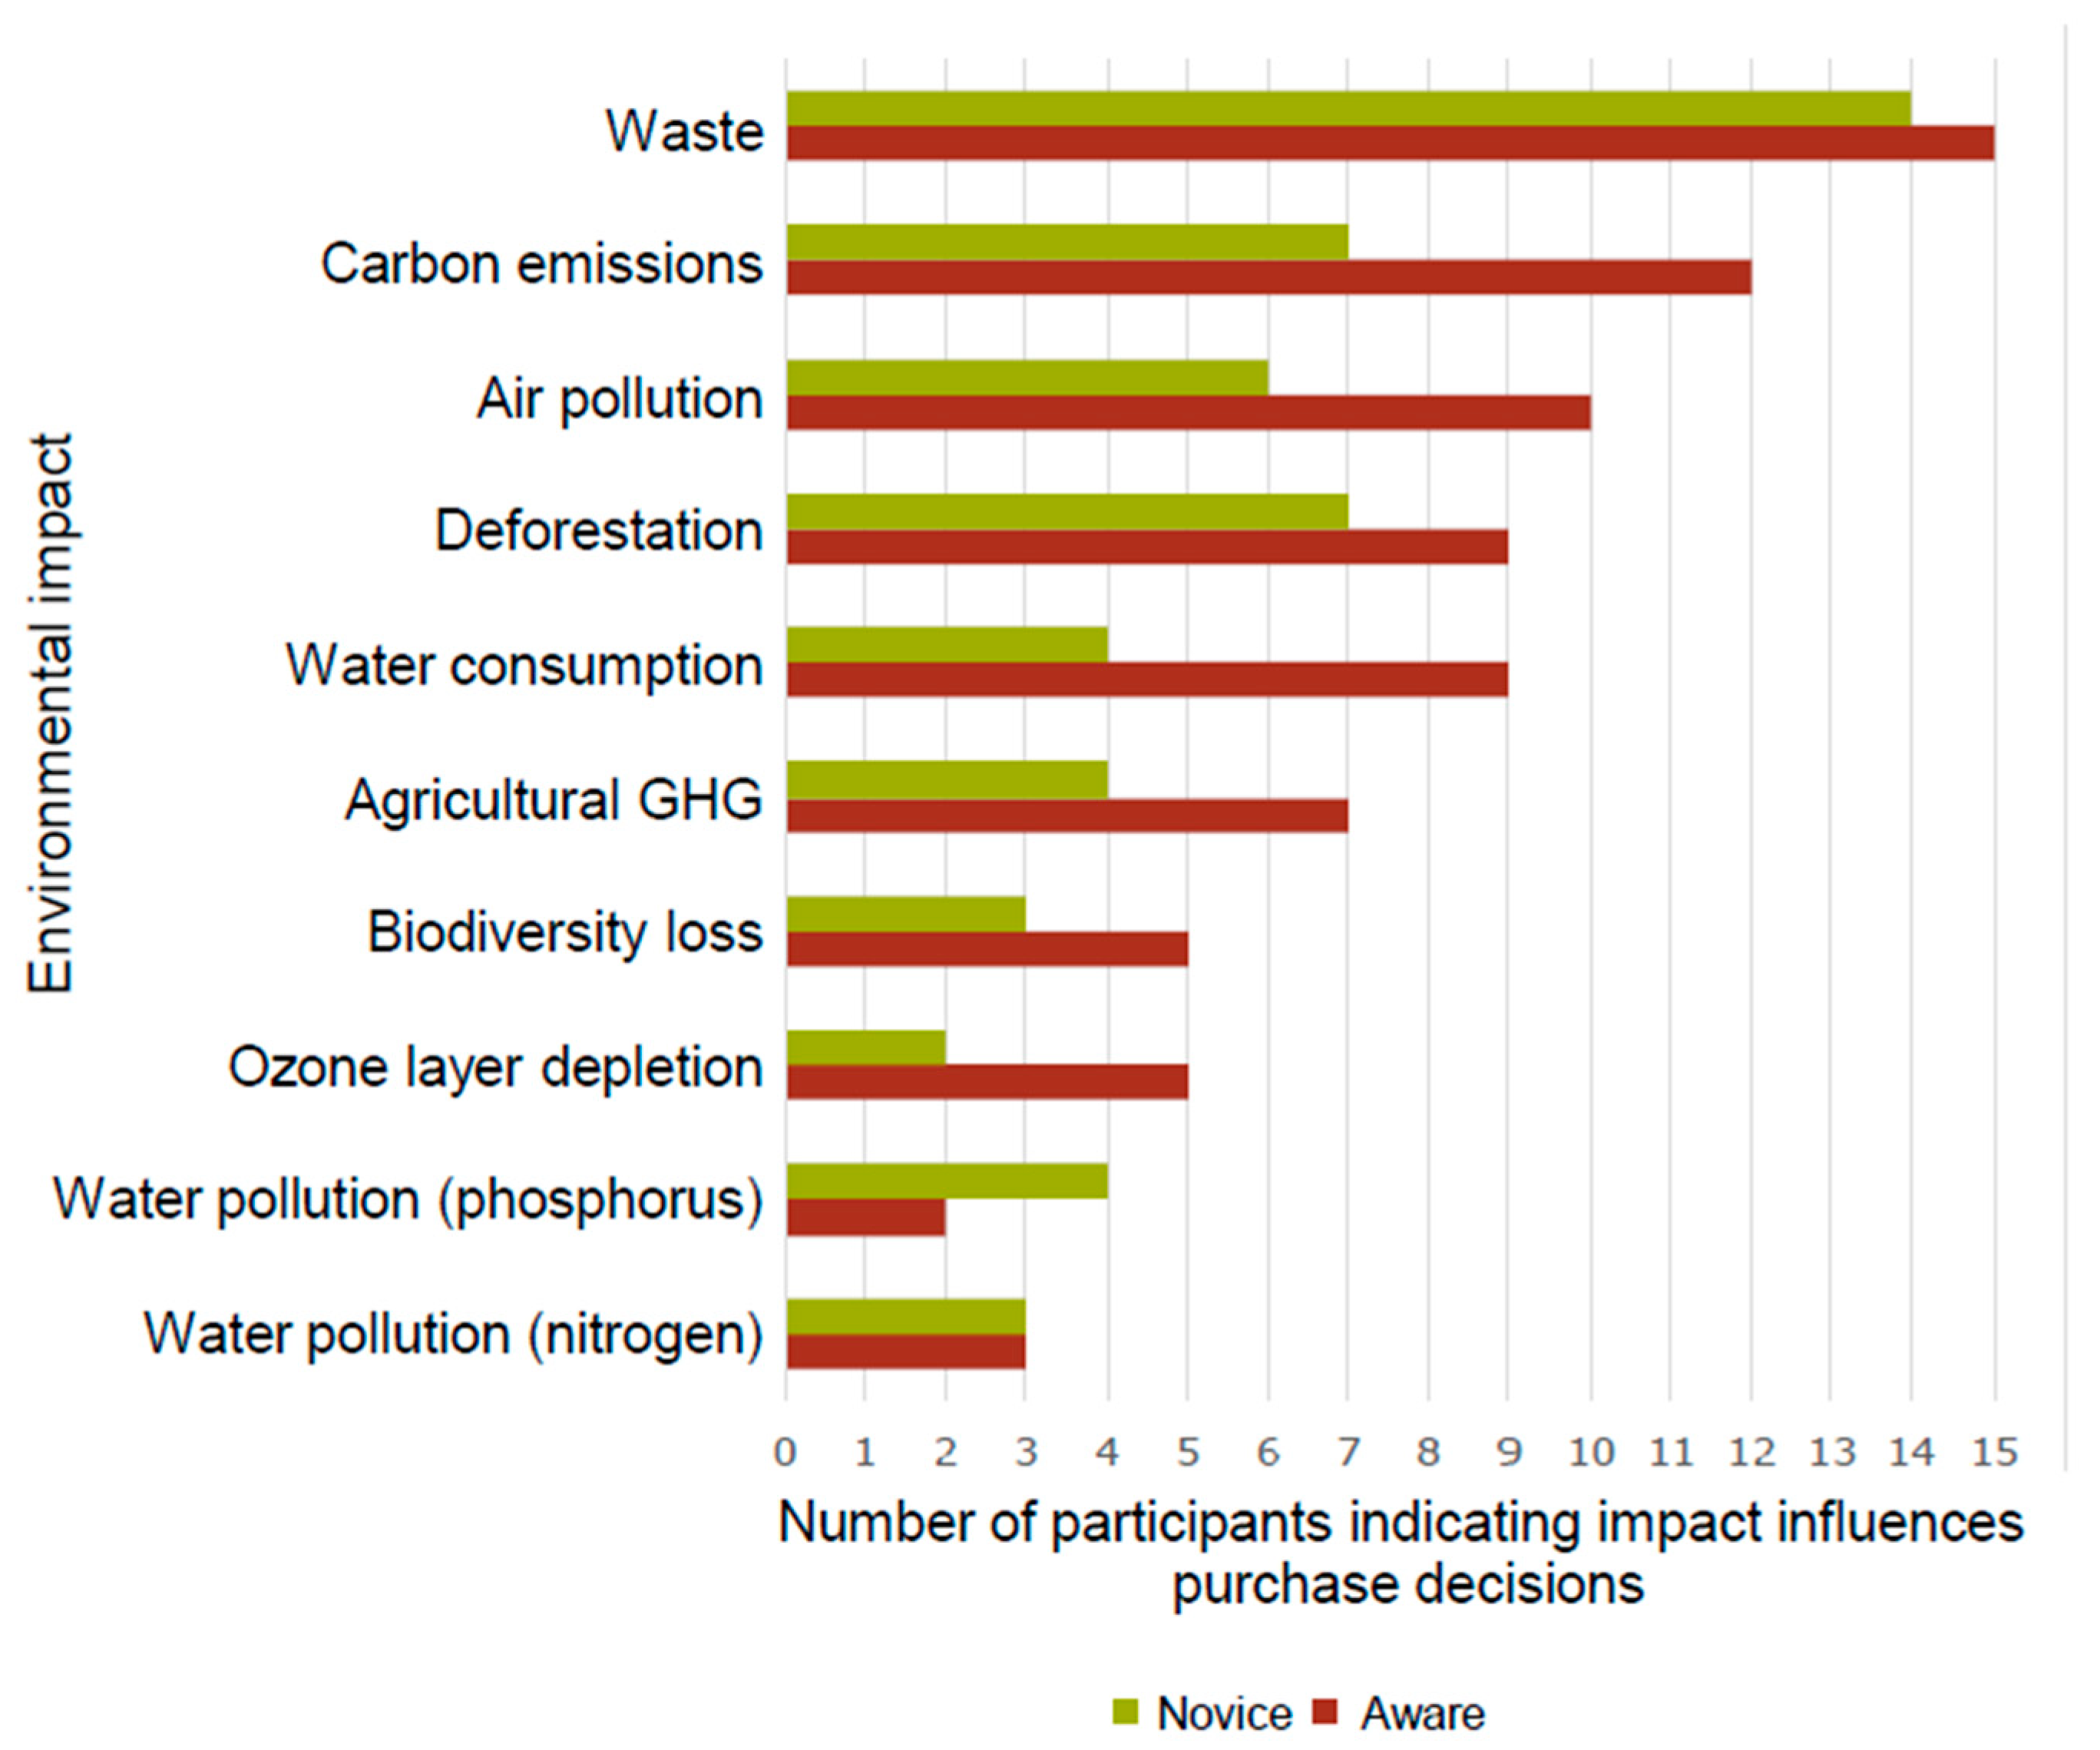


Disclaimer/Publisher’s Note: The statements, opinions and data contained in all publications are solely those of the individual author(s) and contributor(s) and not of MDPI and/or the editor(s). MDPI and/or the editor(s) disclaim responsibility for any injury to people or property resulting from any ideas, methods, instructions or products referred to in the content. |
© 2024 by the authors. Licensee MDPI, Basel, Switzerland. This article is an open access article distributed under the terms and conditions of the Creative Commons Attribution (CC BY) license (https://creativecommons.org/licenses/by/4.0/).