Article

Effects of Gamma-Synthesized Chitosan on Morphological, Thermal, Mechanical, and Heavy-Metal Removal Properties in Natural Rubber Foam as Sustainable and Eco-Friendly Heavy Metal Sorbents

by
Thitiwan Intha
1,2,
Ekachai Wimolmala
3,
Pattra Lertsarawut
4 and
Kiadtisak Saenboonruang
1,2,5,*
1
Department of Applied Radiation and Isotopes, Faculty of Science, Kasetsart University, Bangkok 10900, Thailand
2
Special Research Unit of Radiation Technology for Advanced Materials (RTAM), Faculty of Science, Kasetsart University, Bangkok 10900, Thailand
3
Polymer PROcessing and Flow (P-PROF) Research Group, Division of Materials Technology, School of Energy, Environment and Materials, King Mongkut’s University of Technology Thonburi, Bangkok 10140, Thailand
4
Nuclear Technology Research and Development Center, Thailand Institute of Nuclear Technology (Public Organization), Nakhon Nayok 26120, Thailand
5
Specialized Center of Rubber and Polymer Materials in Agriculture and Industry (RPM), Faculty of Science, Kasetsart University, Bangkok 10900, Thailand
*
Author to whom correspondence should be addressed.
Sustainability 2024, 16(15), 6282; https://doi.org/10.3390/su16156282
Submission received: 25 May 2024 / Revised: 15 July 2024 / Accepted: 20 July 2024 / Published: 23 July 2024

Abstract

:
The properties of natural rubber foam (NRF) containing gamma-synthesized chitosan (CS) powder were investigated to address the growing demand for efficient methods to treat industrial wastewater contaminated with heavy metals. The CS powder was prepared by irradiating chitin (CT) powder with varying doses of gamma rays (0–100 kGy), followed by deacetylation using 40% sodium hydroxide (NaOH) at 100 °C for 1 h. The resulting CS powders were then mixed with natural rubber latex (NRL) at different contents (0, 3, 6, and 9 parts per hundred parts of rubber by weight; phr) and processed using Dunlop techniques to prepare the foam samples. The experimental findings indicated that the degree of deacetylation (%DD) of the CS powder increased initially with gamma doses up to 60 kGy but then decreased at 80 and 100 kGy. In addition, when the CS powder was incorporated into the NRF samples, there were increases in total surface area, density, compression set, and hardness (shore OO), with increasing gamma doses and CS contents. Furthermore, the determination of heavy metal adsorption properties for Cu, Pb, Zn, and Cd showed that the developed NRF sample exhibited high adsorption capacities. For instance, their removal efficiencies reached 94.9%, 82.5%, 91.4%, and 97.0%, respectively, in NRF containing 9 phr of 60 kGy CS. Notably, all adsorption measurements were determined using 3 cm × 3 cm × 2.5 cm specimens submerged in respective metal solutions, with an initial concentration of 25 mg/L. However, the removal capacity per unit mass of the sample (mg/g) showed less dependencies on CS contents, probably due to the higher density of CS/NRF composites in comparison to pristine NRF, resulting in a smaller volume of the former being submerged in the solution, subsequently suppressing the effects from CS in the adsorption. Lastly, tests on the reusability of the developed NRF indicated that the samples could be reused for up to three cycles, with the Cu removal capacity remaining relatively high (83%) in the sample containing 9 phr of 60 kGy CS. The overall outcomes implied that the developed NRF with the addition of gamma-synthesized CS not only offered effective and eco-friendly heavy metal adsorption capacity to improve public health safety and the environment from industrial wastewater but also promoted greener and safer procedures for the synthesis/modification of similar substances through radiation technologies.

1. Introduction

Rapid advancements in industrial technologies over the past decades have resulted in a notable increase in the utilization of heavy metals, especially copper (Cu), cadmium (Cd), lead (Pb), and zinc (Zn). These usages include applications in infrastructure, electronics, automotive, mining and milling, pharmaceutical, agricultural, textile, and energy production industries [1,2,3]. Despite the advantages of heavy metals, their utilization encounters limitations and challenges, mainly stemming from environmental concerns regarding their toxicity [4]. For example, the improper disposal of products containing heavy metals could lead to soil and water contamination, increasing health risks associated with neurological disorders, developmental issues, and cancers [5].
To address these heightened concerns regarding the contamination of heavy metals from industrial sources, it is necessary for all related parties in the process to adopt various measures and practices, such as the introduction of green processing, regulatory compliance, waste minimization and recycling, and waste treatment routines [6,7]. Among these approaches, the utilization of effective wastewater treatment has emerged as one of the most important methods, given the potential environmental and public health hazards associated with the presence of heavy metals in water systems. For example, untreated wastewater containing heavy metals discharged into water resources can result in long-term ecological damage, affecting aquatic life and entire ecosystems [8]. In addition, these metals can accumulate in the food chain, eventually being consumed by humans and animals, leading to severe health issues and even death [9]. As a result, it is crucial to implement robust and effective wastewater treatment processes that pass stringent quality standards and prevent contamination, as well as minimizing the adverse effects on both the environment and human well-being.
While there are various approaches, the use of adsorbents is currently one of the most common and effective methods for treating industrial wastewater due to their high adsorption capacity, selective affinity to heavy metal ions, and simple handling and deployment in treatment systems [10]. For example, polyurethane (PU) foam is a common material utilized as a heavy metal ion sorbent, owing to its versatility in heavy metal effluent management, the well-established technologies for product manufacturing, and the ability to be modified with fillers, such as carboxymethylated cellulose nanofibrils, activated carbon, zeolite/bentonite, and lignin, that can improve its selectivity towards specific ions [11,12,13]. Consequently, the integration of PU foams into water treatment systems has mitigated the threats of heavy metal contamination in water resources, leading to enhanced safety for both humans and animals exposed to the water directly or via its use in other processes.
Despite the benefits and widespread uses of PU foams, as well as other synthetic rubbers in wastewater treatment, their full potential has not been achieved due to several related health and environmental concerns, such as the emission of volatile organic compounds (VOCs) during production and decomposition, their susceptibility to fire, and their poor biodegradability. As a result, much effort has gone into identifying alternative adsorbent materials. In particular, natural rubber foam (NRF) has emerged as a promising candidate for such purposes due to it being comparatively less prone to off-gassing of VOCs and its resilience to certain environmental conditions, such as moisture and ultraviolet (UV) exposure, as well as its preferrable biodegradability [14,15]. Moreover, in order to further enhance its heavy metal adsorption capacity, as well as promoting the use of natural-based products, chitosan (CS), which is a naturally occurring polymer derived from chitin (CT) that contains high numbers of amino groups (–NH2) in its molecular chains, could be introduced into NRF [16,17,18]. The utilization of CS as an enhancer for heavy metal adsorption in composites is evidenced by the work of Maity et al., who prepared poly(methyl acrylate) (PMA) nanocomposites incorporating CS and nano-sized halloysite nanotubes (HNTs), which showed that the addition of both fillers into PMA led to enhanced adsorption properties for Pb(II) and Cd(II), with the percentages of removal being as high as 89.4% and 85.4%, respectively, for a sample containing 4 wt% of CS and 3 wt% of HNT [19]. Furthermore, Das et al., who prepared a clay/CS/ZnO bio-composite as an adsorbent for tannery wastewater treatment, showed that the samples exhibited the highest adsorption capacity for methylene blue and Cr(VI) of 9.57 mg/g and 10.45 mg/g, respectively, determined at their optimum conditions [20]. The enhancement in heavy metal adsorption upon the addition of CS can be attributed to the amino groups (–NH2) in the CS chains that have strong electrostatic interactions with Pb(II) and Cd(II) ions, subsequently removing the respective heavy metals from the treated water [16,17,21].
Primarily, CS is derived from CT via a deacetylation procedure, which involves the removal of acetyl groups from CT using alkaline solutions, such as concentrated sodium hydroxide (NaOH) at elevated temperatures, that causes the hydrolysis of the acetyl groups attached to the N-acetylglucosamine units, subsequently transforming CT to CS [22]. In addition, the deacetylation process introduces amino groups (–NH2) to the polymer chains, increasing the solubility of CS in acidic solutions, as well as the number of lone electron pairs in nitrogen (N) atoms, that potentially improves interactions with heavy metal ions through electrostatic attractions [23]. However, the requirements of NaOH concentrations up to 60% and elevated temperatures as high as 120 °C for 1–4 h during the deacetylation procedure have led to both environmental and energy concerns [24,25], resulting in the need for alternative or additional procedures to be developed/integrated into the usual processes. One interesting approach to cope with this demand involves the use of gamma irradiation on raw shells or CT prior to the usual deacetylation procedure, as demonstrated by Rashid et al., who irradiated prawn shells at various gamma doses of 2–50 kGy. Their findings revealed that 50 kGy gamma irradiation followed by 4 h heating of CT in 50% NaOH solution resulted in the CS exhibiting a degree of deacetylation (%DD—the percentage of acetyl groups that have been removed from the CT molecule during the deacetylation process) as high as 84.56%, compared to 74.70% in non-irradiated CS [26]. Primarily, this behavior was observed due to the gamma irradiation breaking the chemical bonds within the CT molecule, subsequently creating bond cleavages and free radicals that improved the penetrating ability of NaOH to remove acetyl groups in the CT during the deacetylation process, resulting in the higher %DD values obtained in gamma-irradiated CS [27].
As previously discussed, in order to confirm the hypothesis that the addition of gamma-synthesized CS powder could enhance the heavy metal removal capacities of NRF, CT flakes from shrimp shells were ground into powder and irradiated with various gamma doses (0, 20, 40, 60, 80, and 100 kGy) prior to the deacetylation procedure that used 40% NaOH at 100 °C for 1 h. The resulting CS powder was then characterized for its morphological properties, viscosity (in acetic acid), %DD, and functional groups using a scanning electron microscope (SEM), a viscometer, and Fourier-transform infrared spectroscopy (FTIR), respectively. Furthermore, after the optimum conditions for CS synthesis had been obtained from the previous steps, thorough investigation and discussion on the potential to use NRF samples with the addition of 0–9 phr CS powder as heavy metal adsorbents (Cu, Pb, Zn, and Cd), along with other relevant properties—mechanical properties (compression set and hardness (shore OO)), morphological, and physical properties (density and pore characteristics)—were carried out. The overall outcomes from this work should not only offer novel and useful information on the roles of gamma irradiation in CS synthesis and the impact of gamma-synthesized CS on enhancing heavy metal adsorption in NRF, but also propose effective and eco-friendly methods for the synthesis of similar substances or materials using gamma irradiation.

2. Materials and Methods

2.1. Gamma Irradiation of Chitin Powder

Chitin (CT) flakes acquired from Sinudom Agriculture Products (Surat Thani, Thailand) were ground into powder using a multi-purpose grinder (HR-1500W; Energy789 Co. Ltd.; Lamphun, Thailand). The resulting CT powder was then sifted through a 100-mesh sieve and securely sealed in plastic bags prior to gamma irradiation at the Thailand Institute of Nuclear Technology (Public Organization), with varying doses of 20, 40, 60, 80, or 100 kGy. The gamma irradiation was carried out using 60Co with a dose rate of 8.9 kGy/h and total duration for irradiation of 2.15, 4.30, 6.45, 9.00, 11.15 h, respectively (Izotope; Ob-Servo Ignis-09; Budapest, Hungary). Notably, the average particle size of CT after sifting was 238.9 ± 95.8 µm, which was determined using the ImageJ software version 1.50i and SEM particle images.

2.2. Preparation of Gamma-Synthesized Chitosan Powder

The CS powder was prepared using the deacetylation procedure [26]. First, the gamma-irradiated CT powder was mixed with 40% NaOH (Loba Chemie; Maharashtra, India), with a 1:10 (g/mL) ratio at 100 °C for 1 h, using a magnetic hotplate stirrer (MS-H280-Pro; ONILAB; San Francisco, CA, USA). It should be noted that the temperature during the mixing was carefully monitored and regulated throughout the process using a thermometer (HI98501; Hanna Instruments; Woonsocket, RI, USA). After mixing, the CS powder was filtered, rinsed with distilled water (Faculty of Science, Kasetsart University; Bangkok, Thailand), and oven-dried in a hot-air oven (UN110; Memmert; Schwabach, Germany) at 100 °C until constant CS weight was achieved. Notably, the notations “CTX” and “CSX” used throughout this work represent chitin (CT) and chitosan (CS) powders that were gamma-irradiated with an accumulated dose of X kGy. For example, CT60 and CS60 represent CT and CS powders that were irradiated and prepared with 60 kGy gamma rays, respectively.

2.3. Preparation of Natural Rubber Foam Containing Gamma-Synthesized CS Powder

High-ammonia natural rubber latex (HA-NRL), with a total solid content of 61.1% (ISO 124: 2014) [28] and a dry rubber content of 60.3% (ISO 126: 2005) [29], was supplied by the Office of Rubber Authority of Thailand (RAOT), Thailand. Details regarding the names, contents, and roles of the chemicals used in the sample preparation are outlined in Table 1. Distilled water was supplied by the Faculty of Science, Kasetsart University (Thailand), whereas other chemicals were supplied by the RAOT (Thailand). All chemicals (except potassium oleate) were prepared into solutions using a stainless-steel ball mill to improve the compatibility between the NRL matrix and the added chemicals. This involved diluting each pure chemical with vultamol, bentonite, and distilled water for 72 h, with the final weight contents of the chemicals being A/1/1/98−A for chemical/vultamol/bentonite/distilled water, where A is the intended concentration of the chemical [30]. Notably, the CS powder used for the preparation of NRF foams was limited to those irradiated with gamma doses up to 60 kGy, as higher doses (80 and 100 kGy) resulted in reduced %DD values, which were shown to have a lower heavy metal removal capacity, as reported by Unagolla and Adikary, who showed that CS with higher %DD exhibited higher Cd and Pb adsorption capacities of 11 mg/g and 18 mg/g than those with lower %DD, which had Cd and Pb adsorption capacities of 8 and 16 mg/g, respectively [31].
To prepare the NRF samples, HA-NRL was mechanically stirred and blended with potassium oleate using an automatic mixer (HM-273; OTTO; Thailand) at a rotation speed of 800 rpm for 2 min. The other chemicals listed in Table 1 were then sequentially added to the stirred NRL, following the order from the top to the bottom of Table 1, with a 1 min interval between each addition. The stirring continued until the last chemical (SSF) had been added to the mixture. The prepared NRL mixture was then poured into a square mold and later heated in a hot-air oven at 100 °C for 1 h. Afterward, the mold was taken out from the oven and the NRF samples were carefully removed from the mold, rinsed with running water for 5–15 min, and oven-dried again at 70 °C for 24 h. Next, the NRF samples were stored in a closed container for further characterization.

2.4. Characterization of CT and CS Powders

2.4.1. Morphology

The morphological properties of the CT and CS powders, prepared using different gamma doses, were investigated using a SEM (Quanta 450 FEI; JSM-6610LV; Eindhoven, the Netherlands) in a secondary electron (SE) mode, with an accelerating voltage of 15 kV. The average particle sizes of the CT and CS powders were also determined using their respective SEM images, in conjunction with the ImageJ software version 1.50i.

2.4.2. Viscosity of CT and CS Powders in Acetic Acid

In order to understand the effects of gamma irradiation on the molecular weight (Mw) of CS, the viscosity (η), known to have a strong positive correlation with Mw, of the CS powder in acetic acid was determined [32]. This involved mixing the 1% (w/v) CS powder with 1% (v/v) acetic acid at room temperature for 24 h. The values of η were subsequently measured using a viscometer (RV DVIII; Brookfield, PA, USA) equipped with a spindle No. 5, operating at a rotation speed of 100 rpm and a temperature of 25 °C. Notably, the measurement was conducted 1 min after the start of the mixing process.

2.4.3. Functional Groups and Degree of Deacetylation

The functional groups in the CT and CS powders, prepared using varying gamma doses, were determined using FTIR (PerkinElmer Scientific; USA), covering wavenumbers within the range 500–4000 cm−1. From the obtained FTIR spectra, the %DD values for all the CS powders were determined using Equation (1) [33]:
% D D = 100 A 1655 A 3450 × 100 1.33
where A1655 and A3450 are the absorbance intensities after baseline corrections at 1655 cm−1 (corresponding to the amide I band in acetyl groups) and 3450 cm−1 (corresponding to a reference hydroxyl group), respectively. Notably, the factor 1.33 represents the ratio of A1655 to A3450 for pure CT.

2.5. Characterization of NRF Samples

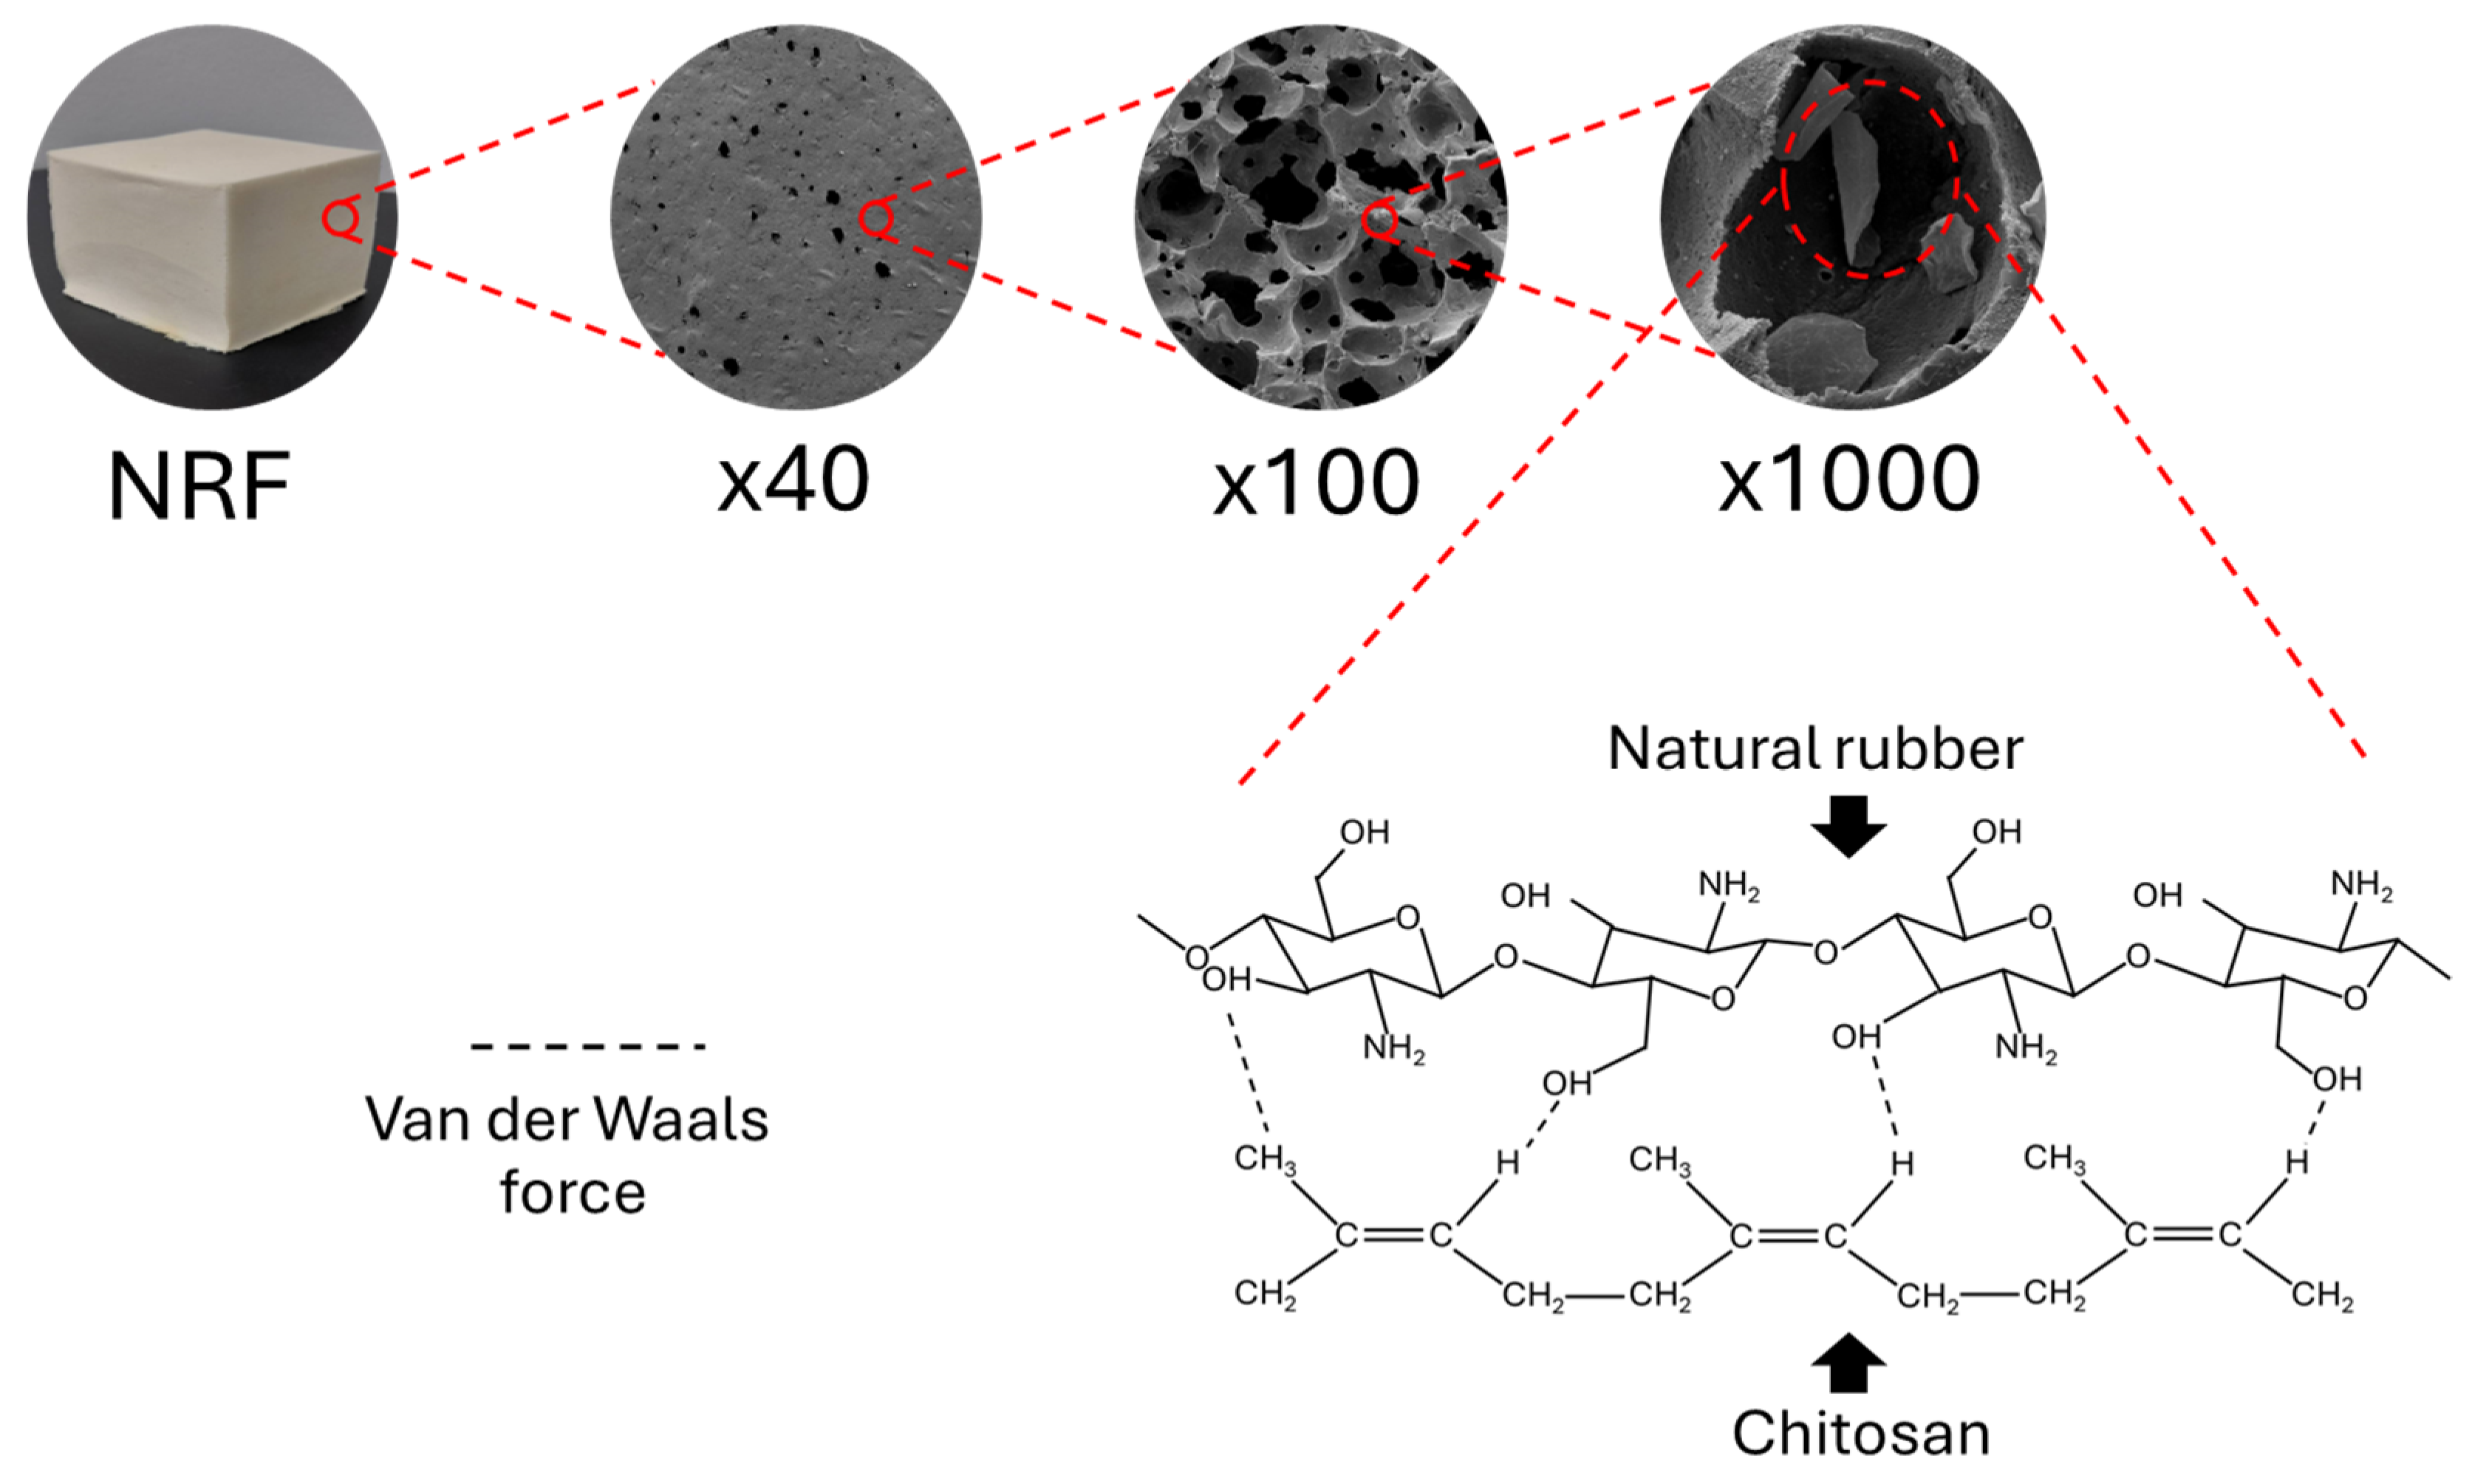
2.5.1. Morphology and Functional Groups

The morphological properties and functional groups of all NRF samples containing varying CS contents were examined using the same setup and equipment as those listed for the CT and CS powder analysis. Specifically, for SEM measurements, all NRF samples were immersed in liquid nitrogen for 5 min and then abruptly snapped into pieces. Next, the fractured surfaces were coated with a layer of gold (0.2 mm thick) using a magnetron sputter (SC7620; Quorum Technologies Polaron; Lewes, UK) at a current of 5 mA for 120 s to avoid charge accumulation on the surface of the NRF samples.

2.5.2. Density and Pore Characteristics

The densities for all NRF samples were determined using a densitometer (MH300A; Chongqing, China), based on Archimedes’ principle and ASTM D3575. The density measurement was conducted with at least three repetitions for each sample. Pore characteristics (surface area, pore volume, and pore size), were determined using a surface area and pore size analyzer (Micromeritics 3Flex Surface Characterization; Norcross, GA, USA) based on the static volumetric gas adsorption method.

2.5.3. Thermal Stability

Thermal stabilities of all NRF samples were examined using thermogravimetric analysis (TGA; TGA/DSC 3+; Mettler-Toledo; Greifensee, Switzerland). Measurements were carried out using a temperature range of 30–600 °C at a heating rate of 20 °C/min under a nitrogen atmosphere with a flow rate of 60 mL/min [34].

2.5.4. Compression Set and Hardness (Shore OO)

The ability of NRF samples to recover their initial dimensions after being compressed over a period of time was determined using a compression set measurement (S.C.S. Instrument; Bangkok, Thailand) by pressing 5 cm × 5 cm × 2.5 cm samples to 50 ± 4% of their original size for a duration of 72 h, according to the ISO 1856 Method B [35]. Following the decompression, the samples were allowed to stand at room temperature for 30 min, after which their heights were measured. The values of the compression set were calculated using Equation (2):
C o m p r e s s i o n   s e t % = H i H f H i × 100 %
where Hi and Hf are the initial and final heights, respectively. In addition, the hardness (shore OO) of the samples was measured using a hardness durometer (GS-754G; Teclock; Nagano, Japan), following the ASTM D2240 [36].

2.5.5. Heavy Metal Adsorption Measurement

The capacities of the NRF samples to remove heavy metals (Cu, Pb, Zn, and Cd) were determined by submerging 3 cm × 3 cm × 2.5 cm samples in individual 50 mL solutions of 25 mg/L copper nitrate (Cu(NO3)2) (PanReac; Barcelona, Spain), lead nitrate (Pb(NO3)2) (DC Finechem; Barcelona, Spain), zinc nitrate (Zn(NO3)2) (DC Finechem; Spain), and cadmium nitrate (Cd(NO3)2) (PanReac; Spain) at room temperature for 48 h. After the submersion, the samples were removed from the solutions and the concentrations of the remaining heavy metals in their respective solutions were measured using atomic absorption spectrophotometry (AAS; SavantAA; GBC; Brisbane, Australia). The values were then used to calculate the percentage of heavy metal adsorption (Adsorption (%)) and the removal capacity per unit mass of the sample (mg/g) based on Equations (3) and (4), respectively:
A d s o r p t i o n   ( % ) = C i C r C i × 100 %
R e m o v a l   c a p a c i t y   ( m g / g ) = C i C r m
where Ci and Cr are the initial and remaining concentrations of heavy metal in the solution, respectively, and m is the mass of the sample used during the adsorption measurements.
Furthermore, to assess the reusability of the developed NRF, the samples previously submerged in each heavy metal solution were thoroughly rinsed with distilled water and dried using a hot-air oven. The dried NRF samples were then once more submerged in the 50 mL of 25 mg/L Cu(NO3)2 solution (serving as a representative for heavy metals in this work), following the same setup/procedure employed during the initial adsorption measurement. The reusability evaluation was conducted iteratively for a total of six repetitions, and the adsorption (%) values were calculated using Equation (3) for each repetition.

2.6. Statistical Analysis

A level of 95% significance (p < 0.05) was used for the descriptive analysis of the data. Student’s t-test was applied to determine any significant differences between the results of interest. Statistical analysis was conducted using IBM SPSS Statistics software (version 29) (USA).

3. Results and Discussion

3.1. Chitin and Chitosan Powders

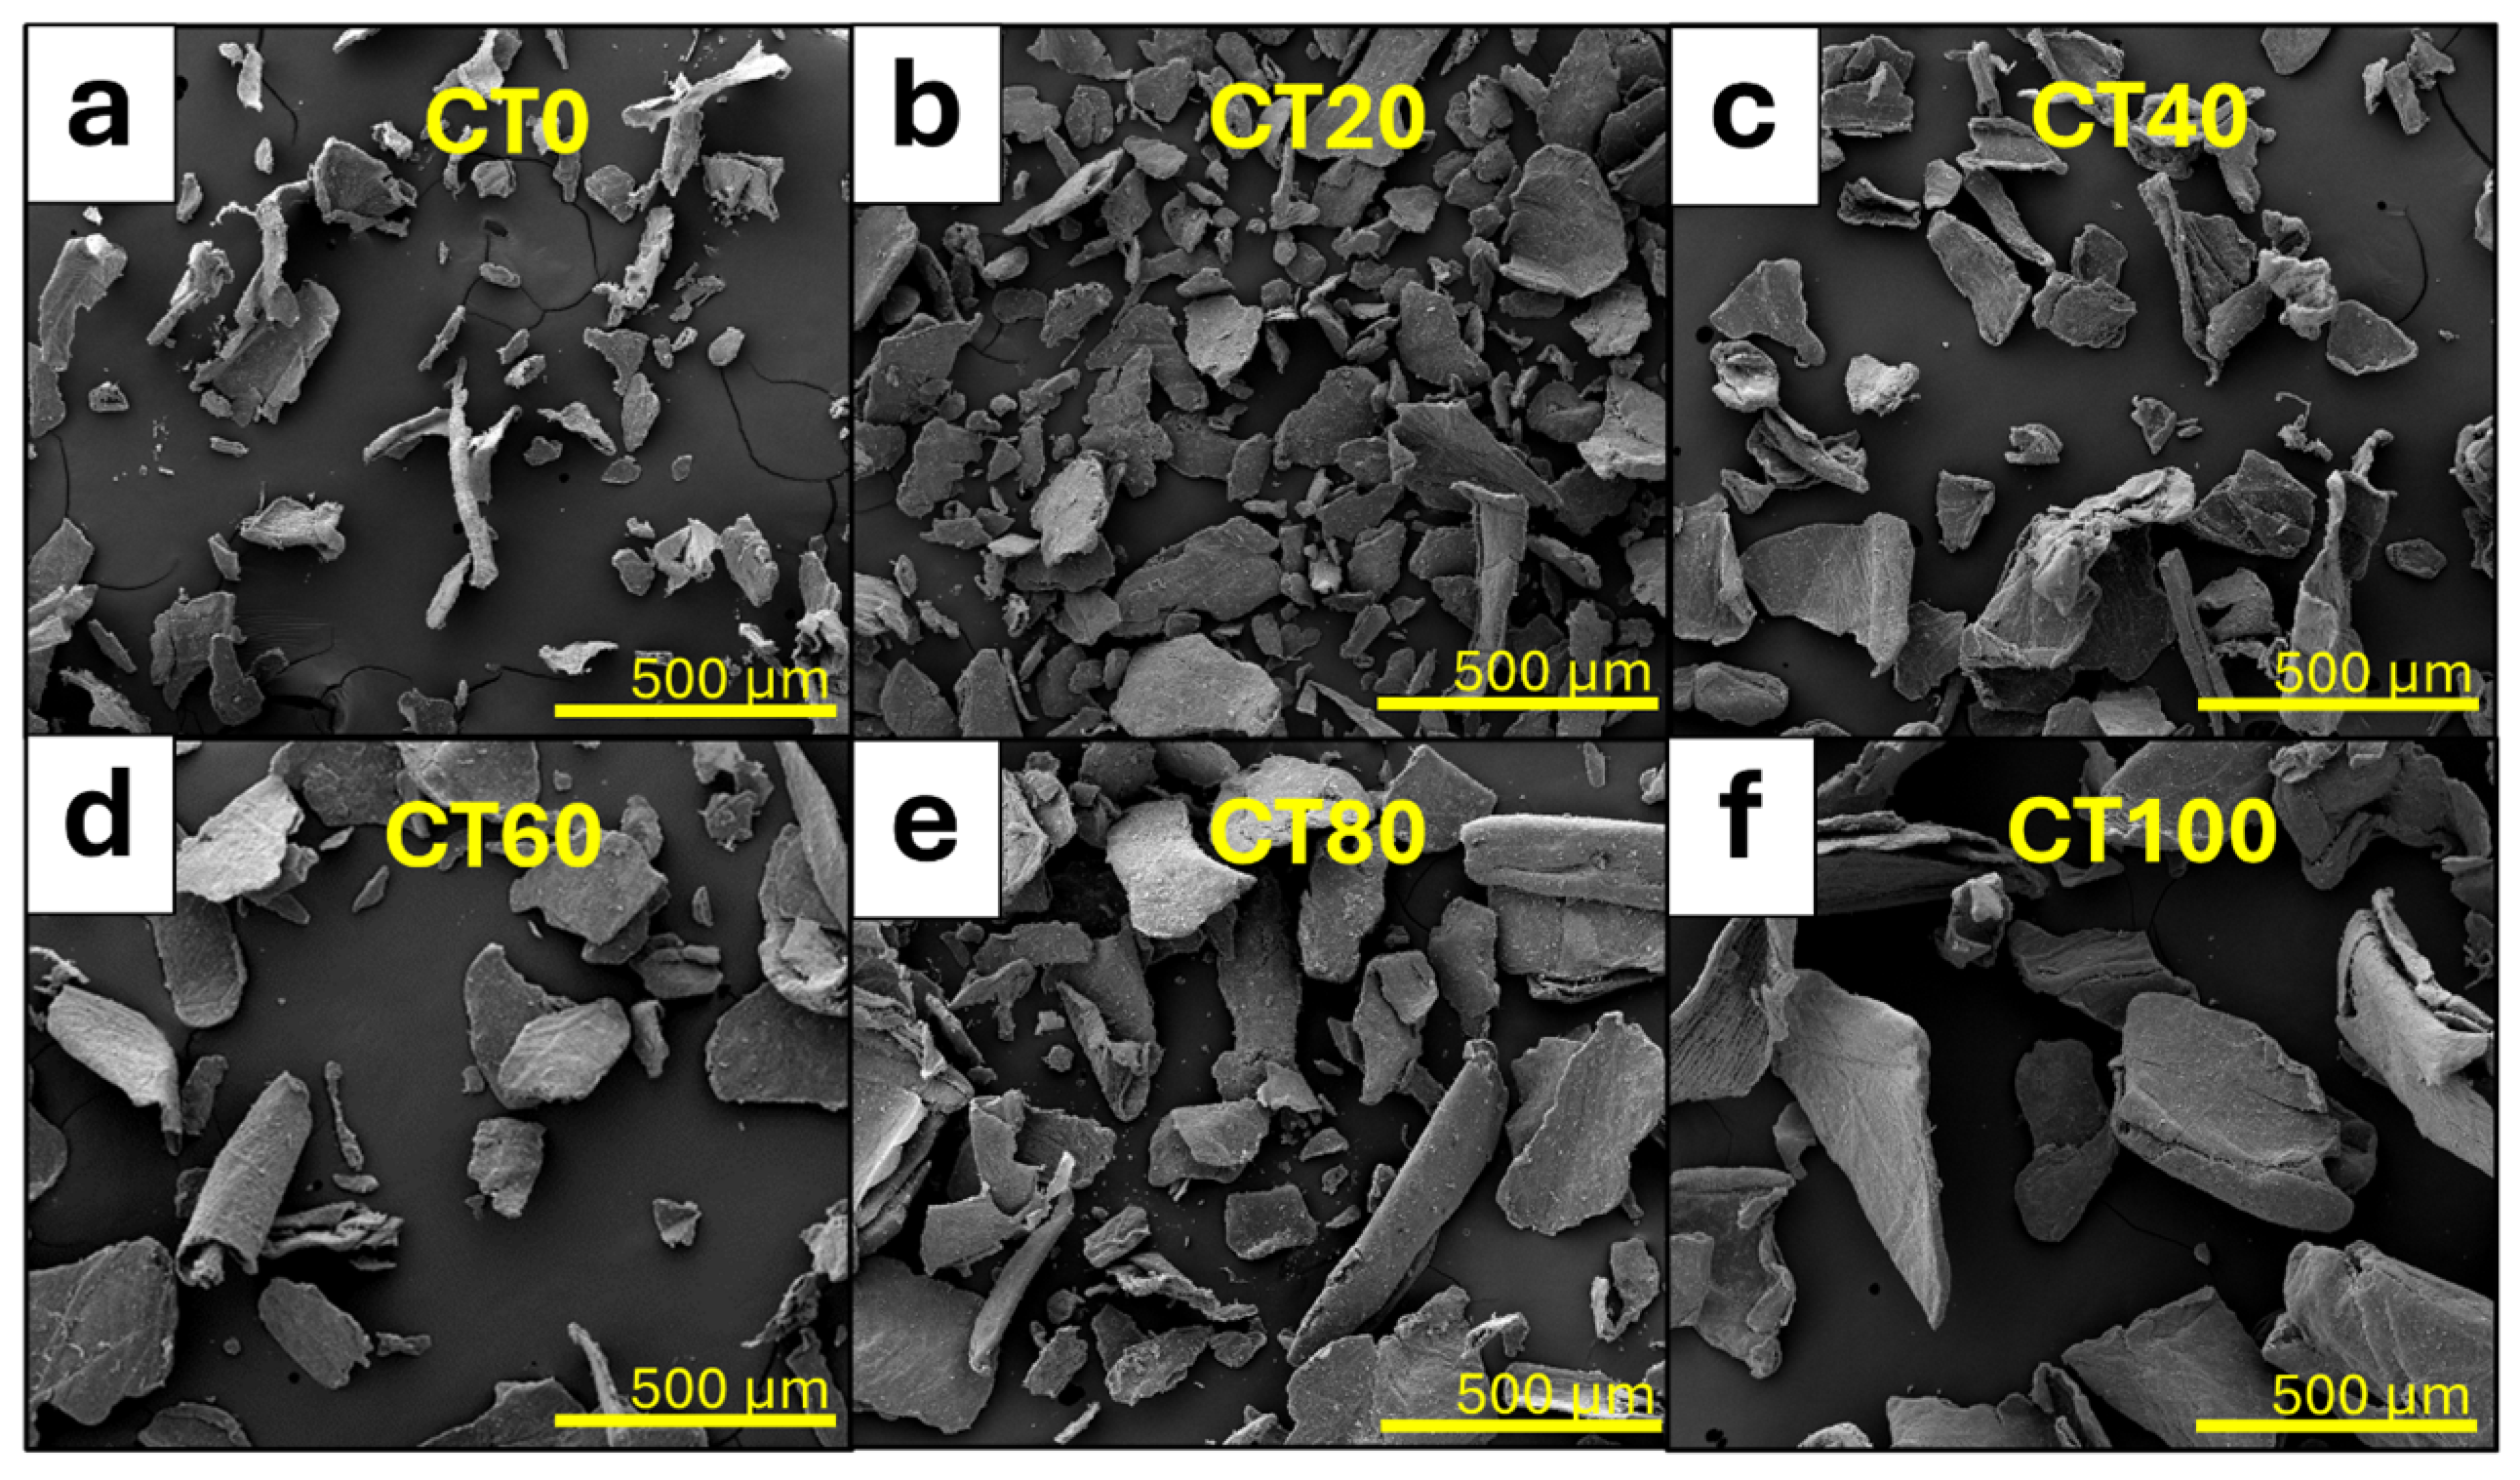
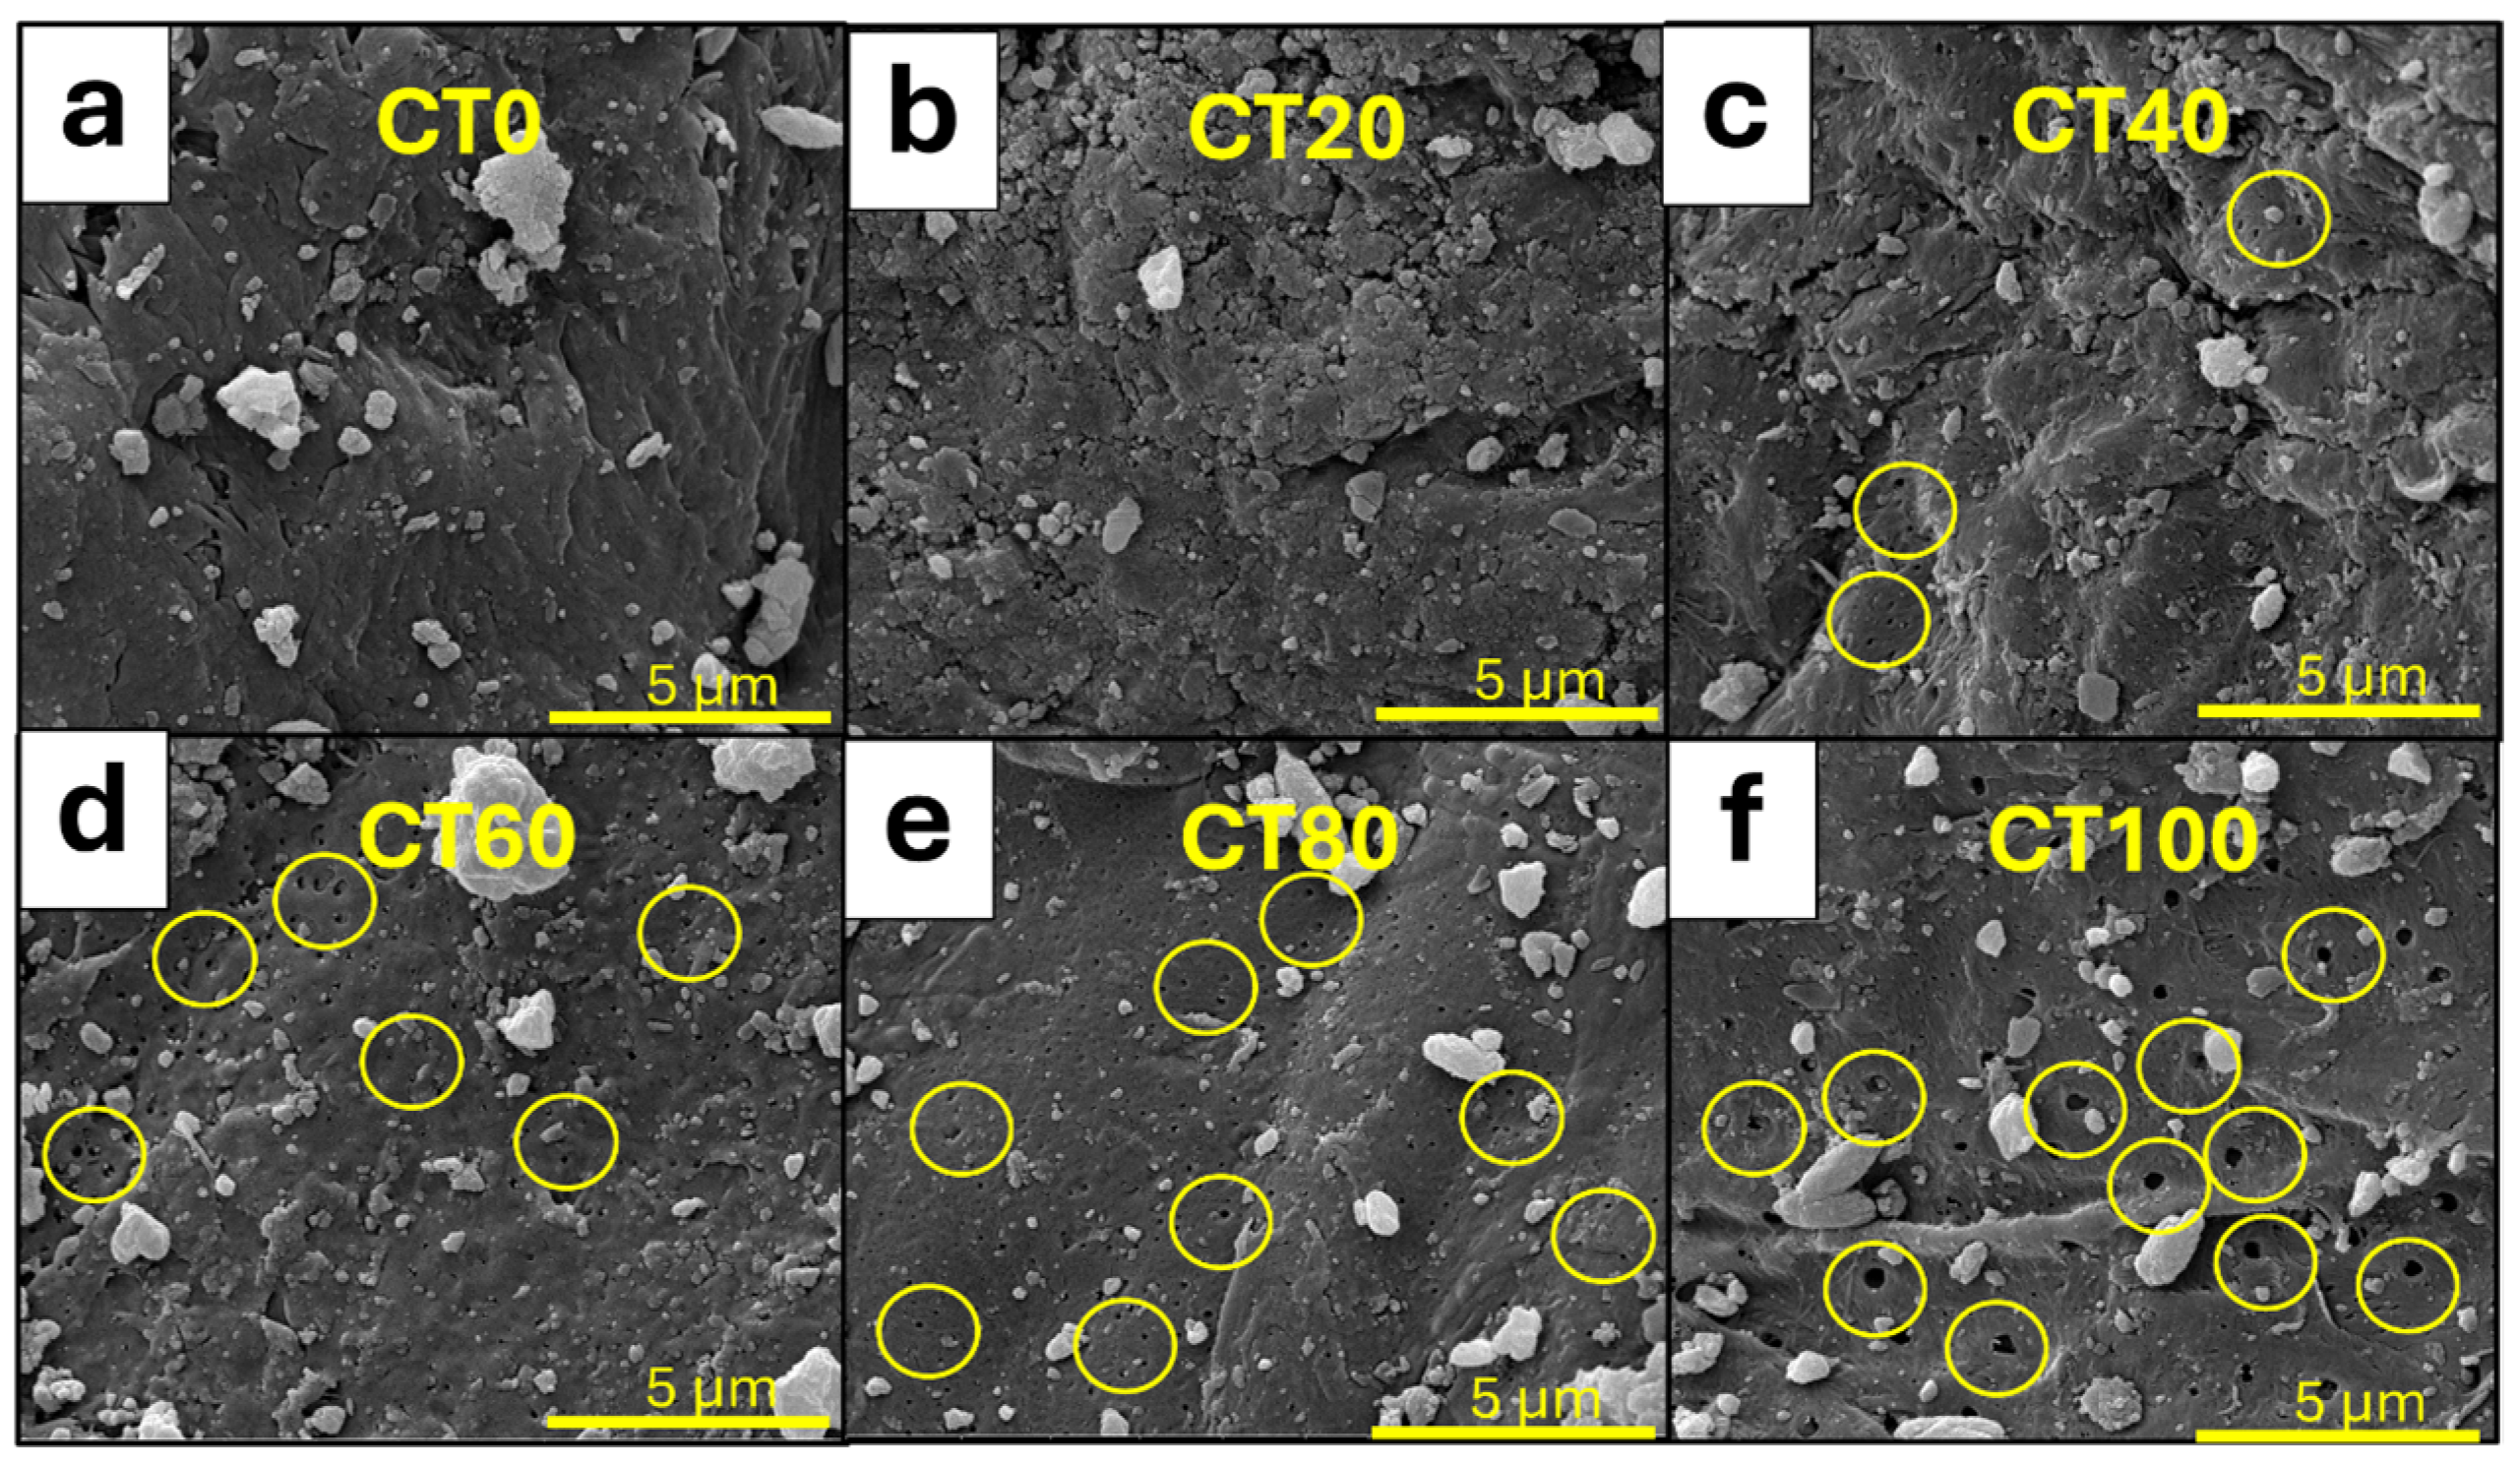
3.1.1. Morphological Properties of CT and CS Powders

The morphological properties of the CT and CS powders with varying gamma doses are shown in Figure 1, Figure 2, Figure 3 and Figure 4. Figure 1 reveals that all the CT powders were flaky, with similar average particle sizes in the range 230.9–357.2 µm (Table S1). Although the average particle sizes for each CT powder were different, the large deviations, ranging from 87.4 to 188.8 µm, in each irradiating condition resulted in the average values being insignificantly different (p > 0.5). This was likely due to some of the CT flakes being rolled or folded, which made accurate measurement difficult. Additionally, upon increasing the magnification of the SEM micrographs to ×10,000, visible pores were observed on the CT surfaces, with the pore numbers increasing with increasing gamma doses, especially those of CT60, CT80, and CT100 (Figure 2d–f) compared to CT0, CT20, and CT40 (Figure 2a–c). This behavior of increased pore formation on the CT surfaces after gamma irradiation could have been due to the breaking of chemical bonds within the CT molecules that subsequently created bond cleavages and free radicals that may have led to the formation of a new network structure with increased porosity [27]. In addition, the formation of pores in the CT samples could have been due to the release of ammonia (NH3) gas caused by chain scissions that removed amino (–NH2) groups in the CT molecular chains [37].
Figure 3 illustrates that the CS powders had similar flaky shapes to the CT samples, with the average particle sizes ranging from 386.3 to 504.1 µm (Table S1), with the differences in average values being insignificant, similarly to the case of CT. However, the results indicated that the average particles sizes of CS were generally larger than those of CT, probably due to the effect of the deacetylation process that could unroll and straighten some of the CS flakes into flatter sheets. However, Figure 4 shows that the CS powder surfaces were much smoother compared to those of the CT powder, regardless of the level of gamma dose. This behavior could have been due to the deacetylation removing acetyl (–COCH3) groups that led to the breakdown of the crystalline structure (becoming more amorphous) and hence producing smoother surfaces [38]. The increase in the hydrophilicity of the CS powder after the deacetylation process could also be another factor that smoothened the CS surface, as the increased hydrophilicity led to better interactions with water molecules or acidic solutions, producing a more hydrated surface that appeared smoother. It should be noted that the surfaces of CS with higher gamma doses (Figure 4d–f) were rougher than those with lower gamma doses (Figure 4a–c), probably due to a higher occurrence of pores on the CT surfaces with higher gamma doses (Figure 2d–f) that made the CT flakes more hydrophobic, which limited the effectiveness of the deacetylation process at smoothing the surfaces.

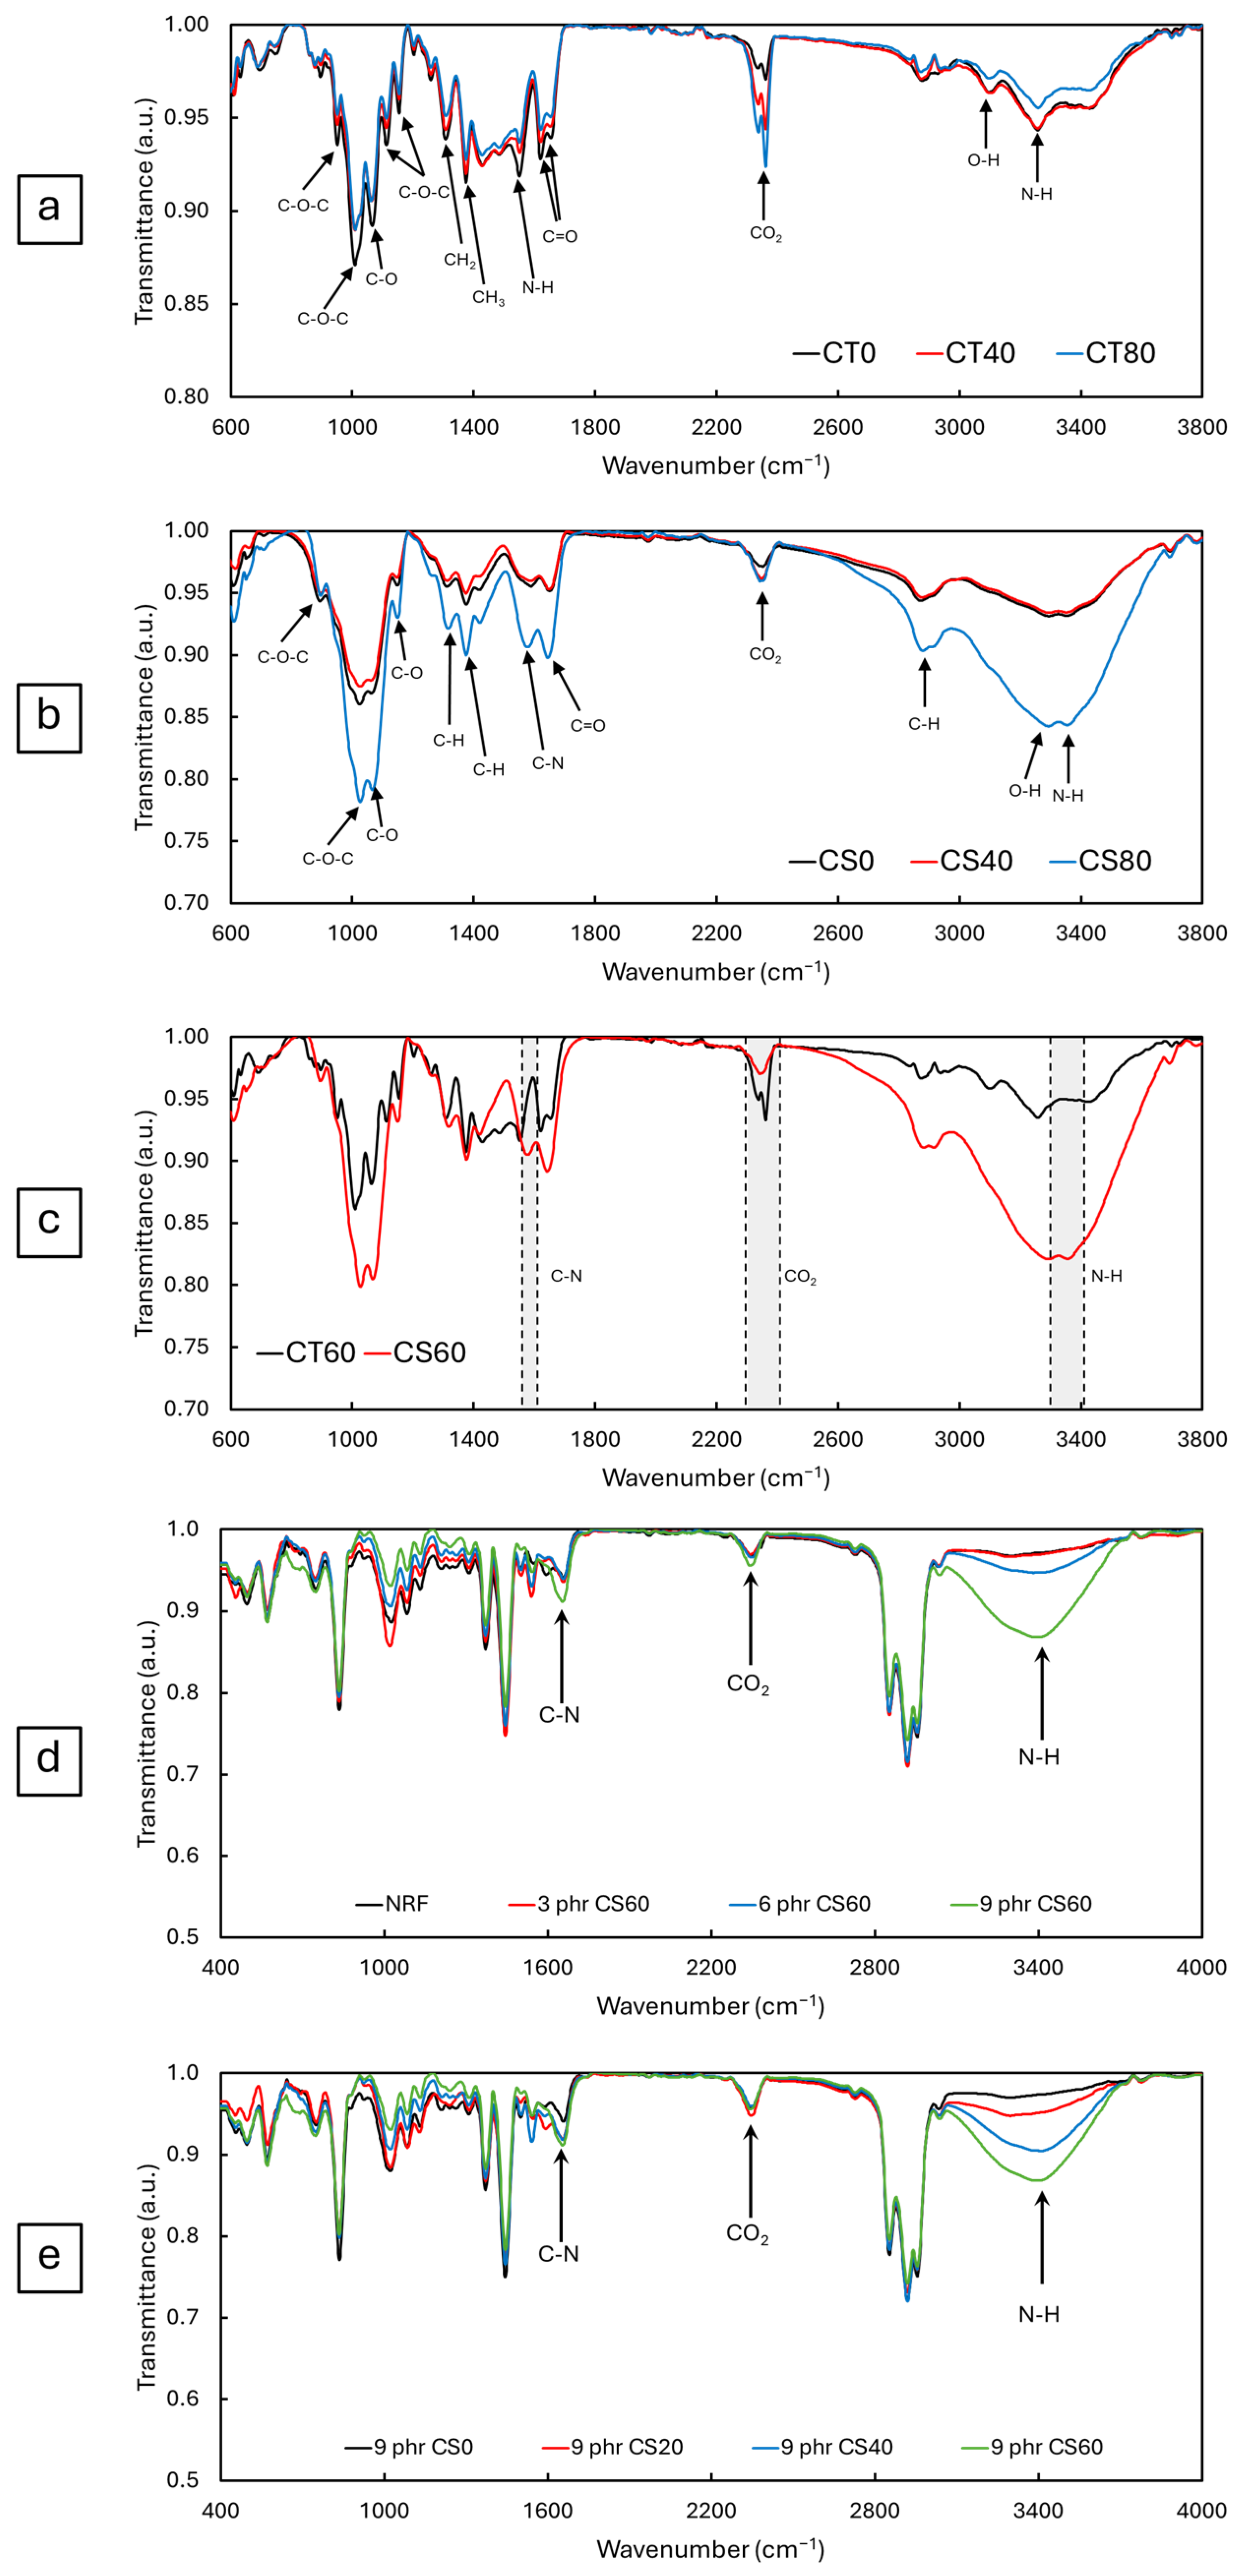
3.1.2. Functional Groups of CT and CS Powders and Viscosity of CS Powder in Acetic Acid

Figure 5a shows the FTIR spectra of the CT powders that have been irradiated with varying gamma doses (0, 40, and 80 kGy). The results indicated that all the CT samples displayed similar peak positions and intensities, with important peaks being observed at 952 cm−1, 1010 cm−1, 1117 cm−1, and 1155 cm−1, corresponding to the stretching vibration of the glycosidic (C–O–C) group in the CT backbone; 1625 cm−1 and 1656 cm−1, corresponding to the stretching vibration of the carbonyl (C=O) group in the amides; 1552 cm−1, corresponding to the bending vibration of the N–H bond in the amines; 3116 cm−1, corresponding to the stretching vibrations of the hydroxyl (O–H) groups; and 3267 cm−1, corresponding to the stretching vibrations of the N–H bond in the amines. Notably, the intensity of the N–H bonds at 3267 cm−1 appeared to be lower for CT80 compared to those of CT0 and CT40, probably due to the substantial release of NH3 following the gamma irradiation [39]. However, the transmittance intensities at 2339 cm−1 and 2362 cm−1, corresponding to CO2, increased with increasing gamma doses, as evidenced by the highest intensity observed in CT80. Despite gamma irradiation on CT having no direct effect on creating CO2, the formation of pores on the CT surfaces, as seen in Figure 2d–f of CT60, CT80, and CT100, respectively, resulted in atmospheric CO2 being adsorbed onto the surface or into the pores of the CT powder, subsequently contributing to the observed peaks at 2339 cm−1 and 2362 cm−1 [40].
Figure 5b compares the FTIR spectra of the CS powders prepared with varying gamma doses (0, 40, and 80 kGy). The spectra indicated that CS powder mostly displayed similar peak positions to those of CT; however, a noticeable additional peak at 1585 cm−1, corresponding to the stretching vibration of the C–N bond in the amides, was observed in the CS, which could be due to the effects of deacetylation on CS that added amino (NH2) groups to the CS molecular chains. Notably, Figure 5b also shows that several peaks of CS80 appeared to be substantially higher than those of CS0 and CS40. These enhanced intensities were probably due to higher gamma irradiation doses on the CT powder (prior to deacetylation) initiating more chain scissions in CS80, resulting in the creation of new terminal groups such as carboxyl (C=O, C–O, and O–H) or amino (N–H) groups in the CS molecular chain. In addition, as chain scissions occurred along the CT molecular chains, the molecular weight and viscosity of CS in acetic acid decreased (as shown in Table 2), owing to the shorter CS chains (lower molecular weight) being able to move more freely in the solution and being less likely to entangle with neighboring chains, thus, lowering the viscosity of the CS solution. From Table 2, the viscosity of the CS solutions in acetic acid decreased from 1004.7 ± 0.6 cP in CS0 to 295.7 ± 0.6 cP, 35.7 ± 0.6 cP, and 15.7 ± 0.6 cP in CS20, CS40, and CS60, respectively, with the values becoming relatively constant around 15 cP onward. This reduction in the viscosity of the CS solutions confirmed the occurrence of chain scission and the reduction in molecular weight of CS due to gamma irradiation.
In Figure 5c, the comparison of the FTIR spectra from CT60 and CS60 revealed notable distinctions. For example, the peak at 1656 cm−1 observed in CT60, corresponding to the stretching vibration of acetyl (C=O) groups, was absent in the spectrum of CS60. On the other hand, there were noticeable increases in the peaks corresponding to the amides and amines, with the characteristic C–N and N–H bonds appearing at 1585 cm−1 and 3267 cm−1, respectively, in CS60. Primarily, these changes in the FTIR spectra stemmed from deacetylation, which removed the acetyl groups from the CT while simultaneously introducing amino groups to the CS [39]. The peaks around 2330–2370 cm−1, corresponding to CO2 of CS60, were also lower than those of CT60, suggesting that less atmospheric CO2 had been adsorbed into the pores of CS60, indicating a lower pore formation in the surface of CS60 than that of CT60, as is depicted in Figure 2 and Figure 4.

3.1.3. Degree of Deacetylation of CS Powder

The %DD values determined using the FTIR spectra for all the CS powders are shown in Table 2. The results indicated that the %DD increased from 54.7 ± 3.5% in CS0 to a maximum of 81.3 ± 2.0% in CS60, followed by a subsequent decrease in %DD values at higher gamma doses (CS80 and CS100). Primarily, the initial increase in the %DD was due to the ability of gamma irradiation to break chemical bonds within the CT molecules, consequently leading to the generation of free radicals and the formation of pores on the CT surfaces, improving the penetrating ability of NaOH to remove acetyl groups in the CT during deacetylation, subsequently producing a higher %DD value [27]. Nonetheless, as the gamma dose increased to 80 and 100 kGy, the %DD values decreased. This behavior resulted from the increased chain scissions at higher gamma doses that broke down the CT molecules into smaller fragments, reducing the availability of acetyl groups to function fully in the deacetylation process. In addition, gamma irradiation could induce crosslinking among the CT molecules, making them less susceptible to deacetylation and subsequently lowering the %DD values. Notably, since the maximum value of %DD was obtained at CS60, and considering that the capacity to adsorb heavy metals had a positive correlation with %DD [31,32], the subsequent investigation of NRF containing CS was limited to the additions of CS0, CS20, CS40, and CS60, with varying contents of 0, 3, 6, and 9 phr.

3.2. Natural Rubber Foam Containing Chitosan Powder

3.2.1. Functional Groups of NRF Containing CS Powder

The FTIR spectra of NRF containing varying contents and gamma doses of CS powder are shown in Figure 5d,e. In Figure 5d, the NRF samples containing varying contents of CS60 had mostly similar peak positions and intensities. However, peak distinctions were observed at 1585 cm−1 and 3417 cm−1, corresponding to the stretching vibrations of the C–N bond in the amides and the N–H bond in the amines, respectively, with the NRF containing 9 phr of CS60 having the highest intensities at these particular peaks due to the higher quantity of CS powder in the sample that subsequently resulted in higher intensities of the C–N and N–H bonds in the sample [39].
Similarly, to Figure 5d,e, which shows the FTIR spectra of NRF samples containing 9 phr of CS0, CS20, CS40, CS40, and CS60, revealed that the intensities of peaks at 1585 cm−1 and 3417 cm−1 (corresponding to the C–N and N–H bonds, respectively) increased with higher gamma doses, as evidenced by the highest intensities being observed in the NRF containing CS60. This behavior could have been due to CS60 having higher intensities of C–N and N–H bonds in its molecular chain compared to CS0, CS20, and CS40, leading to higher transmittance intensities being observed at these particular peaks.

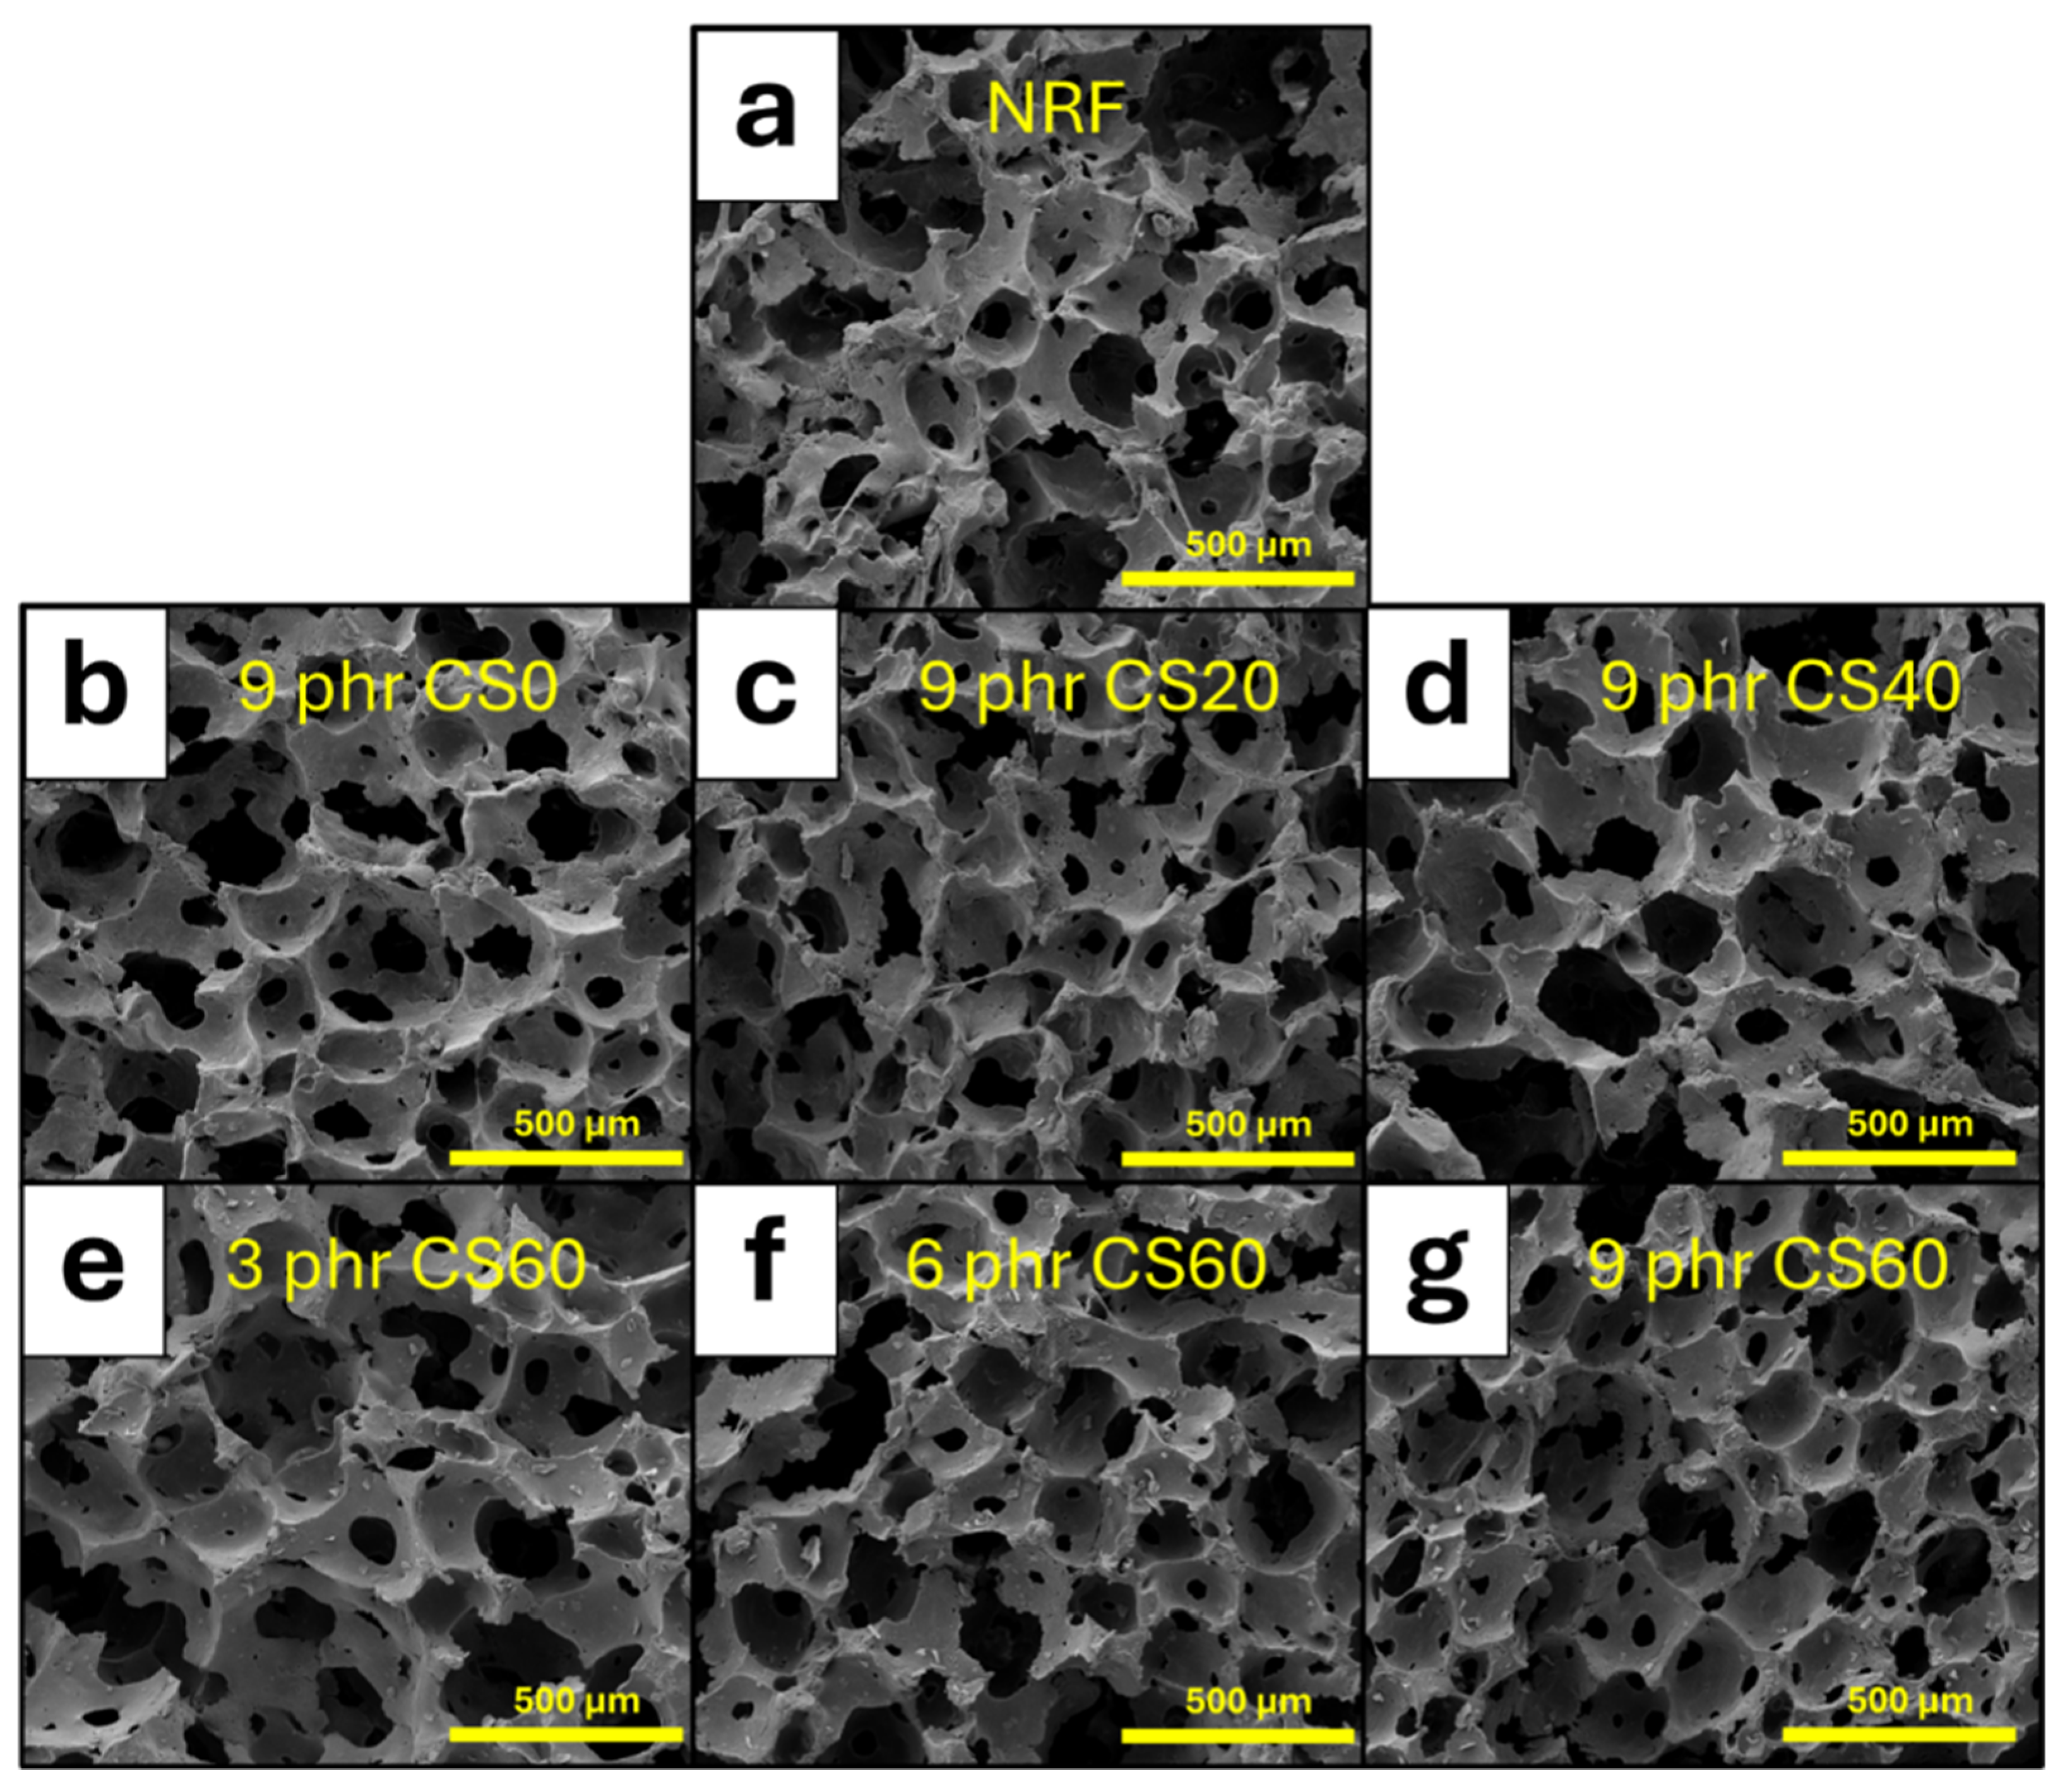
3.2.2. Densities, Pore Characteristics, and Morphological Properties of NRF Containing CS Powder

The densities of the NRF containing varying contents of the CS powder are shown in Table 3, which indicates that the densities of the samples generally increased with increasing CS contents. These increased densities were observed because CS typically had a greater density compared to natural rubber (NR) (1.42 g/cm3 for CS and 0.92 g/cm3 for NR) [41,42]. Notably, the densities of the NRF samples containing different types of CS (CS0–CS60) were mostly the same, suggesting that CS0, CS20, CS40, and CS60 had comparable densities, regardless of the irradiation conditions applied to the original CT powder.
Table 4, which shows the pore characteristics (surface area, pore volume, and pore size) of the NRF samples, indicates that the surface area of NRF generally increased with increasing CS contents, which may be attributed to the ability of CS to interact with a foaming agent (potassium oleate in this work) and decomposed upon heating, releasing CO2 that formed bubbles and subsequently increased the surface area of the NRF [43]. On the other hand, despite observed differences in the average values of pore volume and pore size, statistical analysis revealed that these values were not significantly different (p > 0.05). These large deviations are graphically illustrated in the micrographs (Figure 6 and Figure 7), which suggest that all NRF samples had open-cell structures, where the majority of the cells were interconnected, forming a network of irregular pores that varied in size across the NRF samples [44]. Furthermore, the open-cell structures of the NRF samples resulted in low densities of the samples (as shown in Table 3), providing an advantage as a heavy metal adsorbent due to the relevant gas or liquid being able to flow through the pores and interact with the matrix. Figure 7 also shows that CS powder both adhered to the surface of NRF and was embedded in the NR matrix, with the quantity of CS powder increasing with the CS contents. The micrographs also showed that the CS powder was evenly distributed throughout the matrix, without any noticeable particle agglomeration. It should be noted that CS dispersed and adhered to the NR matrix mainly through Van der Waals force between hydroxyl groups in CS and dominant functional groups in NR, with vultamol and bentonite facilitating the dispersion and the enhancement of filler–rubber interactions (the proposed interaction between CS and NR is shown in Figure 8) [45].

3.2.3. Thermal Stability of NRF Containing CS Powder

The thermal stability of the NRF samples containing various contents of CS powder is shown in Figure 9. The results indicated that all samples had similar trends for both the remaining weight (Figure 9a,c) and the derivative weight loss (Figure 9b,d), implying that the addition of the CS powder did not noticeably alter the thermal stability of the NRF. In addition, the TGA results indicated a single-step decomposition process for all samples, with well-defined initial (~200 °C) and final (~480 °C) decomposition temperatures. Figure 9b,d reveals that the highest magnitude of derivative weight loss for all samples occurred at 390 °C, which corresponded to the decomposition of pure NR (the main matrix) [34]. Notably, the decomposition temperature of CS, typically occurring at approximately 300 °C, was not detected in the TGA findings, probably due to the small addition of CS powder that did not substantially influence the TGA results of the samples. The findings also revealed that the NRF sample containing 9 phr of CS60 had a higher ash residue (~9% remaining) at temperatures exceeding 480 °C compared to other samples with lower CS contents (Figure 9c). This difference could be attributed mainly to the fact that pure CS typically contained ash residue of approximately 30–40% of its initial weight compared to ~6% for NRF, leading to a higher ash residue in samples with higher CS contents.

3.2.4. Compression Set and Hardness (Shore OO)

The compression set and hardness (shore OO) of the NRF samples containing varying CS contents are shown in Figure 10. The results indicated that the compression set (referring to the degree of permanent deformation after the removal of a compressive force) increased with increasing CS contents (for the same type of CS added to the NRF), as evidenced by the highest values observed in the samples with 9 phr (Figure 10a). These increases in the compression set could have been due to the reduced mobility and flexibility of the NRF due to the high rigidity of the CS powder, as well as possible interfacial interactions between CS and the NR matrix that restricted the mobility of NR chains during the recovery from compression [46]. In addition, the higher CS contents could have initiated the formation of stress concentrations within the foam matrix (especially at the filler–matrix interfaces), thereby enhancing permanent deformation and increasing the compression set of the NRF samples [47]. Notably, similarly to the effects of CS on the compression set, the high rigidity of the CS resulted in an increase in the overall rigidity of the samples and subsequently increased hardness (shore OO) of the NRF (Figure 10b).
In addition to the effects of the CS contents, different irradiation conditions on the preparation of the CS powder influenced the properties of compression set and hardness of NRF samples, with CS60 having the lowest (highest) compression set (hardness (shore OO)), determined at the same CS content. The increased compression set and the decreased hardness (shore OO) observed with increasing gamma doses may have resulted from the larger pore characteristics of the NRF containing CS60 (as discussed earlier and with reference to Figure 6 and Table 4) that increased the void spaces within their foam structures, allowing the NRF sample to better absorb and dissipate strain energy within the porous structure and recover more efficiently. The large surface area and pore volume also provided more space for stress distribution within the NRF, consequently lowering the stress concentrations and reducing permanent deformation [48].

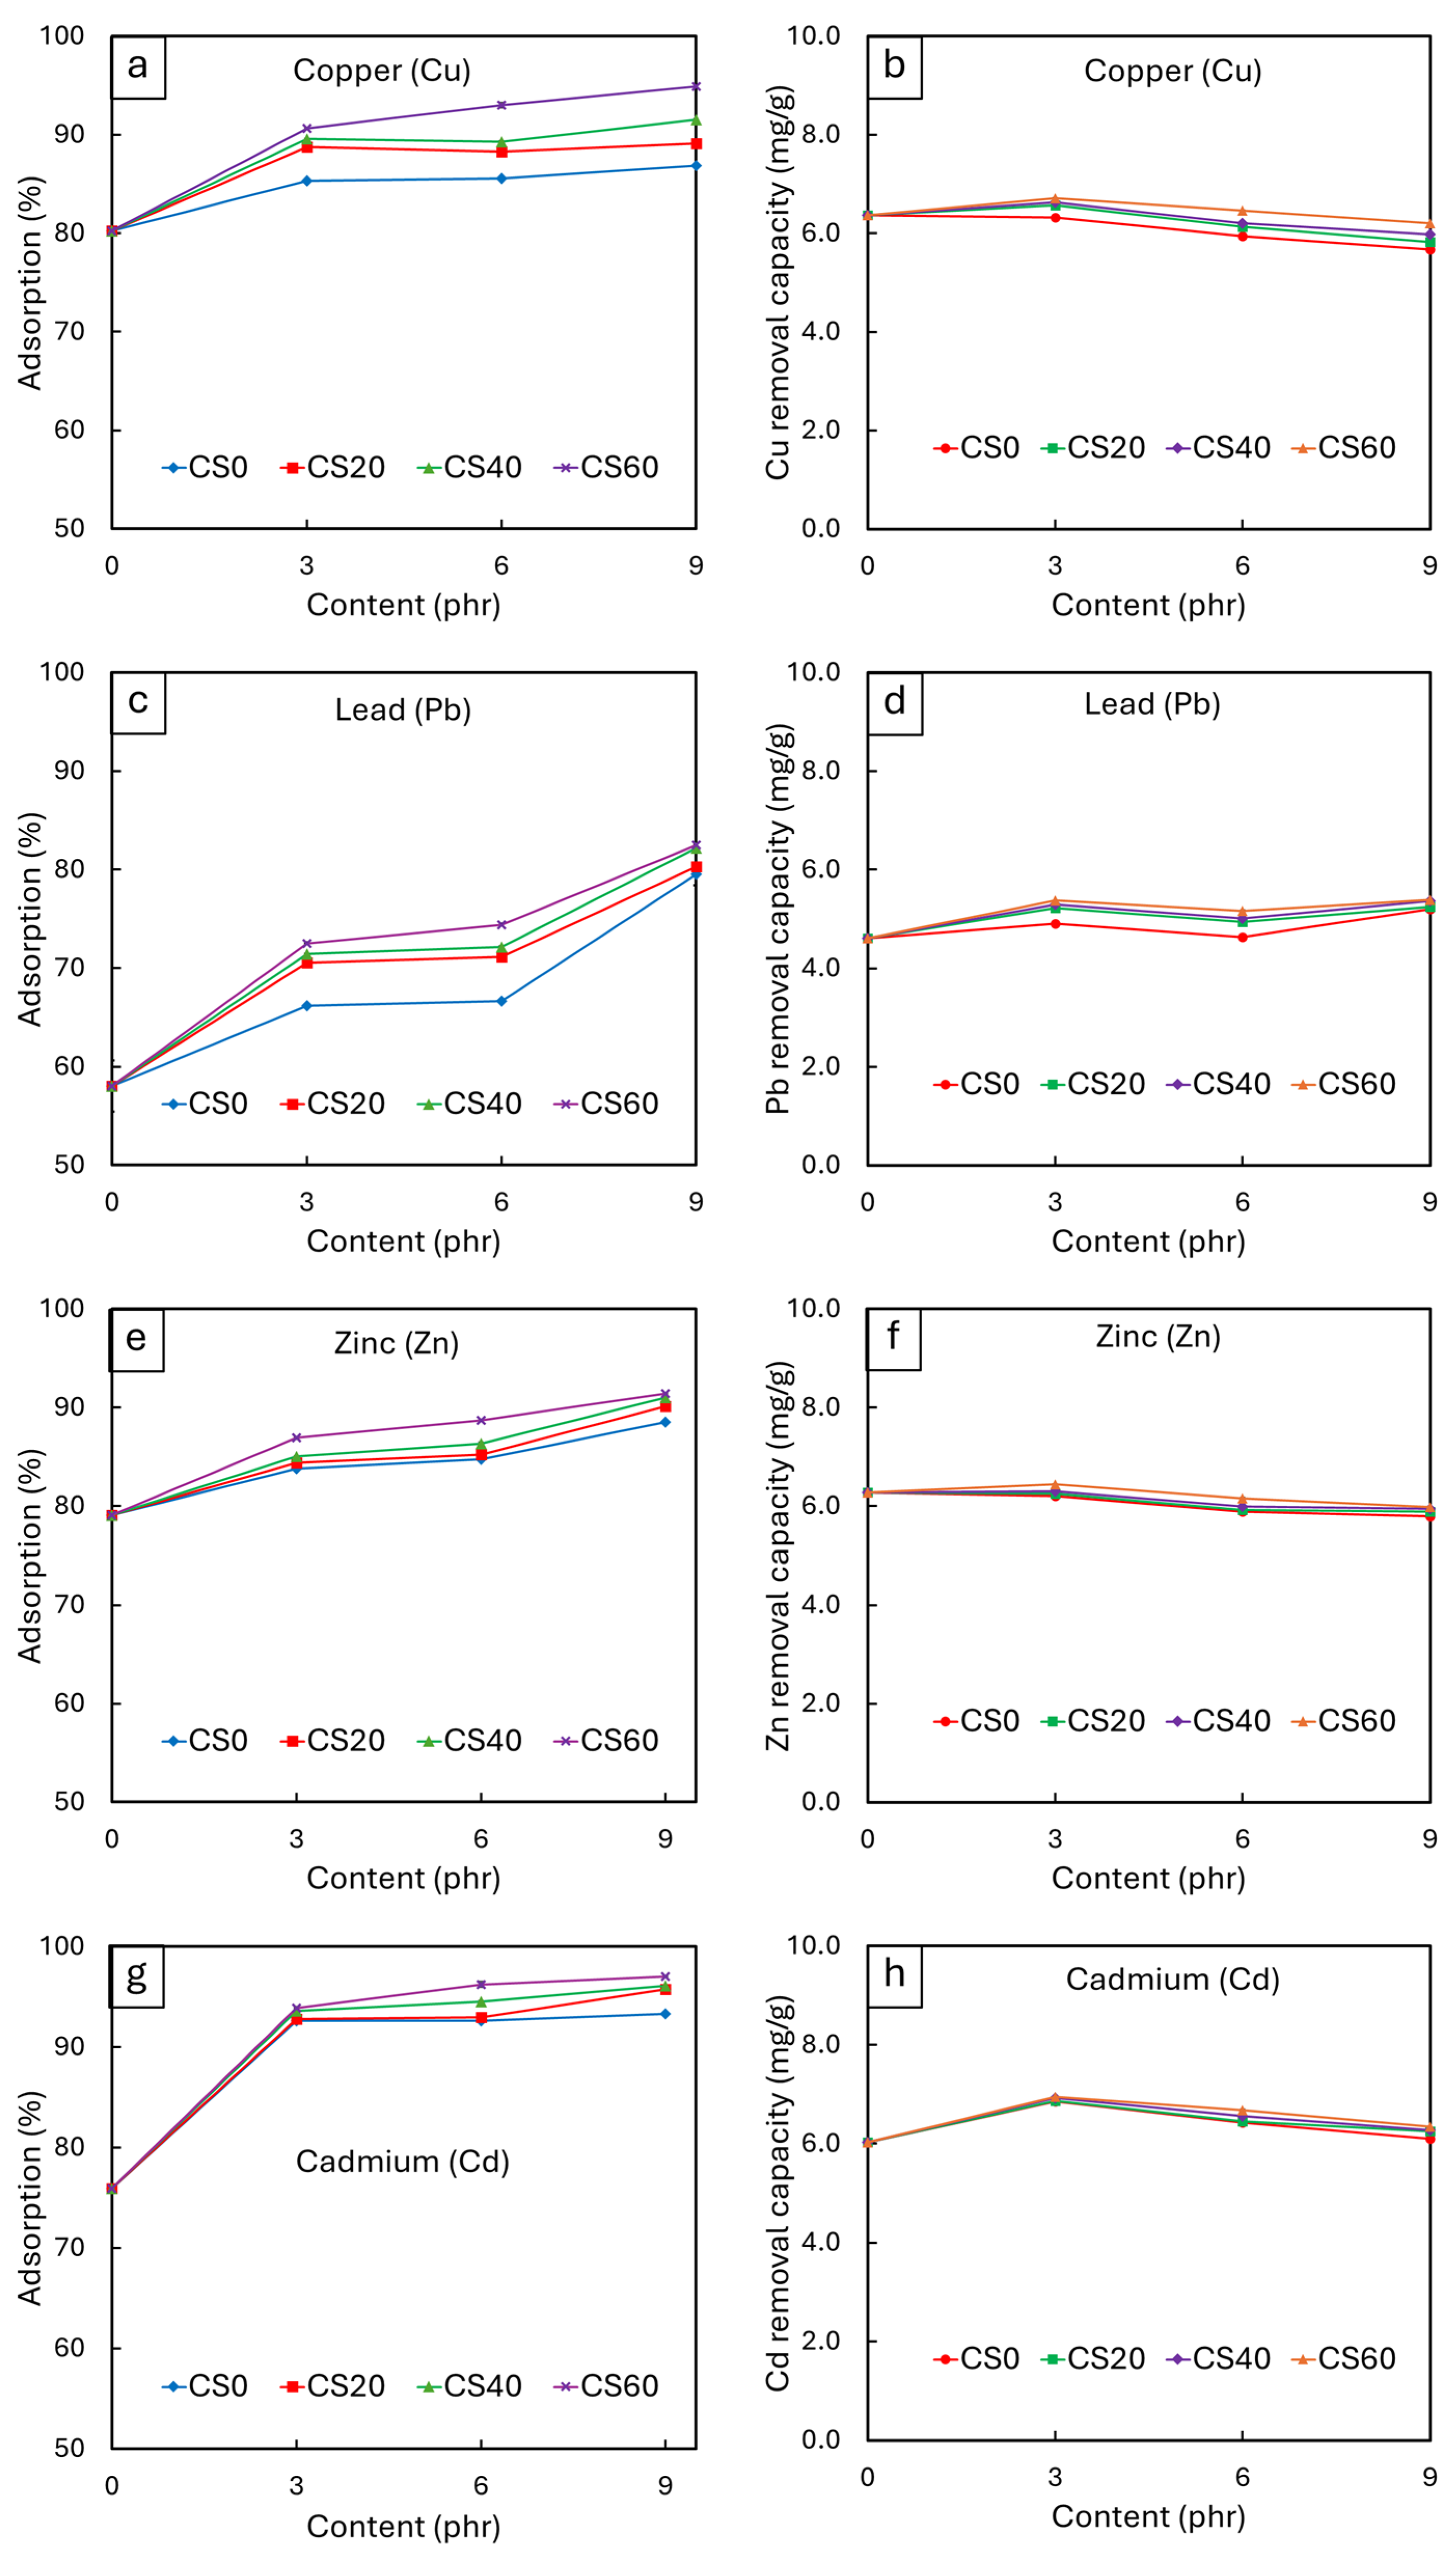
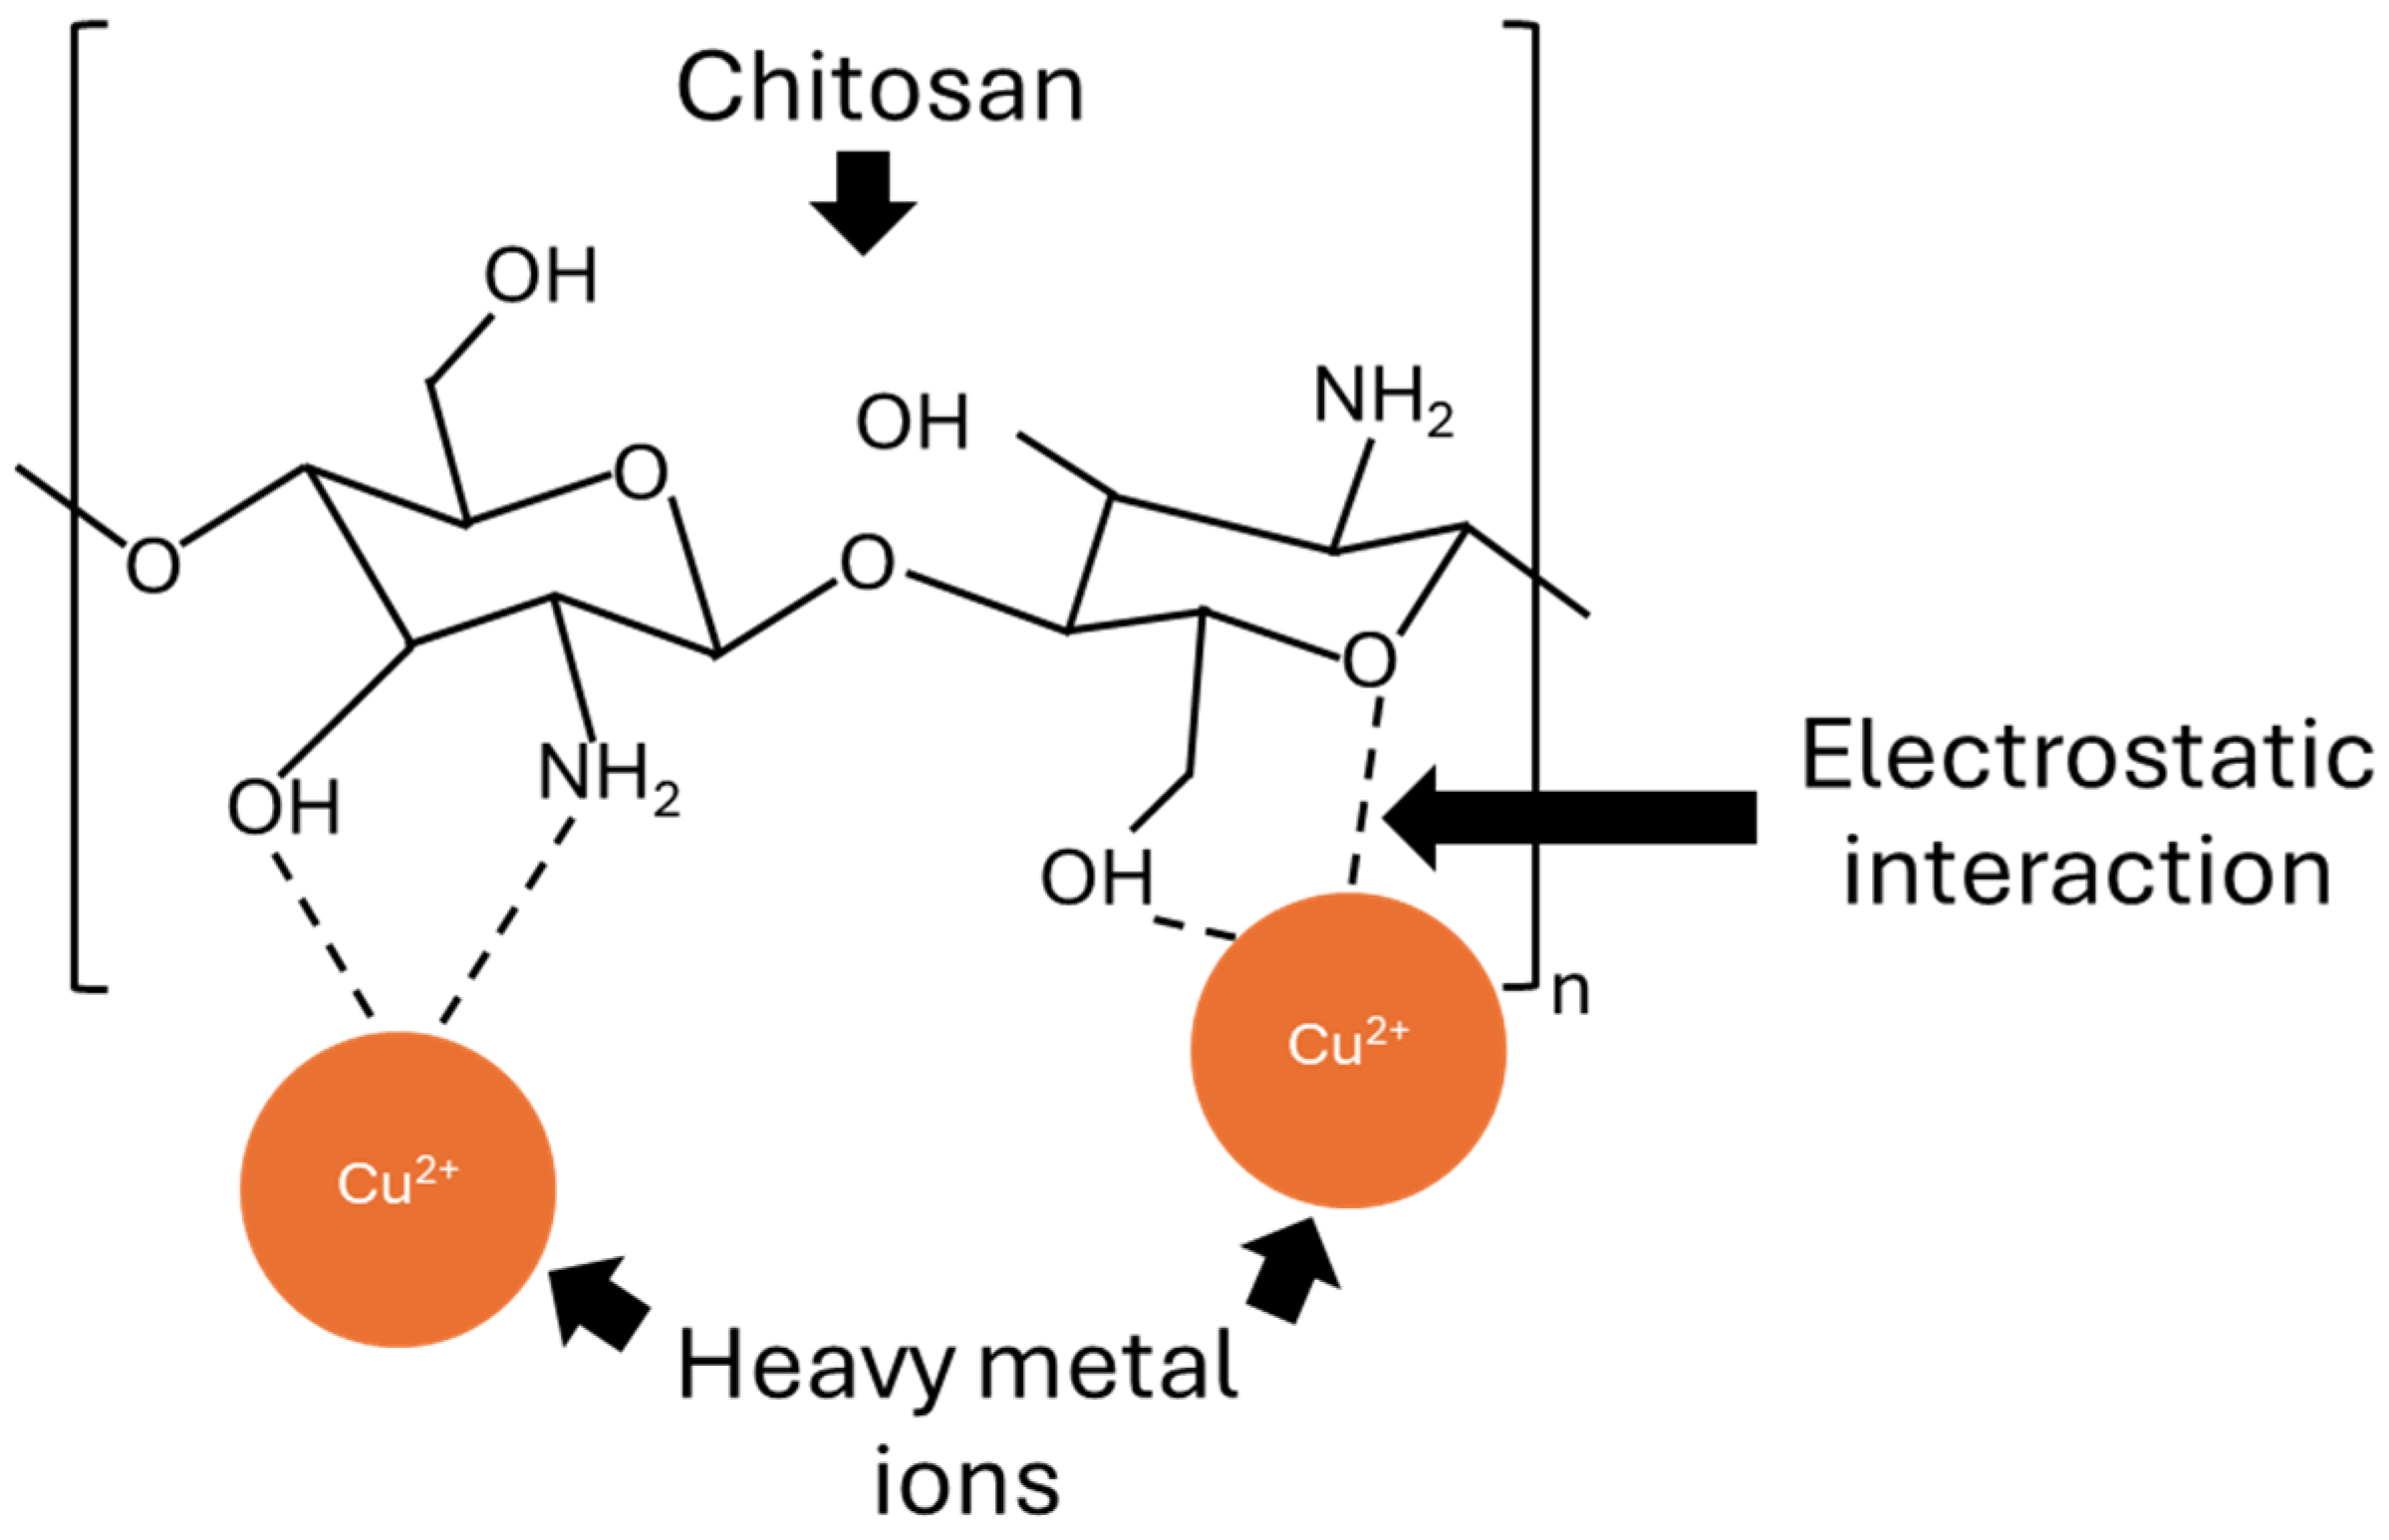
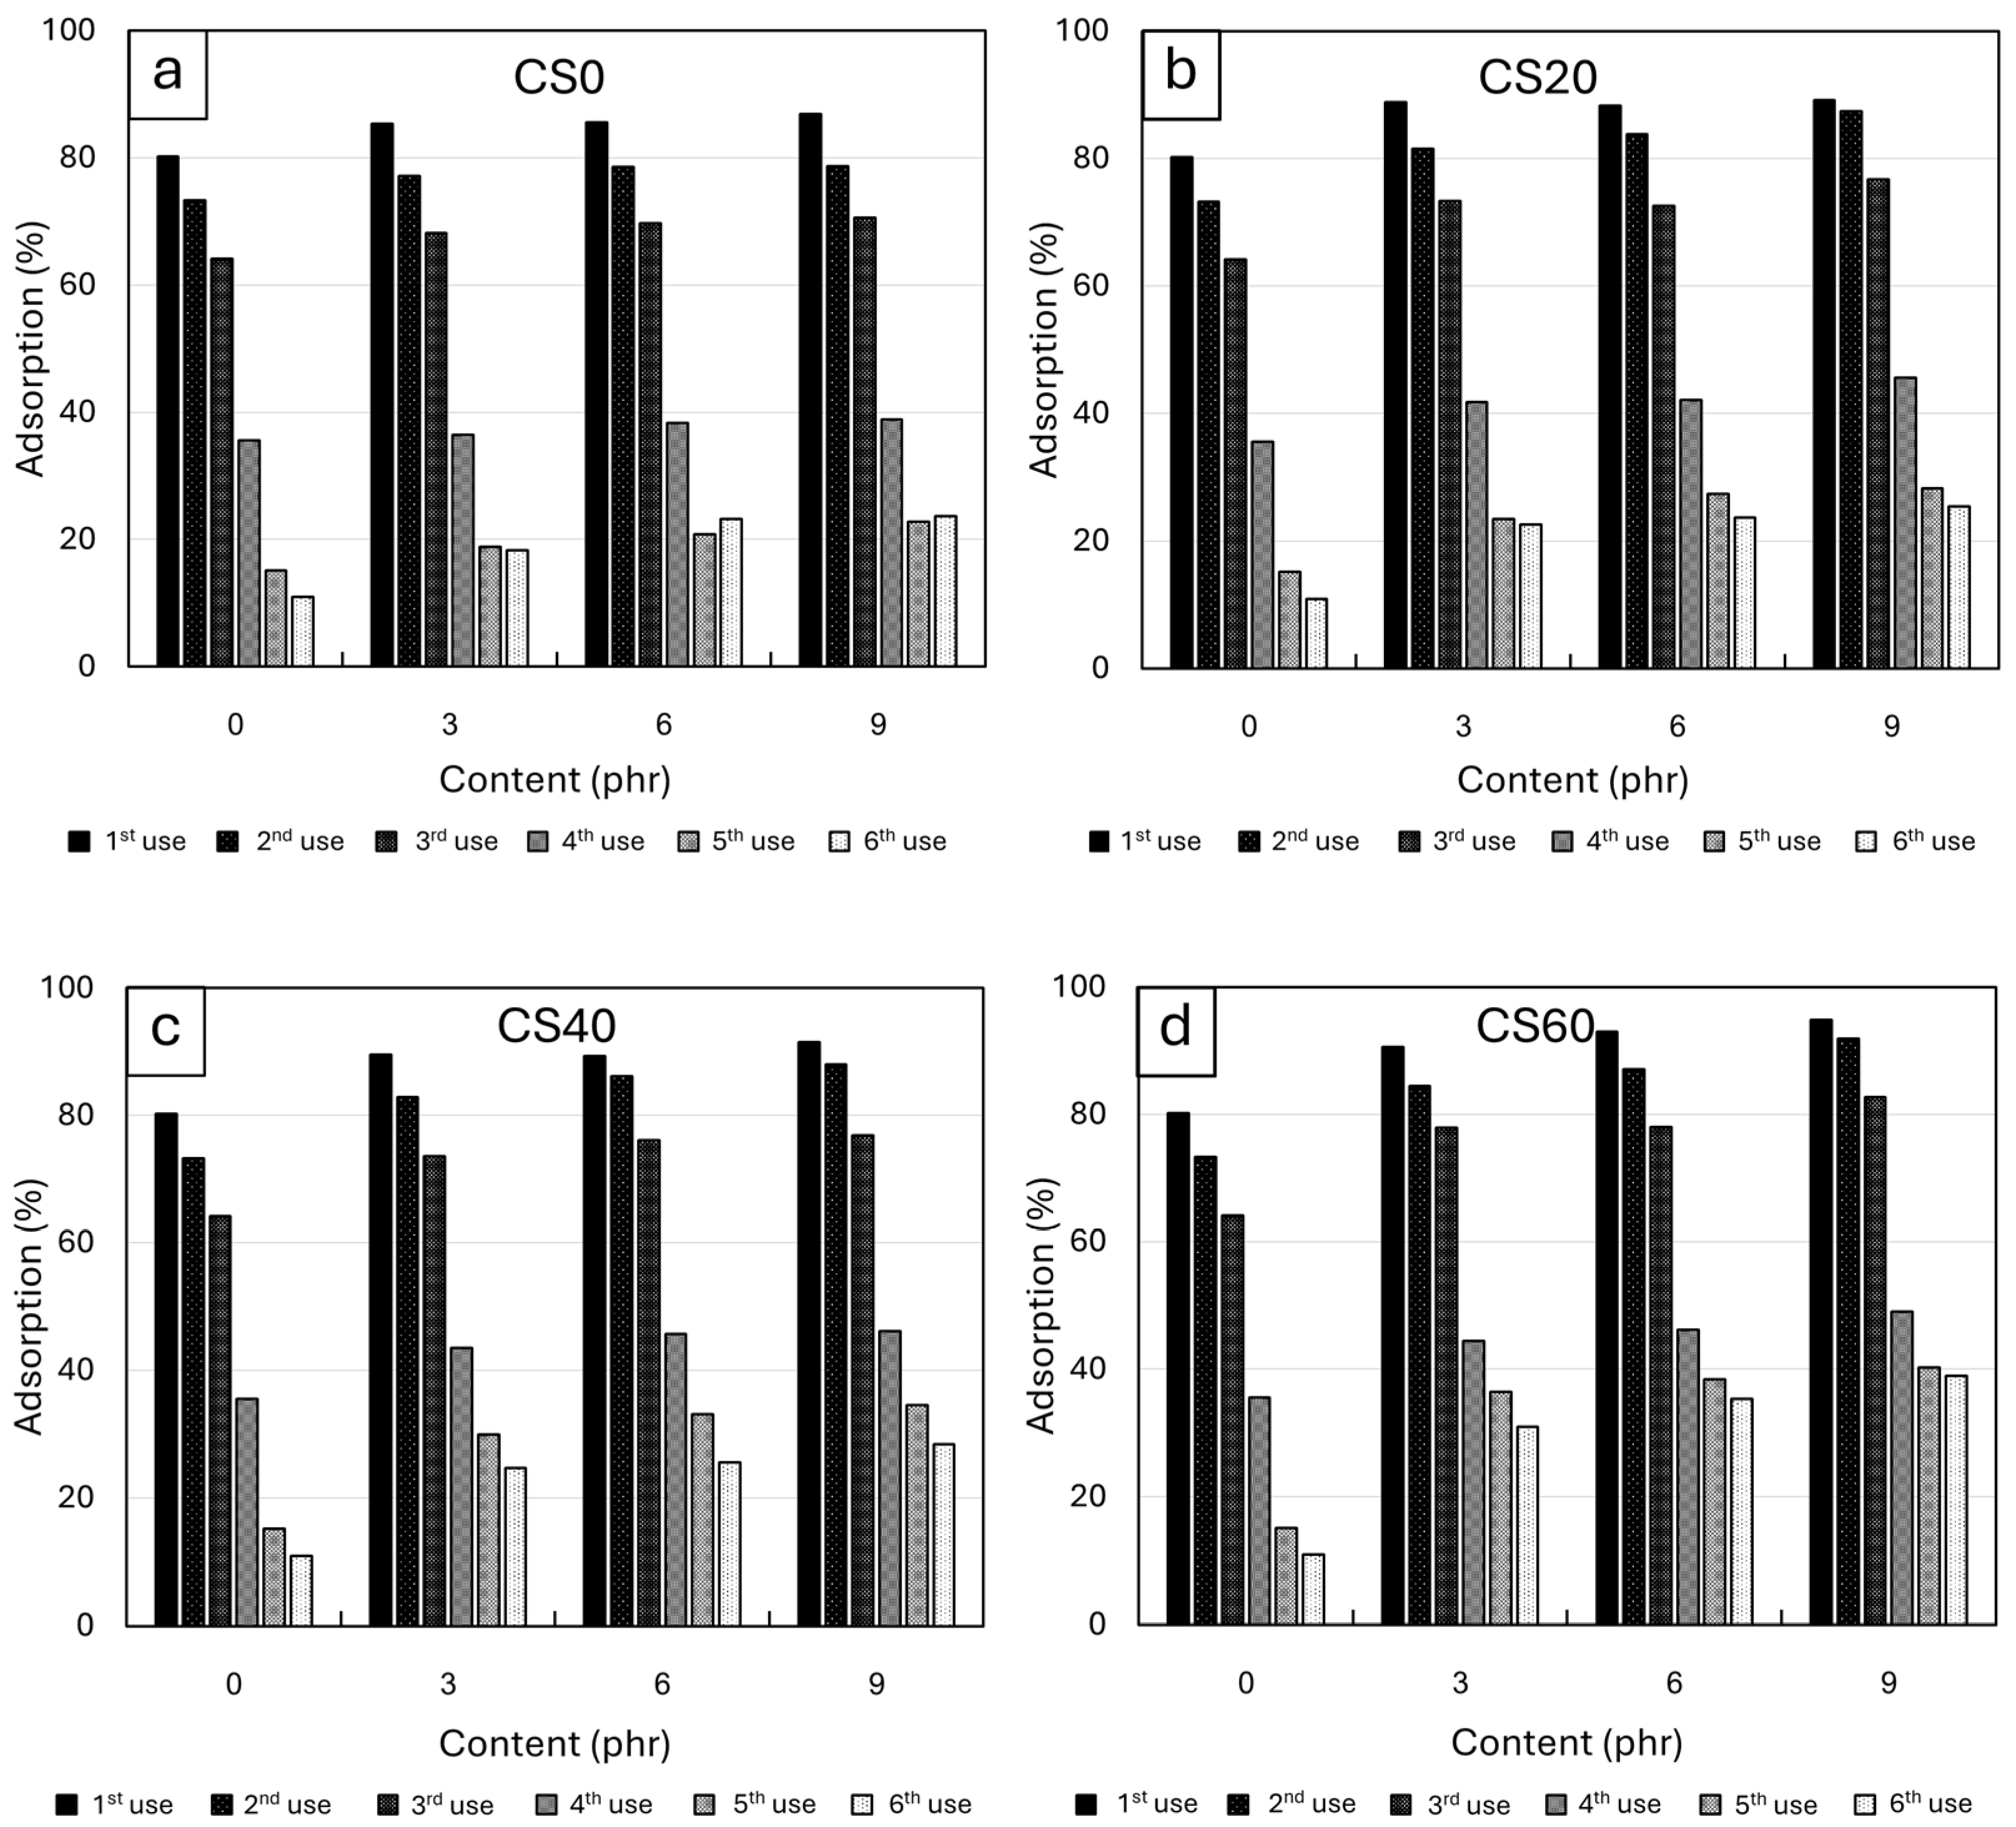
3.2.5. Heavy Metal Adsorption of NRF Containing CS Powder

The ability of NRF samples containing varying amounts of CS powder to adsorb heavy metals (Cu, Pb, Zn, and Cd) is shown in Figure 10. The results suggested that the percentage of adsorption improved with increasing CS contents (Figure 11a,c,e,g), with those containing CS60 having the highest efficiencies for all four heavy metals (determined at the same CS content). For example, the percentage of adsorption for Cu, Pb, Zn, and Cd increased from 80.2 ± 0.3%, 58.0 ± 2.3%, 79.1 ± 0.1%, and 75.9 ± 0.1%, respectively, in pristine NRF to 94.9 ± 0.1%, 82.5 ± 0.1%, 91.4 ± 0.1%, and 97.0 ± 0.1%, respectively, in NRF containing 9 phr of CS60 (determined using 3 cm × 3 cm × 2.5 cm specimens at the initial metal concentration of 25 mg/L for all samples). The increases in adsorption ability with the addition of CS powder were mainly due to the increased electrostatic attractions between Cu(II), Pb(II), Zn(II), and Cd(II) ions in the solutions and the lone electron pairs in the N atoms of the amino groups (–NH2) within the CS molecular chains, with the visual interaction between heavy metal ions and CS molecular chains shown in Figure 12 [48,49].
However, as demonstrated in Figure 11b,d,f,h, the removal capacity per unit mass of sample (mg/g) showed less pronounced dependencies on the CS contents, with the values being relatively the same or slightly different compared to pristine NRF. These observed behaviors were primarily due to the higher densities of samples containing CS powder (Table 3), which resulted in lower volumes and, hence, reduced surface areas of NRF being submerged in the metal solutions compared to pristine NRF of equal mass. This subsequently suppressed the effects of CS in enhancing the heavy metal removal capacity of NRF. It should be noted that all the NRF samples in this work generally had higher efficiencies in the adsorption of Cu, Zn, and Cd compared to Pb. This difference in adsorption ability between these heavy metals could have been due to the smaller ionic radii of Cu(II), Zn(II), and Cd(II) compared to that of Pb(II) ions (the ionic radii of Cu(II), Pb(II), Zn(II), and Cd(II) ions are 73 pm, 120 pm, 74 pm, and 97 pm, respectively), allowing the former ions to more effectively interact with the amino groups via electrostatic attractions, hence better adsorption abilities [48]. These findings were in agreement with the reports by Rangel-Mendez et al., who showed that CS selectivity for removing Cu(II) was higher than that for Cd(II) and Pb(II), with the mass adsorbed for these heavy metals being 0.036, 0.016, and 0.01 mmol/g, respectively (determined at the equilibrium of 0.1 mmol/l) [50].
In order to assess the reusability of NRF for heavy metal adsorption, the NRF samples underwent Cu adsorption tests for a total of six cycles, with the testing procedure outlined in Section 2.5.5. As shown in Figure 13, the results revealed a gradual decrease in the adsorption ability of all samples to approximately 10–30% by their sixth use, with the final values varying depending on the contents and types of CS added to the NRF. These reductions in adsorption ability could be attributed to several factors. Firstly, Cu atoms may have already attached to the porous structures of NRF samples from previous uses, hindering further adsorption capacity of the samples. Secondly, the heat applied to dry the NRF after each adsorption test may contribute to the degradation of the NRF, affecting its pore characteristics and rigidity, subsequently lowering the ability of the NRF to adsorb more Cu(II) ions. Nonetheless, the reusability tests indicated that the developed NRF samples containing CS powder maintained a relatively high adsorption ability up to their third use, with the percentage of Cu adsorption being as high as 83% in the NRF containing 9 phr of CS60.

4. Conclusions

This study demonstrated the promising potential of utilizing NRF with the addition of gamma-synthesized CS powder as an efficient and environmentally friendly method for treating industrial wastewater contaminated with heavy metals (Cu, Pb, Zn, and Cd). By systematically varying the gamma dose applied to the CT powder prior to deacetylation and then incorporating the resulting CS powder into NRF, substantial improvements in properties relevant to wastewater treatment were observed, especially in the enhancement of heavy metal adsorption capacity, with the percentages of Cu, Pb, Zn, and Cd adsorption being as high as 94.9 ± 0.1%, 82.5 ± 0.1%, 91.4 ± 0.1%, and 97.0 ± 0.1%, respectively, in the 9 phr CS60/NRF samples, determined using 3 cm × 3 cm × 2.5 cm specimens at the initial metal concentration of 25 mg/L for all samples. As a result, it can be concluded that the addition of gamma-synthesized CS powder effectively enhanced heavy metal removal capacities of the NRF samples. Additionally, this approach aligned with the principles of the circular economy by reusing agricultural waste for the production of new materials or valuable products, thereby contributing to current sustainability efforts. Overall, these findings underscored the potential of NRF incorporating gamma-synthesized CS powder as a practical and eco-friendly solution for addressing the challenges of industrial wastewater treatment.

Supplementary Materials

The following is available online at https://www.mdpi.com/article/10.3390/su16156282/s1: Table S1: Particle sizes of chitin (CT) and chitosan (CS), with varying gamma irradiation doses. The values are shown as mean ± standard deviation of mean.

Author Contributions

Conceptualization, K.S.; formal analysis, T.I., E.W., P.L., and K.S.; funding acquisition, K.S.; investigation, T.I., E.W., P.L., and K.S.; methodology, T.I., E.W., P.L., and K.S.; supervision, K.S.; validation, T.I., E.W., P.L., and K.S.; visualization, K.S.; writing—original draft preparation, K.S.; writing—review and editing, T.I., E.W., P.L., and K.S. All authors have read and agreed to the published version of the manuscript.

Funding

This research was funded by Kasetsart University (Bangkok, Thailand) through the Graduate School Fellowship Program and the Kasetsart University Research and Development Institute (KURDI) (Bangkok, Thailand) through grant number FF(KU) 51.67.

Data Availability Statement

Data is contained within the article and Supplementary Materials.

Acknowledgments

Technical support was provided by the Department of Applied Radiation and Isotopes, Kasetsart University, and the Rubber Authority of Thailand (RAOT). The Kasetsart University Research and Development Institute (KURDI) and the Specialized Center of Rubber and Polymer Materials in Agriculture and Industry (RPM), Faculty of Science, Kasetsart University, provided publication support.

Conflicts of Interest

The authors declare no conflicts of interest. The funders had no role in the design of this study; in the collection, analyses, or interpretation of data; in the writing of this manuscript; or in the decision to publish the results.

References

  1. Nduka, J.K.; Kelle, H.I.; Amuka, J.O. Health risk assessment of cadmium, chromium and nickel from car paint dust from used automobiles at auto-panel workshops in Nigeria. Toxicol. Rep. 2019, 6, 449–456. [Google Scholar] [CrossRef]
  2. Magdassi, S.; Grouchko, M.; Kamyshny, A. Copper nanoparticles for printed electronics: Routes towards achieving oxidation stability. Materials 2010, 3, 4626–4638. [Google Scholar] [CrossRef]
  3. Adamiec, E.; Jarosz-Krzeminska, E.; Wieszala, R. Heavy metals from non-exhaust vehicle emissions in urban and motorway road dusts. Environ. Monit. Assess. 2016, 188, 369. [Google Scholar] [CrossRef]
  4. Vardhan, K.H.; Kumar, P.S.; Panda, R.C. A review on heavy metal pollution, toxicity and remedial measures: Current trends and future perspectives. J. Mol. Liq. 2019, 290, 111197. [Google Scholar] [CrossRef]
  5. Khlifi, R.; Hamza-Chaffai, A. Head and neck cancer due to heavy metal exposure via tobacco smoking and professional exposure: A review. Toxicol. Appl. Pharmacol. 2010, 248, 71–88. [Google Scholar] [CrossRef]
  6. Hulsbosch, J.; De Vos, D.E.; Binnemans, K.; Ameloot, R. Biobased ionic liquids: Solvents for a green processing industry? ACS Sustain. Chem. Eng. 2016, 4, 2917–2931. [Google Scholar] [CrossRef]
  7. Chen, S.; Ding, Y. Tackling heavy metal pollution: Evaluating governance models and frameworks. Sustainability 2023, 15, 15863. [Google Scholar] [CrossRef]
  8. Khan, M.U.; Muhammad, S.; Malik, R.N.; Khan, S.A.; Tariq, M. Heavy metals potential health risk assessment through consumption of wastewater irrigated wild plants: A case study. Hum. Ecol. Risk Assess. 2016, 22, 141–152. [Google Scholar] [CrossRef]
  9. Khan, S.; Cao, Q.; Zheng, Y.M.; Huang, Y.Z.; Zhu, Y.G. Health risks of heavy metals in contaminated soils and food crops irrigated with wastewater in Beijing, China. Environ. Pollut. 2008, 152, 686–692. [Google Scholar] [CrossRef]
  10. Wang, B.; Bai, Z.; Jiang, H.; Prinsen, P.; Luque, R.; Zhao, S.; Xuan, J. Selective heavy metal removal and water purification by microfluidically-generated chitosan microspheres: Characteristics, modeling and application. J. Hazard. Mater. 2019, 364, 192–205. [Google Scholar] [CrossRef]
  11. Li, W.; Liu, S. Preparation and characterization of polyurethane foam/activated carbon composite adsorbents. J. Porous Mater. 2012, 19, 567–572. [Google Scholar] [CrossRef]
  12. Teodosiu, C.; Wenkert, R.; Tofan, L.; Paduraru, C. Advances in preconcentration/removal of environmentally relevant heavy metal ions from water and wastewater by sorbents based on polyurethane foam. Rev. Chem. Eng. 2014, 30, 403–420. [Google Scholar] [CrossRef]
  13. Hong, H.J.; Lim, J.S.; Hwang, J.Y.; Kim, M.; Jeong, H.S.; Park, M.P. Carboxymethlyated cellulose nanofibrils (CMCNFs) embedded in polyurethane foam as a modular adsorbent of heavy metal ions. Carbohydr. Polym. 2018, 195, 136–142. [Google Scholar] [CrossRef]
  14. Moonlek, B.; Saenboonruang, K. Mechanical and electrical properties of radiation-vulcanized natural rubber latex with waste eggshell powder as bio-fillers. Radiat. Eff. Defects Solids 2019, 174, 452–466. [Google Scholar] [CrossRef]
  15. Ninyong, K.; Wimolmala, E.; Sombatsompop, N.; Saenboonruang, K. Properties of natural rubber (NR) and wood/NR composites as gamma shielding materials. IOP Conf. Ser. Mater. Sci. Eng. 2019, 526, 012038. [Google Scholar] [CrossRef]
  16. Abidli, A.; Huang, Y.; Rejeb, Z.B.; Zaoui, A.; Park, C.B. Sustainable and efficient technologies for removal and recovery of toxic and valuable metals from wastewater: Recent progress, challenges, and future perspectives. Chemosphere 2022, 292, 133102. [Google Scholar] [PubMed]
  17. Kaczorowska, M.A.; Bozejewicz, D. The Application of chitosan-based adsorbents for the removal of hazardous pollutants from aqueous solutions—A review. Sustainability 2024, 16, 2615. [Google Scholar] [CrossRef]
  18. Thumwong, A.; Poltabtim, W.; Kerdsang, P.; Saenboonruang, K. Roles of Chitosan as bio-fillers in radiation-vulcanized natural rubber latex and hybrid radiation and peroxide-vulcanized natural rubber latex: Physical/mechanical properties under thermal aging and biodegradability. Polymers 2021, 13, 3940. [Google Scholar] [CrossRef] [PubMed]
  19. Maity, J.; Ray, S.K. Chitosan based nano composite adsorbent—Synthesis, characterization and application for adsorption of binary mixtures of Pb(II) and Cd(II) from water. Carbohydr. Polym. 2018, 182, 159–171. [Google Scholar] [CrossRef]
  20. Das, N.C.; Rahman, M.M.; Kabir, S.F. Preparation of novel clay/chitosan/ZnO bio-composite as an efficient adsorbent for tannery wastewater treatment. Int. J. Biol. Macromol. 2023, 249, 126136. [Google Scholar] [CrossRef]
  21. Upadhyay, U.; Sreedhar, I.; Singh, S.A.; Patel, C.M.; Anitha, K.L. Recent advances in heavy metal removal by chitosan based adsorbents. Carbohydr. Polym. 2021, 251, 117000. [Google Scholar] [CrossRef] [PubMed]
  22. Alvarenga, E.S.; Oliveira, C.P.; Bellato, C.R. An approach to understanding the deacetylation degree of chitosan. Carbohydr. Polym. 2010, 80, 1155–1160. [Google Scholar] [CrossRef]
  23. Dimzon, I.K.D.; Knepper, T.P. Degree of deacetylation of chitosan by infrared spectroscopy and partial least squares. Int. J. Biol. Macromol. 2015, 72, 939–945. [Google Scholar] [CrossRef]
  24. Zakaria, Z.; Izzah, Z.; Jawaid, M.; Hassan, A. Effect of degree of deacetylation of chitosan on thermal stability and compatibility of chitosan-polyamide blend. Bioresources 2012, 7, 5568–5580. [Google Scholar] [CrossRef]
  25. Heidari, F.; Razavi, M.; Bahrololoom, M.E.; Tahriri, M.; Rasoulianboroujeni, M.; Koturi, H.; Tayebi, L. Preparation of natural chitosan from shrimp shell with different deacetylation degree. Mater. Res. Innov. 2018, 22, 177–181. [Google Scholar] [CrossRef]
  26. Rashid, T.U.; Rahman, M.M.; Kabir, S.; Shamsuddin, S.M.; Khan, M.A. A new approach for the preparation of chitosan from γ-irradiation of prawn shell: Effects of radiation on the characteristics of chitosan. Polym. Int. 2012, 61, 1302–1308. [Google Scholar] [CrossRef]
  27. Darwis, S.; Pangerteni, D.S.; Abbas, B.; Puspitasari, T.; Nuryanthi, N.; Nurrochmad, A.; Airin, C.M. Molecular weight, degree of deacetylation, and acute oral toxicity evaluation of irradiated and nonirradiated chitosan using mice. Macromol. Symp. 2020, 391, 1900149. [Google Scholar] [CrossRef]
  28. ISO 124: 2014; Latex, Rubber—Determination of Total Solids Content. International Organization for Standardization: Geneva, Switzerland, 2014.
  29. ISO 126:2005; Natural Rubber Latex Concentrate—Determination of Dry Rubber Content. International Organization for Standardization: Geneva, Switzerland, 2005.
  30. Thumwong, A.; Chinnawet, M.; Intarasena, P.; Rattanapongs, C.; Tokonami, S.; Ishikawa, T.; Saenboonruang, K. A comparative study on X-ray shielding and mechanical properties of natural rubber latex nanocomposites containing Bi2O3 or BaSO4: Experimental and numerical determination. Polymers 2022, 14, 3654. [Google Scholar] [CrossRef]
  31. Unagolla, J.M.; Adikary, S.U. Adsorption characteristics of cadmium and lead heavy metals into locally synthesized chitosan biopolymer. Trop. Agri. Res. 2015, 26, 395–401. [Google Scholar] [CrossRef]
  32. Chattopadhyay, D.; Inamdar, M.S. Aqueous behavior of chitosan. Int. J. Polym. Sci. 2010, 2010, 939536. [Google Scholar] [CrossRef]
  33. Barros, I.; Guzman, L.; Taron, A. Extraction and quantitative comparison of chitin obtained from the shell of Callinectes sapidus and Penaus vannamei. Rev. UDCA Actual. Divulg. Cient. 2015, 18, 227–234. [Google Scholar]
  34. Thumwong, A.; Darachai, J.; Thamrongsiripak, N.; Tokonami, S.; Ishikawa, T.; Saenboonruang, K. Fruit peel powder as natural antioxidant and reinforcing bio-filler in natural rubber latex gloves: Cases of mangosteen, pomelo and durian. Antioxidants 2023, 12, 1119. [Google Scholar] [CrossRef] [PubMed]
  35. ISO 1856:2018; Flexible Cellular Polymeric Materials—Determination of Compression Set. International Organization for Standardization: Geneva, Switzerland, 2018.
  36. ASTM D2240-15; Standard Test Method for Rubber Property—Durometer Hardness. ASTM International: West Conshohocken, PA, USA, 2021.
  37. Garcia, M.A.; Paz, N.; Castro, C.; Rodriguez, J.L.; Rapado, M.; Zuluaga, R.; Casariego, A. Effect of molecular weight reduction by gamma irradiation on the antioxidant capacity of chitosan from lobster shells. J. Radiat. Res. Appl. Sci. 2015, 8, 190–200. [Google Scholar] [CrossRef]
  38. Nam, Y.S.; Park, W.H.; Ihm, D.; Hudson, S.M. Effect of the degree of deacetylation on the thermal decomposition of chitin and chitosan nanofibers. Carbohydr. Polym. 2010, 80, 291–295. [Google Scholar] [CrossRef]
  39. Kaya, M.; Baran, T.; Mentes, A.; Asaroglu, M.; Sezen, G.; Tozak, K.O. Extraction and characterization of α-chitin and chitosan from six different aquatic invertebrates. Food Biophys. 2014, 9, 145–157. [Google Scholar] [CrossRef]
  40. Nayan, M.B.; Jagadish, K.; Abhilash, M.R.; Namratha, K.; Srikantaswamy, S. Comparative study on the effects of surface area, conduction band and valence band positions on the photocatalytic activity of ZnO-MxOy heterostructures. J. Water Resour. Prot. 2019, 11, 357–370. [Google Scholar] [CrossRef]
  41. Duarte, M.L.; Ferreira, M.C.; Marvao, M.R.; Rocha, J. An optimised method to determine the degree of acetylation of chitin and chitosan by FTIR spectroscopy. Int. J. Biol. Macromol. 2002, 31, 1–8. [Google Scholar] [CrossRef] [PubMed]
  42. Lao, L.; Tan, H.; Wang, Y.; Gao, C. Chitosan modified poly(L-lactide) microspheres as cell microcarriers for cartilage tissue engineering. Colloids Surf. B Biointerfaces 2008, 66, 218–225. [Google Scholar] [CrossRef]
  43. Kazimierczak, P.; Benko, A.; Palka, K.; Canal, C.; Kolodynska, D.; Przekora, A. Novel synthesis method combining a foaming agent with freeze-drying to obtain hybrid highly macroporous bone scaffolds. J. Mater. Sci. Technol. 2020, 43, 52–63. [Google Scholar] [CrossRef]
  44. Jang, W.Y.; Kraynik, A.M.; Kyriakides, S. On the microstructure of open-cell foams and its effect on elastic properties. Int. J. Solids Struct. 2008, 45, 1845–1875. [Google Scholar] [CrossRef]
  45. Boonrasri, S.; Sae-Oui, P.; Rachtanapun, P. Chitosan and natural rubber latex biocomposite prepared by incorporating negatively charged chitosan dispersion. Molecules 2020, 25, 2777. [Google Scholar] [CrossRef] [PubMed]
  46. Kudori, S.N.I.; Ismail, H. The effects of filler contents and particle sizes on properties of green kenaf-filled natural rubber latex foam. Cell. Polym. 2020, 39, 57–68. [Google Scholar] [CrossRef]
  47. Kudori, S.N.I.; Ismail, H.; Shuib, R. Kenaf core and bast loading vs. properties of natural rubber latex foam (NRLF). BioResources 2019, 14, 1765–1780. [Google Scholar] [CrossRef]
  48. He, J.; Xue, H.X.; Lu, C.W.; Fan, Q.Y.; Liang, Y.; Sun, Y.; Shen, L.L.; Bai, S. The impacts of common ions on the adsorption of heavy metal. Environ. Geol. 2009, 58, 1499–1508. [Google Scholar] [CrossRef]
  49. Gomes, J.R.B.; Jorge, M.; Gomes, P. Interaction of chitosan and chitin with Ni, Cu and Zn ions: A computational study. J. Chem. Thermodym. 2014, 73, 121–129. [Google Scholar] [CrossRef]
  50. Rangel-Mendez, J.R.; Monroy-Zepeda, R.; Leyva-Ramos, E.; Diaz-Flores, P.E.; Shirai, K. Chitosan selectivity for removing cadmium (II), copper (II), and lead (II) from aqueous phase: pH and organic matter effect. J. Hazard. Mater. 2009, 162, 503–511. [Google Scholar] [CrossRef]
Figure 1. Micrograph images of (a) CT0, (b) CT20, (c) CT40, (d) CT60, (e) CT80, and (f) CT100, at magnification ×100.
Sustainability 16 06282 g001
Figure 2. Micrograph images of (a) CT0, (b) CT20, (c) CT40, (d) CT60, (e) CT80, and (f) CT100, at magnification ×10,000. Yellow circles show the formation of pores on CT surfaces.
Sustainability 16 06282 g002
Figure 3. Micrograph images of (a) CS0, (b) CS20, (c) CS40, (d) CS60, (e) CS80, and (f) CS100, at magnification ×100.
Sustainability 16 06282 g003
Figure 4. Micrograph images of (a) CS0, (b) CS20, (c) CS40, (d) CS60, (e) CS80, and (f) CS100, at magnification ×10,000.
Sustainability 16 06282 g004
Figure 5. FTIR spectra of (a) CT0, CT40, and CT80, (b) CS0, CS40, and CS80, (c) CT60 and CS60, (d) NRF containing varying contents of CS60 from 0 to 9 phr, and (e) NRF containing 9 phr of CS0, CS20, CS40, and CS60.
Sustainability 16 06282 g005
Figure 6. Micrograph images of (a) pristine NRF (0 phr) and NRF containing (b) 9 phr of CS0, (c) 9 phr of CS20, (d) 9 phr of CS40, (e) 3 phr of CS60, (f) 6 phr of CS60, and (g) 9 phr of CS60, revealing open-cell structures of NRF samples (magnification ×100).
Sustainability 16 06282 g006
Figure 7. Micrograph images of (a) pristine NRF (0 phr) and NRF containing (b) 9 phr of CS0, (c) 9 phr of CS20, (d) 9 phr of CS40, (e) 3 phr of CS60, (f) 6 phr of CS60, and (g) 9 phr of CS60. Dotted yellow circles show CS powder adhered on the surfaces or embedded in the matrix.
Sustainability 16 06282 g007
Figure 8. Morphologies of CS/NRF specimens (with different magnifications) and proposed interactions between NR and CS molecular chains through Van der Waals force.
Sustainability 16 06282 g008
Figure 9. TGA results showing (a,c) remaining weights (%) and (b,d) derivative weight loss of NRF containing (a,b) 9 phr of CS0, CS20, CS40, and CS60 and (c,d) 0, 3, 6, and 9 phr of CS60.
Sustainability 16 06282 g009
Figure 10. Mechanical properties including the (a) compression set and (b) hardness (shore OO) of NRF containing varying contents and gamma doses of CS powder. Error bars represent standard deviations of mean values.
Sustainability 16 06282 g010
Figure 11. Adsorption abilities of NRF containing varying contents and gamma doses of CS powder for (a,b) copper (Cu), (c,d) lead (Pb), (e,f) zinc (Zn), and (g,h) cadmium (Cd). (a,c,e,g) represent the percentage of adsorption (Adsorption (%)), while (b,d,f,h) represent the removal capacity per unit mass of NRF (mg/g). Error bars are not visible in the above figures due to the values being less than 1% of the average values.
Sustainability 16 06282 g011
Figure 12. Visual interactions between copper ions (Cu2+) and the CS molecular chain during the adsorption process [49].
Sustainability 16 06282 g012
Figure 13. Copper (Cu) adsorption abilities for NRF containing varying contents of (a) CS0, (b) CS20, (c) CS40, and (d) CS60, determined for a total of six cycles of use.
Sustainability 16 06282 g013
Table 1. Material formulations of natural rubber foam (NRF) containing gamma-synthesized chitosan (CS), with chemical names, contents, and roles.
ChemicalDry Content (phr)Role
60% Natural rubber latex (NRL)100Main matrix
10% Potassium oleate (C18H33KO2)1.5Foaming agent
50% Sulfur2Crosslinker
50% Zinc diethyldithiocarbamate (ZDEC)1Accelerator
50% Zinc-2-mercaptobenzthiazole (ZMBT)1Accelerator
50% WingStay-L1Antioxidant
10% Chitosan (CS)0, 3, 6, and 9Heavy metal adsorber
50% Zinc oxide (ZnO)5Activator
33% 1,3 Diphenylguanidine (DPG)0.9Secondary gelling agent
12.5% Sodium silicofluoride (SSF)1Primary gelling agent
Table 2. Viscosity of chitosan (CS) solution in acetic acid and degree of deacetylation (%DD) of CS powder prepared with varying gamma doses (0–100 kGy). Values are shown as mean ± standard deviation of mean.
SampleViscosity (cP)%DD (%)
CS01004.7 ± 0.654.7 ± 3.5
CS20295.7 ± 0.667.9 ± 3.6
CS4035.7 ± 0.675.6 ± 3.9
CS6015.7 ± 0.681.3 ± 2.0
CS8015.3 ± 0.679.6 ± 1.2
CS10015.7 ± 0.673.3 ± 0.4
Table 3. Densities of NRF containing varying contents and gamma doses of CS powder. Values are shown as mean ± standard deviation of mean.
FillerContent (phr)Density (g/cm3)
None00.14 ± 0.01
CS030.15 ± 0.01
60.16 ± 0.01
90.17 ± 0.01
CS2030.15 ± 0.01
60.16 ± 0.02
90.17 ± 0.01
CS4030.15 ± 0.01
60.16 ± 0.01
90.17 ± 0.01
CS6030.15 ± 0.01
60.16 ± 0.01
90.17 ± 0.01
Table 4. Pore characteristics (surface area, pore volume, and pore size) of NRF containing varying contents and gamma doses of CS powder. Values shown as mean ± standard deviation of mean.
FillerContent (phr)Surface Area (m2/g)Pore Volume (mm3/g)Pore Size (nm)
None01.64 ± 0.021.86 ± 0.395.03 ± 2.38
CS091.55 ± 0.022.06 ± 0.415.04 ± 2.37
CS2092.19 ± 0.052.46 ± 0.735.44 ± 2.37
CS4092.22 ± 0.032.57 ± 0.475.62 ± 2.37
CS6092.07 ± 0.042.66 ± 0.465.61 ± 2.37
CS6061.78 ± 0.022.09 ± 0.385.59 ± 2.38
CS6031.29 ± 0.051.55 ± 0.305.18 ± 2.58
Disclaimer/Publisher’s Note: The statements, opinions and data contained in all publications are solely those of the individual author(s) and contributor(s) and not of MDPI and/or the editor(s). MDPI and/or the editor(s) disclaim responsibility for any injury to people or property resulting from any ideas, methods, instructions or products referred to in the content.

