Abstract
As governments in various countries and regions issue tourism-friendly policies in the post-pandemic period, the voices for tourism consumption recovery and innovative transformation have attracted great attention. Many scholars, experts and industry professionals in the field of festivals are actively exploring efficient solutions for festival marketing and sustainability. It is worth rethinking tourists’ consumption psychology and perceived image regarding exiting festival products as well as the antecedents that affect festival loyalty. The Qingdao International Beer Festival, as one of the most influential festivals in China, was selected as the research case for this study. The main goal of this study was to investigate festival consumption promotion mechanisms by proposing a conceptual framework in which the associations between destination familiarity, product familiarity and loyal intentions (re-patronage and recommendation) were examined with mediators of overall festival image, perceived value and overall satisfaction. The moderating role of visitor involvement in the proposed framework was also adequately demonstrated. Moreover, the causal recipes for loyalty intentions have also been identified by employing a fuzzy-set qualitative comparative analysis (fsQCA) and a necessary condition analysis (NCA). The research findings are expected to provide a significant reference for the recovery and improvement in competitiveness of the entire festival industry.
1. Introduction
With the friendly travel policies issued by various countries and regions, how to deal with the forthcoming return of potential leisure tourists and provide high-quality travel experience has become the focus of tourism scholars and practitioners during the post-pandemic era [1,2,3,4]. The numerous existing studies about hotel and tourism management pay considerable attention to customer experience and behavior, employee psychology and work performance, the sustainable development of hospitality and tourism industry, etc. [5,6,7,8,9]. In the field of festival tourism, tourist experience quality, perceived image and behavioral intentions toward a festival product as well as the sustainable development of the entire festival industry are the main issues of concern for scholars and professionals [1,7,10,11,12,13,14,15]. Compared with other types of tourism activities, festivals were in a special position and were considered to have contributed to the spread of pandemic to a certain extent, and many countries and regions restricted and suspended the holding of some festivals during the pandemic [14,15]. In particular, for a beer festival, it would be fair to state that health risks generally would be higher, as people drinking beer may have reduced inhibitions, hygiene would need to be high, etc., and as such, individuals may have negative images and consumption intentions toward various festivals during the pandemic, including beer festivals. It is a fact that in the past nearly three-year pandemic, the stagnation of festival tourism has actually brought losses in multiple aspects involving regional economies, cultural transmission and the sustainable development of communities and society [1,14,15]. Thus, a research question has been proposed regarding how to promote the formation of a healthy festival consumption mechanism; specifically, it is meaningful to reexamine the associations among tourists’ cognitions and affections (e.g., familiarity, perceived image, value, involvement and satisfaction), as well as their behavioral intentions toward festivals (re-patronage intention and recommendation intention). This is also a crucial research issue in the beer festival tourism context.
The festival recovery in the post-pandemic era cannot be separated from efficient festival marketing, and more scientific attention needs to be paid to healthy festival consumption promotion mechanism [14,15,16,17], which would help improve tourists’ evaluations of existing festival tourism products and contribute to the sustainable development of festival tourism to a large extent. There has been a marked change in customers’ attitudes and risk perception of consuming tourism products/services, and the perceived image plays a significant role in affecting their behavioral intentions after the pandemic [1,16,17,18,19]. Previous studies indicated that tourists tend to visit the low-risk tourism areas and consume those tourism products and services that are more familiar to them [7,18,20,21,22,23]. Meanwhile, whether in the pre- or post-pandemic period, one point that needs to be noted is that tourist consumption decision-making seems to be inseparable from the antecedents of image, perceived value and satisfaction, which play significant roles in driving tourist loyalty intentions [7,23,24,25,26]. These antecedents are derived from existing classical theories in the fields of marketing and psychological behavior, including the theory of value chain (TVC), the theory of consumption value (TCV), the image theory (IT) and the American customer satisfaction index (ACSI) model [1,26,27,28,29].
In addition, tourists’ consumption behavior also depends on their familiarity and involvement with the relevant products/services to a large extent [18,21,22,25,30,31]. Based on electronic word of mouth (eWOM), the information adoption model and the signaling theory, individuals rely on external information, cues and signals to inform their decisions [32,33,34]. As such, differing knowledge, information and experiences may cause them to generate various degrees of familiarity, involvement, impressions and behavioral intentions toward a product/service. This is apparently evidenced by the phenomenon that tourists were less active in consuming festival tourism products during the pandemic [14,15,17], and some tourists do have a negative impression of or emotion toward festival tourism products and avoid participating in any form of festival activities. Thus, the significance of cultivating a positive festival image seems to be the trending subject for festival sustainability [1,12,17,19]. Also, it makes sense to grasp the important role of tourists’ familiarity and involvement with a festival product in affecting their perceived image, perceived value, satisfaction and behavioral intentions, which would provide a basis for festival recovery and transformation.
In general, the perceived image and value of tourists are vital evaluation indicators for their satisfaction and loyalty intentions [23,26,35]. In the context of festival tourism, individuals’ familiarity or involvement with festival-related products and activities and the host place of a festival are also the factors that greatly influence their travel experience and perception image during the trip [11,30,36,37]. Historic studies have emphasized that destination familiarity and personal involvement can positively influence tourist satisfaction and behavioral loyalty through perceived image [21,22,30,31,38]. To the best of our knowledge, no research has been carried out regarding the assessment of relations among familiarity, involvement, image, perceived value, satisfaction and loyalty intentions for consuming the festival tourism products, especially in a new normative era spawned by the pandemic.
Given the aforementioned research significance and gaps, the Qingdao International Beer Festival, as one of the four major beer festivals worldwide and the largest festival in China [39], is nominated as the research case for this study. Meanwhile, four research objectives are formulated. The first objective is to analyze the significance of the proposed interrelations among variables of destination familiarity, product familiarity, overall festival image, perceived value, overall satisfaction, re-patronage intention and recommendation intention. Second, the relative significance and mediation effects of model constructs are determined for predicting festival travelers’ loyalty intentions. Third, the multi-group invariance is assessed to evaluate the moderating role of visitor involvement in the proposed relationships. Fourth, an fsQCA is employed to investigate the nonlinear/asymmetrical effects from study variables on outcome variables (i.e., re-patronage intention and recommendation intention), and an NCA is carried out to identify the necessary conditions for loyalty intentions. This is based on the fact that festival tourists’ decision-making is a complex process that may depend on the potential causal recipes for loyalty intentions. Lastly, the relevant theoretic and managerial implications are further discussed to provide reference for the resurgence, marketing and competitiveness of festival products.
The structure of the rest of this study includes five sections. The hypothesis argumentation is clarified in the Section 2 (Literature Review). The Section 3 (Methodology) includes research background, measurement items of study variables, data collection and sample profiles. The Section 4 (Results) consists of common method variance examination, confirmatory factor analysis of the measurement model, structural equation modeling analysis, moderation analysis, fsQCA and NCA. The Section 5 (Conclusions) reveals insightful theoretical, social and managerial implications, which can propose viable solutions for increasing the efficiency of the promotion of relevant festivals/events and the implementation of their adequate management. The Section 6 points out the limitations of the study and potential research prospects.
2. Literature Review
2.1. Relationship between Familiarity and Overall Festival Image
Familiarity refers to the knowledge and/or experience that consumers have about a tourism destination or product/service, influencing individuals’ travel perceptions and behavioral intentions [21,22,31]. Marketing and tourism research has emphasized the importance of destination and product familiarity [21,31,40]. Destination familiarity refers to consumers’ travel experiences and their affective connection with a certain destination, while product familiarity depends on multiple facets with regards to customers’ actual consumption or use experience of a certain a product, information search and advertising exposure frequency [21,40].
Image is defined as the perceptions and impressions of individuals of a particular destination, event, activity or person, reflecting their beliefs or prejudices [41,42,43]. Prior tourism studies have shown that image can be hierarchized as cognitive, emotional/affective and conative/overall image [1,43,44]. Cognitive image can be described as travelers’ objective perceptions and assessments of the characteristics and performance of a tourism destination or product/service, while affective image is considered the pleasurable emotions and affections that travelers feel when they travel to a certain tourist destination and consume a certain tourism product/service [36,44,45]. Overall image is identified as the fusion of multiple interactive components; it is generally evaluated from both cognitive and affective image [12,20,43,44]. Overall festival image describes visitors’ general impressions and perceptions of a particular festival [12], which relate to cognitive and affective facets such as the characteristics of the host place and festival/event organization, the affections toward festival activities, etc.
The more familiar an individual is with a place or a product, the more likely they are to generate a favorable perceived image of the place or the product [4,18,42,45,46,47], which has been verified in rural tourism, slow tourism and medical tourism. Some researchers have demonstrated that product familiarity and destination familiarity positively influence customers’ perceived image in the settings of peer-to-peer accommodation and cross-national travel [18,21,22,48]. A literary festival study verified that familiarity has a positive and direct influence on perceived quality and festival brand image, which in turn can promote the formation of festival loyalty [49]. Chirakranont and Sakdiyakorn (2022) also demonstrated that travelers’ experience quality and perceived image toward a craft beer tourism destination is closely related to their deep interest, knowledge and familiarity with the beer product itself and the beer-making process [50]. In this study, tourist familiarity involves two main aspects (destination familiarity and product familiarity), and the associations of destination familiarity and product familiarity with overall festival image deserve further examination. Thus, the hypotheses are presented below.
Hypotheses 1 (H1).
Destination familiarity positively influences overall festival image.
Hypotheses 2 (H2).
Product familiarity positively influences overall festival image.
2.2. Relationships between Overall Festival Image, Perceived Value and Overall Satisfaction
Perceived value is theorized as an overall evaluation of the benefits of the consumption of a product or service against the inputs and even scarifies of obtaining the product or service [26,51]. Satisfaction is illustrated as a psychological state of pleasure that customers feel from the consumption process, and loyalty intentions refer to individuals’ willingness to continuously engage in a specific behavior or consume a certain product or service, including revisit or re-patronage, word of mouth (WOM) and re-purchase [23,26,52]. The associations among perceived value, satisfaction and loyalty intentions have been broadly examined in studies on hospitality and tourism within different contexts, such as rural tourism, halal tourism, island tourism and green hotel [23,24,25,26,53].
The existing festival tourism studies have demonstrated that festival performance, festival quality, perceived value and festival image play a positive role in driving festival tourist satisfaction and loyalty intentions [37,54,55,56]. Festival tourists are concerned about not only the image of the festival but also the perceived value of the festival in terms of functional value, festival value and ticket price [1,37,57,58]; they usually develop an overall evaluation of the perceived value of the entire festival trip based on the performance of a series of festival attributes (e.g., festival activities, authenticity, foods, environment, atmosphere, friendliness, facilities, etc.) [37,57,58]. Tourist perceived value toward a festival is associated with festival image; a positive festival image can significantly influence the perceived value of festival tourists and their satisfaction and behavioral intentions [1,56,57,58,59]. Thus, the hypotheses are developed as shown below.
Hypotheses 3 (H3).
Overall festival image positively influences perceived value.
Hypotheses 4 (H4).
Overall festival image positively influences overall satisfaction.
2.3. Relationships between Perceived Value, Overall Satisfaction and Loyalty Intention
A study by Lee et al. (2019) on behavioral intention for Korean festival-goers indicated that festival-goers’ satisfaction is directly influenced by perceived value [60]. Armbrecht (2021) and Meeprom and Silanoi (2020) also declared that the positive relationships between festival tourists’ perceived value, satisfaction and loyalty intentions are supported [61,62]. Lban et al. (2015) examined that festival image has a direct and positive impact on tourist perceived value, which in turn increases intentions to revisit and word-of-mouth communication [58]. In the present study, loyalty intentions have two aspects, including re-patronage intention and recommendation. Thus, the hypotheses are established as shown below.
Hypotheses 5 (H5).
Perceived value positively influences overall satisfaction.
Hypotheses 6 (H6).
Perceived value positively influences re-patronage intention.
Hypotheses 7 (H7).
Perceived value positively influences recommendation intention.
Wong et al. (2015), Tanford and Jung (2017), Pai et al. (2021) and Yoon et al. (2010) demonstrated that perceived service quality and perceived value toward a festival product have a direct and positive impact on tourist satisfaction and loyalty [37,54,55,57]. These studies verified that satisfaction is a mediator in the relation between perceived value and festival loyalty. Meanwhile, the direct and positive relations between overall satisfaction and loyalty intentions, involving revisit and word of mouth, have also been tested by some researchers in the festival tourism context [60,61]. Consistent with the mentioned empirical studies, the following hypotheses are proposed.
Hypotheses 8 (H8).
Overall satisfaction positively influences re-patronage intention.
Hypotheses 9 (H9).
Overall satisfaction positively influences recommendation intention.
2.4. Moderating Role of Visitor Involvement
Involvement, originally adopted from the theory of ego involvement, is expounded as the extent to which consumers have a higher engagement in a complete consumption process, which includes the advertising, information browsing and processing of a certain product or service, as well as purchase decisions [63,64,65,66]. Involvement reflects a strong yearning or emotion to participate in something caused by one (or more) stimuli in a specific situation [66]; its interpretation can be also linked with the cognitive theory of emotion and the broaden-and-build theory. The cognitive theory of emotion claims that the existence of emotions arise from responses to stimulating situations and/or evaluations on the eliciting events, and the broaden-and-build theory suggests that positive emotions can broaden an individual’s instantaneous thought–action abilities, generating certain specific action tendencies [32,67,68]. In the case of the beer festival, festival-goers and beer consumers may have varying levels of involvement with the festival in terms of beer culture, entertainment activities, local communities, etc. These individuals’ involvement with the festival could be regarded as a kind of emotion that links with their experiences, cognitions and attachment to the festival, contributing to a high possibility of certain behavioral intentions such as re-patronage intention and recommendation intention.
The current studies on involvement have majorly debated several terms of product involvement, activity involvement, cultural involvement, personal involvement and place involvement [21,25,30]. The role of involvement in evaluating individuals’ psychology and decision-making has also received more and more attention in various tourism contexts [21,30,38,65,69,70]. In the present study, involvement refers to the visitors’ involvement with the festival based on their overall travel experiences, focusing on different degrees of motives or interests and pleasure with regards to participating in the festival. Some studies have investigated the direct or indirect relations between involvement and the factors of familiarity, image, perceived value, satisfaction and loyalty behaviors [21,25,30,65,71,72]. Nonetheless, there are few studies that have combined such variables into a comprehensive ensemble to experimentally analyze the role of visitor involvement in festival consumption psychology and decision-making from the perspective of the moderation effects of visitor involvement.
In the festival/event tourism context, visitor involvement could be linked with various elements such as festive activities, local communities and cultural atmospheres [1,30,71]. Lee and Jan (2021) declared that involvement is a multi-dimensional conception in cultural festival tourism; it mainly includes personal involvement, cultural involvement and place involvement [30]. Rivera et al. (2022) demonstrated that on a cultural festival trip, individuals’ involvement is positively linked with their familiarity [73], and it has been shown to have varying degrees of impact on cognitive image, affective image and conative image [30]. The most recent study on festival branding empirically examined the positive relation of familiarity (destination familiarity and product familiarity) with festival brand image, implying that the moderating role of involvement is worthy of investigating in festival tourism research [74]. The study about the effectiveness of background music on shopping by Hee Park et al. (2014) indicated that consumer involvement has been evidenced to have a moderation effect on the relation between familiarity and perceived image [75]. However, such an investigation is currently lacking in festival psychology and behavior research. Considering the present research background, tourists with a high level of involvement with the beer festival may participate in this festival regularly every year and thus become more familiar with the festival venue and a series of beer products, and their perceived festival image seems to be more positive. Therefore, the moderating role of visitor involvement in the relations between destination familiarity, product familiarity and festival image is expected to be examined using the following hypotheses.
Hypothesis (10a).
Visitor involvement moderates the relationship between destination familiarity and overall festival image.
Hypothesis (10b).
Visitor involvement moderates the relationship between product familiarity and overall festival image.
Tourists who are deeply involved in a certain product/service may be less concerned with perceived value while immersing themselves in the experience [38], which is more obvious in the consumption experience of festival tourism [1,74]. This echoes the viewpoint of Hwang et al. (2020) that involvement plays a significant moderating role in affecting the associations among cognitive and affective perceptions (e.g., motivations and attitudes) and pro-environmental intentions for using drone food delivery service [70]. Chi et al. (2022) examined the moderating role of community involvement in the relation between cognitive festival image and festival loyalty intentions with two mediators of affective and overall festival image [1]. Kim et al. (2015) declared that different levels of tourist perceived value, satisfaction and loyalty intentions toward a festival product are related to festival involvement [72]. Nonetheless, how involvement moderates the relationships between festival image, perceived value and satisfaction has been insufficiently explored. The moderation effects of involvement in the associations among perceived quality, satisfaction and loyalty were verified in the food festival context [11]. Dedeoğlu et al. (2019) found that involvement significantly moderates the relation between tourist perceived image and perceived service quality/value [76]. Mahasuweerachai and Qu (2011) tested the moderation effect of tourist involvement on the relationships between image, perceived value and satisfaction [77]. Thus, the following hypotheses are developed.
Hypothesis (10c).
Visitor involvement moderates the relationship between overall festival image and perceived value.
Hypothesis (10d).
Visitor involvement moderates the relationship between overall festival image and overall satisfaction.
Gârdan et al. (2020) clarified that consumer involvement with sport events plays an essential role in determining the specific behavior of hedonism consumption [78]. Rivera et al. (2022) found that satisfaction plays a mediating role in the association between visitor involvement and the intention to continually consume a cultural festival product [73]. However, the moderating effects of visitor involvement on the relationships between perceived value, satisfaction and loyalty intentions have rarely been analyzed in festival research. The significance of involvement as a moderator in assessing attitude–satisfaction–loyalty relationships has been emphasized in the study of Lai and Chen (2011), indicating that a moderating influence of involvement on the relationship between perceived value and satisfaction is potentially present [79]. Prior marketing research indicated that involvement plays a significant moderating role in affecting the relationship between perceived value, satisfaction and loyalty intentions [80,81]. Thus, the following hypotheses are developed.
Hypothesis (10e).
Visitor involvement moderates the relationship between perceived value and overall satisfaction.
Hypothesis (10f).
Visitor involvement moderates the relationship between perceived value and re-patronage intention.
Hypothesis (10g).
Visitor involvement moderates the relationship between perceived value and recommendation intention.
Festival/event consumption is partly propelled by tourists’ pursuit of hedonism and leisure, which can be reflected in the degree of their involvement [74,78]. The enduring involvement theory was applied in a study about craft beer and food festivals, indicating that an enduring involvement is related to various factors and is a crucial antecedent for predicting festivalscapes with four sub-dimensions (convenience, food/beverage quality, facility and staff), as well as festival image, perceived value, satisfaction and loyalty [74,82]. In light of such research findings, the investigation of the driving mechanism of festival consumption is inseparable from the analysis of the moderating role of visitor involvement in the formation of behavioral intentions in terms of festival tourists’ psychology and emotions [1,11,74,78]. Previous researchers indicated that involvement is more suitable and accurate as a moderator variable to investigate the relationships between cognition, affection and loyalty in the festival tourism context rather than directly investigating its direct and indirect effects [1,11,74]. The moderating influence of involvement on the relation between satisfaction and loyalty intention is supported in the context of internet shopping [80]. Likewise, San Martin et al. (2013) and Eskiler and Altunışık (2021) also found that involvement plays a crucial moderating role between tourist satisfaction and loyalty intentions [81,83]. Thus, the following hypotheses are developed.
Hypothesis (10h).
Visitor involvement moderates the relationship between overall satisfaction and re-patronage intention.
Hypothesis (10i).
Visitor involvement moderates the relationship between overall satisfaction and recommendation intention.
The proposed research model is graphically shown in Figure 1.
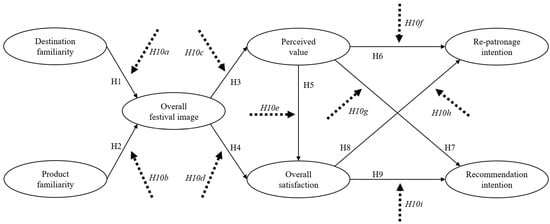
Figure 1.
Proposed research model. Note: Visitor involvement is a newly added moderator variable in the research framework, which is used to test whether various degrees of involvement in the festival affect the relationships among destination familiarity, product familiarity, overall festival image, perceived value, overall satisfaction, re-patronage intention and recommendation intention.
3. Methodology
3.1. Study Context: The Qingdao International Beer Festival
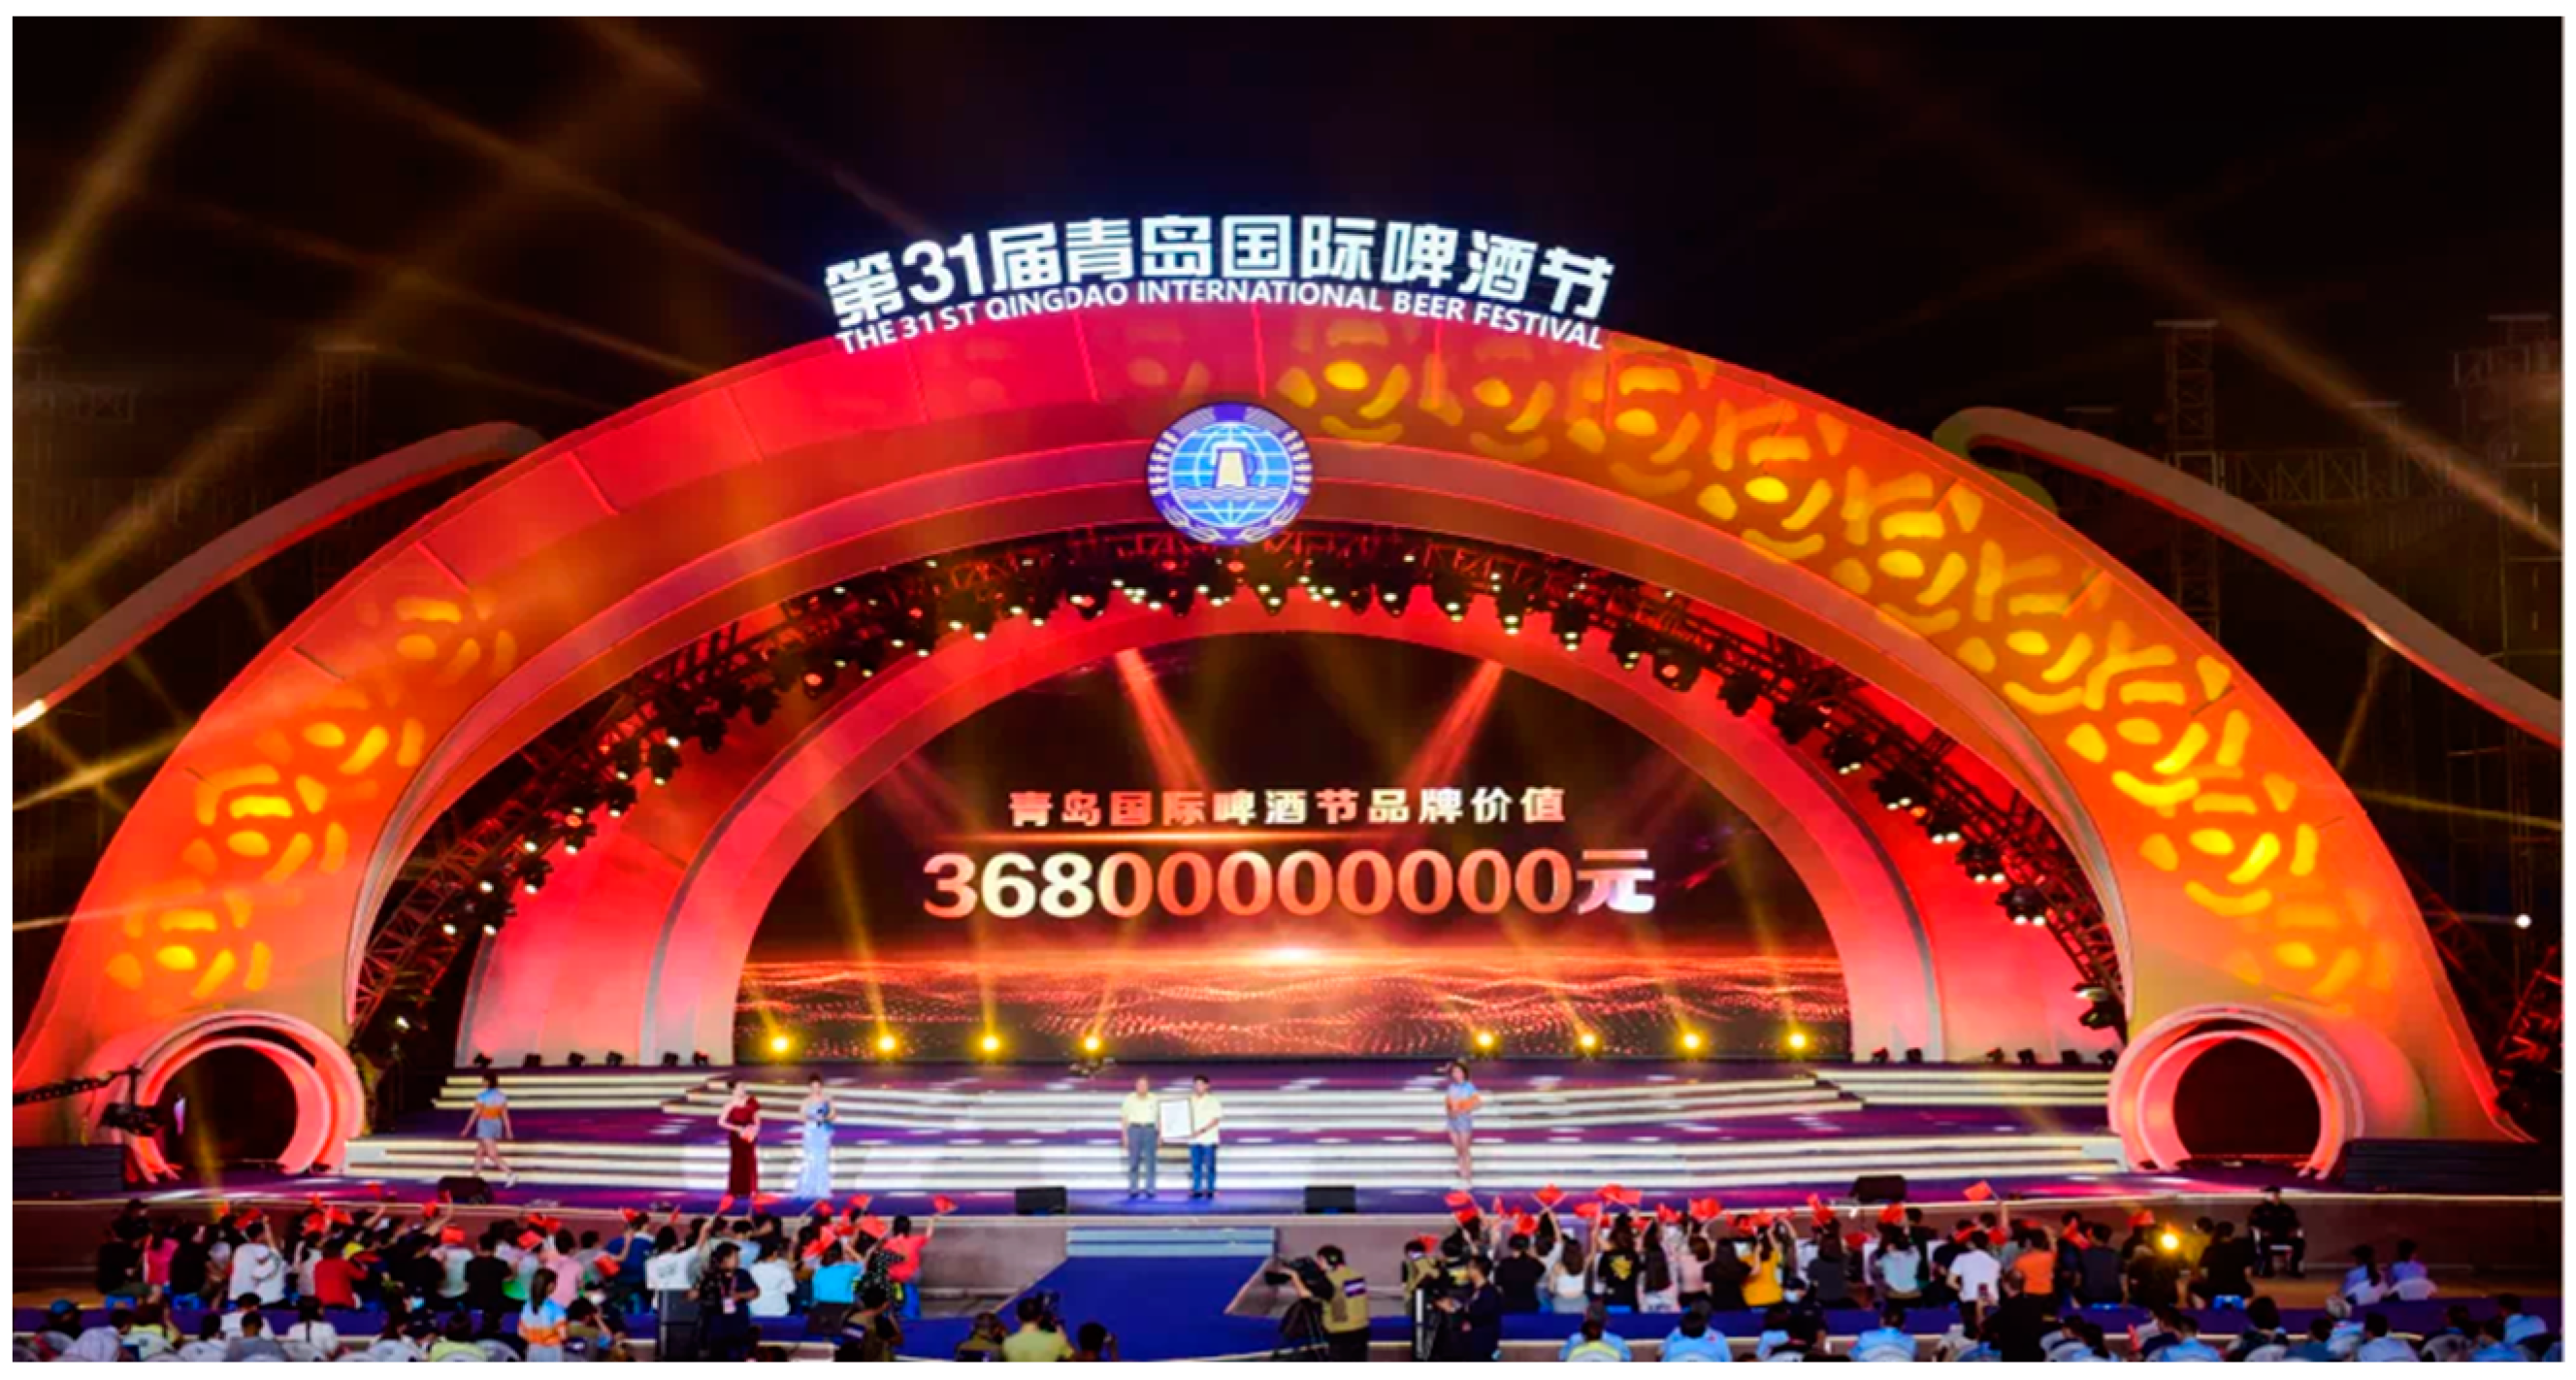
The Qingdao International Beer Festival, which was founded in 1991, opens on the second weekend of August every year and lasts for 16 days; it is a large-scale national festival that integrates tourism, culture, sports, economy and trade, highlighting the unique advantages and charm of Qingdao City [84]. It is one of the four major beer festivals in the world, along with the Munich Oktoberfest in Germany, the London Oktoberfest in the UK and the Denver Oktoberfest in the US, and has grown to be one of the largest and most influential festival products in China [39,84]. Specifically, before the pandemic, during the 28th Qingdao International Beer Festival in 2018, a total of 6.2 million tourists were received. Meanwhile, Qingdao City won the title of Beer Capital of China on 16 July 2021, and the brand value of the Qingdao International Beer Festival reached 36.8 billion RMB (see Appendix A) during the pandemic. After the pandemic, a total of 6.17 million tourists were received during the 33rd Qingdao International Beer Festival in 2023, indicating that festival tourism is beginning to recover [74] and may take longer than expected.
Tsingtao Brewery, founded in 1903, is a long-established beer manufacturer in China and the fifth largest beer manufacturer worldwide; consumers are relatively familiar with various products of Tsingtao Beer in both domestic and international markets (see Appendix B). It is well known that Qingdao is a coastal tourist city in China; Tsingtao Beer is also recognized by consumers for its product variety and brand reputation. The Qingdao International Beer Festival is familiar to and loved by a considerable number of festival-goers by virtue of its unique marketing operations and remarkable brand image [84]. Thus, it can be concluded that it is meaningful to take the festival as an example to examine the effectiveness of our proposed model.
3.2. Measurements
Each study construct had three measurement items that are well-established scales in the existing literature, which have been adjusted to be suitable in the context of Qingdao International Beer Festival. Specifically, the measurement instruments of destination familiarity and product familiarity were drawn from Elliot and Papadopoulos (2016) [48], Kuhzady et al. (2020) [21] and Chi et al. (2024) [74]. The items that measure the variables of overall festival image, perceived value, overall satisfaction, re-patronage intention and recommendation intention were derived from Al-Ansi and Han (2019) [23] and Chi et al. (2020) [26]. The measurement items for visitor involvement were obtained from Lee and Jan (2021) [30]. All items were scored with 7-point Likert scales. The specific measurement items for each study construct are exhibited in a synthetic table (see Table 1).

Table 1.
Measurement items.
3.3. Data Collection and Sample Characteristics
First of all, considering that the questionnaire could provide a broader reference for beer festivals of different scales around the world (e.g., the Munich Oktoberfest in Germany and the Busan Oktoberfest in South Korea), the survey questionnaire was initially finalized in English. Then, a pre-test was conducted to further refine the content validity of the survey questionnaire based on feedback from festival experts and practitioners. On the other hand, since the survey sample of this study included Chinese people aged 18 years and above who have attended the Qingdao International Beer Festival, the questionnaire was translated into Mandarin for data collection using the blind translation–back-translation method. The survey was administrated over a three-week period in August 2023, during the time of 33rd Qingdao International Beer Festival. A total of 356 self-administered questionnaire participants who took part in the festival experience participated in the online survey (www.wjx.cn (accessed on 1 August 2023)), which is open to the users of various social networking service (SNS) tools, including WeChat, Weibo and QQ. Among 356 respondents, some of them attended the festival before 2019 (the 1st–29th festival), and others attended the festival between 2020 and 2022 (the 30th–32nd festival) and in 2023 (the 33rd festival), not limited to the experience of the 33rd festival, ensuring sample diversity. 328 valid responses remained for data analysis via IBM SPSS-AMOS 26.0 software. The detailed demographic information and travel characteristics of the sample are shown in Table 2.
Table 2.
Demographic information and travel characteristics.
The applied methodology to test the measurement model and research hypotheses was a two-stage structural equation modeling approach [85]. Common method variance and the normality of univariate data were first calculated before measurement model testing. Afterwards, a confirmatory factor analysis (CFA) was executed to examine the quality of the measurement model, and the structural model was tested through a covariance-based structural equation modeling (SEM) analysis with the maximum likelihood method. A multi-group analysis, with the K-means cluster method, was performed to verify the role of the moderators in the proposed framework. Afterwards, the fsQCA and the NCA were carried out to examine the causal recipes and necessary conditions for outcome variables (i.e., re-patronage intention and recommendation intention).
4. Results
4.1. Common Method Variance
Considering only a single data collection method was used to measure the study constructs, the following procedures were undertaken to avoid the issue of common method variance in the data, including that the survey questionnaire was carefully designed and approved by tourism academics for its content validity and face validity, the scale instruments for study variables were separately presented in a random sequence to minimize unengaged and submissive responses and each scale instrument was described in a concise way to avoid double-barreled statements. Then, Harman’s single-factor test (1967) [86] was employed to examine common method bias, and the total variance explained was 24.911%, below the criterion of 40%, signifying that the common method variance did not inflate the results of this study, as shown in Table 3.
Table 3.
Harman’s single-factor test.
4.2. Measurement Model Analysis
As suggested by Curran et al. (1996) [87], the normality of univariate data was examined before evaluating the measurement model; all normality results (see Table 1) reported acceptable values, where the skewness values were distributed between −0.527 and 0.263 (standard error = 0.135) and the kurtosis values were distributed between −0.950 and 0.095 (standard error = 0.268). Meanwhile, the loadings of all measurement items were above the criterion of 0.50, the values of Cronbach’s alpha ranging from 786 to 0.913 were all greater than the threshold of 0.70. The suitability of the sample was measured with the Kaiser–Meyer–Olkin (KMO) calculation, and all KMO values exceeded the threshold of 0.5, indicating the effectiveness of sample size in the next factor analysis, which implied a good internal consistency among the items loaded in each factor [88,89,90].
The CFA results in Table 4 verified that the measurement model statistically fits the data (χ2 = 539.117, df = 220, χ2/df = 2.451, p < 0.001, RMSEA = 0.065, IFI = 0.964, TLI = 0.954, CFI = 0.963). The convergent validity of the measurement model was confirmed, as evidenced by composite reliability (CR) and average variance extract (AVE) values. The CR values ranged from 0.889 to 0.942, greater than the minimum threshold of 0.70; thus the internal consistency for each latent construct in the proposed model was established. The AVE values were all above the suggested criterion of 0.50 and ranged from 0.728 to 0.844; therefore, the variance in each construct was amply explained by its items, and the convergent validity existed at the measurement model level [90,91,92]. Moreover, the squared correlations among study constructs were generally lower than the AVE values, with the exception of that between perceived value and overall satisfaction. This situation has also appeared in previous studies, indicating that a portion of respondents may have similar thoughts on the evaluation of perceived value and overall satisfaction [26]. As suggested by Nunally (1978, 1994) and Rönkkö and Cho (2022), it is necessary to further compare the chi-square difference between the baseline measurement model and the generated model with combined items of these two constructs [91,92,93]. The chi-square difference was 78.16 (∆df = 8) at a significance level of 0.001, supporting the establishment of discriminant validity.
Table 4.
Results of the factor correlations and associated measures.
4.3. Structural Equation Modeling
As suggested by Macho and Ledermann’s (2011) [94], the boostrap samples were set to 2000 with a confidence interval (CI) level of 95%. Table 5 and Figure 2 present the details of SEM results and the lower-bound and upper-bound 95% CIs after performing the bias-correct percentile method. The structural model statistically fits the data (χ2 = 296.563, df = 179, p < 0.001, χ2/df = 1.657, RMSEA = 0.045, IFI = 0.979, TLI = 0.975, CFI = 0.979). Destination familiarity (β = 0.446, p < 0.05) and product familiarity (β = 0.432, p < 0.05) were significant and positive determinants of overall festival image. Therefore, H1 and H2 were established. Overall festival image positively determined perceived value (β = 0.827, p < 0.001) and overall satisfaction (β = 0.420, p < 0.001), which explained re-patronage intention (β = 0.702, p < 0.001) and recommendation intention (β = 0.619, p < 0.001). Thus, H3, H4, H8 and H9 were supported by the data. Meanwhile, perceived value also directly determined overall satisfaction (β = 0.537, p < 0.001), re-patronage intention (β = 0.319, p < 0.001) and recommendation intention (β = 0.341, p < 0.001). As a result, H5, H6 and H7 were statistically supported. The conceptual model possessed adequate explanatory power, in which about 98.2% and 87.3% of the total variance in re-patronage intention and recommendation intention was explained by its predictors.
Table 5.
Standard parameter estimates from structural equation modeling.
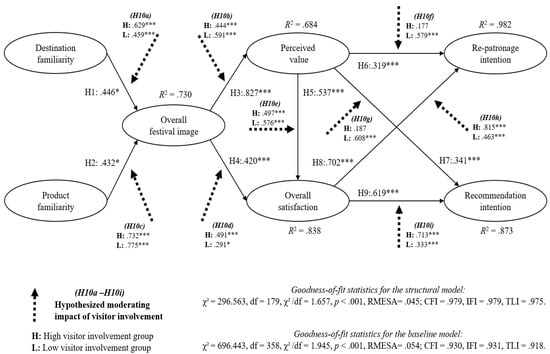
Figure 2.
Results of the structural equation model. *** p < 0.001, * p < 0.05.
The total effect of independent variable on outcome variable may be produced through various forces, including direct and indirect effects [95]. As indicated by Hayes (2009), mediation refers to the intervening influence of one variable on the relationship between other two variables, and the intervening influence may come from one or multiple variables [96]. We focus on the indirect effect in this study. Thus, the bootstrapping method was employed to conduct the mediation assessment. As shown in Table 6, the construct of destination familiarity had an indirect impact on the four study constructs; the construct of product familiarity also had an indirect impact on the four study constructs. The mediating role of overall festival image was significant, and the mediating role of perceived value was also significant.
Table 6.
Indirect impact assessment.
In the present study, the results demonstrated that the festival consumption promotion mechanism involves various determinants, including destination familiarity, product familiarity, overall festival image, perceived value, festival satisfaction and festival loyalty intentions (re-patronage intention and recommendation intention). The comprehensive investigation of the relationships among such variables can help provide specific enlightment and valuable insights for festival/event marketing, contributing to a holistic understanding of festivals/events. Based on the obtained results, it can be found that overall festival image, perceived value and overall satisfaction were identified as the vital mediators in the relations between destination familiarity, product familiarity, re-patronage intention and recommendation. This echoes previous studies that found that a high level of destination familiarity and product familiarity can contribute to festival consumption and brand marketing in terms of festival brand image, loyalty and co-creation behavior [11,74]. Meanwhile, the obtained results also revealed that perceive value had a partial mediation impact on the relation between overall festival image and overall satisfaction, and overall satisfaction had a partial mediation impact in the relations between perceived value, re-patronage intention and recommendation intention. This supports the findings of prior festival studies that tourists’ perceived quality or value and even their emotions toward a festival can affect the formation of a positive festival image, satisfaction and loyalty [1,37,54,55,56,57].
4.4. Moderation Analysis
A multi-group analysis was executed to examine the extent to which visitor involvement influences the associations among study constructs. In examining the moderating role of visitor involvement (α = 0.818), a K-means cluster method was utilized to divide the sample into two groups: high visitor involvement (n = 227) and low visitor involvement (n = 101). The baseline model comprising these two groups was produced and proven to fit the data reasonably well (χ2 = 696.443, df = 358, p < 0.001, χ2/df = 1.945, RMSEA = 0.054, IFI = 0.931, TLI = 0.918, CFI = 0.930). The chi-square difference test was employed between the baseline model and nested models, where the paths among all study constructs were restricted to be equal across groups.
The results of the chi-square difference tests showed that four paths, from perceived value to re-patronage intention (Δχ2 (1) = 5.781, p < 0.05), from perceived value to recommendation intention (Δχ2 (1) = 6.748, p < 0.01), from overall satisfaction to re-patronage intention (Δχ2 (1) = 4.493, p < 0.05), and from overall satisfaction to recommendation intention (Δχ2 (1) = 4.438, p < 0.05), were statistically different, which indicated that the positive impact of perceived value on re-patronage and recommendation intentions did not significantly exist for visitors who had a high level of involvement with the Qingdao International Beer Festival when compared to that for visitors who had a low level of involvement with the festival. On the other hand, overall satisfaction would have a stronger impact on re-patronage intention and recommendation intention among visitors who have a high level of involvement with the Qingdao International Beer Festival relative to that for visitors who have a low level of involvement with the festival. Thus, H10f, H10g, H10h and H10i were supported by the data. Figure 2 and Table 7 illustrate the results of the multi-group invariance test.
Table 7.
Results of the test for metric invariance.
4.5. Identification of Causal Recipes
The fsQCA results show the potential effective configurations (i.e., causal recipes) that can predict the generation of high and low loyalty intentions of festival tourists, including re-patronage and recommendation intentions. In the fsQCA, the recommended cut-off values for coverage and consistency are 0.2 and 0.8, respectively (Ragin, 2008) [97]. Table 8 shows the sufficient configurations of re-patronage intention. Two effective configurations describe the situation of high re-patronage intention (coverage = 0.651, consistency = 0.969). As shown in A. M1, when festival tourists have a high level of destination familiarity and product familiarity and their perceived festival image, value and satisfaction are positive, a high re-patronage intention of festival tourists can be easily achieved. Meanwhile, once festival tourists have a positive perception of destination familiarity and overall festival image and their perceived value, satisfaction and involvement are high, the formation of re-patronage intention strongly achieved (A. M2). In addition, there are also two configurations describing the low-re-patronage-intention situation (coverage = 0.662, consistency = 0.954). If festival tourists experience lower levels of destination familiarity, product familiarity, overall festival image, perceived value and satisfaction, this can lead to a lower level of re-patronage intention (~A. M1). One phenomenon that needs attention is that although festival tourists perceive high levels of destination familiarity and product familiarity, if their perceived image, perceived value, satisfaction and involvement in the festival are at lower levels, then their re-patronage intention could be negatively affected (~A. M2).
Table 8.
Sufficient configurations of re-patronage intention.
On the other hand, sufficient configurations of recommendation intention were also identified in this study, including two causal recipes (coverage = 0.607, consistency = 0.963). As shown in Table 9, if festival tourists have a high level of destination familiarity, product familiarity, overall festival image, perceived value and satisfaction, their recommendation intention can be easily improved (B. M1). Likewise, if festival tourists have a positive perception of destination familiarity and overall festival image and their perceived value, satisfaction and involvement are high, the formation of re-patronage intention is strongly achieved (B. M2). Furthermore, two causal recipes illustrate the circumstance of low recommendation intention (coverage = 0.690, consistency = 0.933). The negative recommendation intention of festival tourists can be easily induced when destination familiarity, product familiarity, overall festival image, perceived value and satisfaction are all at low levels (~B. M1). Also, even if festival visitors have stronger perceptions of destination familiarity and product familiarity, if their perceived image, value, satisfaction and involvement with this festival are at low levels, this can also result in negative recommendation intentions (~B. M2).
Table 9.
Sufficient configurations of recommendation intention.
4.6. Necessary Condition Analysis
Table 10 presents the NCA results for predicting re-patronage and recommendation intentions. Tóth et al. (2015) declared that the consistency threshold is 0.9 for identifying the necessary conditions [98]. Thus, two variables of overall festival image and overall satisfaction were defined as the necessary conditions for forming the re-patronage intention of festival tourists, with the consistency values of 0.948 and 0.956. Meanwhile, the variable of overall satisfaction with the consistency value of 0.907 was examined as the necessary condition for predicting the formation of recommendation intention. Nonetheless, the NCA findings indicate that the additional study variables have distinct degrees of importance to influence the formation of loyalty intentions of festival tourists.
Table 10.
Results of the necessary condition analysis.
5. Conclusions
The research framework proposed in this study is crucial for promoting the formation of healthy festival consumption mechanisms in the post-pandemic era. The effectiveness of the research model was adequately verified based on hypothesis testing and the elucidation of the functions of mediator and moderator variables. The present study reveals the impact of destination familiarity and product familiarity on loyalty intentions (re-patronage and recommendation) toward a beer festival, with three mediators (overall festival image, perceived value and overall satisfaction) and one moderator of visitor involvement. This not only enriches the existing festival-related literature [37,54,55,56] and the authoritative theories related to consumer psychology and behavior (e.g., the ACSI model and the TCV) [26,27,28,29] but also fills the mentioned research gaps. Compared with the previous festival tourism studies before the pandemic, this study sufficiently demonstrates that the consumption decision-making of festival tourists is a complex process, especially in the post-pandemic era; as such, the systematic identification of net effects and causal relationships is meaningful to investigate the festival consumption promotion mechanism in the post-pandemic era. The research findings obtained from qualitative and quantitative approaches, including SEM, fsQCA and NCA, jointly revealed the linear and nonlinear relationships between independent variables and outcome variables. To the best of our knowledge, this study is the first to identify the potential causal recipes for predicting behavioral intentions of festival tourists in the post-pandemic era. Research findings provide deeper knowledge for festival/event tourism research and offer guidance on festival recovery, marketing and consumption promotion mechanisms in the post-pandemic era.
5.1. Theoretical Implications
The research findings obtained in this study verified that consumers still value the quality of travel experiences, whether before or after the pandemic. In the present study, product familiarity, destination familiarity, overall festival image and perceived value were found as the key predictors of festival tourists’ loyalty intentions. This is consistent with the previous tourism studies that have closely linked perceived value, image and satisfaction with loyalty behaviors [20,22,23,26] and echoes studies emphasizing the impact of individuals’ familiarity with a certain product or destination on their perceived image and emotional and behavioral responses [21,48,74]. A recent festival study by Chi et al. (2024) [74] indicated that festival familiarity involves destination familiarity and product familiarity; it plays a positive role in promoting festival consumption, which could further accelerate festival recovery after the pandemic.
This research provides significant theoretical implications for studies on product marketing and customer behavior. At present, there is a lack of pandemic-related quantitative research that comprehensively considers the influence of four variables (i.e., product familiarity, destination familiarity, overall image and perceived value) on tourist satisfaction and loyalty. This provides insightful knowledge for research on destination image management, product advertising and tourist psychology and intentions in the post-pandemic era. Furthermore, despite the various kinds of festival-related products, there are limited qualitative and quantitative studies that specifically take a beer festival as the research object to deliberate on tourist loyalty formation mechanisms in the contexts of beer festival tourism, craft beer tourism or beer industry tourism [50]. Taking into account the segmentation of tourists and consumers (e.g., festival-goers and beer lovers) or the objective existence of niche tourism markets, this study provides s wider reference for individuals’ cognitions, affections and decision-making in additional niche tourism contexts (e.g., industrial tourism).
The moderating role of visitor involvement in the proposed framework has been verified, which is consistent with the assertion in a study by Hwang et al. (2020) [70] that involvement plays a significant moderating role in influencing the relations among individuals’ ecological beliefs, personal norms and intentions for taking pro-environmental actions. The significance of involvement in moderating the relations between festival tourists’ cognition, affections and decision-making echoes research findings from studies by Chi et al. (2022, 2024), Choo et al. (2022) and Tsai (2011) [1,11,66,74]. Also, the examination of the moderating role of involvement has also been supported in another study; that is, customers’ involvement with a certain product has a moderating effect on the relations among product design, arousal emotions and behavioral responses (re-purchase and WOM intentions) [99]. The research findings further confirmed that in the post-epidemic period, tourists’ cognitions and affections (e.g., familiarity, perceived value) as well as behavioral intentions could be specially related to their involvement with a certain tourism product and/or service. The moderation results implied that for visitors who have a high degree of involvement with the beer festival, perceived value and loyalty intentions were not significantly positively related, whereas a stronger level of satisfaction with this festival can lead to more solid re-patronage and recommendation intentions. That is, the trend of festival tourism in the post-pandemic era may show a phenomenon whereby as visitors become more involved with a festival, their loyalty intentions remain strong even if they do not generate a high level of perceived value for this festival trip [38]. This has been admitted and illustrated by narratives in previous studies showing that individuals’ involvement with a certain product, culture or place might quickly activate and shape their familiarity and build a good perceived image of such a product, culture or place, accompanied by a series of arousal emotions such as “amazement”, “attachment”, “thrill”, “pride”, “comfort” and “thankfulness” [21,30,99]. The structural invariance model with visitor involvement as a moderator provides insightful perspectives for the study of tourists’ psychological behavior in the post-pandemic period.
Another line of thought about the theoretical enlightenment for related interdisciplinary research involves psychology, product design and marketing, destination management and tourist perception and behavior. The examination results of relationships between study variables provide a meaningful reference for research in psychology, business, visual design and other disciplines. Customers’ psychological acceptance and emotional and behavioral responses (e.g., image, perceived value, satisfaction, willingness to pay a premium and WOM) could vary based on their different levels of involvement with a certain type of product, which are related to functional, aesthetic and symbolic product design in advertising marketing and online reviews [100,101]. In the post-pandemic period, it could be inferred that festival tourists’ affections and behaviors largely depend on the cultural involvement of the festival, largely linking content marketing at different levels of festival culture. From the perspective of methodology, this study employed mixed research approaches, including SEM, multi-group analysis, fsQCA and NCA. The fsQCA and NCA findings have identified the nonlinear effects of multiple independent variables on outcome variables. The studies on festival tourist behavior before the pandemic did not combine SEM with fsQCA and NCA to predict the causal recipes for evaluating the loyalty intentions of festival tourists in the post-pandemic era. The identified causal recipes provide deeper knowledge for the investigation of post-pandemic festival consumption promotion mechanisms. The necessary conditions identified in this study revealed that overall festival image and satisfaction are essential antecedents that lead to a high level of loyalty intentions, especially in post-pandemic festival consumption.
5.2. Social Implications
Festival transformation and sustainable development have always been key issues for experts and practitioners in the field of festivals in the post-pandemic era [1,14,15]. The future development trend of festival tourism requires the incorporation of social influence into strategic considerations. Pro-social and pro-environmental festival performance has become a research hotpot in the post-pandemic era [14,15]. This is because more and more consumers are increasingly paying attention to corporate social responsibility (CSR), low-carbon concepts and green brand images in the consumption process and are even willing to pay a premium for consuming pro-social and pro-environmental products or services [5,15,70]. Meanwhile, more and more tourism companies/organizations are paying attention to environmental, social and governance (ESG) aspects, including festival organizations [102,103]. Chi et al. (2024) have emphasized that pro-social and pro-environmental festival performance contributes to tourists’ behavioral intentions of participating in festival brand co-creation in the post-pandemic era [74]. The ESG performance and inputs of post-pandemic festival tourism receive greater attention, which would further enhance the familiarity, involvement, overall festival image, perceived value, overall satisfaction and loyalty intention of festival tourists, accelerating the prosperity of the festival after the COVID-19 pandemic and enhancing sustainable development of the region. Overall, in the era of experience economy, the concept of value co-creation cannot be ignored in the consumption of international festivals. It is particularly encouraged to increase inputs of environmentalism, CSR, ESG, social charity and local community construction, which could help increase tourists’ familiarity and involvement with festival activities, establish a positive festival image in a broader scope and drive tourist loyalty toward the festival.
5.3. Managerial Implications
Considering that both destination familiarity and product familiarity can positively influence festival tourists’ loyalty intentions, with mediators of overall festival image, perceived value and satisfaction, specific managerial suggestions for increasing festival familiarity need to be highlighted. With the widespread application of sharing economy and intelligent technology in social production, festival content marketing utilizing cloud live, short video content by vloggers and social media platforms such as Instagram and TikTok has become increasingly active. This can improve the creative experience of festival tourists and the social influence or reputation of post-pandemic festivals, contributing to the potential visitors’ familiarity with the festival. The related festival managers are required to adapt to utilizing macro- and micro-influencer campaigns such as livestreaming and engagement-based sponsorships to grasp consumers’ psychology and drive their consumption. Depending on the utilization of appropriate online marketing strategies will help to spread a positive online image and reputation of such tourism destinations and products through the enhancement of customers’ familiarity with them [20,22]. As such, a series of measures (e.g., celebrity endorsement and product placements in TV columns, the promotion of specialty products and advertising on SNS platforms) could be applied to increase potential customers’ familiarity and goodwill with exposure to the festival and the host city.
There is no doubt that the positive overall image, perceived value, satisfaction and loyalty intentions formed by tourists in the process of consuming tourism products or services are inseparable from the active improvement of the performance of tourism destinations and products or services [22,23,26]. In the study of festival tourism, scholars declared that festival experience, festival image and festival loyalty are influenced by various factors, including the festival program, festival area and accessibility, information adequacy, infrastructures, festival staff and volunteers, local communities, visitor–visitor interaction, souvenirs, security and food [1,12,13]. In particular, after the pandemic, tourists are more concerned about local hospitality, travel environment safety and facility hygiene; the creation of a pro-social/pro-environmental festival travel environment can further contribute to shaping and presenting a good image of festival products [14,15]. Also, it is essential for festival-related organizers and practitioners to take measures that can be conducive to tourists’ experience quality and engagement, such as conducting a wide variety of activities and programs, providing opportunities to integrate into local culture and engage with local residents, offering varied cuisines and local specialties, improving amenities and staff services, using digital technologies to increase the level of creative festival experience, etc. These measures are significant for the prosperity of the festival industry in the post-pandemic era, which would increase festival tourists’ perceived value and satisfaction, thereby promoting their attachment and loyalty behaviors toward festivals.
Another revelation is based on the moderating role of visitor involvement in the research framework. A phenomenon that can be speculated on is that visitors who have a higher involvement with the Qingdao International Beer Festival may place less emphasis on the value they actually perceive during the festival, and even if their perceived value is at a lower level, it may not significantly affect their future re-patronage and recommendation intentions. On the contrary, visitors with lower involvement would care more about perceived value of the festival, and the higher their perceived value of the festival, the stronger their future loyalty intentions. Thus, it is worth mentioning that satisfaction is always a vital predictor of loyalty intentions, regardless of whether visitors exhibit high or low involvement with the festival. Accordingly, a series of strategies that can help increase visitor involvement with the Qingdao International Beer Festival are worth excavating, which can be considered regarding both the festival itself and beer products. For instance, visitor involvement could be increased by strengthening the fun and diversity of engagement-based festive activities. Tourists are provided with opportunities to show talents, win prizes, purchase souvenirs, learn about beer culture, make craft beer, interact with locals, make friends, etc. [1,11].
Consumers’ involvement with a product is closely related to the functional, aesthetic, pro-environmental or pro-social and symbolic characteristics and design of this product, which can greatly drive their willingness to pay a premium and both traditional and electronic WOM, such as online reviews [62,67,99,101]. In the post-pandemic era, the festival tourism industry should establish a long-term concept of sustainable development, cultivating a green festival image and brand with a series of CSR and ESG practices. Festival organizers, Tsingtao Brewery, product market research departments and professional design companies should cooperate to develop appropriate product visual design and festival marketing strategies reflecting the concepts of ESG and CSR. This could further cater to the preferences of beer lovers and potential consumers, thereby enhancing festival image, competitiveness and branding in the post-pandemic era. Specifically, the packaging of beer products and the holding of the beer festival need to be conducted considering pro-social and eco-friendly strategies that could impact and further enhance the exposure, brand image and WOM of Tsingtao Beer products and the Qingdao International Beer Festival, which could further enhance the perceived value, overall satisfaction and loyalty intention of festival tourists. Lastly, the fsQCA results indicate that the formation of tourists’ loyalty intentions in the post-pandemic era is affected by the nonlinear joint influence of multiple conditions. The relevant festival industry practitioners should aim to improve not only the familiarity of the festival but also tourists’ experience quality and attachment (i.e., perceived value, image, involvement and satisfaction). Also, what needs to be noted is that the significance of study variables in the formation of loyalty is different. The reasonable allocation of resources is very important in post-pandemic festival marketing and competitiveness, especially in improving the festival image and satisfaction.
6. Limitations and Future Research
The generalizability of our research findings may not be irrefutable for the entire festival industry, as the sample only represented Chinese travelers who had the experience of attending the Qingdao International Beer Festival. Future research should carefully consider research findings and can consider validating the proposed theoretical framework with other festivals (e.g., music festival), adopting a more comprehensive survey sample. Judging from the demographic characteristics of the beer festival consumer groups, male consumers were the majority. Considering that there may be some differences in the responses of first-time and repeat festival attendees, and the number of visits and length of trip could also be different based on the varying levels of visitor involvement, several moderating variables (e.g., gender, number of visits and length of trip) are worth investigating in future studies, which can provide more knowledge for developing target market strategies. In addition, involvement is an important indicator in the investigation of tourist emotion and experience. The measurements of involvement could be further developed by including different aspects such as cultural involvement and product involvement, which can be tested by future festival tourism-related research. Lastly, marketing-related research implies that the concept of brand could have a certain impact on the consumption-driven process. Thus, it would be meaningful to develop future research proposals that combine the consumption-driven mechanism with brand-related theories, such as the CBBE model.
Author Contributions
Writing—original draft preparation, X.Z. and X.C.; writing—review and editing, X.Z. and X.C.; visualization, X.C; supervision, X.C.; funding acquisition, X.Z. and X.C. All authors have read and agreed to the published version of the manuscript.
Funding
This work was supported by the Science Research Start-Up Project for Talent Introduction in Qingdao University (project no. DC2200002420).
Institutional Review Board Statement
Not applicable.
Informed Consent Statement
Informed consent was obtained from all subjects involved in the study.
Data Availability Statement
Data are contained within the article.
Conflicts of Interest
The authors declare no conflicts of interest.
Appendix A

Figure A1.
The brand value of the Qingdao International Beer Festival. Source: https://news.sdchina.com/show/4633935.html (accessed on 16 March 2024).
Figure A1.
The brand value of the Qingdao International Beer Festival. Source: https://news.sdchina.com/show/4633935.html (accessed on 16 March 2024).
Appendix B
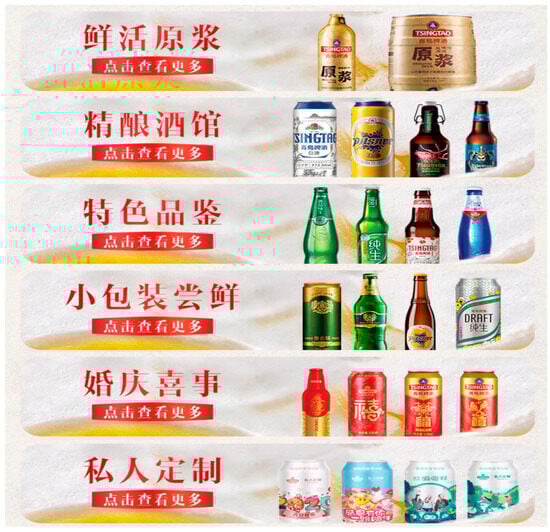
Figure A2.
Tsingtao Beer products. Source: https://shop77285301.m.youzan.com/wscshop/feature/v6BLIOpI42?sub_kdt_id=77093133 (accessed on 16 March 2024).
Figure A2.
Tsingtao Beer products. Source: https://shop77285301.m.youzan.com/wscshop/feature/v6BLIOpI42?sub_kdt_id=77093133 (accessed on 16 March 2024).

References
- Chi, X.; Meng, B.; Zhou, H.; Han, H. Cultivating and disseminating a festival image: The case of the Qingdao International Beer Festival. J. Travel. Tour. Mark. 2022, 39, 373–393. [Google Scholar] [CrossRef]
- Huang, X.; Zhang, Y.; Li, C. Assessing the Compensatory Potentiality of Hot Spring Tourism in the COVID-19 Post-Pandemic Environment. Sustainability 2022, 14, 8579. [Google Scholar] [CrossRef]
- Dias, Á.; Patuleia, M.; Silva, R.; Estêvão, J.; González-Rodríguez, M.R. Post-pandemic recovery strategies: Revitalizing lifestyle entrepreneurship. J. Pol. Res. Tour. Leis. Events 2022, 14, 97–114. [Google Scholar] [CrossRef]
- Camprubí, R.; Gassiot-Melian, A. Advances in Tourism Image and Branding. Sustainability 2023, 15, 3688. [Google Scholar] [CrossRef]
- Chi, X.; Meng, B.; Lee, H.; Chua, B.L.; Han, H. Pro-environmental employees and sustainable hospitality and tourism businesses: Exploring strategic reasons and global motives for green behaviors. Bus. Strategy Environ. 2023, 32, 4167–4182. [Google Scholar] [CrossRef]
- Kim, H.; So, K.K.F. Two decades of customer experience research in hospitality and tourism: A bibliometric analysis and thematic content analysis. Int. J. Hosp. Manag. 2022, 100, 103082. [Google Scholar] [CrossRef]
- Yang, J.; Luo, J.M.; Yao, R. How fear of COVID-19 affects the behavioral intention of festival participants—A case of the HANFU Festival. Int. J. Environ. Res. Public Health 2022, 19, 2133. [Google Scholar] [CrossRef]
- Topcuoglu, E.; Kim, H.; Kim, S.; Kim, S. Green message strategies and green brand image in a hotel context. J. Hosp. Mark. Manag. 2022, 31, 311–325. [Google Scholar] [CrossRef]
- Kádár, B.; Klaniczay, J. Branding Built Heritage through Cultural Urban Festivals: An Instagram Analysis Related to Sustainable Co-Creation, in Budapest. Sustainability 2022, 14, 5020. [Google Scholar] [CrossRef]
- Yen, I.Y.; Yu, H.A. How festival brand equity influences loyalty: The mediator effect of satisfaction. J. Conv. Event Tour. 2022, 23, 343–361. [Google Scholar] [CrossRef]
- Choo, H.; Park, D.B.; Petrick, J.F. Festival tourists’ loyalty: The role of involvement in local food festivals. J. Hosp. Tour. Manag. 2022, 50, 57–66. [Google Scholar] [CrossRef]
- Dalgiç, A.; Birdir, K. Key success factors on loyalty of festival visitors: The mediating effect of festival experience and festival image. Tour. Manag. Stud. 2020, 16, 28–38. [Google Scholar] [CrossRef]
- Cheng, H.; Liu, Q.; Bi, J.W. Perceived crowding and festival experience: The moderating effect of visitor-to-visitor interaction. Tour. Manag. Perspect. 2021, 40, 100888. [Google Scholar] [CrossRef]
- Chi, X.; Han, H.; Kim, S. Protecting yourself and others: Festival tourists’ pro-social intentions for wearing a mask, maintaining social distancing, and practicing sanitary/hygiene actions. J. Sustain. Tour. 2022, 30, 1915–1936. [Google Scholar] [CrossRef]
- Rowen, I. The transformational festival as a subversive toolbox for a transformed tourism: Lessons from Burning Man for a COVID-19 world. Tour. Geogr. 2020, 22, 695–702. [Google Scholar] [CrossRef]
- Ko, S.H.; Kim, J.Y.; Choi, Y.; Kim, J.; Kang, H.C. Storytelling festival participation and tourists’ revisit intention. Front. Psychol. 2022, 13, 968472. [Google Scholar] [CrossRef] [PubMed]
- Ossowska, L.; Janiszewska, D.; Kwiatkowski, G.; Kloskowski, D. The Impact of Local Food Festivals on Rural Areas’ Development. Sustainability 2023, 15, 1447. [Google Scholar] [CrossRef]
- Casali, G.L.; Liu, Y.; Presenza, A.; Moyle, C.L. How does familiarity shape destination image and loyalty for visitors and residents? J. Vacat. Mark. 2021, 27, 151–167. [Google Scholar] [CrossRef]
- Zhang, S.N.; Deng, F. Innovation and authenticity: Constructing tourists’ subjective well-being in festival tourism. Front. Psychol. 2022, 13, 950024. [Google Scholar] [CrossRef]
- Shi, H.; Liu, Y.; Kumail, T.; Pan, L. Tourism destination brand equity, brand authenticity and revisit intention: The mediating role of tourist satisfaction and the moderating role of destination familiarity. Tour. Rev. 2022, 77, 751–779. [Google Scholar] [CrossRef]
- Kuhzady, S.; Çakici, C.; Olya, H.; Mohajer, B.; Han, H. Couchsurfing involvement in non-profit peer-to-peer accommodations and its impact on destination image, familiarity, and behavioral intentions. J. Hosp. Tour. Manag. 2020, 44, 131–142. [Google Scholar] [CrossRef]
- Stylidis, D.; Woosnam, K.M.; Ivkov, M.; Kim, S.S. Destination loyalty explained through place attachment, destination familiarity and destination image. Int. J. Tour. Res. 2020, 22, 604–616. [Google Scholar] [CrossRef]
- Al-Ansi, A.; Han, H. Role of halal-friendly destination performances, value, satisfaction, and trust in generating destination image and loyalty. J. Destin. Mark. Manag. 2019, 13, 51–60. [Google Scholar] [CrossRef]
- Sohaib, M.; Wang, Y.; Iqbal, K.; Han, H. Nature-based solutions, mental health, well-being, price fairness, attitude, loyalty, and evangelism for green brands in the hotel context. Int. J. Hosp. Manag. 2022, 101, 103126. [Google Scholar] [CrossRef]
- Li, Q.; Li, X.; Chen, W.; Su, X.; Yu, R. Involvement, place attachment, and environmentally responsible behaviour connected with geographical indication products. Tour. Geogr. 2023, 25, 44–71. [Google Scholar] [CrossRef]
- Chi, X.; Lee, S.; Ahn, Y.; Kiatkawsin, K. Tourist perceived quality and loyalty intentions towards rural tourism in China. Sustainability 2020, 12, 3614. [Google Scholar] [CrossRef]
- Porter, M.E. The value chain and competitive advantage. Underst. Bus. Process. 2001, 2, 50–66. [Google Scholar]
- Roh, T.; Seok, J.; Kim, Y. Unveiling ways to reach organic purchase: Green perceived value, perceived knowledge, attitude, subjective norm, and trust. J. Retail. Consum. Serv. 2022, 67, 102988. [Google Scholar] [CrossRef]
- Angelova, B.; Zekiri, J. Measuring customer satisfaction with service quality using American Customer Satisfaction Model (ACSI Model). Int. J. Acad. Res. Bus. Soc. Sci. 2011, 1, 232–258. [Google Scholar] [CrossRef]
- Lee, T.H.; Jan, F.H. How does involvement affect attendees’ aboriginal tourism image? Evidence from aboriginal festivals in Taiwan. Curr. Issues Tour. 2021, 24, 2421–2444. [Google Scholar] [CrossRef]
- Lee, G.; Tussyadiah, I.P. Exploring familiarity and destination choice in international tourism. Asia. Pac. J. Tour. Res. 2012, 17, 133–145. [Google Scholar] [CrossRef]
- Rahman, M.S.; Mannan, M. Consumer online purchase behavior of local fashion clothing brands: Information adoption, e-WOM, online brand familiarity and online brand experience. J. Fash. Mark. Manag. Int. J. 2018, 22, 404–419. [Google Scholar] [CrossRef]
- Leong, C.-M.; Loi, A.M.-W.; Woon, S. The influence of social media eWOM information on purchase intention. J. Mark. Anal. 2021, 10, 145. [Google Scholar] [CrossRef]
- Ballina, F.J.; Valdes, L.; Del Valle, E. The signalling theory: The Key role of quality standards in the hotels performance. J. Qual. Assur. Hosp. Tour. 2020, 21, 190–208. [Google Scholar] [CrossRef]
- Qu, Z.; Cao, X.; Ge, H.; Liu, Y. How does national image affect tourists’ civilized tourism behavior? The mediating role of psychological ownership. J. Hosp. Tour. Manag. 2021, 47, 468–475. [Google Scholar] [CrossRef]
- Slabbert, E.; Martin, S. Aspects influencing the cognitive, affective and conative images of an arts festival. Afr. J. Hosp. Tour. Leis. 2017, 6, 1–16. [Google Scholar]
- Tanford, S.; Jung, S. Festival attributes and perceptions: A meta-analysis of relationships with satisfaction and loyalty. Tour. Manag. 2017, 61, 209–220. [Google Scholar] [CrossRef]
- Altunel, M.C.; Erkurt, B. Cultural tourism in Istanbul: The mediation effect of tourist experience and satisfaction on the relationship between involvement and recommendation intention. J. Destin. Mark. Manag. 2015, 4, 213–221. [Google Scholar]
- Website of the Qingdao International Beer Festival. Available online: http://qingdaointernationalbeerfestival.com/qingdao_festival.html (accessed on 17 November 2023).
- Alba, J.W.; Hutchinson, J.W. Dimensions of consumer expertise. J. Consum. Res. 1987, 13, 411–454. [Google Scholar] [CrossRef]
- Crompton, J.L. An assessment of the image of Mexico as a vacation destination and the influence of geographical location upon that image. J. Travel. Res. 1979, 17, 18–23. [Google Scholar] [CrossRef]
- Dedeoğlu, B.B.; Shi, F.; Okumus, B. Communication sources, local food consumption, and destination visit intention of travellers. Curr. Issues Tour. 2023, 26, 1763–1778. [Google Scholar] [CrossRef]
- Han, H.; Al-Ansi, A.; Olya, H.G.; Kim, W. Exploring halal-friendly destination attributes in South Korea: Perceptions and behaviors of Muslim travelers toward a non-Muslim destination. Tour. Manag. 2019, 71, 151–164. [Google Scholar] [CrossRef]
- Hernández-Mogollón, J.M.; Duarte, P.A.; Folgado-Fernández, J.A. The contribution of cultural events to the formation of the cognitive and affective images of a tourist destination. J. Destin. Mark. Manag. 2018, 8, 170–178. [Google Scholar] [CrossRef]
- Woosnam, K.M.; Stylidis, D.; Ivkov, M. Explaining conative destination image through cognitive and affective destination image and emotional solidarity with residents. J. Sustain. Tour. 2020, 28, 917–935. [Google Scholar] [CrossRef]
- Hsu, F.C.; Scott, N. Food experience, place attachment, destination image and the role of food-related personality traits. J. Hosp. Tour. Manag. 2020, 44, 79–87. [Google Scholar] [CrossRef]
- Chi, X.; Han, H. Exploring slow city attributes in Mainland China: Tourist perceptions and behavioral intentions toward Chinese Cittaslow. J. Travel. Tour. Mark. 2020, 37, 361–379. [Google Scholar] [CrossRef]
- Elliot, S.; Papadopoulos, N. Of products and tourism destinations: An integrative, cross-national study of place image. J. Bus. Res. 2016, 69, 1157–1165. [Google Scholar] [CrossRef]
- Kim, S.S.; Choe, J.Y.J.; Petrick, J.F. The effect of celebrity on brand awareness, perceived quality, brand image, brand loyalty, and destination attachment to a literary festival. J. Dest. Mark. Manag. 2018, 9, 320–329. [Google Scholar] [CrossRef]
- Chirakranont, R.; Sakdiyakorn, M. Conceptualizing meaningful tourism experiences: Case study of a small craft beer brewery in Thailand. J. Destin. Mark. Manag. 2022, 23, 100691. [Google Scholar] [CrossRef]
- Zeithaml, V.A. Consumer perceptions of price, quality, and value: A means-end model and synthesis of evidence. J. Mark. 1988, 52, 2–22. [Google Scholar] [CrossRef]
- Oliver, R.L. Satisfaction: A Behavioral Perspective on the Consumer; McGraw-Hill: New York, NY, USA, 1997. [Google Scholar]
- Suhartanto, D.; Brien, A.; Primiana, I.; Wibisono, N.; Triyuni, N.N. Tourist loyalty in creative tourism: The role of experience quality, value, satisfaction, and motivation. Curr. Issues Tour. 2020, 23, 867–879. [Google Scholar] [CrossRef]
- Yoon, Y.S.; Lee, J.S.; Lee, C.K. Measuring festival quality and value affecting visitors’ satisfaction and loyalty using a structural approach. Int. J. Hosp. Manag. 2010, 29, 335–342. [Google Scholar] [CrossRef]
- Wong, J.; Wu, H.C.; Cheng, C.C. An empirical analysis of synthesizing the effects of festival quality, emotion, festival image and festival satisfaction on festival loyalty: A case study of Macau Food Festival. Int. J. Tour. Res. 2015, 17, 521–536. [Google Scholar] [CrossRef]
- Wu, H.C.; Ai, C.H. A study of festival switching intentions, festival satisfaction, festival image, festival affective impacts, and festival quality. Tour. Hosp. Res. 2016, 16, 359–384. [Google Scholar] [CrossRef]
- Pai, C.K.; Lee, T.; Kang, S. Examining the role of service quality, perceived values, and trust in Macau food festival. Int. J. Environ. Res. Public Health 2021, 18, 9214. [Google Scholar] [CrossRef]
- Lban, M.O.; Kaşli, M.; Bezirgan, M. Effects of destination image and total perceived value on tourists’ behavioral intentions: An investigation of domestic festival tourists. Tour. Anal. 2015, 20, 499–510. [Google Scholar] [CrossRef]
- Aşan, K.; Kaptangil, K.; Gargacı Kınay, A. Mediating role of perceived festival value in the relationship between experiences and satisfaction. Int. J. Event Festiv. Manag. 2020, 11, 255–271. [Google Scholar] [CrossRef]
- Lee, H.; Hwang, H.; Shim, C. Experiential festival attributes, perceived value, satisfaction, and behavioral intention for Korean festivalgoers. Tour. Hosp. Res. 2019, 19, 199–212. [Google Scholar] [CrossRef]
- Armbrecht, J. Event quality, perceived value, satisfaction and behavioural intentions in an event context. Scandi J. Hosp. Tour. 2021, 21, 169–191. [Google Scholar] [CrossRef]
- Meeprom, S.; Silanoi, T. Investigating the perceived quality of a special event and its influence on perceived value and behavioural intentions in a special event in Thailand. Int. J. Event Festiv. Manag. 2020, 11, 337–355. [Google Scholar] [CrossRef]
- Sherif, M.; Cantril, H. The Psychology of Ego-Involvements: Social Attitudes and Identifications; John Wiley & Sons Inc.: Hoboken, NJ, USA, 1947. [Google Scholar]
- Broderick, A.J.; Mueller, R.D. A theoretical and empirical exegesis of the consumer involvement construct: The psychology of the food shopper. J. Mark. Theory Pract. 1999, 7, 97–108. [Google Scholar] [CrossRef]
- Gao, J.; Lin, S.S.; Zhang, C. Authenticity, involvement, and nostalgia: Understanding visitor satisfaction with an adaptive reuse heritage site in urban China. J. Destin. Mark. Manag. 2020, 15, 100404. [Google Scholar] [CrossRef]
- Tsai, H.J.; Yeh, S.S.; TC Huan, T.C. Creating loyalty by involvement among festival goers. In Advances in Hospitality and Leisure; Emerald Group Publishing Limited: Bingley, UK, 2011; pp. 173–191. [Google Scholar]
- Sthapit, E.; Björk, P.; Piramanayagam, S. Domestic tourists and local food consumption: Motivations, positive emotions and savouring processes. Annals. Leis. Res. 2023, 26, 316–337. [Google Scholar] [CrossRef]
- Perse, E.M. Involvement with local television news: Cognitive and emotional dimensions. Hum. Comm. Res. 1990, 16, 556–581. [Google Scholar] [CrossRef]
- Havitz, M.E.; Dimanche, F. Leisure involvement revisited: Drive properties and paradoxes. J. Leis. Res. 1999, 31, 122–149. [Google Scholar] [CrossRef]
- Hwang, J.; Kim, W.; Kim, J.J. Application of the value-belief-norm model to environmentally friendly drone food delivery services: The moderating role of product involvement. Int. J. Contemp. Hosp. Manag. 2020, 32, 1775–1794. [Google Scholar] [CrossRef]
- Anggraeni, A.D.; Hurriyati, R.; Wibowo, L.A.; Gaffar, V. Tourists involvement influence on behavioral intention through tourist perceived value on spa tourism in West Java. Int. J. Entrep. 2022, 26, 1–4. [Google Scholar]
- Kim, Y.H.; Duncan, J.; Chung, B.W. Involvement, satisfaction, perceived value, and revisit intention: A case study of a food festival. J. Culin. Sci. Technol. 2015, 13, 133–158. [Google Scholar] [CrossRef]
- Rivera, M.A.; Shapoval, V.; Semrad, K.; Medeiros, M. Familiarity, involvement, satisfaction and behavioral intentions: The case of an African-American cultural festival. Int. J. Event Festiv. Manag. 2022, 13, 267–286. [Google Scholar] [CrossRef]
- Chi, X.; Zhou, H.; Cai, G.; Han, H. Investigation into the festival brand co-creation mechanism: Extended application of the customer-based brand equity model. J. Travel. Tour. Mark. 2024, 41, 377–395. [Google Scholar] [CrossRef]
- Hee Park, H.; Kwan Park, J.; Ok Jeon, J. Attributes of background music and consumers’ responses to TV commercials: The moderating effect of consumer involvement. Inter. J. Adv. 2014, 33, 767–784. [Google Scholar] [CrossRef]
- Dedeoğlu, B.B. Shaping tourists’ destination quality perception and loyalty through destination country image: The importance of involvement and perceived value. Tour. Manag. Perspect. 2019, 29, 105–117. [Google Scholar] [CrossRef]
- Mahasuweerachai, P.; Qu, H. The Impact of Destination Image on Value, Satisfaction, and Loyalty: Moderating Effects of Tourist Characteristics and Involvement. 2011. Available online: https://hdl.handle.net/20.500.14394/30179 (accessed on 17 November 2023).
- Gârdan, D.A.; Gârdan, I.P.; Andronie, M.; Dumitru, I. Sport Events Customers’ Behavior in the Light of Hedonic Consumption. Int. J. Mark. Stud. 2020, 12, 26–40. [Google Scholar] [CrossRef]
- Lai, W.T.; Chen, C.F. Behavioral intentions of public transit passengers—The roles of service quality, perceived value, satisfaction and involvement. Trans. Pol. 2011, 18, 318–325. [Google Scholar] [CrossRef]
- Chen, C.F.; Tsai, M.H. Perceived value, satisfaction, and loyalty of TV travel product shopping: Involvement as a moderator. Tour. Manag. 2008, 29, 1166–1171. [Google Scholar] [CrossRef]
- Eskiler, E.; Altunışık, R. The moderating effect of involvement in the relationship between customer behavioral intentions and its antecedents. Sage Open 2021, 11, 21582440211014495. [Google Scholar] [CrossRef]
- Beckman, E.; Shu, F.; Pan, T. The application of enduring involvement theory in the development of a success model for a craft beer and food festival. Int. J. Event Festiv. Manag. 2020, 11, 397–411. [Google Scholar] [CrossRef]
- San Martin, H.; Collado, J.; Rodriguez del Bosque, I. An exploration of the effects of past experience and tourist involvement on destination loyalty formation. Curr. Issues Tour. 2013, 16, 327–342. [Google Scholar] [CrossRef]
- Qingdao Municipal Culture and Tourism Bureau. Available online: http://whlyj.qingdao.gov.cn/wlzy/jqhd/202112/t20211227_4142250.shtml (accessed on 17 November 2023).
- Anderson, J.C.; Gerbing, D.W. Structural equation modeling in practice: A review and recommended two-step approach. Psychol. Bull. 1988, 103, 411–423. [Google Scholar] [CrossRef]
- Harman, H.H. Modern Factor Analysis; University of Chicago Press: Chicago, IL, USA, 1967. [Google Scholar]
- Curran, P.J.; West, S.G.; Finch, J.F. The robustness of test statistics to nonnormality and specification error in confirmatory factor analysis. Psychol. Methods 1996, 1, 16–29. [Google Scholar] [CrossRef]
- Hair, J.F., Jr.; Black, W.C.; Babin, B.J.; Anderson, R.E. Multivariate Data Analysis; Pearson Higher Education: Upper Saddle River, NJ, USA, 2014. [Google Scholar]
- Gârdan, I.P.; Mauri, A.; Dumitru, I.; Gârdan, D.A.; Maican, S.Ș.; Moise, D. User-Generated Multimedia Content Impact on Destination Choice: Five Dimensions of Consumer Experience. Electronics 2022, 11, 2570. [Google Scholar] [CrossRef]
- Fornell, C.; Larcker, D.F. Structural equation models with unobservable variables and measurement error: Algebra and Statistics. J. Mark. Res. 1981, 18, 382–388. [Google Scholar] [CrossRef]
- Nunally, J. Psychometric Theory, 2nd ed.; McGraw-Hill: New York, NY, USA, 1978. [Google Scholar]
- Nunally, J.C.; Bernstein, I. Psychometric Theory, 3rd ed.; McGraw-Hill: New York, NY, USA, 1994. [Google Scholar]
- Rönkkö, M.; Cho, E. An updated guideline for assessing discriminant validity. Org. Res. Methods 2022, 25, 6–14. [Google Scholar] [CrossRef]
- Macho, S.; Ledermann, T. Estimating, testing, and comparing specific effects in structural equation models: The phantom model approach. Psychol. Methods 2011, 16, 34–43. [Google Scholar] [CrossRef]
- Moqbel, M.; Guduru, R.; Harun, A. Testing mediation via indirect effects in PLS-SEM: A social networking site illustration. Data Anal. Perspect. J. 2020, 1, 1–6. [Google Scholar]
- Hayes, A.F. Beyond Baron and Kenny: Statistical mediation analysis in the new millennium. Comm. Monogr. 2009, 76, 408–420. [Google Scholar] [CrossRef]
- Ragin, C.C. Redesigning Social Inquiry: Fuzzy Sets and Beyond; University of Chicago Press: Chicago, IL, USA; London, UK, 2008. [Google Scholar]
- Tóth, Z.; Thiesbrummel, C.; Henneberg, S.C.; Naudé, P. Understanding configurations of relational attractiveness of the customer firm using fuzzy set QCA. J. Bus. Res. 2015, 68, 723–734. [Google Scholar] [CrossRef]
- Candi, M.; Jae, H.; Makarem, S.; Mohan, M. Consumer responses to functional, aesthetic and symbolic product design in online reviews. J. Bus. Res. 2017, 81, 31–39. [Google Scholar] [CrossRef]
- Gilal, F.G.; Zhang, J.; Gilal, N.G.; Gilal, R.G. Integrating self-determined needs into the relationship among product design, willingness-to-pay a premium, and word-of-mouth: A cross-cultural gender-specific study. Psychol. Res. Behav. Manag. 2018, 11, 227. [Google Scholar] [CrossRef]
- Kiatkawsin, K.; Sutherland, I.; Lee, S.K. Determinants of smart tourist environmentally responsible behavior using an extended norm-activation model. Sustainability 2020, 12, 4934. [Google Scholar] [CrossRef]
- Lim, S.; Kim, S.-G. A Study on the Participants’ Experience and Meaning in Polar Bear Festivals. J. Coast. Res. 2024, 116, 503–507. [Google Scholar] [CrossRef]
- Lin, M.S.; Zhang, H.; Luo, Y.; Li, Y. Environmental, social, and governance (ESG) measurement in the tourism and hospitality industry: Views from a developing country. J. Travel Tour. Mark. 2024, 41, 154–168. [Google Scholar] [CrossRef]


Disclaimer/Publisher’s Note: The statements, opinions and data contained in all publications are solely those of the individual author(s) and contributor(s) and not of MDPI and/or the editor(s). MDPI and/or the editor(s) disclaim responsibility for any injury to people or property resulting from any ideas, methods, instructions or products referred to in the content. |
© 2024 by the authors. Licensee MDPI, Basel, Switzerland. This article is an open access article distributed under the terms and conditions of the Creative Commons Attribution (CC BY) license (https://creativecommons.org/licenses/by/4.0/).