Article

Understanding the Dry-to-Wet Transition of Summer Precipitation over the Three-Rivers Headwater Region: Atmospheric Circulation Mechanisms

1
State Key Laboratory of Hydraulic Engineering Intelligent Construction and Operation, Tianjin University, Tianjin 300350, China
2
State Key Laboratory of Simulation and Regulation of Water Cycle in River Basin, China Institute of Water Resources and Hydropower Research, Beijing 100038, China
3
Kunming Engineering Corporation Limited, Kunming 650000, China
*
Authors to whom correspondence should be addressed.
Sustainability 2024, 16(15), 6299; https://doi.org/10.3390/su16156299
Submission received: 28 May 2024 / Revised: 2 July 2024 / Accepted: 21 July 2024 / Published: 23 July 2024

Abstract

:
Summer precipitation has changed over the Three-Rivers Headwater (TRH) region, which may have an impact on droughts and floods in Asia. This study examines the notable interdecadal variation from dry to wet conditions in summer (June to August) precipitation over the TRH region during the period of 1979–2020. The changes could have been influenced by atmospheric circulations. This study aims to improve our understanding of the interdecadal variation in summer precipitation over the TRH region. Our findings reveal that a zonally oriented teleconnection wave train is generated across the Eurasian mid-to-high latitudes, originating from the North Atlantic and propagating to northern East Asia along the westerly jet. This results in a weakened and northward-shifted westerly jet. Additionally, anticyclonic circulation anomalies over the northern Tibetan Plateau contribute to easterly water-vapor transport anomalies in the region, reducing water-vapor export at the eastern boundary. Concurrently, an anomalous cyclone over the Arabian Sea and an anomalous anticyclone over the Bay of Bengal enhance the influx of oceanic water vapor into the TRH region. The enhanced Walker circulation further augments the equatorial easterly, which in turn strengthens the anomalous anticyclone over the Bay of Bengal. Consequently, these atmospheric changes contribute to the increased summer precipitation over the TRH region, elucidating the mechanisms behind the observed dry-to-wet transition.

1. Introduction

The Three-Rivers Headwater Region (TRH), located in the northeastern Tibetan Plateau (TP), serves as an indispensable water reservoir for the Yangtze River, Yellow River, Lancang River, and various inland lakes. It generates an annual average runoff of approximately 50 billion m3 [1], sustaining freshwater resources for approximately 700 million people in downstream areas [2]. As a pivotal water resource conservation zone in China and East Asia, this region plays an essential role in maintaining water conservation, ecological balance, and energy security. Due to its unique geographical environment, the TRH region is vulnerable to global climate change [3,4]. Over the last four decades, the region has experienced a substantial temperature increase, with the warming rate being four times higher than the global average since 2000 [5]. This accelerated warming potentially impacts crucial hydrological processes such as precipitation, evapotranspiration (ET), and water-vapor transport [6,7]. Such changes increase the variability and uncertainty of precipitation patterns [8,9], and modify the spatial and temporal distribution of precipitation [10,11].
The TRH region is influenced by the westerly and monsoon systems [12], exhibiting significant regional and seasonal variations in precipitation [13]. Predominantly, precipitation in this region peaks in summer, with the southeastern TRH region receiving more precipitation than the northwestern part. Recent studies have documented significant interdecadal oscillations in summer precipitation within this region, with a transition from dry to wet [14,15]. The 1980s were characterized by negative precipitation anomalies, which shifted to positive anomalies after 2000 [16]. Concurrently, the number of warm days, the frequency of extreme high-temperature events, and land water storage have increased [17,18], suggesting a trend towards warmer and wetter conditions in the region. Due to the limited water infrastructure in the studied region [19], the increasing trend of summer precipitation will directly affect the river systems and agricultural production both locally and in downstream areas [20], significantly impacting downstream ecosystems and agricultural development [21]. Therefore, studying the mechanisms of increased summer precipitation is crucial for enhancing our understanding of the precipitation variability over the TRH region.
Precipitation variability is mainly influenced by three main factors: the availability of moisture supply, atmospheric circulations, and various local factors (such as terrain) [22,23]. Summer precipitation over the TRH region is significantly influenced by the interactions among the westerlies, the South Asian monsoon, and the East Asian summer monsoon [24,25]. The South Asian monsoon channels water vapor from the Bay of Bengal and the Arabian Sea into the TRH from the southern boundary, while the westerlies transport water vapor from Central Asia to the TRH from the western boundary. Additionally, the East Asian monsoon brings water vapor from the Pacific and eastern China into the TRH from the eastern boundary [24,26]. Furthermore, precipitation formation over the TP is closely linked to convection triggered by both thermodynamic and dynamic processes [27]. Specifically, due to the high elevation, thermodynamic processes such as surface sensible heating are intensified by the increased exposure to incoming solar radiation, compared to lower-altitude regions [28,29]. This enhanced surface heating induces air to ascend from the low-level boundary layer to the high-level free troposphere, effectively lifting moisture and fostering the development of convective precipitation [30].
Previous studies have mainly focused on the interannual variation in precipitation and associated atmospheric mechanisms over the TRH region. For instance, the interannual variation in the TRH spring precipitation is influenced by anomalous easterly water-vapor transport [16], aligned to the intensified Walker circulations [31]. The interannual variation in TRH summer precipitation is influenced by anomalous southwesterly water-vapor transport, closely associated with a Eurasian wave train and the summer North Atlantic Oscillation [32]. However, there is a gap in research concerning the interdecadal variations in summer precipitation within the TRH region and their underlying atmospheric mechanisms.
To address the existing gap, this study systematically analyzes the interdecadal variations in the summer precipitation from 1979 to 2020, focusing on the associated atmospheric drivers. Specifically, we aim to answer the following research questions:
(1) What are the potential causes of increased precipitation from the perspective of dynamic and thermodynamic processes?
(2) Which atmospheric regimes primarily modulate the interdecadal variations in summer precipitation over the TRH region?

2. Datasets and Methods

In this study, the Three-Rivers Headwater (TRH) region is the study domain (Figure 1). Our analysis is focused on the summer months (June to August) from 1979 to 2020.

2.1. Datasets

The monthly data for horizontal wind, vertical velocity, specific humidity, geopotential height, surface pressure, etc., are derived from the fifth European Centre for Medium-Range Weather Forecasts Reanalysis (ERA5) dataset. The ERA5 dataset is a high-resolution reanalysis dataset of 0.25° × 0.25°, with 137 vertical layers. ERA5 also benefits from an improved data assimilation system, hourly output, uncertainty estimates, and a large variety of output parameters [33]. The ERA5 dataset is used to analyze atmospheric circulation anomalies and atmospheric water budget.
The observational data of daily precipitation obtained from the China Meteorology Administration (CMA) were used to evaluate the reanalysis data. There are 25 available meteorological stations located in or around the TRH region. All stations are higher than 4000 m above mean sea level.
The selection of ERA5 and CMA datasets is justified by their high spatial and temporal resolution, which is crucial for capturing the complex climate of the TRH region. However, limitations exist. ERA5 may have biases in areas with complex terrain, potentially affecting precipitation estimates. The CMA dataset may have limitations in temporal coverage and consistency across different stations. These factors are considered in our analysis to ensure robust and reliable results.
The monthly ET from Global Land Evapotranspiration Amsterdam Model (GLEAM) 3.5a was used for the reference ET data, and it is based on satellite and reanalysis data spanning the 41-year period 1980–2020, with a spatial resolution of 0.1° × 0.1° globally [34]. Previous studies have validated the reliability of this dataset in the Three-Rivers-Source Region, making it suitable for investigating the spatiotemporal variations in ET in this region [35].

2.2. Methods

Water-vapor budget analysis was applied to understand the causes of dry-to-wet transition over the TRH region. The atmospheric water budget was calculated by using the balanced equation for atmospheric water [36]:
P = ET + M F C + w t + r e s i d u a l
where P is the precipitation, ET is the evapotranspiration, and w t denotes the atmospheric water storage. The residual term represents the surface process linking with model bias and topography [27,37]. The MFC represents the moisture flux convergence, which is expressed as follows:
M F C = 1 g p = 0 p = p s ( V q ) d p
where q is the specific humidity, V = ( u , v ) is the horizontal wind vector, p is the air pressure, and g is the gravitational acceleration. Here, pressure of the top layer p s is equal to 100 hPa. It has been shown in previous studies that regional precipitation results from a balance of local ET and external water-vapor transport on a seasonal time scale [38,39]. Therefore, with the negligible variable w t , the dominant balance is between MFC and (P − ET).
P ET = MFC + r e s i d u a l
The atmospheric water budget equation can be broken down into dynamic and thermodynamic components. The thermodynamic component is associated with variations in water-vapor content, primarily driven by temperature variations. Conversely, the dynamic component pertains to alterations in circulation patterns, including variations in wind speed and direction, driven predominantly by the movement of air masses. To further investigate the potential causes of increased precipitation, the atmospheric water budget equation can be broken down according to Seager et al. as follows [27]:
ρ w g δ ( P ¯ E ¯ ) = p s p t ( V c l m ¯ [ δ q ¯ ] ) d p p s p t ( q c l m ¯ [ δ V ¯ ¯ ] ) d p p s p t ( [ δ V q ¯ ] ) d p δ TH + δ MCD + δ TE
where δ represents the difference between the wet and dry periods, and the subscript c l m denotes the climatological mean during the dry period. The first term on the right side of Equation (4) constitutes the thermodynamic component δ TH , which accounts for anomalies in specific humidity, independent of changes in wind speed. The second term is the dynamic component δ MCD , which addresses anomalies in wind speed, disregarding variations in specific humidity. The third term pertains to transient eddies δ TE , which can generally be neglected on a seasonal scale.
δ TH = p s p t ( V ¯ c l m [ δ q ¯ ] ) d p
δ MCD = p s p t ( q c l m ¯ [ δ V ¯ ] ) d p
δ TE = p s p t ( [ δ V ¯ q ¯ ] ) d p
The vertical integral of water-vapor transport contributed by thermodynamics Q thermodynamic and dynamics Q dynamic are as follows:
Q thermodynamic = 1 g p s p t ( V c l m ¯ [ δ q ¯ ] ) d p
Q dynamic = 1 g p s p t ( q c l m ¯ [ δ V ¯ ¯ ] ) d p

3. Results

3.1. Interdecadal Variation in Summer Precipitation

According to the observational and ERA5 reanalysis data, summer precipitation over the TRH region has been increasing at a rate of 0.9 mm/year and 0.7 mm/year, respectively (Figure 2a). The sliding t-test and cumulative anomaly methods were used to identify the abrupt change in summer precipitation over the TRH region. Both the observational data and the ERA5 data indicate that a significant shift in summer precipitation occurred in 2002, which passed the significance level test at 0.05 (Figure 2b). Thus, 2002 marks a critical turning point for summer precipitation over the TRH region.
Summer precipitation over the TRH region was relatively low during the period of 1979–2002. However, it was relatively higher during the period of 2003–2020. Summer precipitation during the wet period exceeded that of the dry period by 32.3 mm. This marked a notable interdecadal shift from lower to higher precipitation. This phenomenon is described as a dry-to-wet transition. To further investigate the mechanisms behind these interdecadal variations in summer precipitation over the TRH region, the entire study period was divided into two phases: 1979–2002 as the dry period (characterized by less precipitation) and 2003–2020 as the wet period (characterized by more precipitation).
As illustrated in Figure 3, there are significant differences in the precipitation distribution between the dry and wet periods. During the dry period, precipitation anomalies were generally negative, indicating that most areas experienced below-average precipitation. Conversely, during the wet period, precipitation anomalies were predominantly positive, suggesting that most areas received above-average precipitation. This indicates that summer precipitation was relatively higher during the wet period, especially in the northwestern and northeastern TRH regions, compared to the dry period.

3.2. Atmospheric Water Budget

Figure 4 shows the times series of summer mean individual components (precipitation, ET, MFC, and residual) of the atmospheric water budget. The relatively small residual values suggest that the atmospheric water budget is reasonably balanced, indicating the reliability of the reanalysis data and our methodology [40]. The trends in precipitation and ET reflect the overall moisture balance in the region, with fluctuations suggesting responses to climatic drivers like atmospheric circulation patterns. The MFC highlights its role in modulating moisture availability, and any long-term changes may indicate shifts in large-scale atmospheric dynamics. Together, these components illustrate the mechanisms controlling the region’s hydrological cycle, emphasizing the balance between incoming and outgoing water vapor.
To understand the atmospheric water budget components driving the interdecadal change of summer precipitation over the TRH region, Figure 5 illustrates the spatial patterns of the differences in ET and MFC between the wet period and the dry period. ET shows negative values across most of the TRH region during the dry period (Figure 5a), transitioning to positive values throughout the wet period (Figure 5c). It indicates an overall increase in ET, particularly notable in the southwestern part of the TRH region (Figure 5e). The increase in ET during the wet period underscores the enhanced hydrological cycle in the region, contributing to the observed interdecadal precipitation changes.
There are two primary water-vapor transport pathways to the TRH region, namely, southwesterly water-vapor transport across the southern boundary and the westerlies water-vapor transport across the western boundary [15,41]. During the dry period, the TRH region predominantly experiences northerly and northwesterly water-vapor transport, leading to a negative MFC in this area (Figure 5b). Conversely, during the wet period, the positive MFC over the TRH region is maintained by the prevailing southwesterly and southeasterly water-vapor transport (Figure 5d). Additionally, there is an enhancement of southeasterly and southwesterly water-vapor transport over the TRH region, indicating a decrease in the westerly water-vapor transport in the studied region [42]. Furthermore, MFC demonstrates an overall increase across the entire TRH region, with significant effects observed in the eastern part (Figure 5f). Therefore, the decrease in the westerly water-vapor transport results in enhanced MFC in the eastern TRH region.
To identify the dynamic and thermodynamic contributions to the observed changes in moisture convergence, Figure 6 presents the decomposition of MFC and integrated water-vapor transport (IVT). The dynamic components of MFC and IVT exhibit spatial patterns that align closely with the differences in MFC between the wet period and the dry period, as detailed in Figure 5. Notably, the dynamic IVT exhibits easterly and southeasterly anomalies within the TRH region, implying a decline in westerlies over the recent decade. According to Sun et al. [32], these easterly anomalies are conducive to MFC in this region. The thermodynamic components of MFC and IVT, although smaller in magnitude compared to the dynamic components, reveal westerly anomalies over the TRH region, indicating an increase in specific humidity across the TRH region.

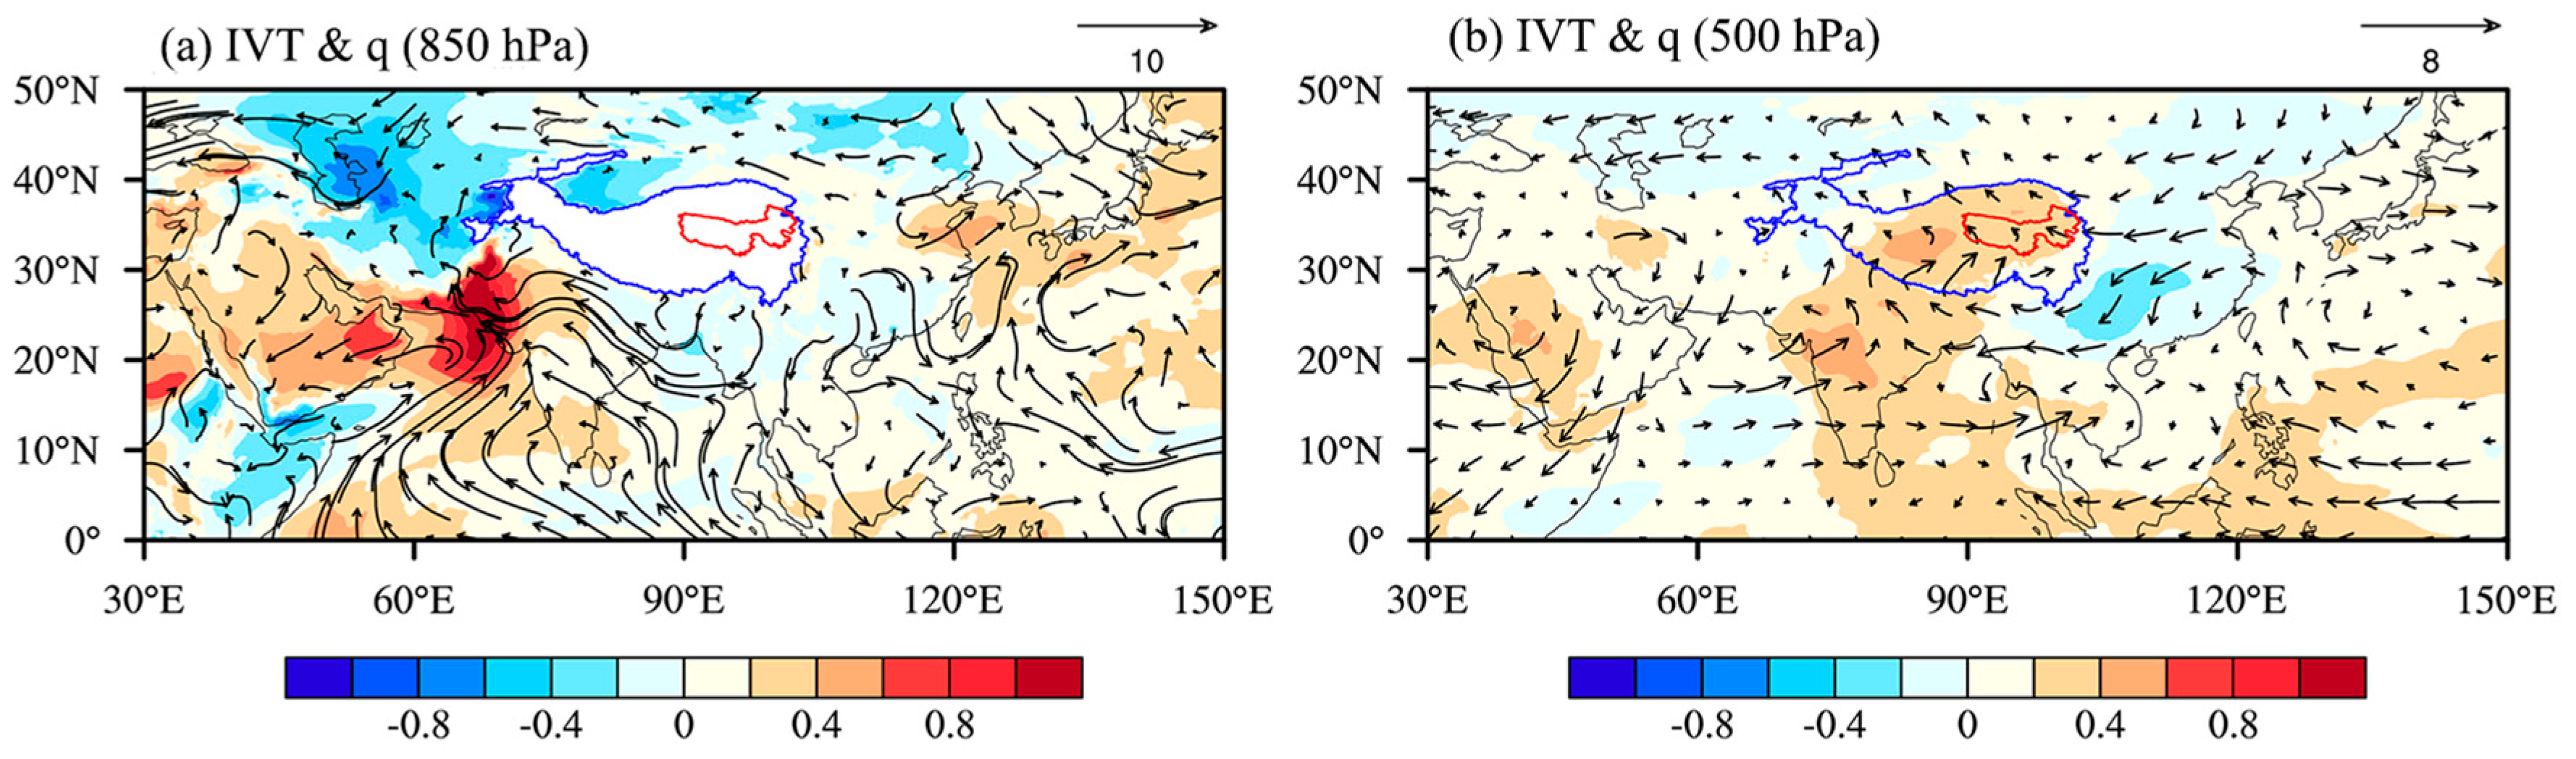
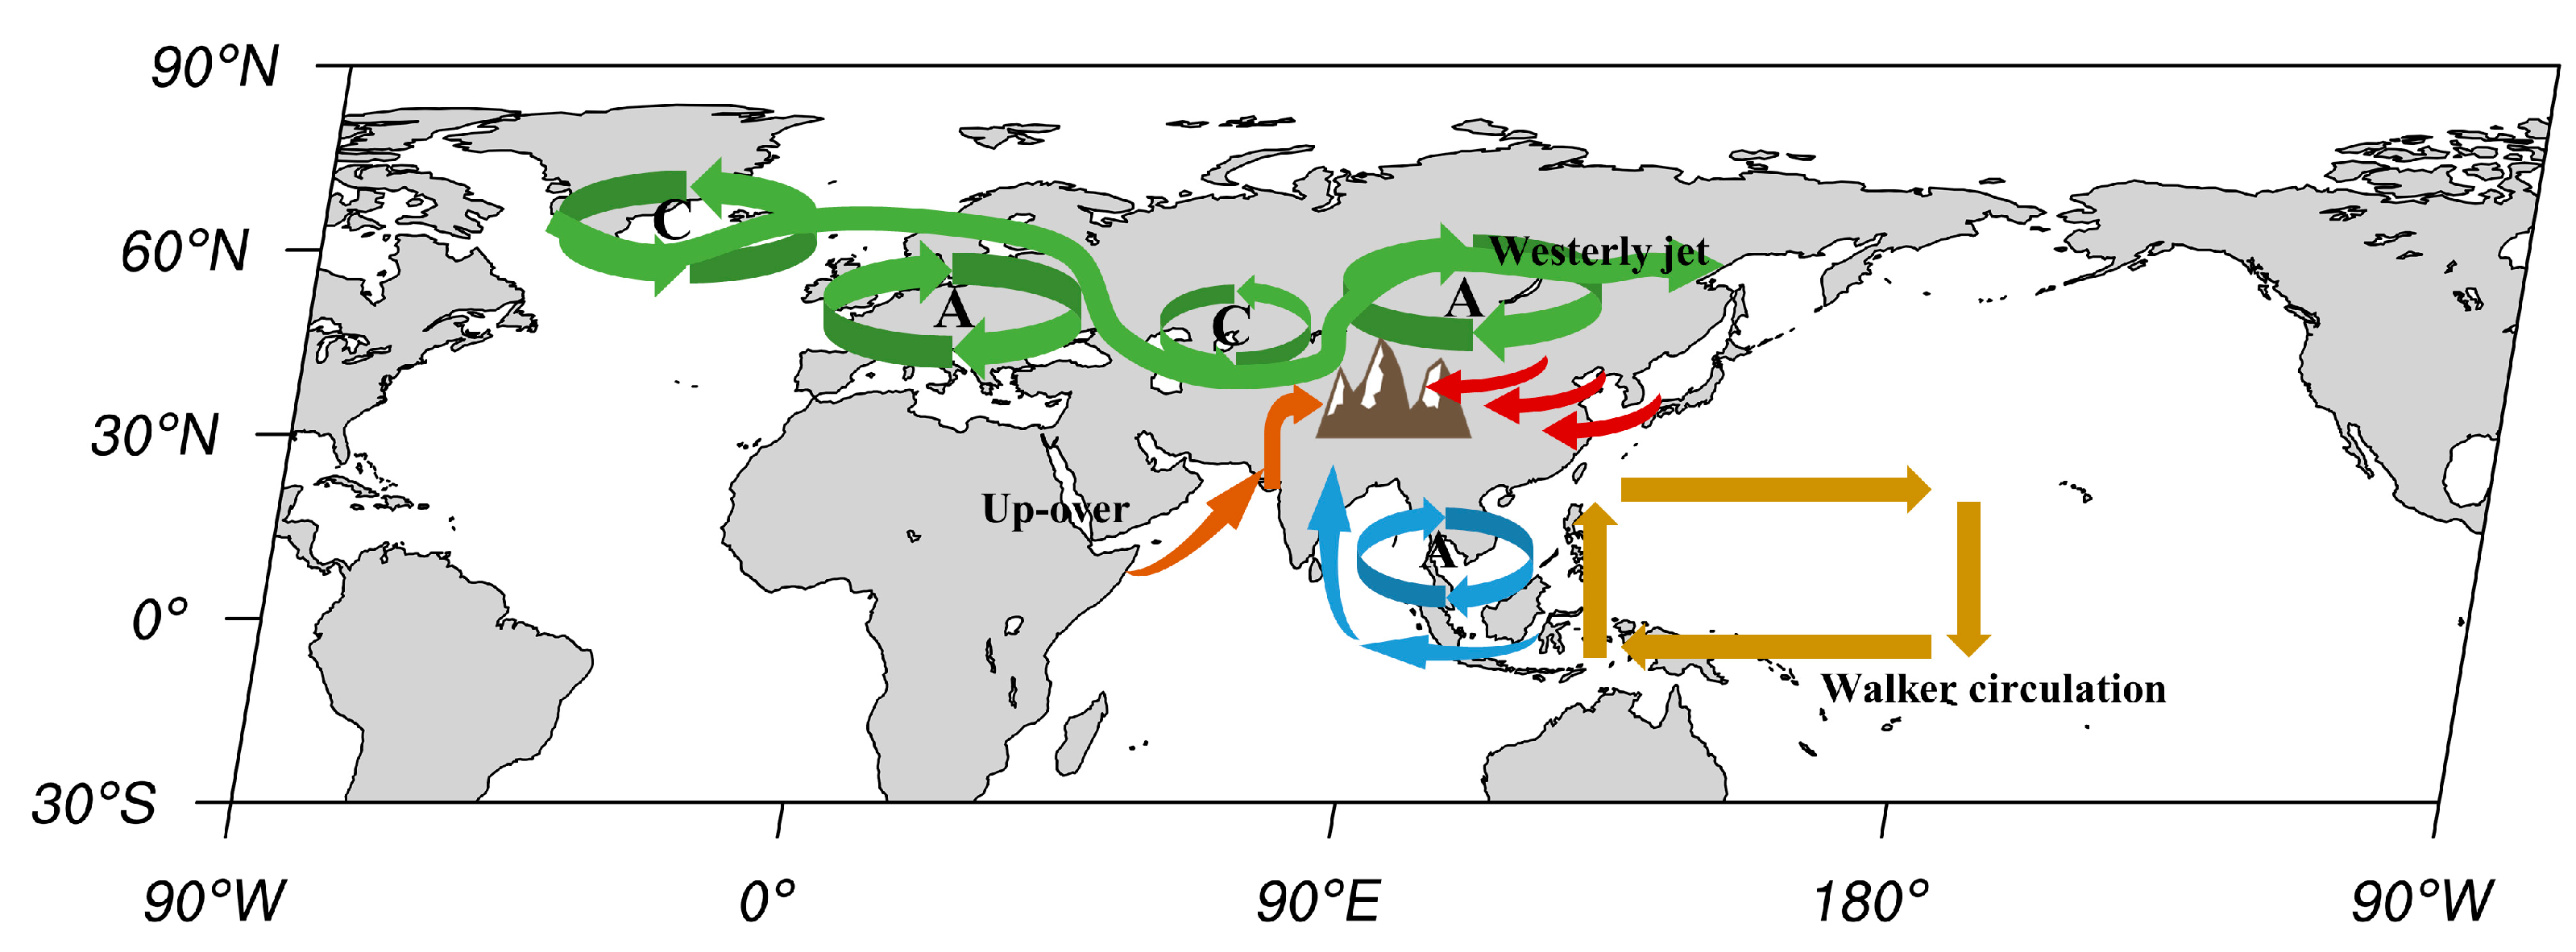
3.3. Associated Atmospheric Circulations

At 500 hPa (Figure 7a), the region to the north of the TP is characterized by a dominant anomalous anticyclonic circulation, with easterly anomalies in the eastern TRH region particularly pronounced in the northeastern part. The analysis of the 500 hPa zonal wind indicates that the mid-latitude westerlies are significantly weakened in the northern TP and the northeastern TRH region (Figure 7c). According to the water-vapor budget analysis, the anticyclonic circulation to the north of the TP plays a critical role in moderating the westerlies over the TRH region, consequently suppressing the water-vapor export from the eastern boundary of the studied area. Concurrently, an enhanced cyclone over the Arabian Sea and the Indian Peninsula bolsters the South Asian monsoon, facilitating increased water-vapor transport from the Arabian Sea to the TRH region [14].
At 200 hPa (Figure 7b), the northwestern TP exhibits a dominant anomalous cyclonic circulation, whereas the eastern part is influenced by anomalous anticyclonic circulation. Analysis of the 200 hPa zonal wind uncovers negative anomalies across the southeastern TP (Figure 7d), including in the TRH region. These anomalies are statistically significant at the 95% confidence level, revealing a substantial weakening of the subtropical westerly jet stream. Conversely, positive anomalies in the zonal winds in the northwestern TP indicate a reinforcement of the jet stream in this locale. Figure 8 is essential to illustrating the long-term trends in the subtropical westerly jet stream’s behavior. Indices quantifying the intensity and positional shifts of the jet stream demonstrate a progressive weakening and northward migration since the 1990s (Figure 8). Influenced by the juxtaposition of cyclonic and anticyclonic circulations, the subtropical westerly jet stream has notably shifted northward and weakened [42] in the southeastern TP, encompassing the TRH area. A previous study revealed that the positioning and strength of the subtropical westerly jet stream profoundly affect the TRH region’s summer climate by modulating the zonal winds, thereby impacting precipitation patterns [14]. A northward and weakened jet stream correspond with diminished westerlies over the TP, enhancing moisture convergence and promoting increased precipitation over the TRH region [31]. Additionally, at the upper levels of the troposphere (200 hPa), an anticyclone over the TP strengthens the South Asian High, fostering upper-level divergence and surface-level convergence [43], both favorable for precipitation development. This understanding helps clarify the atmospheric mechanisms driving the dry-to-wet transition of summer precipitation over the TRH region.
Water vapor is predominantly concentrated in the lower and middle levels of the troposphere, with particular emphasis on moisture transport and specific humidity at 850 hPa and 500 hPa (Figure 9). Due to the elevated terrain of the TP, the 850 hPa level primarily pertains to the moisture dynamics over the oceans and South Asia. At this level (Figure 9a), the South Asian summer monsoon exhibits enhanced strength, characterized by cyclonic moisture transport anomalies over the Arabian Sea and the Indian Peninsula, along with a significant increase in specific humidity. This results in southwesterly winds transporting a greater volume of moisture from the Arabian Sea into the TP [14]. Additionally, anticyclonic moisture transport occurs over the Bay of Bengal, augmenting southeasterly moisture transport. These two robust airflows converge at the juncture of the Arabian Sea and the Indian Peninsula. To further investigate the vertical moisture dynamics, a meridional wind and vertical velocity pressure–latitude cross-section is delineated along the Arabian Sea (longitude range from 60° E to 70° E), as depicted in Figure 10a. This cross-section reveals an anomalous upward movement over the Arabian Sea, indicative of intensified convective activity. The results suggest that moisture from the Arabian Sea is elevated to the middle levels of the troposphere by cyclonic circulation, and is subsequently transported into the TP through an “up-over” mechanism driven by the southwesterly winds (Figure 10a).
There was an increase in specific humidity along the pathway from the Bay of Bengal, through the Indian Peninsula, to the TRH region at the 500 hPa, as illustrated in Figure 10b. Moisture enhancement was instrumental in facilitating the summer precipitation observed over the TRH region. Southwesterly and southeasterly water-vapor transport carried moisture from the Arabian Sea and the Bay of Bengal into the TRH region across the southern boundary. This led to the southwesterly and southeasterly water-vapor transport anomalies within the TRH region. This result is aligned with the findings presented in Liu et al. [15].
Furthermore, the anticyclonic circulation to the north of the TP was responsible for the anomalous easterly water-vapor transport across Eastern China and into the TRH region, thereby restricting moisture export from the eastern boundary of the TRH region. Notably, the specific humidity over Eastern China during the wet period was less than that in the dry period, potentially reducing Eastern China’s contribution to summer precipitation over the TRH region.
Overall, the anomalous cyclone over the Arabian Sea and the anomalous anticyclone over the Bay of Bengal intensified the South Asian monsoon. This dynamic enhances both southwesterly and southeasterly water-vapor transport mechanisms. Consequently, these mechanisms support an increase in water vapor transported from the ocean at the southern boundary of the TRH region.
Pressure–longitude cross-sections of zonal wind and vertical velocity were plotted along the TRH region, spanning latitudes from 30° N to 40° N, to analyze vertical motions over this region (see Figure 10b). The findings reveal that, to the west of the TRH, there was an enhancement in the westerlies, whereas to the east, easterly anomalies were prevalent. These opposing wind anomalies converged over the TRH region, resulting in MFC. This convergence was particularly intense in the middle-to-upper troposphere, ranging from 500 to 200 hPa, thereby enhancing upward motion which significantly contributed to precipitation formation.
The spatial modes of geopotential height at 200 hPa and 500 hPa show significant similarities, as illustrated in Figure 11. At 200 hPa, there was a notable teleconnection effect characterized by an anomalous eastward-propagating wave train across Eurasia. This pattern included negative geopotential height anomalies over the North Atlantic, positive anomalies over Europe, negative anomalies to the west of the TP, and positive anomalies to the east of the TP. The observed anomalies are indicative of a sequence of cyclonic and anticyclonic features. Specifically, in the northwest of the TP (west of 80° E), the geopotential height anomalies were insignificantly negative, whereas in the east of the TP (east of 80° E), the anomalies were significantly positive. This distribution of cyclonic and anticyclonic patterns induced a more pronounced curvature in the path of the subtropical westerly jet stream. Consequently, in the northwestern TP, the subtropical westerly jet was strengthened and shifted southward, while in the eastern part the westerly jet was weakened and shifted northward.
The vertical velocity at 500 hPa (Figure 11) also revealed anomalies in upward motion over the junction of the Arabian Sea and the Indian Peninsula, as well as over the western Pacific, aligning with the previous results. Additionally, the tropical western Pacific exhibited significant positive anomalies, indicating strong upward motion and an intensified Walker circulation [44,45]. Previous studies have highlighted that the Walker circulation can influence mid-latitude atmospheric circulation through teleconnections, promoting easterly anomalies over the TRH region [31], thereby impacting precipitation variability in this region.

4. Discussion and Conclusions

This study investigated the interdecadal variation in summer precipitation over the TRH region, and its associated atmospheric mechanisms. There was an increasing trend of summer precipitation during the period of 1979–2020 over the TRH region, with a significant dry-to-wet transition beginning around 2002. Based on the ERA5 reanalysis, the underlying atmospheric mechanisms driving the increase in summer precipitation over the TRH region were explored by comparing the related atmospheric circulations during the wet period and the dry period (Figure 12).
Our results indicate that dynamic components play an important role in influencing precipitation changes. The dynamic components revealed easterly anomalies over the TRH region, enhancing MFC [16]. Although smaller in magnitude, the thermodynamic components indicated an increase in specific humidity, contributing to overall moisture availability. The combined effect of these dynamic and thermodynamic processes led to enhanced moisture transport and convergence, resulting in increased summer precipitation over the TRH region.
The subtropical westerly jet was characterized by a sequence of cyclonic–anticyclonic circulation anomalies across the Eurasian continent. This pattern led to a weakening and northward shift of the subtropical westerly jet over the eastern part of the TP, resulting in diminished westerly winds and enhanced convergence in this region [14]. The meandering of the westerly jet facilitated water-vapor transport from the ocean, allowing warm, moist air to penetrate further north. These atmospheric circulation changes allowed more water vapor to converge over the TRH region, while in the western part it was strengthened and shifted southward. An anomalous anticyclone at 500 hPa over the northern TP contributed to easterly water-vapor transport anomalies in the region, which reduced water-vapor export at the eastern boundary of the TRH region and conveyed water vapor from northern China into the studied region.
Furthermore, water vapor from the Arabian Sea was lifted into the mid-troposphere by cyclonic circulation and subsequently transported into the TP by southwesterly wind through the “up-over” mechanism. This ‘‘up-over’’ transport process, as proposed by Dong et al. [46], accounts for roughly half of the total summer precipitation over the southwestern TP. Abnormal upward motion over the Indian Ocean–Pacific region and corresponding abnormal downward motion over the western Pacific intensified the Walker circulation [31]. This process triggered anticyclonic circulation anomalies over the Bay of Bengal. Subsequently, the equatorial easterlies, influenced by the Bay of Bengal’s anticyclone, underwent a transformation into southwesterly water-vapor transport. Thus, this significantly increased water-vapor transport from the Bay of Bengal to the TP via the South Asian monsoon.
While our study provides valuable insights into the mechanisms driving interdecadal variations in summer precipitation over the TRH region, it has several limitations. The analysis primarily relied on reanalysis datasets, which, despite their high resolution and comprehensive coverage, have inherent uncertainties and biases. Future studies should incorporate multiple reanalysis products and observational datasets to validate and enhance the robustness of the findings. Additionally, while we identified key atmospheric mechanisms, the sea-surface temperatures and land-atmosphere interactions require further investigation. Advanced climate models should be employed to explore these complex interactions.
The implications of these findings are critical for regional water-resource management. The increased water-vapor transport, influenced by both the subtropical westerly jet and the South Asian monsoon, suggests potential shifts in water availability. This information can guide policymakers in developing strategies to manage water resources more effectively, considering both the current trends and the potential impacts of global warming. Rising temperatures may alter atmospheric circulation patterns, potentially intensifying the water cycle and alter precipitation patterns. These could lead to more pronounced wet and dry periods, impacting the frequency and intensity of precipitation events. Future research should focus on climate model projections to better understand these potential changes and their implications for the TRH region.

Author Contributions

Conceptualization, M.Y. and F.Z.; methodology, F.W.; validation, X.Z. and C.G.; formal analysis, X.L.; data curation, H.W.; writing—original draft preparation, X.L.; writing—review and editing, N.D.; supervision, M.Y.; funding acquisition, M.Y. and F.Z. All authors have read and agreed to the published version of the manuscript.

Funding

This research was funded by National Key Research and Development (No. 2021YFC3000202); China Power Construction Corporation Technology Project (DJ-HXGG-2021-04); Key R&D Plan Project in Yunnan Province (202203AA080010); Study on the Monitoring of the Integrated Effects of Resource Utilization of Yellow River Floods at the Northern Margin of the Kubuqi Desert (ESKJ2023-001).

Institutional Review Board Statement

Not applicable.

Informed Consent Statement

Not applicable.

Data Availability Statement

The CMA station data were obtained from the National Meteorological Information Center (http://data.cma.cn/, accessed on 1 December 2021). The ERA5 reanalysis data were provided by ECMWF (https://cds.climate.copernicus.eu/cdsapp#!/search?type=dataset, accessed on 1 July 2023). The GLEAM data were from https://www.GLEAM.eu (accessed on 1 July 2023).

Conflicts of Interest

Authors Feng Zhou, Xiaotan Zhang and Chao Gao were employed by the company Kunming Engineering Corporation Limited. The remaining authors declare that the research was conducted in the absence of any commercial or financial relationships that could be construed as a potential conflict of interest.

References

  1. Zhang, Y.; Zhang, S.; Zhai, X.; Xia, J. Runoff Variation and Its Response to Climate Change in the Three Rivers Source Region. J. Geogr. Sci. 2012, 22, 781–794. [Google Scholar] [CrossRef]
  2. Xu, X.; Dong, L.; Zhao, Y.; Wang, Y. Effect of the Asian Water Tower over the Qinghai-Tibet Plateau and the characteristics of atmospheric water circulation (in Chinese). Chin. Sci. Bull. 2019, 64, 2830–2841. [Google Scholar] [CrossRef]
  3. Liu, X.; Zhang, J.; Zhu, X.; Pan, Y.; Liu, Y.; Zhang, D.; Lin, Z. Spatiotemporal Changes in Vegetation Coverage and Its Driving Factors in the Three-River Headwaters Region during 2000–2011. J. Geogr. Sci. 2014, 24, 288–302. [Google Scholar] [CrossRef]
  4. Zheng, Y.; Han, J.; Huang, Y.; Fassnacht, S.R.; Xie, S.; Lv, E.; Chen, M. Vegetation Response to Climate Conditions Based on NDVI Simulations Using Stepwise Cluster Analysis for the Three-River Headwaters Region of China. Ecol. Indic. 2018, 92, 18–29. [Google Scholar] [CrossRef]
  5. Bai, Y.; Guo, C.; Degen, A.A.; Ahmad, A.A.; Wang, W.; Zhang, T.; Li, W.; Ma, L.; Huang, M.; Zeng, H.; et al. Climate Warming Benefits Alpine Vegetation Growth in Three-River Headwater Region, China. Sci. Total Environ. 2020, 742, 140574. [Google Scholar] [CrossRef] [PubMed]
  6. Olmedo, E.; Turiel, A.; González-Gambau, V.; González-Haro, C.; García-Espriu, A.; Gabarró, C.; Portabella, M.; Corbella, I.; Martín-Neira, M.; Arias, M.; et al. Increasing Stratification as Observed by Satellite Sea Surface Salinity Measurements. Sci. Rep. 2022, 12, 6279. [Google Scholar] [CrossRef] [PubMed]
  7. Yu, L.; Josey, S.A.; Bingham, F.M.; Lee, T. Intensification of the Global Water Cycle and Evidence from Ocean Salinity: A Synthesis Review. Ann. New York Acad. Sci. 2020, 1472, 76–94. [Google Scholar] [CrossRef] [PubMed]
  8. Kukulies, J.; Lai, H.-W.; Curio, J.; Feng, Z.; Lin, C.; Li, P.; Ou, T.; Sugimoto, S.; Chen, D. Mesoscale Convective Systems in the Third Pole Region: Characteristics, Mechanisms and Impact on Precipitation. Front. Earth Sci. 2023, 11, 1143380. [Google Scholar] [CrossRef]
  9. Yi, X.; Li, G.; Yin, Y. Spatio-Temporal Variation of Precipitation in the Three-River Headwater Region from 1961 to 2010. J. Geogr. Sci. 2013, 23, 447–464. [Google Scholar] [CrossRef]
  10. Xi, Y.; Miao, C.; Wu, J.; Duan, Q.; Lei, X.; Li, H. Spatiotemporal Changes in Extreme Temperature and Precipitation Events in the Three-Rivers Headwater Region, China. J. Geophys. Res. Atmos. 2018, 123, 5827–5844. [Google Scholar] [CrossRef]
  11. De Oliveira, V.A.; de Mello, C.R.; Viola, M.R.; Srinivasan, R. Assessment of Climate Change Impacts on Streamflow and Hydropower Potential in the Headwater Region of the Grande River Basin, Southeastern Brazil. Int. J. Climatol. 2017, 37, 5005–5023. [Google Scholar] [CrossRef]
  12. Yao, T.; Piao, S.; Shen, M.; Gao, J.; Yang, W.; Zhang, G.; Lei, Y.; Gao, Y.; Zhu, L.; Xu, B.; et al. Chained Impacts on Modern Environment of Interaction between Westerlies and Indian Monsoon on Tibetan Plateau. China Acad. J. Electron. Publ. House 2017, 32, 976–984. [Google Scholar] [CrossRef]
  13. Shi, H.; Li, T.; Wei, J.; Fu, W.; Wang, G. Spatial and Temporal Characteristics of Precipitation over the Three-River Headwaters Region during 1961–2014. J. Hydrol. Reg. Stud. 2016, 6, 52–65. [Google Scholar] [CrossRef]
  14. Sun, J.; Yang, K.; Guo, W.; Wang, Y.; He, J.; Lu, H. Why Has the Inner Tibetan Plateau Become Wetter since the Mid-1990s? J. Clim. 2020, 33, 8507–8522. [Google Scholar] [CrossRef]
  15. Liu, X.; Yang, M.-X.; Dong, N.-P.; Xie, W.-N.; Li, H.-G.; Guan, Z.; Wen, F.; Wang, H.; Chen, D. Increased Southerly and Easterly Water Vapor Transport Contributed to the Dry-to-Wet Transition of Summer Precipitation over the Three-River Headwaters in the Tibetan Plateau. Adv. Clim. Change Res. 2023, 14, 502–510. [Google Scholar] [CrossRef]
  16. Sun, B.; Wang, H. Interannual Variation of the Spring and Summer Precipitation over the Three River Source Region in China and the Associated Regimes. J. Clim. 2018, 31, 7441–7457. [Google Scholar] [CrossRef]
  17. Li, Z.; Lyu, S.; Chen, H.; Ao, Y.; Zhao, L.; Wang, S.; Zhang, S.; Meng, X. Changes in Climate and Snow Cover and Their Synergistic Influence on Spring Runoff in the Source Region of the Yellow River. Sci. Total Environ. 2021, 799, 149503. [Google Scholar] [CrossRef] [PubMed]
  18. Yi, W.; Feng, Y.; Liang, S.; Kuang, X.; Yan, D.; Wan, L. Increasing Annual Streamflow and Groundwater Storage in Response to Climate Warming in the Yangtze River Source Region. Environ. Res. Lett. 2021, 16, 084011. [Google Scholar] [CrossRef]
  19. Dong, N.; Wei, J.; Yang, M.; Yan, D.; Yang, C.; Gao, H.; Arnault, J.; Laux, P.; Zhang, X.; Liu, Y.; et al. Model Estimates of China’s Terrestrial Water Storage Variation Due To Reservoir Operation. Water Resour. Res. 2022, 58, e2021WR031787. [Google Scholar] [CrossRef]
  20. Li, S.; Yao, Z.; Wang, R.; Liu, Z. Dryness/Wetness Pattern over the Three-River Headwater Region: Variation Characteristic, Causes, and Drought Risks. Int. J. Clim. 2020, 40, 3550–3566. [Google Scholar] [CrossRef]
  21. Jiang, C.; Zhang, L. Ecosystem Change Assessment in the Three-River Headwater Region, China: Patterns, Causes, and Implications. Ecol. Eng. 2016, 93, 24–36. [Google Scholar] [CrossRef]
  22. Gustafsson, M.; Rayner, D.; Chen, D. Extreme Rainfall Events in Southern Sweden: Where Does the Moisture Come From? Tellus A Dyn. Meteorol. Oceanogr. 2010, 62, 605–616. [Google Scholar] [CrossRef]
  23. Chen, F.; Avissar, R. Impact of Land-Surface Moisture Variability on Local Shallow Convective Cumulus and Precipitation in Large-Scale Models. J. Appl. Meteorol. 1994, 33, 1382–1401. [Google Scholar] [CrossRef]
  24. Yao, T.; Bolch, T.; Chen, D.; Gao, J.; Immerzeel, W.; Piao, S.; Su, F.; Thompson, L.; Wada, Y.; Wang, L.; et al. The Imbalance of the Asian Water Tower. Nat. Rev. Earth Environ. 2022, 3, 618–632. [Google Scholar] [CrossRef]
  25. Wang, K.L.; Jiang, H.; Zhao, H.Y. Atmospheric Water Vapor Transport from Westerly and Monsoon over the Northwest China. Adv. Water Sci. 2005, 16, 432–438. [Google Scholar]
  26. Yan, H.; Huang, J.; He, Y.; Liu, Y.; Wang, T.; Li, J. Atmospheric Water Vapor Budget and Its Long-Term Trend Over the Tibetan Plateau. J. Geophys. Res. Atmos. 2020, 125, e2020JD033297. [Google Scholar] [CrossRef]
  27. Seager, R.; Naik, N.; Vecchi, G.A. Thermodynamic and Dynamic Mechanisms for Large-Scale Changes in the Hydrological Cycle in Response to Global Warming*. J. Clim. 2010, 23, 4651–4668. [Google Scholar] [CrossRef]
  28. Boos, W.; Kuang, Z. Dominant control of the South Asian monsoon by orographic insulation versus plateau heating. Nature 2010, 463, 218–222. [Google Scholar] [CrossRef]
  29. Yanai, M.; Tomita, T. Seasonal and Interannual Variability of Atmospheric Heat Sources and Moisture Sinks as Determined from NCEP–NCAR Reanalysis. J. Clim. 1998, 11, 463–482. [Google Scholar] [CrossRef]
  30. Sugimoto, S.; Ueno, K. Formation of Mesoscale Convective Systems over the Eastern Tibetan Plateau Affected by Plateau-Scale Heating Contrasts. J. Geophys. Res. 2010, 115, D16105. [Google Scholar] [CrossRef]
  31. Shang, S.; Zhu, G.; Wei, J.; Li, Y.; Zhang, K.; Li, R.; Arnault, J.; Zhang, Z.; Laux, P.; Yang, Q.; et al. Associated Atmospheric Mechanisms for the Increased Cold Season Precipitation over the Three-River Headwaters Region from the Late 1980s. J. Clim. 2021, 34, 8033–8046. [Google Scholar] [CrossRef]
  32. Sun, B.; Wang, H. Enhanced Connections between Summer Precipitation over the Three-River-Source Region of China and the Global Climate System. Clim. Dyn. 2019, 52, 3471–3488. [Google Scholar] [CrossRef]
  33. Hersbach, H.; Bell, B.; Berrisford, P.; Biavati, G.; Horányi, A.; Muñoz Sabater, J.; Nicolas, J.; Peubey, C.; Radu, R.; Rozum, I.; et al. ERA5 Monthly Averaged Data on Pressure Levels from 1940 to Present. Copernicus Climate Change Service (C3S) Climate Data Store (CDS). 2023. Available online: https://cds.climate.copernicus.eu/cdsapp#!/dataset/10.24381/cds.6860a573?tab=overview (accessed on 1 July 2023).
  34. Martens, B.; Miralles, D.G.; Lievens, H.; van der Schalie, R.; de Jeu, R.A.M.; Fernández-Prieto, D.; Beck, H.E.; Dorigo, W.A.; Verhoest, N.E.C. GLEAM v3: Satellite-Based Land Evaporation and Root-Zone Soil Moisture. Geosci. Model. Dev. 2017, 10, 1903–1925. [Google Scholar] [CrossRef]
  35. Seager, R.; Henderson, N. Diagnostic Computation of Moisture Budgets in the ERA-Interim Reanalysis with Ref-erence to Analysis of CMIP-Archived Atmospheric Model Data. J. Clim. 2013, 26, 7876–7901. [Google Scholar] [CrossRef]
  36. Trenberth, K.E.; Guillemot, C.J. Evaluation of the Atmospheric Moisture and Hydrological Cycle in the NCEP/NCAR Reanalyses. Clim. Dyn. 1998, 14, 213–231. [Google Scholar] [CrossRef]
  37. Trenberth, K.E.; Guillemot, C.J. Evaluation of the global atmospheric moisture budget as seen from analyses. J. Clim. 1995, 8, 2255–2272. [Google Scholar] [CrossRef]
  38. Brubaker, K.L.; Entekhabi, D.; Eagleson, P.S. Estimation of Continental Precipitation Recycling. J. Clim. 1993, 6, 1077–1089. [Google Scholar] [CrossRef]
  39. Li, L.; Li, W.; Barros, A.P. Atmospheric Moisture Budget and Its Regulation of the Summer Precipitation Variability over the Southeastern United States. Clim. Dyn. 2013, 41, 613–631. [Google Scholar] [CrossRef]
  40. Dee, D.P.; Uppala, S.M.; Simmons, A.J.; Berrisford, P.; Poli, P.; Kobayashi, S.; Andrae, U.; Balmaseda, M.A.; Balsamo, G.; Bauer, P.; et al. The ERA-Interim Reanalysis: Configuration and Performance of the Data Assimilation System. Q. J. R. Meteorol. Soc. 2011, 137, 553–597. [Google Scholar] [CrossRef]
  41. Zhang, Y.; Huang, W.; Zhong, D. Major Moisture Pathways and Their Importance to Rainy Season Precipitation over the Sanjiangyuan Region of the Tibetan Plateau. J. Clim. 2019, 32, 6837–6857. [Google Scholar] [CrossRef]
  42. Gao, Y.; Leung, L.R.; Zhang, Y.; Cuo, L. Changes in Moisture Flux over the Tibetan Plateau during 1979–2011: Insights from a High-Resolution Simulation. J. Clim. 2015, 28, 4185–4197. [Google Scholar] [CrossRef]
  43. Wang, Z.; Duan, A.; Wu, G. Time-Lagged Impact of Spring Sensible Heat over the Tibetan Plateau on the Summer Rainfall Anomaly in East China: Case Studies Using the WRF Model. Clim. Dyn. 2014, 42, 2885–2898. [Google Scholar] [CrossRef]
  44. Wang, Z.; Yang, S.; Luo, H.; Li, J. Drying Tendency over the Southern Slope of the Tibetan Plateau in Recent Decades: Role of a CGT-like Atmospheric Change. Clim. Dyn. 2022, 59, 2801–2813. [Google Scholar] [CrossRef]
  45. Ma, S.; Zhou, T. Robust Strengthening and Westward Shift of the Tropical Pacific Walker Circulation during 1979–2012: A Comparison of 7 Sets of Reanalysis Data and 26 CMIP5 Models. J. Clim. 2016, 29, 3097–3118. [Google Scholar] [CrossRef]
  46. Dong, W.; Lin, Y.; Wright, J.S.; Ming, Y.; Xie, Y.; Wang, B.; Luo, Y.; Huang, W.; Huang, J.; Wang, L.; et al. Summer Rainfall over the Southwestern Tibetan Plateau Controlled by Deep Convection over the Indian Subcontinent. Nat. Commun. 2016, 7, 10925. [Google Scholar] [CrossRef] [PubMed]
Figure 1. The elevation and geographical location of the Tibetan Plateau (TP) and the Three-Rivers Headwater (TRH) region.
Sustainability 16 06299 g001
Figure 2. (a) Trend and (b) cumulative anomalies of summer precipitation over the TRH region during the period of 1979–2020, based on the observational and ERA5 data.
Sustainability 16 06299 g002
Figure 3. The distribution of summer precipitation anomalies during (a) the dry period and (b) the wet period, and (c) their differences. The red lines denote the TRH region. Regions marked with dots indicate differences are statistically significant at the 95% confidence level.
Sustainability 16 06299 g003
Figure 4. Summer mean precipitation, evapotranspiration (ET), moisture flux convergence (MFC), and residual during the period of 1979–2020.
Sustainability 16 06299 g004
Figure 5. Distribution of (a,c,e) ET (color: mm) and (b,d,f) integrated water-vapor transport (IVT) (vectors: kg m−1 s−1) and MFC (color: mm) in summer during the wet and dry periods. The red lines denote the TRH region. Regions marked with dots indicate differences are statistically significant at the 95% confidence level.
Sustainability 16 06299 g005
Figure 6. The MFC (color: mm) and IVT (vectors: kg m−1 s−1) contributed by (a) dynamic and (b) thermodynamic components. The red lines denote the TRH region.
Sustainability 16 06299 g006
Figure 7. Differences in wind (vectors, m/s) at (a) 500 hPa and (b) 200 hPa, and zonal wind (colors, m/s) at (c) 500 hPa and (d) 200 hPa between the wet and dry periods. The red lines and blue lines denote the TRH region and the TP, respectively. Regions marked with dots indicate differences are statistically significant at the 95% confidence level.
Sustainability 16 06299 g007
Figure 8. Variations in (a) intensity and (b) positional indices of the westerly jet stream.
Sustainability 16 06299 g008
Figure 9. Differences in IVT (vectors, kg m−1 s−1) and specific humidity (colors, kg/kg) at (a) 850 hPa and (b) 500 hPa between the wet and dry periods. The red lines and blue lines denote the TRH region and the TP, respectively.
Sustainability 16 06299 g009
Figure 10. Pressure–latitude section of differences in (a) meridional wind averaged over the Arabian Sea, and (b) zonal wind averaged over the TRH region. Colors represent the horizontal wind, solid black lines indicate the upward movement, dashed black lines indicate the downward movement, and the dotted areas indicate the differences in wind are significant at 95% confidence level.
Sustainability 16 06299 g010
Figure 11. Differences of (a,b) geopotential height and (c) vertical velocity between the wet and dry periods. The red lines and blue lines denote the TRH region and the TP, respectively. Regions marked with dots indicate differences are statistically significant at the 95% confidence level.
Sustainability 16 06299 g011
Figure 12. Physical picture of the underlying atmospheric mechanisms driving the interdecadal variations in summer precipitation over the TRH region. AC = anomalous anticyclone, C = anomalous cyclone. The red, yellow, blue, and orange arrows indicate enhancement of the easterly water-vapor transport, the Walker circulation, the southwesterly water-vapor transport, and ascending motion. The green arrow indicates the winding subtropical westerly jet.
Sustainability 16 06299 g012
Disclaimer/Publisher’s Note: The statements, opinions and data contained in all publications are solely those of the individual author(s) and contributor(s) and not of MDPI and/or the editor(s). MDPI and/or the editor(s) disclaim responsibility for any injury to people or property resulting from any ideas, methods, instructions or products referred to in the content.

