Article

Integrated Assessment of Bearing Capacity and GHG Emissions for Foundation Treatment Piles Considering Stratum Variability

1
State Key Laboratory of Intelligent Geotechnics and Tunnelling, College of Civil and Transportation Engineering, Shenzhen University, Shenzhen 518060, China
2
Key Laboratory of Coastal Urban Resilient Infrastructures (Shenzhen University), Ministry of Education, Shenzhen 518060, China
*
Author to whom correspondence should be addressed.
Sustainability 2024, 16(15), 6319; https://doi.org/10.3390/su16156319
Submission received: 3 July 2024 / Revised: 20 July 2024 / Accepted: 22 July 2024 / Published: 24 July 2024
(This article belongs to the Section Green Building)

Abstract

:
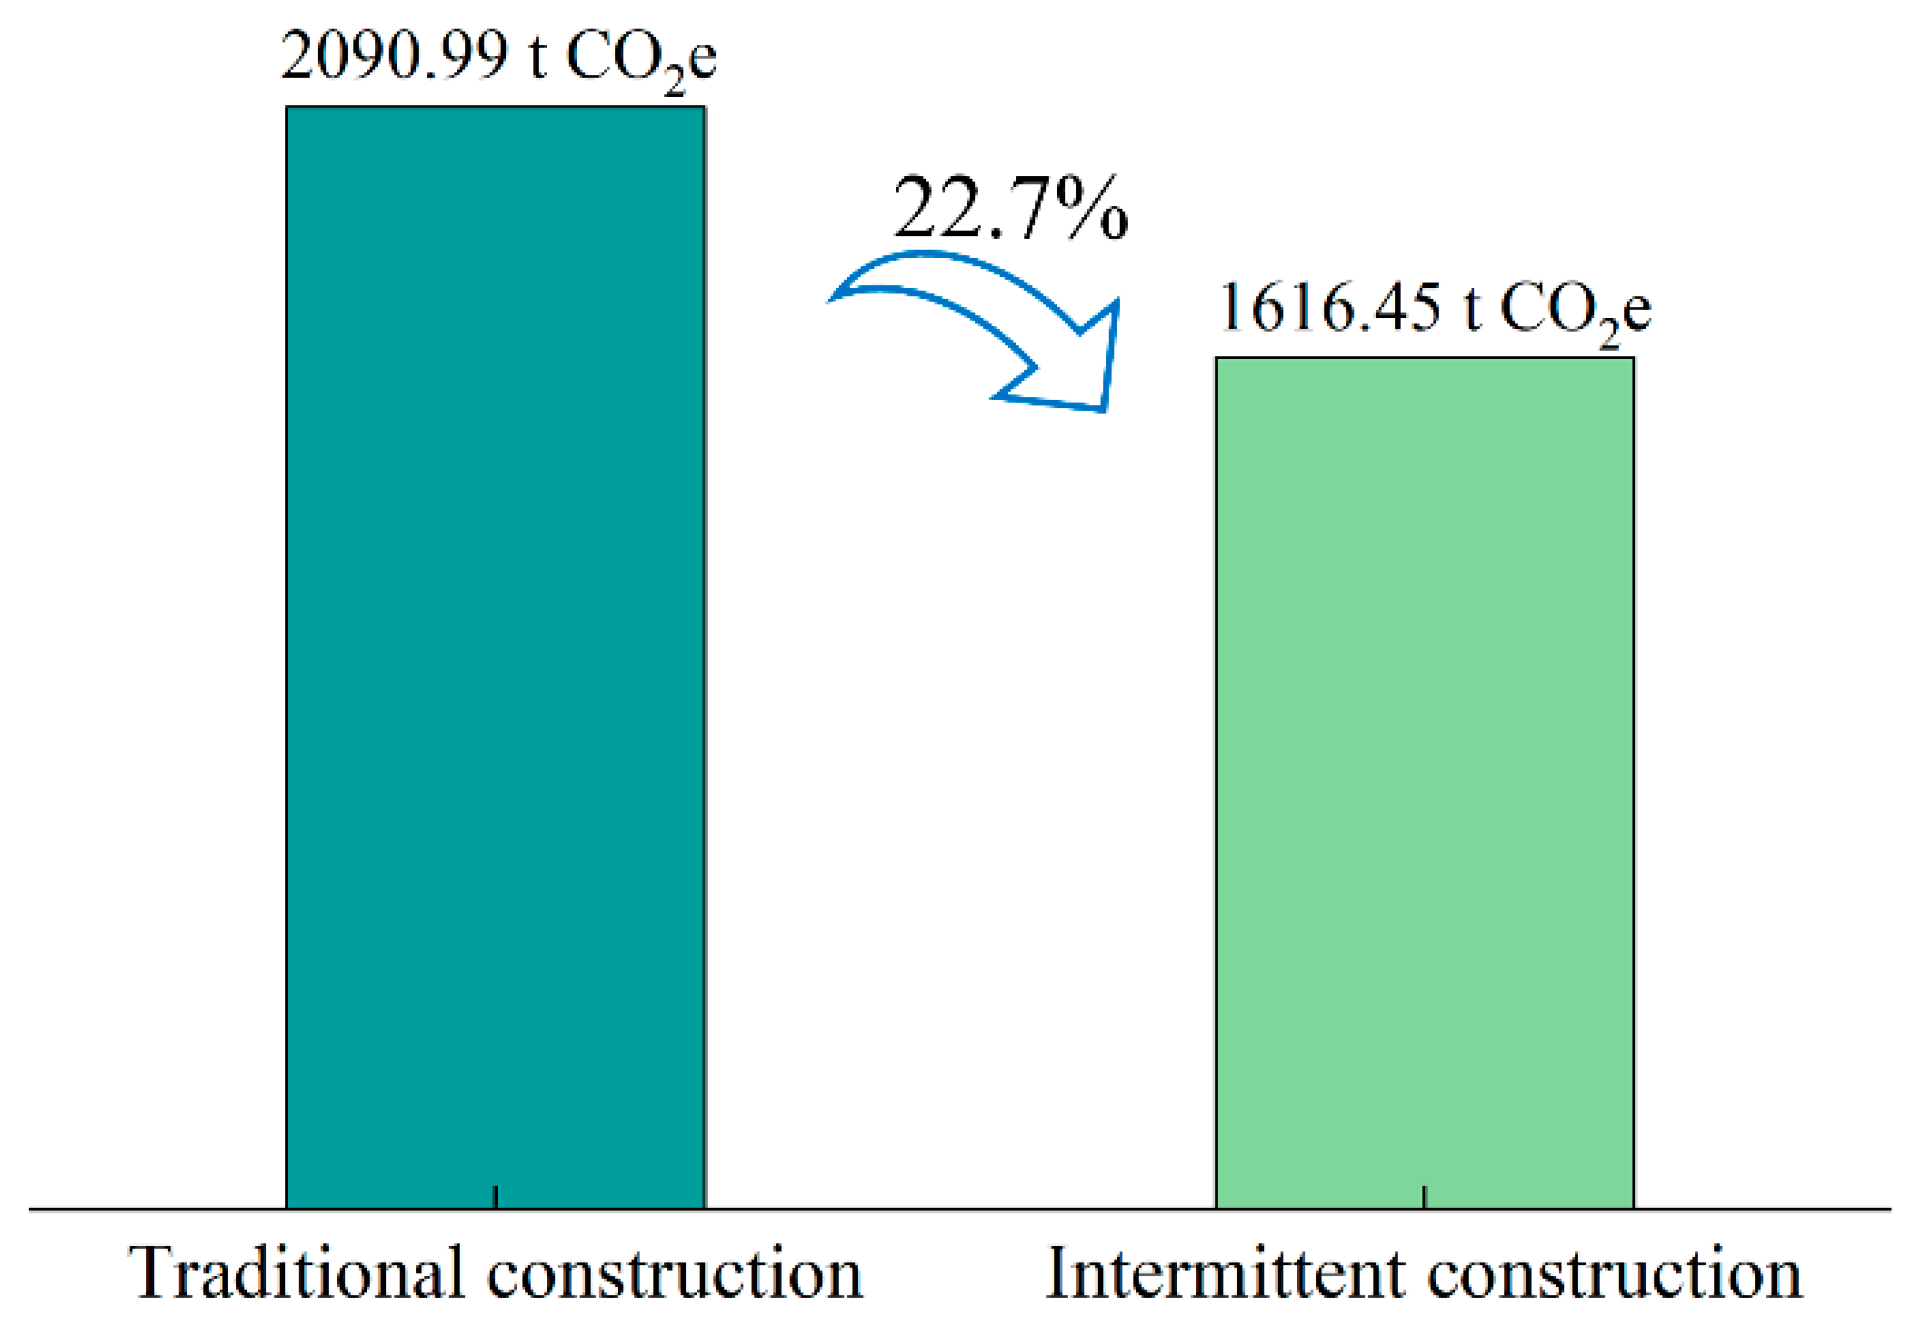
Foundation treatment piles are crucial for enhancing the bearing capacity and stability of weak foundations and are widely utilized in construction projects. However, owing to the complexity of geological conditions, traditional construction methods fail to meet the demand for low-carbon development. To address these challenges, this study introduced a comprehensive decision-making approach that considers the impact of stratum variability on greenhouse gas (GHG) emissions and pile bearing capacity from the design phase. During the design process, the GHG emissions and bearing capacities of deep cement mixing (DCM) and high-pressure jet grouting (HPJG) piles were quantitatively assessed by analyzing the environmental and performance impacts of foundation treatment piles related to materials, transportation, and equipment usage. The results suggest that the bearing capacity of piles in shallow strata is highly susceptible to stratum variability. Using piles with a diameter of 800 mm and a length of 20 m as an example, compared with DCM piles, HPJG piles demonstrated a superior bearing capacity; however, their total GHG emissions were 6.58% higher, primarily because of the extensive use of machinery during HPJG pile construction. The GHG emissions of foundation treatment piles in shallow strata were influenced more by geological variability than those in deep strata. Sensitivity analysis revealed that the pile diameter is a critical determinant of GHG emissions and bearing capacity. Based on the bearing capacity–GHG emission optimization framework, a foundation treatment strategy that integrates overlapping and spaced pile arrangements was introduced. This innovative construction method reduced the total GHG emissions by 22.7% compared with conventional methods. These research findings contribute to low-carbon design in the construction industry.

1. Introduction

Global climate change is intensifying, marked by rising temperatures and increasingly frequent extreme weather events, which is causing widespread global concern. The construction industry, which is a major source of global energy consumption and greenhouse gas (GHG) emissions, plays a critical role in environmental sustainability [1,2,3,4]. According to a report by the United Nations Environment Program (UNEP) [5], buildings and the construction industry account for over 34% of the global energy demand. Thus, developing effective strategies to reduce the carbon footprint of the construction industry is not only an urgent response to climate change but is also crucial for advancing sustainable development goals [6,7,8]. In particular, foundation treatment piles are essential for construction under complex geological conditions [9]. However, the construction process of foundation treatment piles also entails significant GHG emissions, which not only increase environmental stress but also challenge the green and low-carbon development goals of the construction industry.
The structural design of foundations differs from that of superstructures because the former bridges the disciplines of geotechnical engineering and structural mechanics [10]. Without the support of adequate geotechnical engineering research, the incorrect selection of foundation types can lead to excessive material consumption. Building foundation piles can be classified into two main types to address various adverse geotechnical conditions: load-bearing and foundation treatment piles. Load-bearing piles are primarily used to directly support building loads, whereas foundation treatment piles are used to reinforce foundations and improve the soil-bearing capacity. Among these, deep cement mixing (DCM) piles [11] and high-pressure jet grouting (HPJG) piles [12,13] have been widely used to treat weak foundations. However, pile foundation construction, a critical step in the building process, inevitably involves the use of heavy construction machinery and equipment, which not only increases construction costs but also leads to relatively high GHG emissions [14]. Moreover, the concealed nature of foundation engineering complicates accurate material quantity assessments during construction, thereby significantly complicating environmental impact assessments. The GHG emissions during the construction phase of pile foundations are an emerging research topic [15]. Approximately 30% of energy is lost and 40% of solid waste is produced during this stage within the construction industry [16]. A recent study compared the environmental impacts of drilled cast-in-place piles and precast-driven piles [17], quantitatively analyzing the GHG emissions from materials, transportation, and equipment usage. Moreover, the traditional use of DCM piles results in a substantial carbon footprint owing to the construction materials used [18]. Kravchenko et al. [19] conducted a comprehensive life cycle assessment (LCA) of the DCM method using granulated blast furnace slag based on a Hong Kong land reclamation case study.
From the perspective of environmental impact and sustainability, it is crucial to assess the GHG emissions during the construction process in the early stages of design. This early assessment facilitates the identification and implementation of measures to reduce the carbon footprint before a project commences [20]. For instance, recent studies [21] have utilized random forest algorithms to create predictive models that elucidate the complex relationships between GHG emissions during the construction phase and design parameters. Moreover, Huang and Wang [22] compared the GHG emissions of prefabricated and traditional cast-in-place construction methods, assessing how design parameters, such as slab span and seismic requirements, as well as GHG emission factors and transportation distances, influence GHG emissions. Zhang and Zheng [23] compared the implied emissions of five different wall system structures with the same architectural layout. However, current research primarily focuses on optimizing GHG emissions from superstructures during construction, and studies considering GHG emissions at the pile foundation design stage remain scarce. Pile foundation design must consider environmental factors and bearing capacity while strictly adhering to the relevant standards and specifications. To guarantee the stability and safety of pile foundation structures, researchers have often employed experimental methods [24,25,26], theoretical calculations [27,28], and numerical simulations [29,30]. These methods facilitate the consideration of multiple factors such as pile dimensions [31,32] and selection [33]. Additionally, pile foundation design is required to account for the variability in geological conditions [34,35]. Traditional design relies on the deterministic behavior of soil mechanics; however, this approach overlooks the spatial variability of the soil, potentially resulting in inaccuracies in the analysis results [36].
Therefore, pile foundation design should not only incorporate considerations of bearing capacity and environmental factors but also comprehensively understand the complexity and diversity of geological conditions. This implies that while aiming to reduce GHG emissions, design decisions must also ensure that structural safety, stability, and functionality remain uncompromised. The purpose of this study was to assess the potential for carbon reduction in foundation treatment piles based on the LCA framework. First, the design process and GHG emission assessment scheme for foundation treatment piles were introduced in detail. Subsequently, the impact of geological variability on the pile construction process was examined, and the effects of various factors on the GHG emissions and bearing capacity of the piles were evaluated. Finally, a comprehensive comparative assessment of various construction schemes for foundation treatment piles was performed from a design perspective, and new construction schemes that favor emission reduction were introduced. The results of this study not only establish a theoretical foundation for assessing GHG emissions at the early design stages of underground pile foundation technology but also offer a viable pathway for achieving low-carbon construction in underground engineering projects.

2. Integrated Design Frameworks for Optimizing Bearing Capacity and GHG Emissions

2.1. Integrated Optimization Design Framework

The bearing capacity–GHG emission optimization framework was employed, as depicted in Figure 1, to evaluate the interdependencies among pile foundation design, bearing capacity, pile selection, and GHG emissions. This framework integrates environmental impacts with the traditional pile bearing capacity design, factoring in various influences such as stratum variability. This enables engineers to evaluate the GHG emission potential of different pile design schemes during early design stages. Using this approach, strategies for reducing the carbon footprint can be identified and implemented during the design process. This promotes more sustainable construction practices that satisfy technical engineering requirements while adapting to varying geological conditions.

2.2. Design Module for the Bearing Capacity of Foundation Treatment Piles

2.2.1. Design Process for Foundation Treatment Piles

As illustrated in Figure 2, when conducting the preliminary design of foundation treatment piles, it is essential to verify the bearing capacity Ra of the individual piles and the bearing capacity of the foundation fspk to ensure that the treated foundation complies with the regulatory standards for foundation bearing capacity. After the reinforcement work is completed, it is necessary to test the cement–soil to confirm that its core permeability coefficient remains below 1 × 10⁻⁷ cm/s and that the ultimate compressive strength reaches at least 1 MPa.

2.2.2. Bearing Capacity Calculation

The bearing capacity of a single pile is defined as the maximum axial static load that a single pile can bear before failure and is primarily dependent on the soil support and strength of the pile material. Standard practice involves using the two values. The calculation proceeds as detailed in Equation (1).
R a = min { μ p q sia l i + α A p q p η f cu A p ,
where μp represents the circumference of the pile body (m), qsia is the ultimate lateral resistance of the i-th soil layer (kPa), li is the thickness of the i-th soil layer (m), α is the correction coefficient for the pile tip resistance, Ap is the area of the pile tip (m2), qp is the standard value of cone penetration resistance near the pile tip, that is, the pile tip resistance (kPa), fcu is the average compressive strength of a 70.7 mm cube of the same soil reinforcement used in the pile body, cured under standard conditions for 90 d (kPa), and η is the reduction coefficient for pile body strength.
The area-replacement ratio m is defined as the ratio of the cross-sectional area of the piles within the reinforced foundation to the total area of the foundation they support. The calculation is detailed in Equation (2).
m = d 2 / d e 2 ,
where d is the pile diameter (m), and de is the equivalent diameter of the foundation treatment area shared by a single pile (m), related to the spacing between piles.
The bearing capacity of the foundation fapk is the potential load-bearing capacity per unit area of the foundation soil when the load increases. It is expressed as Equation (3).
f apk = λ m R a / A p + β ( 1 m ) f sk ,
where λ is the coefficient of utilization for the bearing capacity of a single pile, taken according to regional experience, Ra is the characteristic value of the vertical bearing capacity of a single pile (kPa), Ap is the end area of the pile (m2), β is the coefficient of utilization for the bearing capacity of the soil between piles, also taken according to regional experience, and fsk is the characteristic value of the bearing capacity of the soil between piles (kPa).
The number of piles n arranged should comprehensively consider the reinforcement area, area replacement rate, and pile end area, as shown in Equation (4).
n = m A / A p ,
where A represents the area of the reinforcement area (m2).
In the design and construction of foundation treatment piles, different construction methods lead to varied effects on improving soft soil foundations, owing to differences in calculation coefficients and pile strengths. For example, DCM piles induce relatively minimal disturbance to the surrounding soil during construction, rendering them appropriate for areas with stringent environmental impact requirements. However, HPJG piles, owing to their superior bearing capacity, are better suited for applications demanding increased foundation bearing capacity. Detailed explanations of the relevant calculation methods and parameters are available in Chinese Pile Foundation Design standards JGJ 79-2008 [37] and JGJ 79-2012 [38].

2.3. Assessment Module for GHG Emissions of Foundation Treatment Piles

2.3.1. System Boundary and Functional Unit

The concept of LCA originated in the 1960s and 1970s with a framework encompassing four primary stages: goal and scope definition, inventory analysis (LCI), impact assessment (LCIA), and interpretation and discussion [39]. Following the adoption of the LCA concept in the construction industry during the 1990s, it evolved into a crucial tool for evaluating the environmental impacts of construction projects [40,41,42].
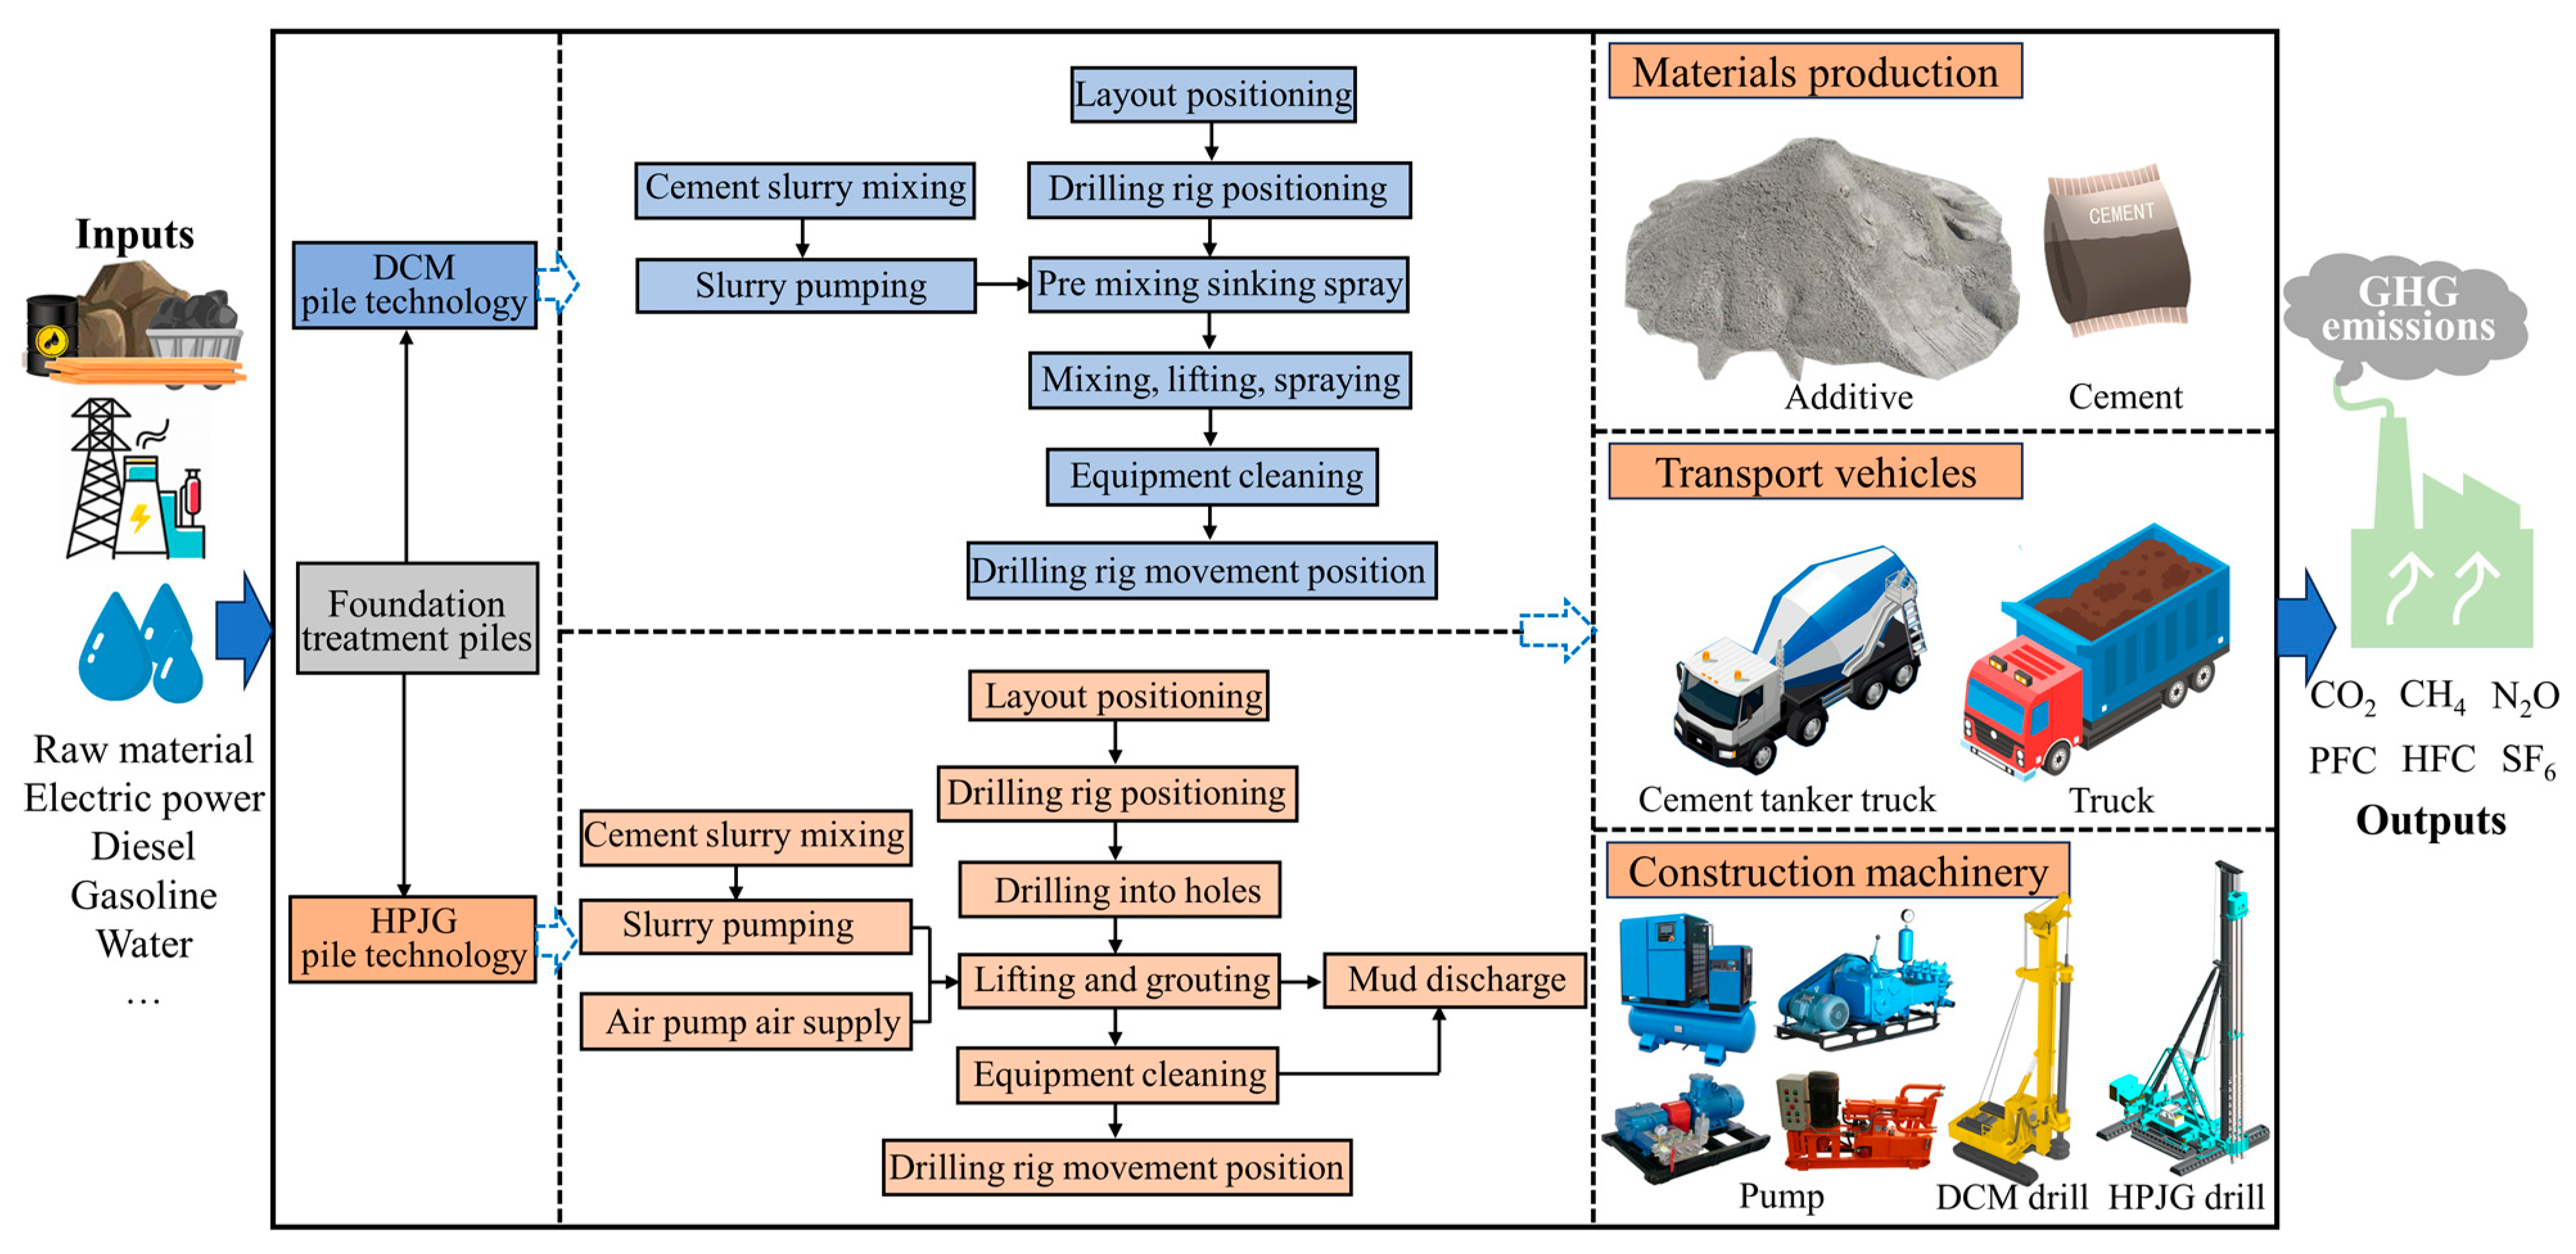
Currently, a unified method for defining the study scope or system boundaries does not exist [43], necessitating the resolution of the system boundary issue prior to commencing the analysis. In this study, the evaluation framework was based on the concept of carbon footprint, as outlined in ISO/TS 14067 [44]. The construction phase of the pile foundation encompassed the material production, transportation, and construction stages. The operational and demolition phases were not considered in this study, but the embodied emissions of materials were acknowledged as part of the upstream life-cycle stages. However, recent studies have included the embodied emissions of materials in the construction phase emissions. The primary focus of this section is the GHG emissions associated with ground improvement measures in the shield-launching area. Figure 3 shows the system boundary for GHG emissions from ground treatment.
GHG emissions during the construction phase are a complex issue and involve multiple GHGs [45]. In construction activities, CO2 emissions typically predominate, primarily owing to the combustion of fossil fuels. Consequently, the effects of various GHGs are generally quantified in terms of carbon dioxide equivalents [46]. Table 1 lists the global warming potential (GWP) values of these GHGs.
The calculation is detailed in Equation (5).
CO 2 e i = n = i 6 W i × GWP i ,
where Wi represents the mass of each of the six GHG emission sources (kg), GWPi is the GWP value (Table 1), and i signifies the type code of the GHG.
The essence of LCA is to establish the input–output relationships for each unit process. Each unit process, as a fundamental component, is meticulously analyzed to identify and quantify the environmental impacts associated with GHG emissions. These data can subsequently be aggregated to determine the overall environmental impact and emissions of the entire construction activity. To ensure a consistent basis for comparison in GHG emission assessments and considering the specific characteristics of pile foundation construction, the length of the pile, measured in meters, serves as the functional unit for assessment.

2.3.2. GHG Emission Calculation

The emission factor method, proposed and extensively employed by the IPCC for GHG emission estimation [16], utilizes activity data from emission sources coupled with corresponding emission coefficients to quantify GHG emissions. This method entails a comprehensive analysis of the construction materials, equipment, and transport vehicles derived from construction lists and standards. The data are then multiplied by the respective GHG emission factors and aggregated to determine the total GHG emissions for the entire construction process. The total GHG emissions can be calculated using Equation (6):
E = i = 1 n E i ,
where E denotes the total GHG emissions during the pile group construction process, and Ei represents each construction procedure.
During a specific phase of work, the main sources of GHG emissions can be categorized into three key areas: ① GHG emission caused by material consumption, Emi, which depends on the type of material used, expressed in kg CO2e, ② transportation of building materials, Eti, which is closely related to the distance and transportation method between the material’s origin and the construction site, also expressed in kg CO2e, and ③ energy consumption of construction equipment, Eci, which depends on the equipment’s power and type of energy used. The method for calculating GHG emissions is detailed in Equation (7).
E i = E m i + E t i + E c i .
Material consumption:
E m = i = 1 n v m i Q m i ,
where vmi is the emission factor for the i-th type of construction material (kg CO2e/kg or kg CO2e/m3), and Qmi is the consumption of the i-th type of construction material (kg).
Material transportation:
E t = i = 1 n v e t i Q e t i L e t i ,
where veti is the emission factor for transporting the i-th type of construction material (kg CO2e/(t·km)), Qeti is the total transportation quantity of the i-th type of construction material (kg), and Leti is the transportation distance for the i-th type of construction material (km).
Construction consumption:
E c = i = 1 n v e m i Q e m i + j = 1 n v e e j Q e e j + k = 1 n v p k Q p k
where vemi is the emission factor for the i-th type of fossil fuel (kg CO2e/kg or kg CO2e/m3), Qemi is the consumption of fossil fuel by the i-th type of machinery (kg or m3), veej is the emission factor for the j-th type of electrical energy (kg CO2e/(kW·h)), Qeej is the electricity consumption of the j-th type of machinery (kW·h), vpk is the emission factor for the man-hours of construction personnel, considering the emissions from essential infrastructure to support normal operations (kg CO2e/h), and Qpk is the man-hours for the construction personnel for the process (h).

2.3.3. Related GHG Emission Factors

During the construction process, the specific types and consumption of construction machinery are determined from a detailed engineering quantity list and comply with the comprehensive quota standards for machinery specified by Guangdong Province [47,48]. The man-days of construction personnel are calculated according to the daily average wage, as stipulated by the quota labor cost. Given the scarcity of building material manufacturers in the Shenzhen area, the transportation distance for all building materials is uniformly assumed to be 50 km, minimizing the impact of distance variation on GHG emission calculations [19]. The GHG emission factors related to building materials, transportation vehicles, and energy consumption are primarily derived from GB T51366-2019 [49] and the China Products Carbon Footprint Factors Database [50], as detailed in Table 2.

3. Effect of Stratum Variability on Bearing Capacity

3.1. Engineering Background

3.1.1. Project Overview

The Guangzhou–Dongguan–Shenzhen Intercity Railway offers essential transportation infrastructure support to facilitate the accelerated development of the Shenzhen–Hong Kong Innovation Cooperation Zone. This project employs a single-tube double-track circular shield tunneling technique with a shield diameter of 12.8 m. Situated in the Futian District of Shenzhen, an area densely populated with high-rise buildings and lined with numerous structures, stringent control of ground settlement is imperative. Shield tunneling construction is divided into three phases: launching, interval tunneling, and arrival at the reception stage, the shield launch being a pivotal phase [51] that significantly influences the construction quality of the shield tunnel. Shield launching typically requires pre-reinforcement of the soil ahead of tunneling to sufficiently support the tunnel face and prevent collapse [52]. The project incorporates two innovative foundation treatment pile technologies, depicted in Figure 4: DCM piles, which utilize cement as the primary solidifying agent and mix it with the foundation soil using deep mixing machinery to create a vertically reinforced composite foundation, and HPJG piles, where a high-pressure cement slurry is ejected horizontally from rotating drill rod nozzles, cutting through the soil and forming a jet stream that integrates with the soil to establish a vertically reinforced cement–soil composite foundation.

3.1.2. Geological Condition Investigation

The project is situated in a marine alluvial-fluvial plain, where widespread weak foundations pose significant construction challenges. Table 3 lists the detailed parameters of the strata used in this study.

3.2. Bearing Capacity of Foundation Treatment Piles

3.2.1. Selection of Pile Dimensions

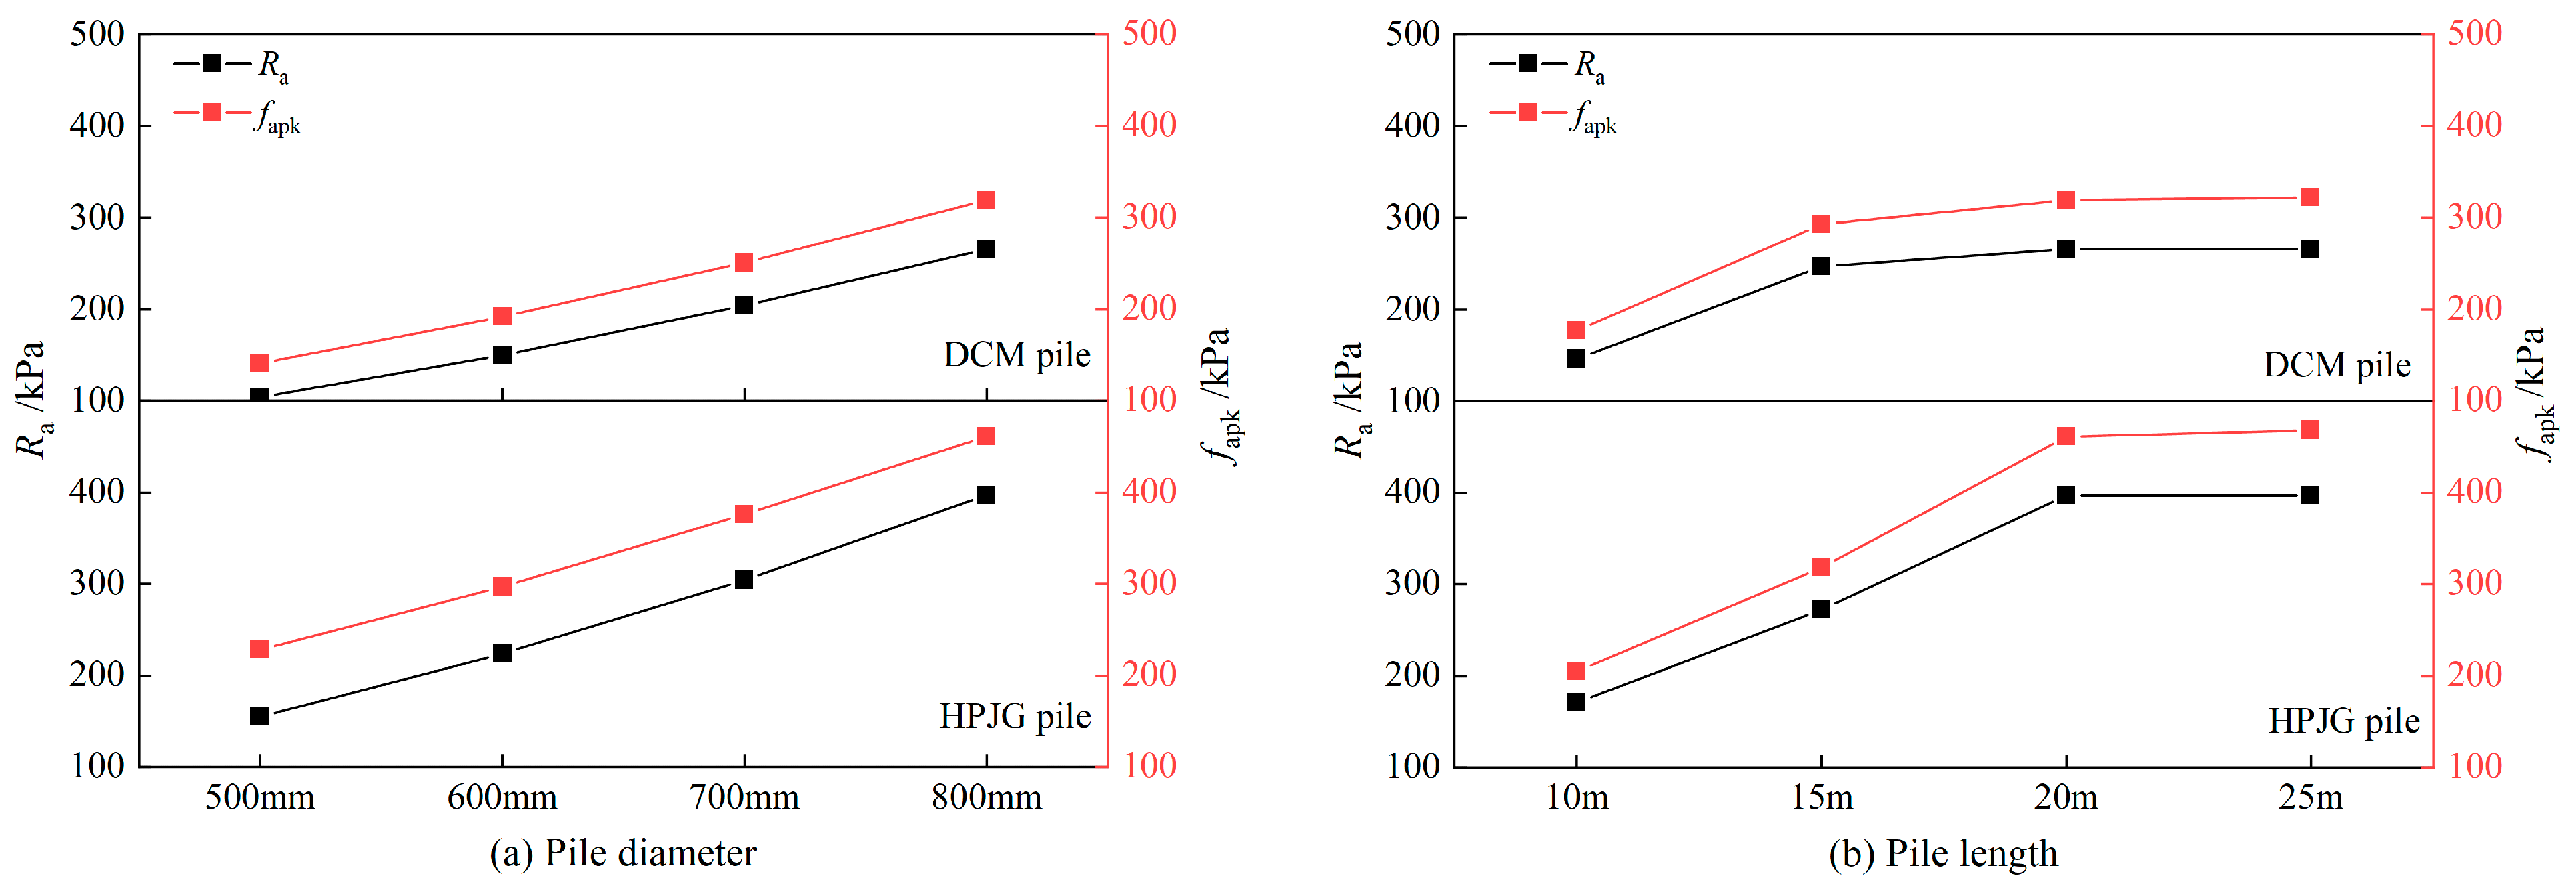
The influence of geological variability on the selection of pile dimensions mainly includes the diameter and length of the piles. In this section, piles with a diameter of 800 mm and a length of 20 m are used as the comparison benchmark. The variation in the pile bearing capacity caused by pile dimension can be calculated using Equations (1)–(3). Figure 5 illustrates the impact of two types of pile sizes (DCM and HPJG) on the bearing capacity. Figure 5a shows the relationship between the diameters and their respective Ra and fapk values. An increase in the pile diameter led to a linear increase in both Ra and fapk for these piles while maintaining a 1 m pile spacing. Ra reflects the bearing capacity of the pile and is directly related to its diameter. A larger diameter can withstand greater vertical loads. fapk indicates the interaction between the bearing capacity of the pile and the surrounding soil; piles with larger diameters transfer loads more effectively to the surrounding soil, thereby increasing the bearing capacity of the adjacent soil. Figure 5b illustrates the relationship between the lengths and their respective Ra and fapk values. For both the DCM and HPJG piles, Ra and fapk generally increased with the pile length; however, beyond a certain length, additional increases had a marginal effect on enhancing the bearing capacity. This limitation stems from the definitions of the design standards for calculating individual pile bearing capacities. In shallow strata, the bearing capacity of a single pile is primarily determined by qsia and qp in contact with the soil layer. In deep strata, the bearing capacity of a single pile is mainly determined by the compressive strength of the pile; hence, the bearing capacity no longer increases with increasing pile length. Therefore, from a design perspective, excessively long piles not only contribute to unnecessary construction waste but also offer limited benefits in terms of enhancing bearing capacity.

3.2.2. Spatial Distribution of Soil Layers

The variation in the pile bearing capacity caused by the spatial distribution of the soil layers can be calculated using Equations (1)–(3), as shown in Figure 6. In this study, the boundary between shallow and deep strata is defined at 10 m below the surface. Figure 6a shows the soil structure transitioning from upper clay to sandy clay in the shallow strata, where the thickness of the soil layer adjacent to the pile varies by location. Figure 6b shows the variation pattern of bearing capacity in this situation. In shallow strata, the bearing capacity of a pile depends on the influence of the side resistance, primarily determined by the interface friction between the pile side and the soil. As the thickness of the sandy clay layer gradually increased, the bearing capacity correspondingly increased. In the deep strata, Figure 6c depicts a deep soil structure transitioning from upper silty clay to granite residual soil. In the deep strata, the bearing capacity of a pile is less influenced by side resistance and is primarily determined by the contact between the pile tip and the soil. As the thickness of the granite residual soil gradually increased, the single-pile bearing capacities for both construction methods remained stable, indicating that the designed bearing capacity of piles in deep strata primarily relies on the compressive strength of the pile itself (Figure 6d). Meanwhile, the foundation bearing capacity exhibited a slight increase, primarily because the characteristic values of fsk in the strata change.
Generally, changes in the stratum in both the horizontal and vertical directions can affect the bearing capacity of the pile. In conventional engineering analysis, it is commonly assumed that the strata thickness is consistent, implying that soil layers are uniformly distributed in depth, without considering the possible spatial heterogeneity that always exists. However, the actual geological conditions are typically more complex, and the structure of the soil layers at different locations exhibits significant variations. These variations include changes in the soil types and alterations in their physical and mechanical properties. Therefore, to accurately assess engineering behavior and performance, it is imperative to thoroughly understand the non-uniformity of soil layers in foundation design.

3.2.3. Changes in the Mechanical Properties of Soil

It is important to note that the spatial distribution of soil is not the only factor influencing bearing capacity; the physical and mechanical properties of the soil also have a significant effect. When assessing the bearing capacity, the characteristic values of qsia, qp, and fsk are essential parameters that directly affect the reliability of the pile foundation design. These values are influenced by the physical and mechanical properties of the soil, as detailed in Table 3. As the soil depth increased, the values of c and φ gradually increasd and exhibited a positive correlation with qsia, qp, and fsk. Figure 7 illustrates the variations in the bearing capacities of the DCM and HPJG piles under different stratum conditions. The results demonstrate that in shallow strata, qsia significantly influences the bearing capacity. The bearing capacity of the HPJG piles was marginally higher than that of the DCM piles, suggesting that the pile construction method has a key effect on enhancing bearing capacity. In the deep strata, the impact of the soil layer parameters on the bearing capacity was minimal, whereas the influence of the construction method was more pronounced. The HPJG piles exhibited a significantly greater bearing capacity than the DCM piles, which is attributed to the generally higher compressive strength of the pile body following construction for the HPJG piles.

4. GHG Emissions of Foundation Treatment Piles

4.1. GHG Emissions Assessment

4.1.1. DCM Pile

The GHG emissions were calculated by evaluating the construction of five DCM piles, each with a diameter of 800 mm and length of 20 m. The water–cement ratio for the DCM piles was maintained at 1.0, featuring 20% cement slurry incorporation and a 0.5% additive proportion. During construction, the sinking and lifting speeds of the soil mixing were controlled at 0.6 m/min, employing a technique involving two mixings and two sprayings.
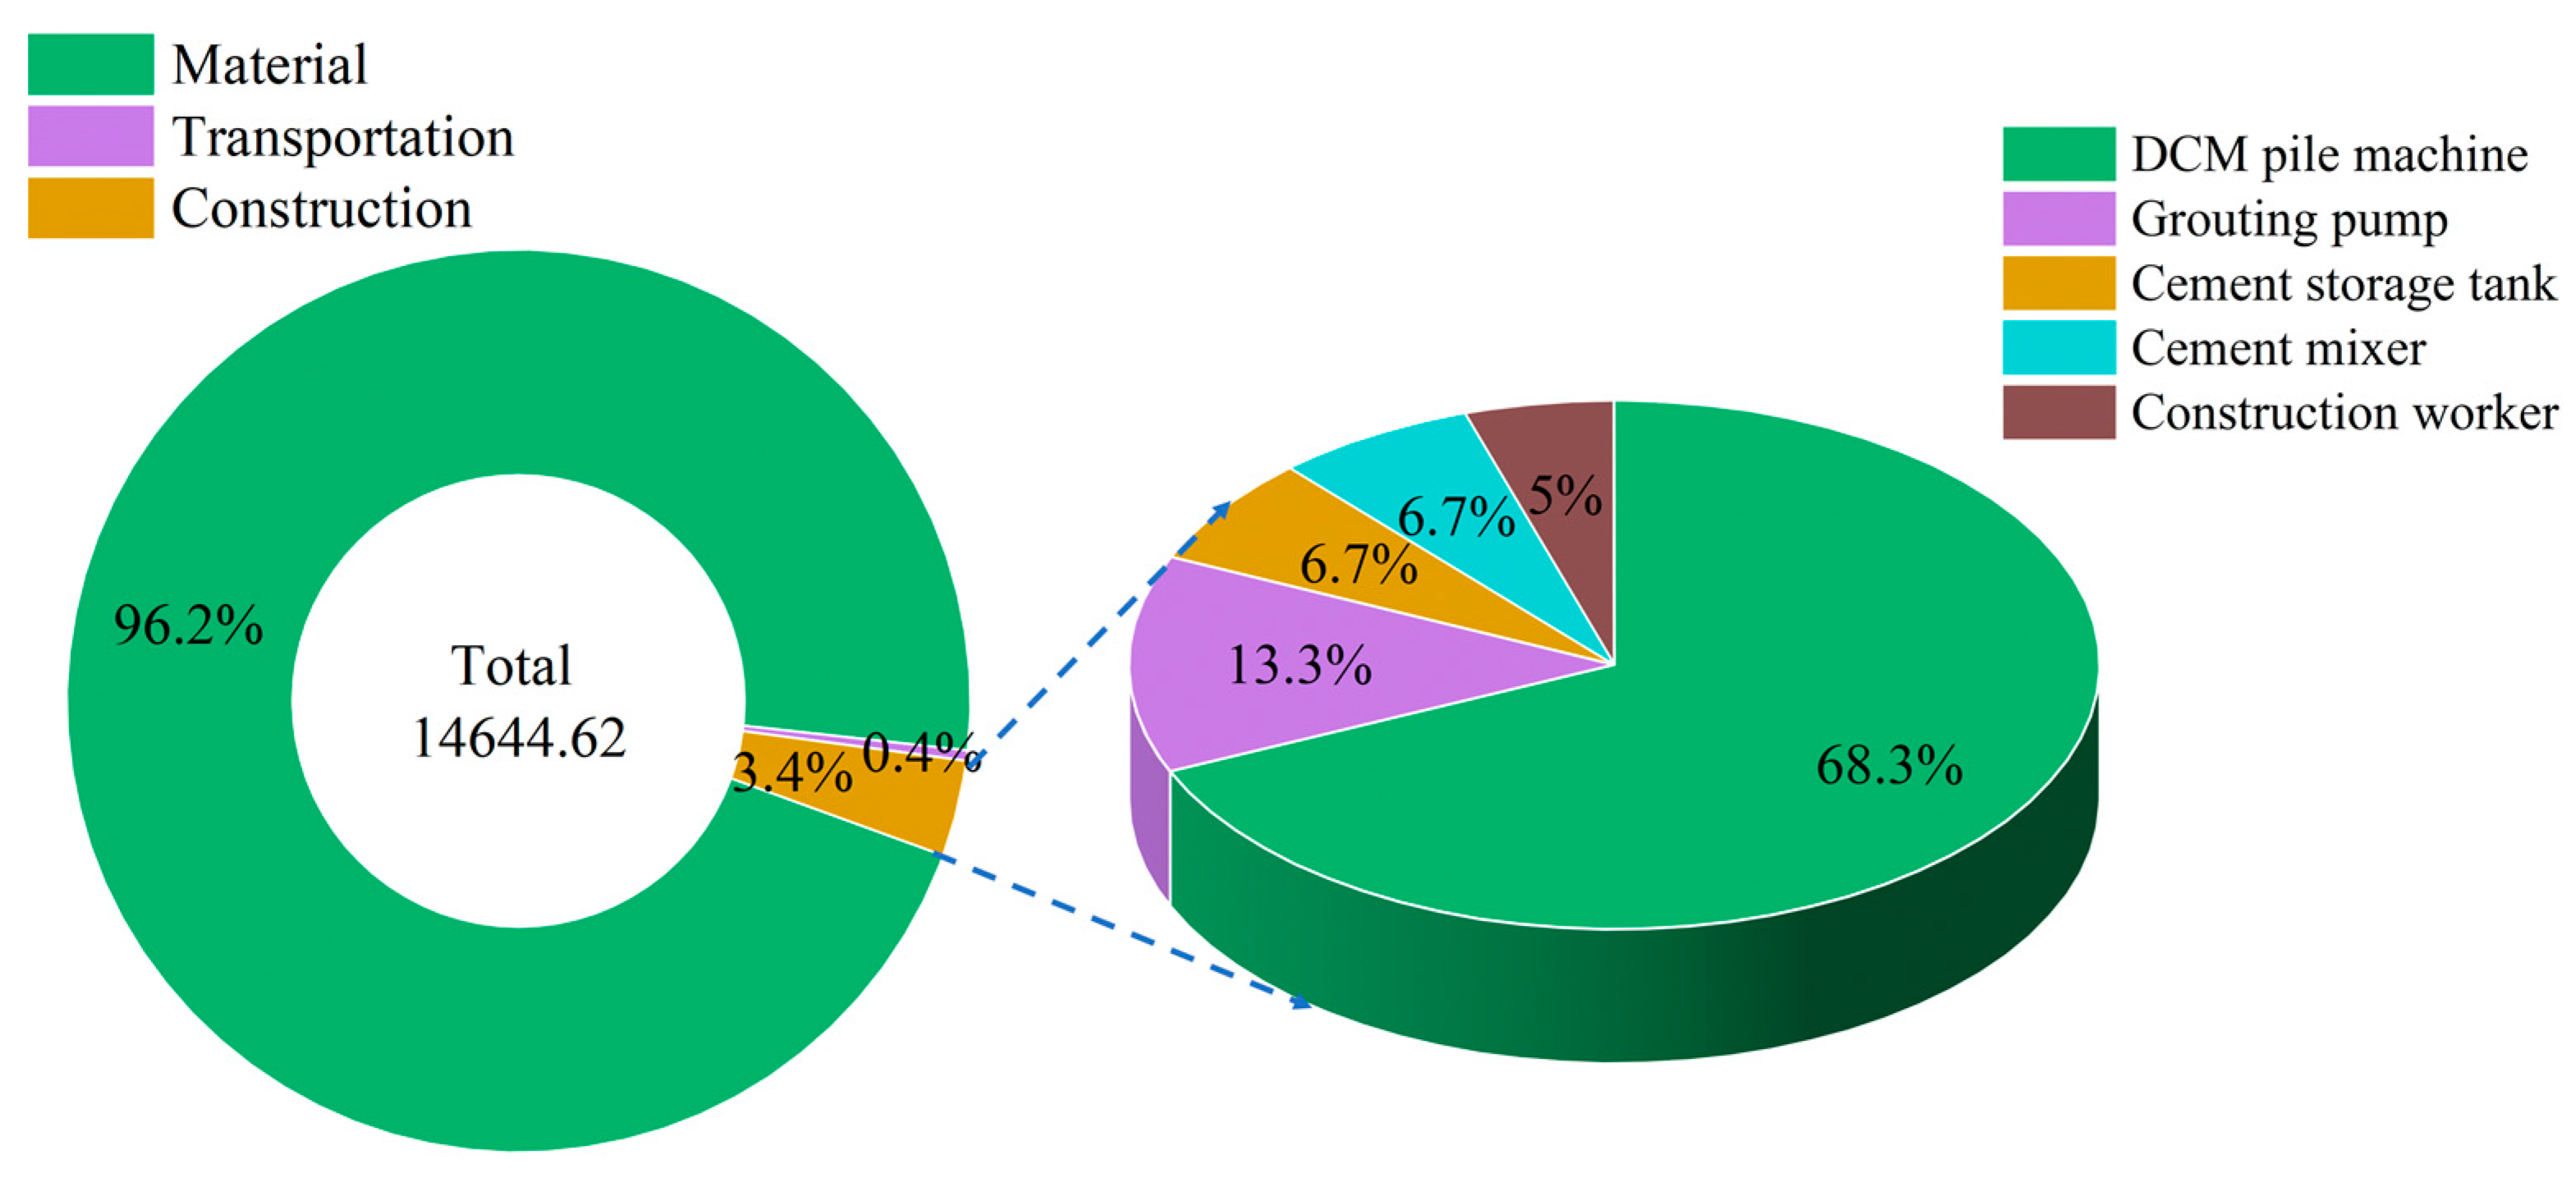
According to Table 4 and Table 5 and Equations (6)–(10), the total GHG emissions from the DCM piles during the construction stage amounted to 14,644.62 kg CO2e, and the GHG emission intensity for the DCM piles was calculated as 146.4 kg CO2e/m. As illustrated in Figure 8, during the construction of the DCM piles, GHG emissions from the building material production, transportation, and pile construction stages constituted 96.2%, 0.4%, and 3.4% of the total emissions, respectively. Cement, being the primary source of GHG emissions from building materials, contributes significantly owing to the high energy consumption and CO2 emissions involved in its production process [53]. Consequently, the use of granulated blast-furnace slag (GGBS), a byproduct of steel production, as an alternative to ordinary Portland cement has become increasingly popular [19]. The incorporation of GGBS into the concrete mix not only reduces the carbon footprint by lowering the proportion of ordinary Portland cement but also ensures compliance with strength standards [54]. Furthermore, GHG emissions during the pile construction phase primarily arose from the operation of the DCM piling machine, accounting for 68.4% of the emissions from machinery use.

4.1.2. HPJG Pile

Similar to the DCM piles, the GHG emissions were assessed by evaluating the volume of five HPJG piles, each with a diameter of 800 mm and a length of 20 m. During construction, the water–cement ratio for each pile was maintained at 1.0, the cement slurry mix ratio was 20%, the additive ratio was 0.5%, and the cement slurry injection speed was regulated at 0.2 m/min.
According to Table 6 and Table 7 and Equations (6)–(10), the total GHG emissions for the construction phase of HPJG piles were 15,607.62 kg CO2e, and the GHG emission intensity for HPJG piles was calculated as 156.1 kg CO2e/m, representing a 6.58% increase over DCM piles. Figure 9 illustrates the GHG emission distribution during the construction of DCM piles, where the production of building materials, transportation of building materials, and pile construction stages accounted for 90.3%, 0.4%, and 9.4% of the total emissions, respectively. Among the building materials, cement continues to be the primary source of implicit GHG emissions. Concurrently, the proportion of GHG emissions during the pile construction stage increased, mainly because of the heightened complexity of HPJG pile construction, which involves the extensive use of mechanical equipment.

4.2. Effect of Stratum Variability on GHG Emissions

4.2.1. Pile Dimensions

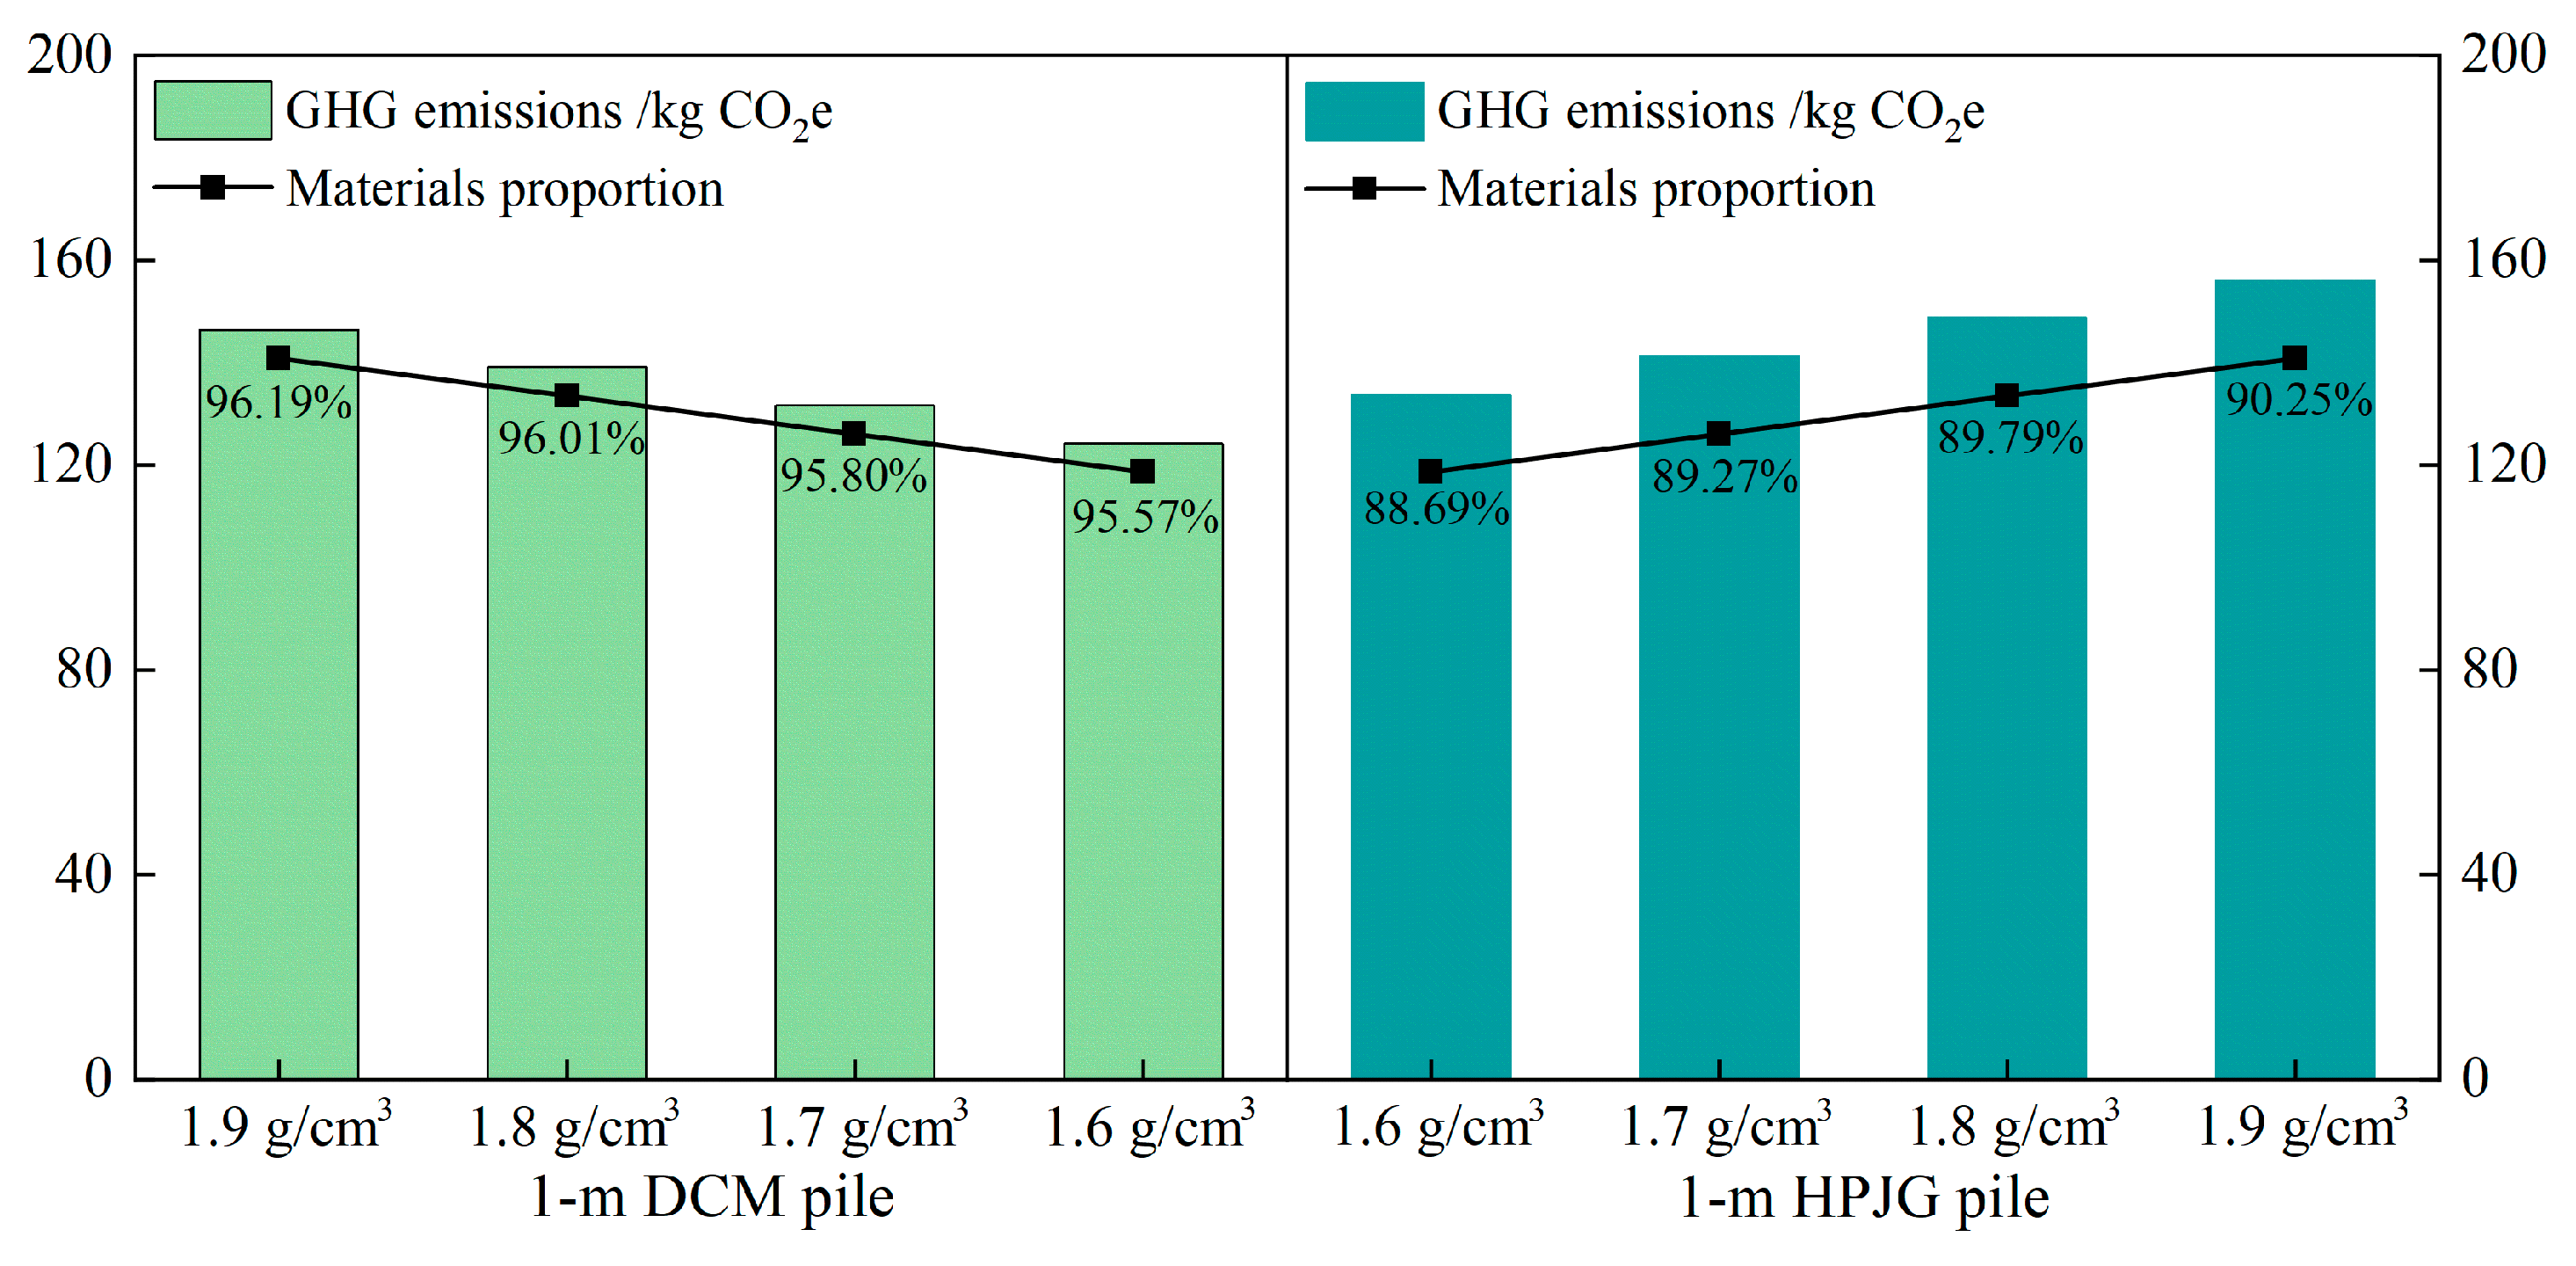
Natural sedimentation processes, geological movements, and human activities can cause variability in the spatial distribution of soils. This variability influences the selection of pile sizes at the design stage. According to the data in Figure 10, an increase in the pile diameter was positively correlated with an increase in the GHG emissions for both types of piles. Specifically, when the pile diameter was 500 mm, the proportions of GHG emissions related to materials for the DCM and HPJG piles were 91.29% and 78.72%, respectively. When the diameter increased to 800 mm, the proportions increased to 96.19% and 90.29%, respectively. This suggests that the pile diameter is directly linked to material usage and predominantly governs GHG emissions. Additionally, the length of the pile exerted a direct linear effect on GHG emissions. This outcome is unsurprising given that the pile length served as the functional unit in the assessments. Therefore, with increasing pile length, the GHG emissions also increased linearly.

4.2.2. Pile Construction Conditions

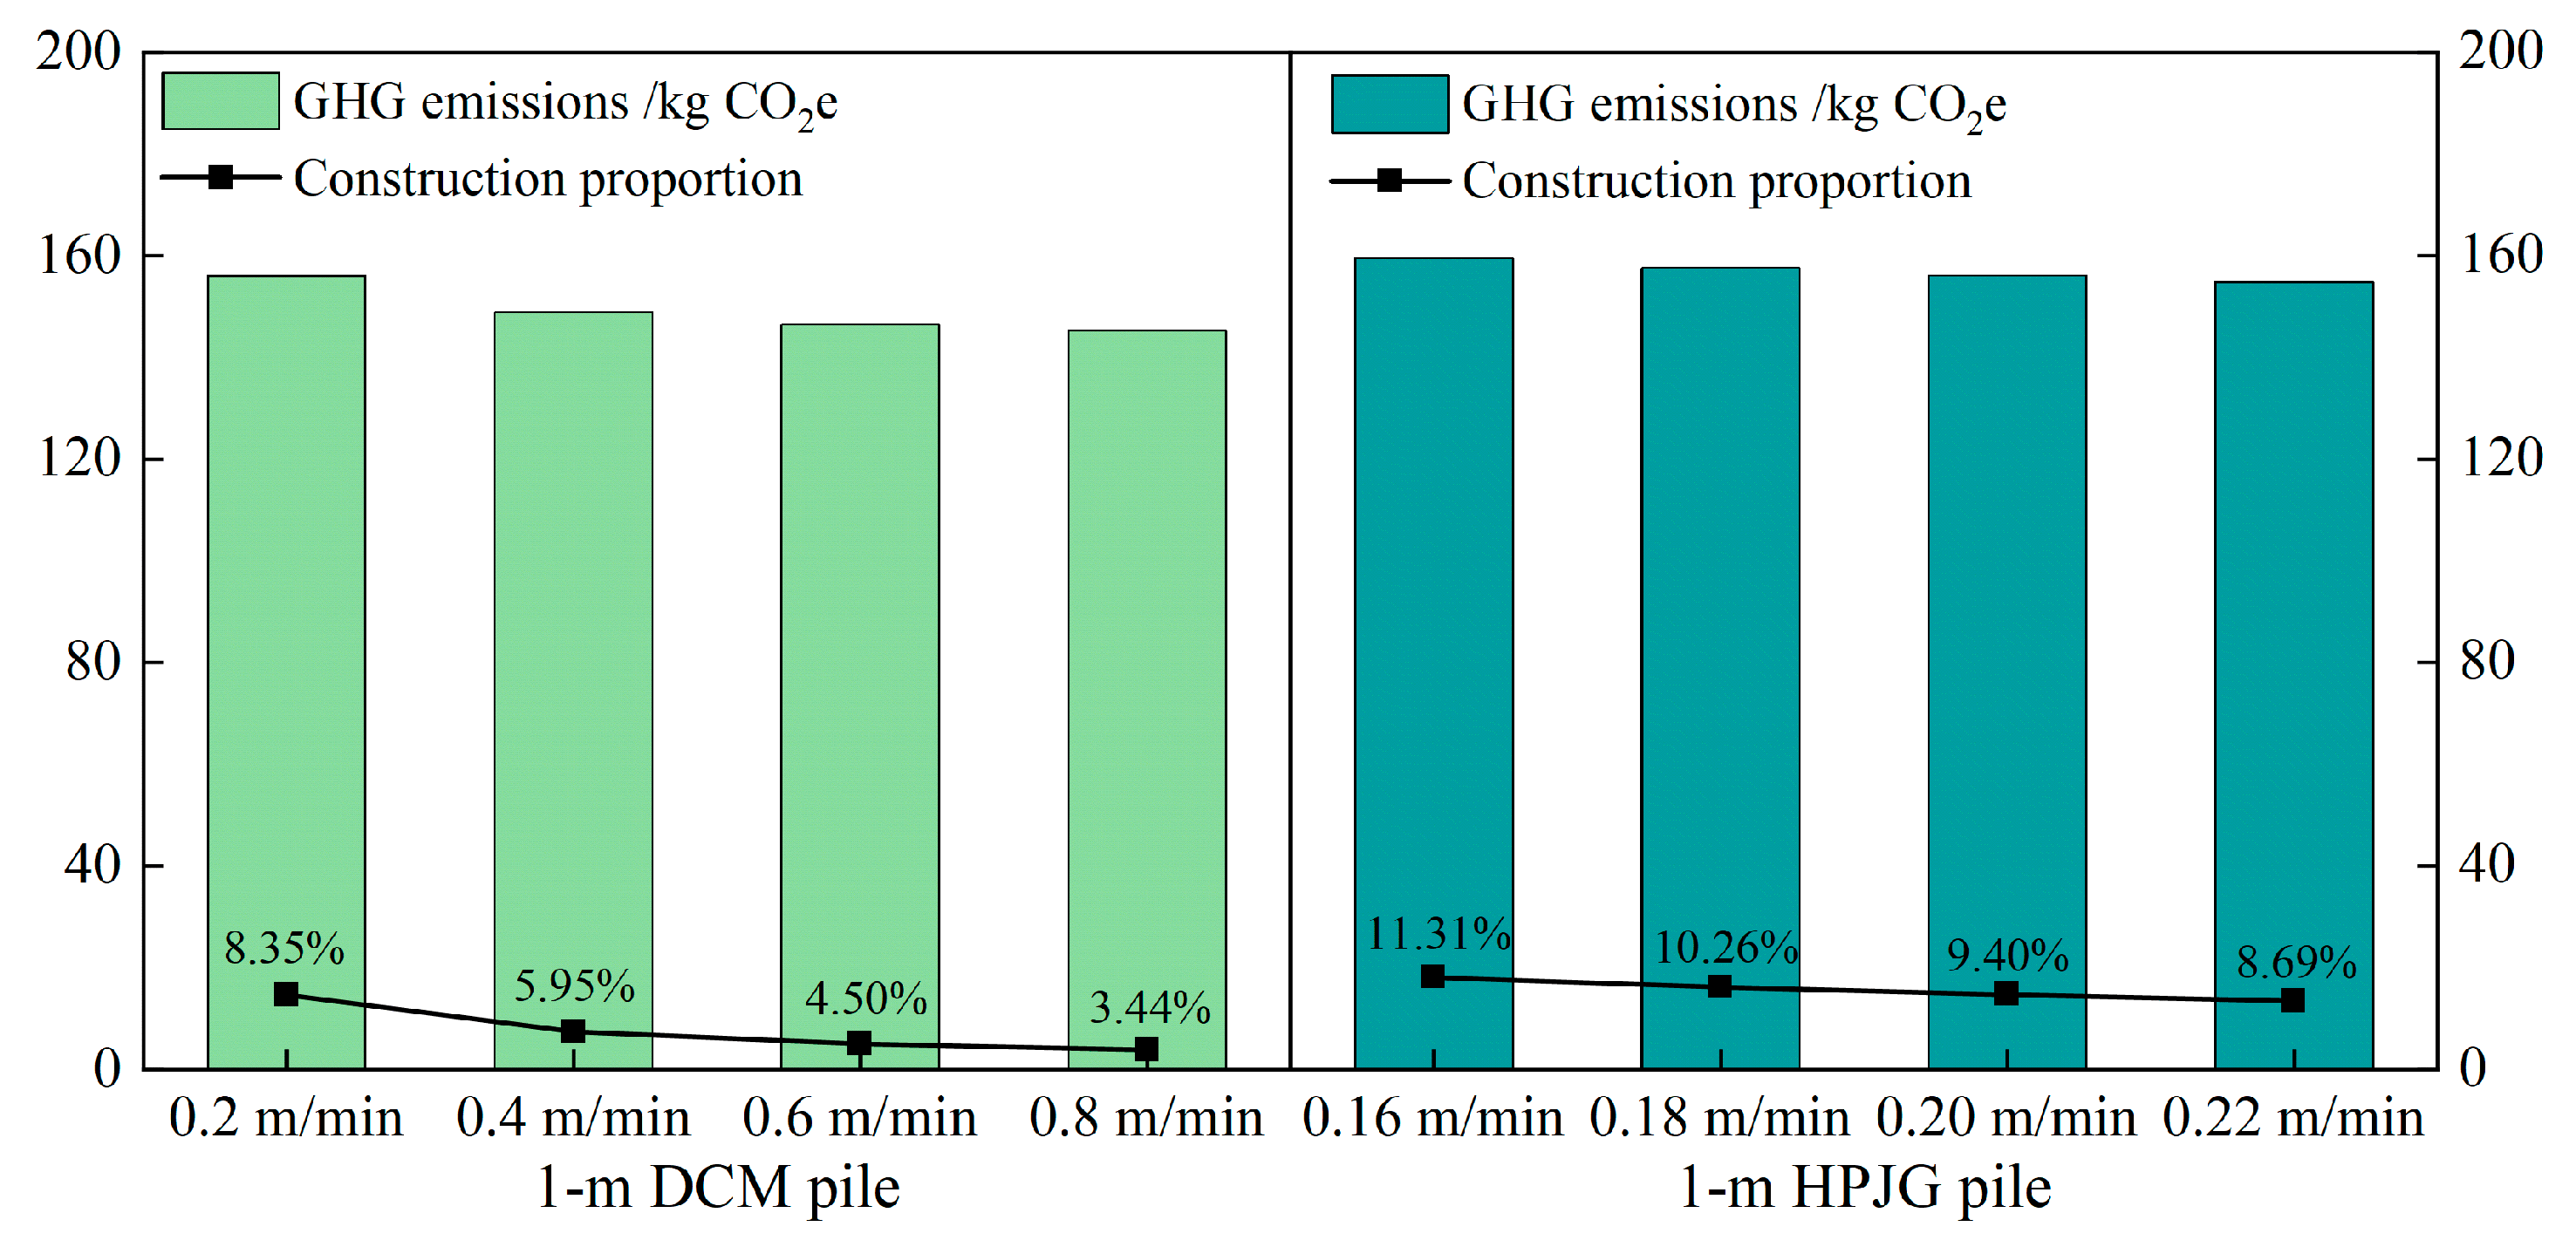
The speed of pile construction is influenced by both the pile driving technology and geological conditions. In hard soil layers, the drilling speed is generally lower, whereas in soft or loose sandy soils, it tends to be higher. Typically, the mixing speed for DCM piles should not exceed 0.8 m/min, while the construction speed for HPJG piles should be maintained within the range of 0.16–0.22 m/min to ensure construction quality. According to the data shown in Figure 11, the speed of pile construction has a significant impact on GHG emissions, which is primarily reflected in the use of mechanical equipment during construction. Although the GHG emissions from the two types of piles were not significantly different at varying construction speeds, the proportion of emissions generally decreased as the construction speed increased, and the reduction rate for DCM piles was typically lower than that for HPJG piles.

4.2.3. Soil Mechanical Parameters

Soil density is an important indicator of stratum compactness. Figure 12 shows the impact of soil density on the GHG emissions associated with piles. As soil density increased from 1.6 to 1.9 g/cm3, GHG emissions correspondingly increased, paralleled by an increase in the implied GHG emissions from building materials. However, this increase was relatively more sensitive compared to the other influencing factors.

5. Integrated Optimization Design Assessment for Foundation Reinforcement Treatment

5.1. Sensitivity Analysis

5.1.1. GHG Emission Influencing Factors

Within the LCA framework, although the results are typically regarded as specific estimation points, the variability of LCI data and potential uncertainties should be considered [55]. Identifying these uncertainty factors is essential for sensitivity analysis, which is vital for verifying data reliability and the scientific validity of model assumptions. Consequently, this study used data extracted from actual construction volume lists and quotas to estimate GHG emissions across diverse construction scenarios. This methodology considers the extensive expertise of construction field experts, regional variations, and the impact of ongoing investments, yielding results that closely align with actual construction conditions.
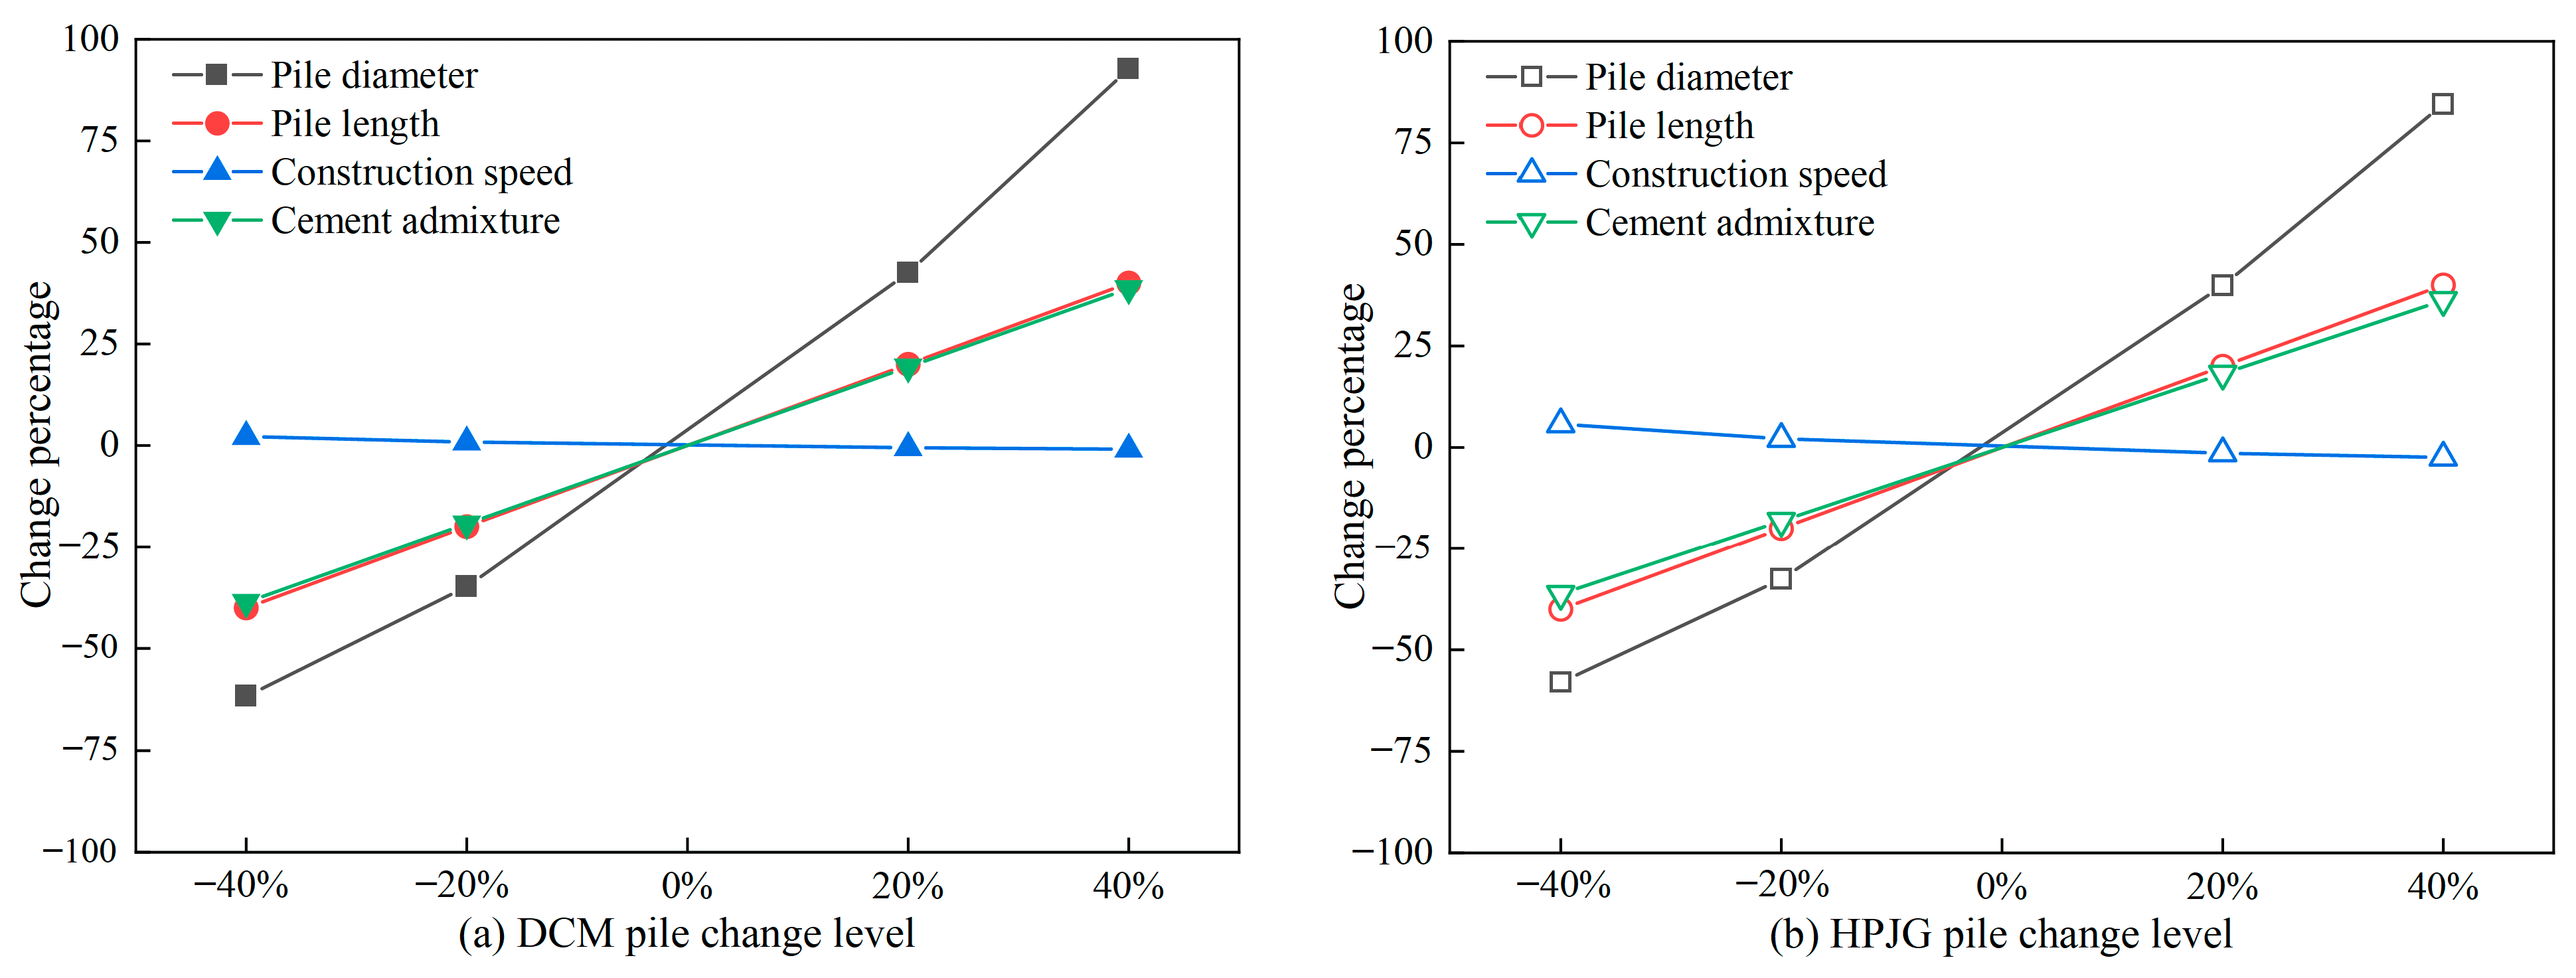
The sensitivity analysis of GHG emissions in the design of pile treatment foundations incorporated multiple key parameters analyzed at five distinct levels of change based on the benchmark data for the two types of piles described in Section 4.1: reductions of 40% and 20%, the current level (100%), and increases of 20% and 40%. The objective was to evaluate the trend in GHG emissions under various conditions and identify the factors within the pile foundation design parameters that most significantly impact GHG emissions. Employing a one-at-a-time (OAT) sensitivity analysis, each parameter was altered individually, while the others remained constant to observe changes in GHG emissions. The results, as depicted in Figure 13, demonstrated that changes in the diameter significantly increased GHG emissions, underscoring this as a highly sensitive parameter. Conversely, changes in construction speed had a comparatively minor impact on GHG emissions, exhibiting a lower sensitivity within the selected range of changes. Additionally, the effects of pile length and soil density on GHG emissions were consistent across various levels of change, reflecting similar patterns of these factors influencing emissions.

5.1.2. Influencing Factors on Bearing Capacity

Employing the same method as the carbon emission sensitivity analysis, the analysis of the bearing capacity factors, as illustrated in Figure 14, revealed that the influence of the pile diameter on the bearing capacity was greater than that of the pile length. Figure 15 further presents the sensitivity of the soil layer parameters to the bearing capacity. In the shallow layers, qsia was highly sensitive to Ra and fapk, whereas, in the deep layers, fsk exhibited the greatest sensitivity to fapk. Overall, the diameter of a pile is a key factor influencing its bearing capacity. Larger diameters increase the contact area with the soil, resulting in a higher bearing capacity and enhanced stability. Similarly, the length of a pile is a crucial factor in determining its performance and affects its ability to transfer loads to deep soil or rock layers. Long piles can reach hard strata, thereby significantly enhancing the overall stability and bearing capacity of the structure.

5.2. Stratum Variability on Reinforcement Effectiveness

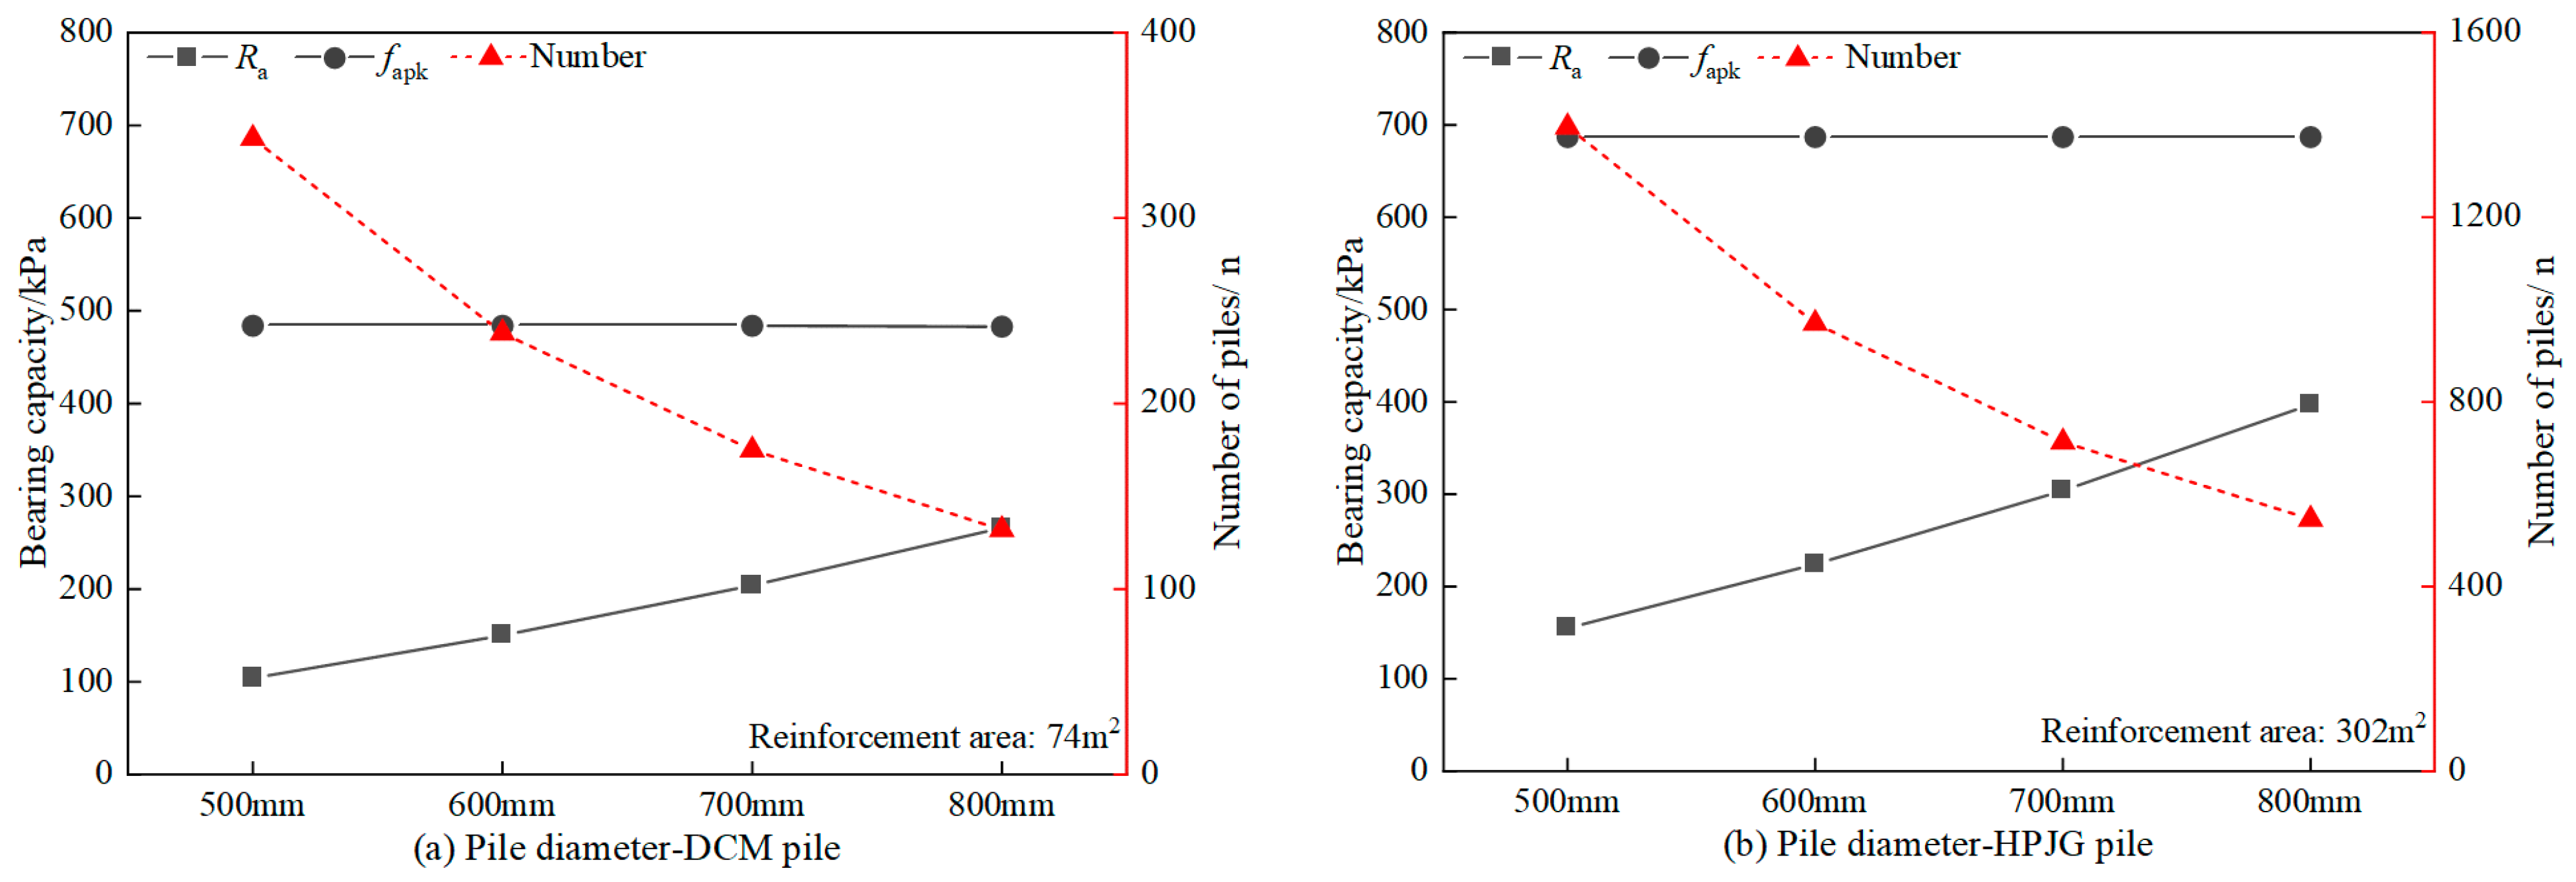
To achieve more environmentally friendly construction strategies, it is essential to find a balance between ensuring structural performance (e.g., increasing bearing capacity) and minimizing environmental impacts (e.g., reducing GHG emissions). This study provides a comprehensive analysis based on the selection and arrangement of piles in the foundation reinforcement area of the Guangzhou–Dongguan–Shenzhen Intercity Railway initiation section. The reinforcement plan for the weak foundation in the area was analyzed to consider the variability of the geological strata. The total construction area was 376 m2, with a DCM pile reinforcement area of 74 m2 and an HPJG pile reinforcement area of 302 m2. The length of the foundation treatment pile was 20 m, and an overlapping pile arrangement construction method was used. Sensitivity analysis confirmed that changes in diameter significantly affect both the GHG emissions and the bearing capacity of piles. Therefore, the pile diameter was selected to analyze the effectiveness of the foundation reinforcement. Figure 16 shows the relationship between the bearing capacity of the reinforcement area and the number of piles. Using the overlapping pile arrangement method, increasing the pile diameter effectively reduced the number of piles required during the foundation treatment process without altering fapk, while also enhancing the bearing capacity of an individual pile.

5.3. Comparison of Optimization Results for Foundation Treatment Piles

The traditional overlapping pile arrangement method employs a spacing smaller than the pile diameter across the construction area, primarily to ensure soil stability and prevent seepage during shield tunneling. However, the reinforcement form in areas where shield tunneling construction does not pass through has caused unnecessary waste. Therefore, this study proposed a new piling scheme in which overlapping piles are utilized in the shield tunneling reinforcement area, whereas spaced piles are employed in non-reinforced areas. As shown in Figure 17, the proposed scheme can reduce the number of piles. Although adopting a new plan will reduce fapk, this reduction is still within an acceptable range and can meet construction needs. The reinforcement areas of the DCM and HPJG piles constructed using this reinforcement method were 33 m2 and 133 m2, respectively.
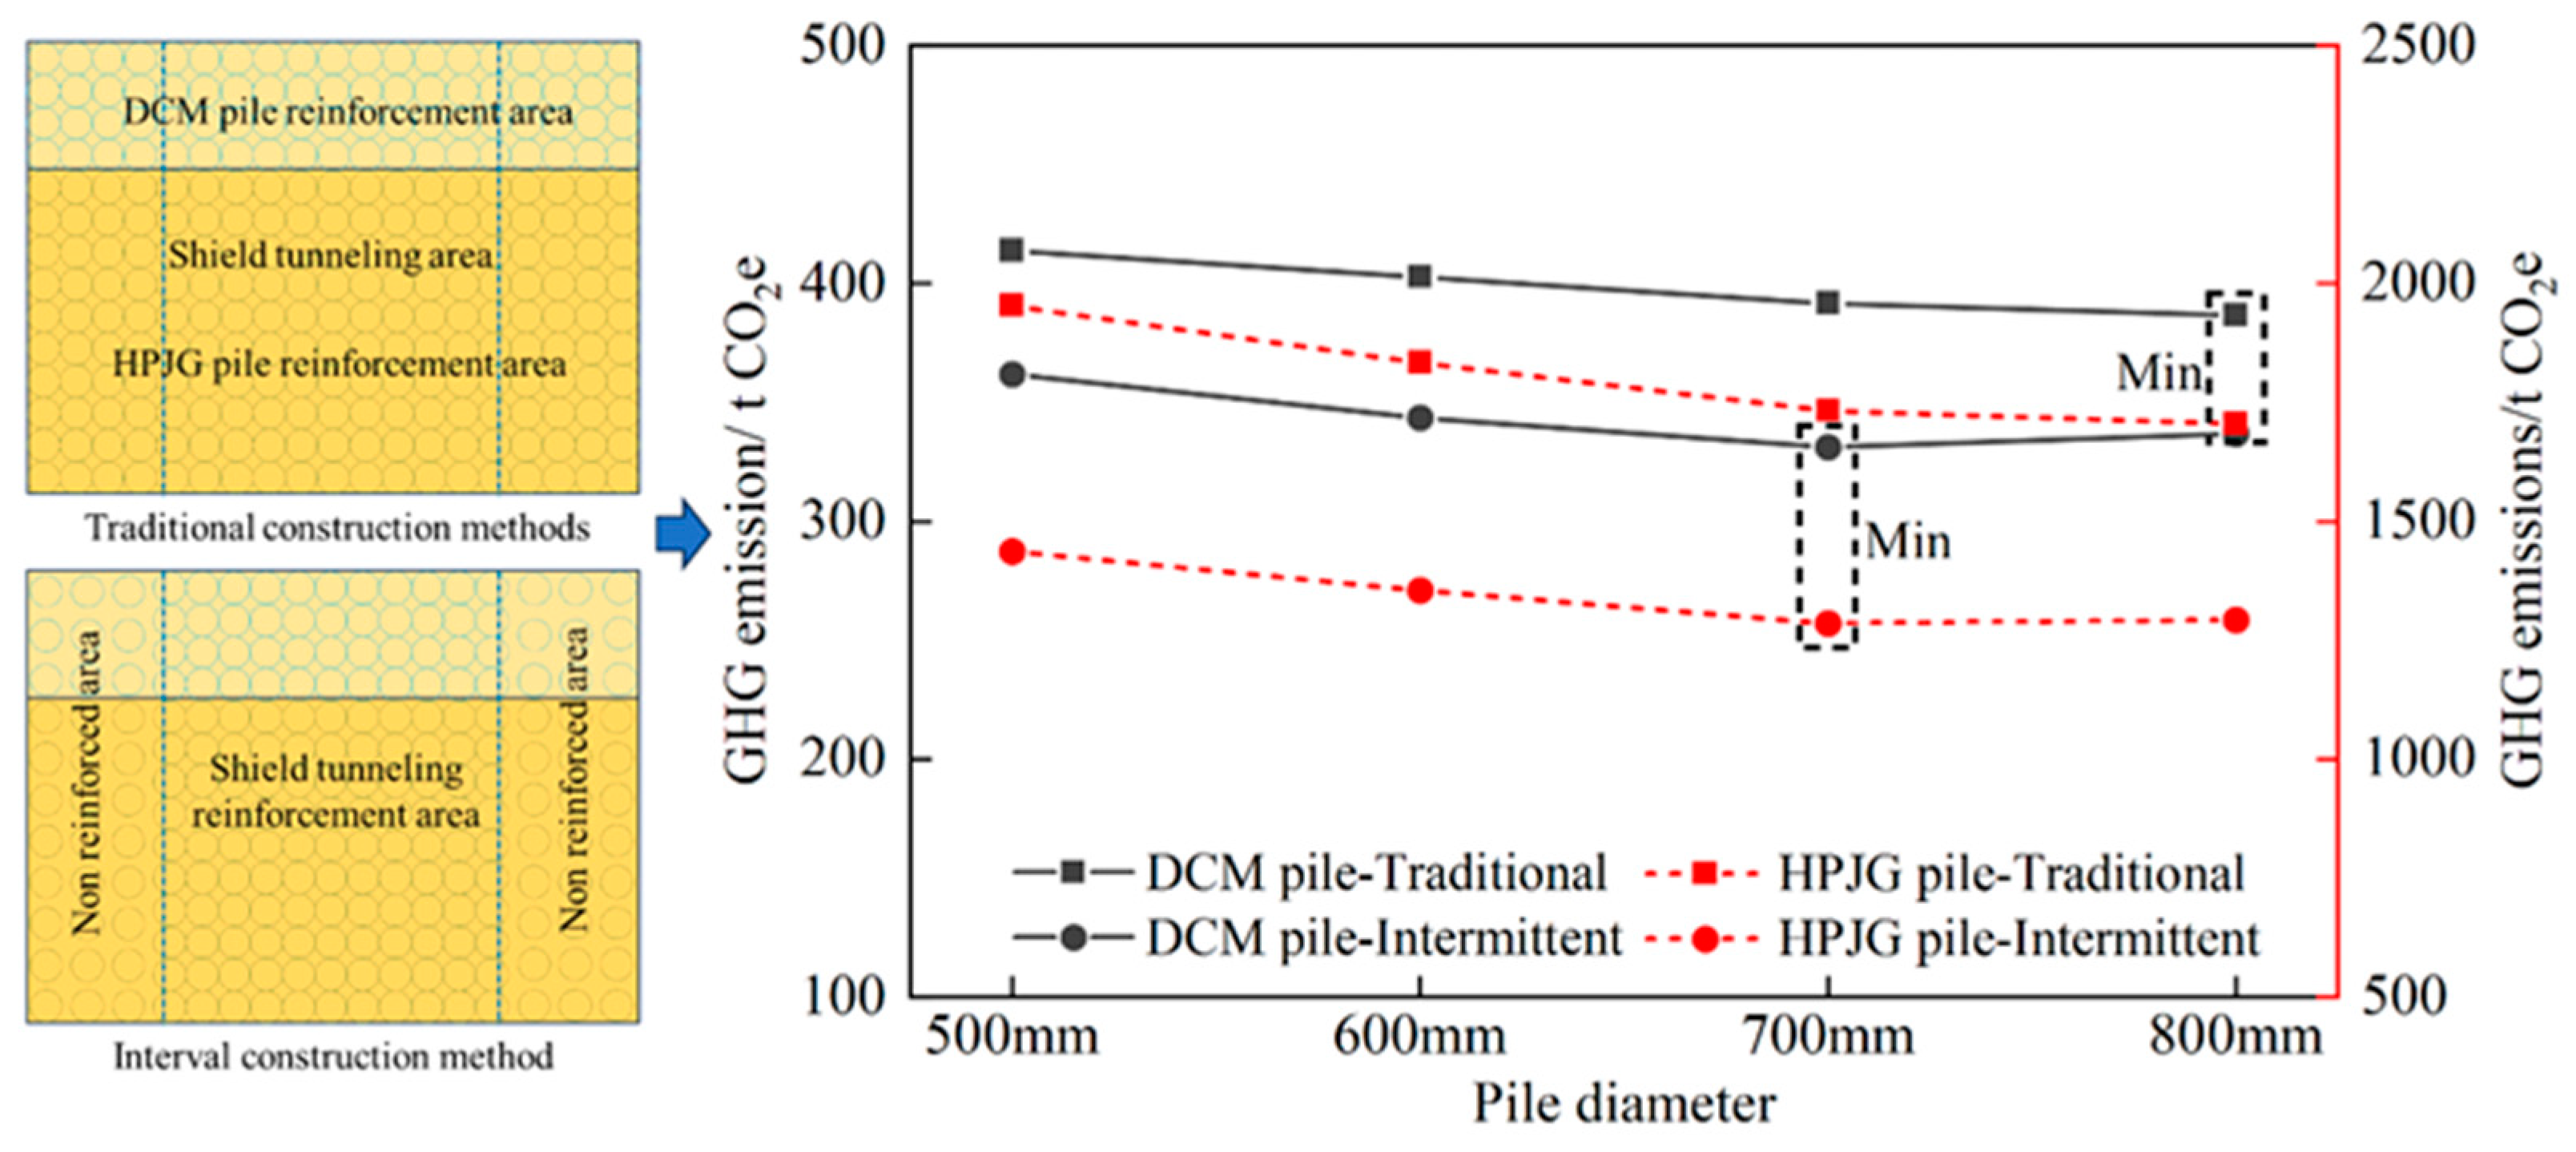
Figure 18 shows the total GHG emissions for the two construction schemes under the required bearing capacity. The results demonstrated that in traditional construction methods, piles with a diameter of 800 mm were the most effective at reducing emissions, whereas in intermittent construction methods, piles with a diameter of 700 mm exhibited the lowest GHG emissions, confirming the effectiveness of the new construction method in reducing GHG emissions. Figure 19 presents a comparison of the GHG emissions between traditional construction methods and the new intermittent construction technique. The results demonstrated that the new construction method can reduce overall GHG emissions by 22.7%. However, this method requires sophisticated construction management and resource allocation methods. This analysis offers a vital perspective, emphasizing that the construction industry, while pursuing structural performance and engineering quality, must also thoroughly consider its environmental responsibilities.

6. Discussion

6.1. Contributions and Limitations

This study introduced an innovative design optimization framework that seamlessly integrates environmental considerations into the design process of foundation treatment piles. By incorporating LCA, this research contributes significantly to the existing knowledge by illustrating how engineering practices can align with environmental sustainability goals.
Despite its contributions, several limitations should be discussed to provide a comprehensive understanding of the study. One key limitation is the accuracy of design optimization, which heavily depends on the precision of the underlying geological data. Inadequate sampling or outdated historical records may compromise this precision, leading to uncertainties in the optimization results and potentially affecting the reliability of the proposed solutions. Another important aspect is the difference in GHG calculations between the design phase and the construction phase. During the design phase, GHG emissions are estimated based on theoretical models and assumptions about material usage, transportation, and construction methods. These models aim to predict the environmental impact accurately but may not fully capture the variability and complexity of on-site conditions during construction.

6.2. Application Prospect

The analysis identified that uncertainties stem from the variability in geological data and construction practices. Future studies could significantly benefit from incorporating more robust uncertainty quantification methods to enhance confidence in the findings and deepen our understanding of the range of potential outcomes under different scenarios. Simultaneously, the adoption of more advanced geological exploration techniques can provide more detailed and continuous stratigraphic data. The use of machine-learning algorithms to identify potential geological variability enhances the effectiveness of geological data. Furthermore, the development of more precise models to calculate carbon emissions that consider regional variations in construction practices and materials will yield more accurate assessments and tailored recommendations. Investigating the application of the optimization framework to other foundation treatment pile types could validate its effectiveness and adaptability, potentially leading to broader engineering adoption.

7. Conclusions

This study explored comprehensive decision-making regarding GHG emissions and the bearing capacity of foundation treatment piles from the construction design perspective. It assessed the environmental impact of foundation bearing piles by considering factors such as pile diameter, construction method, and variability in stratum condition and introduced an integrated optimization design method for foundation treatment piles. The main conclusions are obtained as follows.
(1)
The GHG emissions during the construction stage of two types of foundation treatment pile technologies were compared using the LCA framework. The GHG emission from HPJG piles was found to be 6.58% higher than that from DCM piles. For both types of piles, the utilization of cement material was the primary driver of GHG emissions, constituting over 90% of the emissions. Particularly in HPJG piles, the complexity of construction technology, which involves increased machinery use, led to a higher proportion of GHG emissions from the equipment.
(2)
The diameter is a highly sensitive parameter that significantly influences pile GHG emissions. As the diameter increased, the GHG emissions increased significantly. At a pile diameter of 500 mm, the material emission ratios of the DCM and HPJG piles were 91.29% and 78.72%, respectively, whereas, at a diameter of 800 mm, these ratios increased to 96.19% and 90.29%, respectively. Although the soil density and construction speed also influenced GHG emissions, their sensitivities were comparatively lower. It is advisable to utilize low-carbon materials as substitutes for ordinary Portland cement to reduce the carbon footprint of projects while meeting structural strength requirements.
(3)
The pile diameter is a critical factor in determining the bearing capacity of piles, and its impact surpasses that of the pile length. HPJG piles generally provide higher bearing capacities owing to the increased compressive strength of the pile body after construction. The characteristic values of the soil side friction resistance, pile end-bearing resistance, and bearing capacity of natural soil are crucial parameters that influence the bearing capacity of pile foundations. The variation in these parameters affects the bearing capacity of layers with different thicknesses in varying ways. In deep layers, it is advisable to focus more on the selection of construction methods and materials, whereas in shallower layers, prioritizing the side friction resistance and end-bearing resistance is recommended.
(4)
The design framework proposed in this study facilitated a comprehensive assessment of the environmental impact and bearing performance of the pile foundation design. Remarkably, this innovative construction method can reduce overall GHG emissions by approximately 22.7%. By adopting a novel arrangement scheme that implements overlapping piles in the shield tunneling reinforcement area and spaced piles in non-reinforcement areas, this method not only satisfies the requirements for bearing capacity and impermeability but also significantly reduces GHG emissions.

Author Contributions

Conceptualization, X.B. and J.S.; methodology, H.Y.; validation, J.S. and H.C.; formal analysis, X.Z.; investigation, H.Y.; data curation, H.Y.; writing—original draft preparation, H.Y. and X.Z.; writing—review and editing, J.S.; supervision, J.S.; project administration, X.B.; funding acquisition, X.B and X.C. All authors have read and agreed to the published version of the manuscript.

Funding

The research was funded by the Major Program of the National Natural Science Foundation of China (52090084), the General Program of the National Natural Science Foundation of China (52379104).

Institutional Review Board Statement

Not applicable.

Informed Consent Statement

Not applicable.

Data Availability Statement

Data are contained within the article.

Conflicts of Interest

The authors declare no conflicts of interest.

Abbreviations

Nomenclature
GHGgreenhouse gas emissionsαcorrection coefficient for pile end resistance
LCAlife cycle assessmentAppile end area
DCMdeep cement mixing pilefcucompressive strength
HPJGhigh-pressure jet grouting pileηreduction coefficient of pile body strength
lsoil layer thicknessmarea replacement rate
ρnatural densitydpile diameter
ωnatural water contentdeequivalent diameter
ccohesive forceλcoefficient of single-pile bearing capacity utilization
φinternal friction angleβcoefficient of soil bearing capacity between piles
qsiapile side resistancennumber of piles
qppile end resistanceAreinforcement area
fskbearing capacity of soil between pilesEgreenhouse gas emissions
Rasingle-pile bearing capacityvgreenhouse gas emission factors
fspkbearing capacity of the foundationQengineering quantity
μppile body perimeterLtransportation distance

References

  1. Allouhi, A.; El Fouih, Y.; Kousksou, T.; Jamil, A.; Zeraouli, Y.; Mourad, Y. Energy consumption and efficiency in buildings: Current status and future trends. J. Clean. Prod. 2015, 109, 118–130. [Google Scholar] [CrossRef]
  2. Liu, H.; Lin, B. Energy substitution, efficiency, and the effects of carbon taxation: Evidence from China’s building construction industry. J. Clean. Prod. 2017, 141, 1134–1144. [Google Scholar] [CrossRef]
  3. Mohebbi, G.; Bahadori-Jahromi, A.; Ferri, M.; Mylona, A. The role of embodied carbon databases in the accuracy of life cycle assessment (LCA) calculations for the embodied carbon of buildings. Sustainability 2021, 13, 7988. [Google Scholar] [CrossRef]
  4. Zhang, Y.; Jiang, X.; Cui, C.; Skitmore, M. BIM-based approach for the integrated assessment of life cycle carbon emission intensity and life cycle costs. Build. Environ. 2022, 226, 109691. [Google Scholar] [CrossRef]
  5. UNEP. United Nations Report: Carbon Emissions from Buildings and Construction Reach Historic Highs. 2022. Available online: https://news.un.org/zh/story/2022/11/1112252 (accessed on 2 July 2024).
  6. Sun, Y.; Hao, S.; Long, X. A study on the measurement and influencing factors of carbon emissions in China’s construction sector. Build. Environ. 2023, 229, 109912. [Google Scholar] [CrossRef]
  7. Li, R.; You, K.; Cai, W.; Wang, J.; Liu, Y.; Yu, Y. Will the southward center of gravity migration of population, floor area, and building energy consumption facilitate building carbon emission reduction in China? Build. Environ. 2023, 242, 110576. [Google Scholar] [CrossRef]
  8. Säynäjoki, E.; Korba, P.; Kalliala, E.; Nuotio, A. GHG emissions reduction through urban planners’ improved control over earthworks: A case study in Finland. Sustainability 2018, 10, 2859. [Google Scholar] [CrossRef]
  9. Sun, F. New foundation treatment technology using cement soil composite tubular piles supported by optical fiber sensing technology. J. Sens. 2023, 2023, 6807212. [Google Scholar] [CrossRef]
  10. Sánchez-Garrido, A.J.; Navarro, I.J.; Yepes, V. Evaluating the sustainability of soil improvement techniques in foundation substructures. J. Clean. Prod. 2022, 351, 131463. [Google Scholar] [CrossRef]
  11. Wu, P.; Feng, W.; Yin, J. Numerical study of creep effects on settlements and load transfer mechanisms of soft soil improved by deep cement mixed soil columns under embankment load. Geotext Geomembr. 2020, 48, 331–348. [Google Scholar] [CrossRef]
  12. Bayesteh, H.; Sabermahani, M. Field study on performance of jet grouting in low water content clay. Eng. Geol. 2020, 264, 105314. [Google Scholar] [CrossRef]
  13. Shan, Y.; Luo, J.; Wang, B.; Zhou, S.; Zhang, B. Critical application zone of the jet grouting piles in the vicinity of existing high-speed railway bridge in deep soft soils with medium sensibility. Soils Found. 2024, 64, 101407. [Google Scholar] [CrossRef]
  14. Sandanayake, M.; Zhang, G.; Setunge, S. Environmental emissions at foundation construction stage of buildings–Two case studies. Build. Environ. 2016, 95, 189–198. [Google Scholar] [CrossRef]
  15. Dong, Y.H.; Ng, S.T. A life cycle assessment model for evaluating the environmental impacts of building construction in Hong Kong. Build. Environ. 2015, 89, 183–191. [Google Scholar] [CrossRef]
  16. Li, X.; Zheng, Y. Using LCA to research carbon footprint for precast concrete piles during the building construction stage: A China study. J. Clean. Prod. 2020, 245, 118754. [Google Scholar] [CrossRef]
  17. Luo, W.; Sandanayake, M.; Zhang, G. Direct and indirect carbon emissions in foundation construction–Two case studies of driven precast and cast-in-situ piles. J. Clean. Prod. 2019, 211, 1517–1526. [Google Scholar] [CrossRef]
  18. Yao, K.; Chen, Q.; Ho, J.; Xiao, H.; Lee, F.H. Strain-dependent shear stiffness of cement-treated marine clay. J. Mater. Civil. Eng. 2018, 30, 4018255. [Google Scholar] [CrossRef]
  19. Kravchenko, E.; Lu, W.; Sauerwein, M.; Wong, A.H. Life cycle assessment of waste materials in deep cement mixing for land reclamation in Hong Kong. Environ. Impact Assess. Rev. 2024, 105, 107398. [Google Scholar] [CrossRef]
  20. Bao, X.; Yuan, H.; Chen, X.; Chen, K.; Shen, J.; Cui, H. GHG emission analysis of an optimal arrangement of stiffened composite pile group based on bearing capacity: A case study. J. Clean. Prod. 2024, 440, 140860. [Google Scholar] [CrossRef]
  21. Fang, Y.; Lu, X.; Li, H. A random forest-based model for the prediction of construction-stage carbon emissions at the early design stage. J. Clean. Prod. 2021, 328, 129657. [Google Scholar] [CrossRef]
  22. Huang, Y.; Wang, A. Research on Carbon Emission of Prefabricated Structure in China. Buildings 2023, 13, 1348. [Google Scholar] [CrossRef]
  23. Zhang, X.; Zheng, R. Reducing building embodied emissions in the design phase: A comparative study on structural alternatives. J. Clean. Prod. 2020, 243, 118656. [Google Scholar] [CrossRef]
  24. Afshin, A.; Rayhani, M.T. Evaluation of bearing capacity with time for small-scale piles driven into Leda clay. Int. J. Geotech. Eng. 2015, 9, 307–315. [Google Scholar] [CrossRef]
  25. Cui, C.; Meng, K.; Xu, C.; Wang, B.; Xin, Y. Vertical vibration of a floating pile considering the incomplete bonding effect of the pile-soil interface. Comput. Geotech. 2022, 150, 104894. [Google Scholar] [CrossRef]
  26. Lee, W.; Kim, D.; Salgado, R.; Zaheer, M. Setup of driven piles in layered soil. Soils Found 2010, 50, 585–598. [Google Scholar] [CrossRef]
  27. Jiang, C.; Li, Y.; Liu, L.; Lin, H. Nonlinear analysis of flexible pile near undrained clay slope under lateral loading. Adv. Civ. Eng. 2018, 2018, 817362. [Google Scholar] [CrossRef]
  28. Liu, P.; Jiang, C.; Lin, M.; Chen, L.; He, J. Nonlinear analysis of laterally loaded rigid piles at the crest of clay slopes. Comput. Geotech. 2020, 126, 103715. [Google Scholar] [CrossRef]
  29. Comodromos, E.M.; Papadopoulou, M.C.; Rentzeperis, I.K. Pile foundation analysis and design using experimental data and 3-D numerical analysis. Comput. Geotech. 2009, 36, 819–836. [Google Scholar] [CrossRef]
  30. Zhou, P.; Li, J.; Li, L.; Liu, G.; Li, P. Investigation of the time-dependent bearing capacity of a jacked pile in saturated structured clays. Comput. Geotech. 2023, 161, 105599. [Google Scholar] [CrossRef]
  31. Sun, B.; Jiang, C.; Pang, L.; Liu, P.; Li, X. Effect of the pile diameter and slope on the undrained lateral response of the Large–Diameter pile. Comput. Geotech. 2022, 152, 104981. [Google Scholar] [CrossRef]
  32. Wang, H.; Wang, L.Z.; Hong, Y.; He, B.; Zhu, R.H. Quantifying the influence of pile diameter on the load transfer curves of laterally loaded monopile in sand. Appl. Ocean Res. 2020, 101, 102196. [Google Scholar] [CrossRef]
  33. Hussein, A.F.; El Naggar, M.H. Dynamic performance of driven and helical piles in cohesive soil. Acta Geotech. 2023, 18, 1543–1568. [Google Scholar] [CrossRef]
  34. Shuman, N.M.; Khan, S.; Amini, F. Settlement based load capacity curve for single helix helical pile in c-ϕ soil. Soils Found. 2023, 63, 101265. [Google Scholar] [CrossRef]
  35. Zhang, X.-L.; Jiao, B.-H.; Han, Y.; Chen, S.-L.; Li, X.-Y. Random field model of soil parameters and the application in reliability analysis of laterally loaded pile. Soil Dyn. Earthq. Eng. 2021, 147, 106821. [Google Scholar] [CrossRef]
  36. Xu, S.J.; Yi, J.T.; Tian, Y.; Yang, Q.S.; Liu, F.; Yin, S.; Pan, Y.T. Laterally loaded pile response in spatially variable soil. Ocean Eng. 2023, 289, 116146. [Google Scholar] [CrossRef]
  37. JGJ 79-2008; Technical Specification for Building Pile Foundations. China Architecture & Building Press: Beijing, China, 2008. (In Chinese)
  38. JGJ 79-2012; Technical Specification for Building Pile Foundations. China Architecture & Building Press: Beijing, China, 2012. (In Chinese)
  39. Caruso, M.; Pinho, R.; Bianchi, F.; Cavalieri, F.; Lemmo, M.T. A life cycle framework for the identification of optimal building renovation strategies considering economic and environmental impacts. Sustainability 2020, 12, 10221. [Google Scholar] [CrossRef]
  40. Fong, W.; Matsumoto, H.; Lun, Y. Establishment of city level carbon dioxide emission baseline database and carbon budgets for developing countries with data constraints. J. Asian Arch. Build 2008, 7, 403–410. [Google Scholar] [CrossRef]
  41. Wallhagen, M.; Glaumann, M.; Malmqvist, T. Basic building life cycle calculations to decrease contribution to climate change–Case study on an office building in Sweden. Build. Environ. 2011, 46, 1863–1871. [Google Scholar] [CrossRef]
  42. Mercader-Moyano, P.; Ramos-Martín, M. Comprehensive sustainability assessment of regenerative actions on the thermal envelope of obsolete buildings under climate change perspective. Sustainability 2020, 12, 5495. [Google Scholar] [CrossRef]
  43. Sandanayake, M.; Zhang, G.; Setunge, S.; Luo, W.; Li, C. Estimation and comparison of environmental emissions and impacts at foundation and structure construction stages of a building—A case study. J. Clean. Prod. 2017, 151, 319–329. [Google Scholar] [CrossRef]
  44. ISO 14067: 2018; Greenhouse Gases Carbon Footprint of Products Requirements and Guidelines for Quantification. ISO: Geneva, Switzerland, 2018.
  45. Lu, M.; Lai, J. Review on carbon emissions of commercial buildings. Renew. Sustain. Energy Rev. 2020, 119, 109545. [Google Scholar] [CrossRef]
  46. Mazur, A.; Olenchuk, A. Life cycle assessment and building information modeling integrated approach: Carbon footprint of masonry and timber-frame constructions in Single-Family houses. Sustainability 2023, 15, 15486. [Google Scholar] [CrossRef]
  47. Guangdong Provincial Department of Housing and Urban Rural Development. Rules for the Compilation of Construction Machinery Charges per Unit in Guangdong Province; Guangdong Provincial Department of Housing and Urban Rural Development: Guangzhou, China, 2018.
  48. Guangdong Provincial Department of Housing and Urban Rural Development. Comprehensive Quota for Housing Construction and Decoration Engineering in Guangdong Province; Guangdong Provincial Department of Housing and Urban Rural Development: Guangzhou, China, 2018.
  49. GB/T 51366-2019; Standard for Building Carbon Emission Calculation. China Architecture & Building Press: Beijing, China, 2019. (In Chinese)
  50. CPCD, China Products Carbon Footprint Factors Database. 2022. Available online: https://lca.cityghg.com/ (accessed on 2 July 2024).
  51. Yang, Z.; Peng, F.; Qiao, Y.; Hu, Y. A new cryogenic sealing process for the launch and reception of a tunnel shield. Tunn. Undergr. Space Technol. 2019, 85, 406–417. [Google Scholar] [CrossRef]
  52. Qarmout, M.; König, D.; Gussmann, P.; Thewes, M.; Schanz, T. Tunnel face stability analysis using Kinematical Element Method. Tunn. Undergr. Space Technol. 2019, 85, 354–367. [Google Scholar] [CrossRef]
  53. Nie, S.; Zhou, J.; Yang, F.; Lan, M.; Li, J.; Zhang, Z.; Chen, Z.; Xu, M.; Li, H.; Sanjayan, J.G. Analysis of theoretical carbon dioxide emissions from cement production: Methodology and application. J. Clean. Prod. 2022, 334, 130270. [Google Scholar] [CrossRef]
  54. Petrillo, A.; Colangelo, F.; Farina, I.; Travaglioni, M.; Salzano, C.; Cioffi, R. Multi-criteria analysis for life cycle assessment and life cycle costing of lightweight artificial aggregates from industrial waste by double-step cold bonding palletization. J. Clean. Prod. 2022, 351, 131395. [Google Scholar] [CrossRef]
  55. Weyand, A.; Bausch, P.; Engel, B.; Metternich, J.; Weigold, M. Analysis of uncertainty factors in part-specific greenhouse gas accounting. Sustainability 2023, 15, 16871. [Google Scholar] [CrossRef]
Figure 1. Integrated design framework for foundation treatment piles.
Sustainability 16 06319 g001
Figure 2. Design framework for foundation treatment piles.
Sustainability 16 06319 g002
Figure 3. System boundary for GHG emissions from foundation treatment piles.
Sustainability 16 06319 g003
Figure 4. Reinforcement of soft soil in the starting area of shield tunneling.
Sustainability 16 06319 g004
Figure 5. Effect of pile dimensions on bearing capacity.
Sustainability 16 06319 g005
Figure 6. Effect of soil layer thickness on bearing capacity.
Sustainability 16 06319 g006
Figure 7. Effect of geological parameter variation on bearing capacity.
Sustainability 16 06319 g007
Figure 8. GHG emissions from DCM piles.
Sustainability 16 06319 g008
Figure 9. GHG emissions from HPJG piles.
Sustainability 16 06319 g009
Figure 10. GHG emissions of different pile diameters.
Sustainability 16 06319 g010
Figure 11. GHG emissions at different pile construction speeds.
Sustainability 16 06319 g011
Figure 12. GHG emissions of different soil densities.
Sustainability 16 06319 g012
Figure 13. Sensitivity analysis of factors affecting GHG emissions.
Sustainability 16 06319 g013
Figure 14. Sensitivity analysis of bearing capacity influencing factors (pile dimensions).
Sustainability 16 06319 g014
Figure 15. Sensitivity analysis of bearing capacity influencing factors (stratum parameters).
Sustainability 16 06319 g015
Figure 16. Bearing capacity of the foundation under different diameters.
Sustainability 16 06319 g016
Figure 17. Effect of foundation treatment schemes on bearing capacity.
Sustainability 16 06319 g017
Figure 18. Effect of foundation treatment schemes on GHG emissions.
Sustainability 16 06319 g018
Figure 19. Comparison of the total GHG emissions of two construction schemes.
Sustainability 16 06319 g019
Table 1. Global warming potential of greenhouse gases.
GHGsGWP Value (kg CO2/kg)
20 Years100 Years500 Years
CO2111
CH472257.6
N2O289298153
HFC38301430435
PFC863012,2001820
SF616,300228,00032,600
Table 2. Related carbon emission factors.
CategoryNameEmission FactorsUnit
Construction materialOrdinary Portland cement0.735kg CO2e/kg
Cement slurry additives0.551kg CO2e/kg
Water0.168kg CO2e/m3
Material transportationMedium gasoline truck0.115kg CO2e/(t·km)
Heavy diesel trucks0.057kg CO2e/(t·km)
Construction consumptionGasoline consumption2.925kg CO2e/kg
Diesel consumption3.096kg CO2e/kg
Electricity consumption0.8042kg CO2e/(kW·h)
Labor consumption0.645kg CO2e/h
Table 3. Used parameters of the strata.
Soil Layerlρwcφqsiaqpfsk
mg/cm3%kPa°kPakPakPa
Clay81.6557.69.636.084/40
Silty clay8.81.6754.769.918.47810060
Granite residual soil9.81.8927.537.7716.6125450150
Fully weathered granite9.81.8925.0341.4725.2270900300
Strongly weathered granite8.61.9521.148.3328.971001500400
Note: l is soil layer thickness, ρ is soil natural density, w is natural water content, c is cohesive force, φ is internal friction angle, qsia is pile side resistance, qp is pile end resistance, fsk is bearing capacity of soil between piles.
Table 4. Configuration of DCM pile construction equipment.
NumberMechanical TypeMechanical CharacteristicsEquipment ManufacturerPower/kW
1Cement mixing pile machineJYSJ-55Juye Hydraulic Machinery Co., Ltd., Zhengzhou, China77
2Grouting pumpJT-150AHebei Jitan Machinery Equipment Co., Ltd., Shijiazhuang, China15
3Cement storage tank80THengyuan Construction Equipment Manufacturing Co., Ltd., Zhengzhou, China7.5
4Cement mixerBW-150DZhejiang Santuo Heavy Industry Technology Co., Ltd., Wenling, China7.5
Table 5. Summary of DCM construction quantity.
CategoryItemEngineering QuantityUnits
Material production stageCement19,090kg
Water19.09m3
Cement additives94.45kg
Transportation stageCement transport vehicle954.5T·km
Transport truck4.773t·km
Construction stageDCM pile machine428.12kw·h
Grouting pump83.4kw·h
Cement storage tank41.7kw·h
Cement mixer41.7kw·h
Construction worker38.92working hours
Table 6. Configuration of HPJG pile construction equipment.
NumberMechanical TypeMechanical CharacteristicsEquipment ManufacturerPower/kW
1HPJG pile machineXPL-80AJuqiang High Pressure Pump Co., Ltd., Tianjin, China73.5
2Air compressorBLT-50ABolaite Shanghai Compressor Co., Ltd., Shanghai, China37
3High-pressure water pumpXPB-132Juqiang High Pressure Pump Co., Ltd., Tianjin, China30
4Grouting pumpHYB60/50-1Shandong Weiming Safety Equipment Co., Ltd., Jining, China15
5High-pressure mud pumpGB-2Shandong Zhuoli Mining Equipment Co., Ltd., Jining, China30
6Cement storage tank80THengyuan Construction Equipment Manufacturing Co., Ltd., Zhengzhou, China7.5
7Cement mixerBW-150DZhejiang Santuo Heavy Industry Technology Co., Ltd., Wenling, China7.5
Table 7. Summary of HPJG construction quantity.
CategoryItemEngineering QuantityUnits
Material production stageCement19,090kg
Water19.09m3
Cement additives94.45kg
Transportation stageCement transport vehicle954.5t·km
Transport truck4.773t·km
Construction stageHPJG pile machine612.255kw·h
Air compressor308.21kw·h
High-pressure water pump249.9kw·h
Grouting pump124.95kw·h
High-pressure mud pump249.9kw·h
Cement storage tank62.475kw·h
Cement mixer62.475kw·h
Construction worker191.59working hours
Disclaimer/Publisher’s Note: The statements, opinions and data contained in all publications are solely those of the individual author(s) and contributor(s) and not of MDPI and/or the editor(s). MDPI and/or the editor(s) disclaim responsibility for any injury to people or property resulting from any ideas, methods, instructions or products referred to in the content.