Article

Traceability of Phreatic Groundwater Contaminants and the Threat to Human Health: A Case Study in the Tabu River Basin, North China

1
Yinshanbeilu Grassland Eco–Hydrology National Field Observation and Research Station, China Institute of Water Resources and Hydropower Research, Beijing 100038, China
2
Institute of Pastoral Hydraulic Research, Ministry of Water Resources of China, Hohhot 010020, China
3
Collaborative Innovation Center for Grassland Ecological Security (Jointly Supported by the Ministry of Education of China and Inner Mongolia Autonomous Region), Hohhot 010021, China
4
State Environmental Protection Key Laboratory of Soil Environmental Management and Pollution Control, Nanjing Institute of Environmental Sciences, Ministry of Ecology and Environment of China, Nanjing 210042, China
*
Authors to whom correspondence should be addressed.
Sustainability 2024, 16(15), 6328; https://doi.org/10.3390/su16156328
Submission received: 17 June 2024 / Revised: 17 July 2024 / Accepted: 20 July 2024 / Published: 24 July 2024

Abstract

:
Groundwater is the main clean water resource in northern China, and its quality is critical for both human health and social sustainable development. Due to complex anthropogenic and/or geogenic processes, the sources of groundwater contaminants are not easy to determine. The Tabu River Basin, located in northern China, is an agriculture and pasture interlaced area in which phreatic groundwater is the predominant water resource for domestic and agricultural purposes. Groundwater with abnormally high levels of NO3, F, and TDS was observed here based on 87 groundwater samples collected from the phreatic aquifer in 2022. In this study, hydrogeochemical and isotopic methods were used to trace groundwater contaminants in the phreatic aquifer, and a risk assessment was conducted to analyze their threat to human health. The results indicated that NO3 in the phreatic groundwater primarily originated from manure, the high concentration of TDS was highly associated with irrigation, and the enrichment of F was mainly controlled by geogenic factors, including alkaline condition, competitive adsorption, the dissolution of fluorine-bearing minerals, and cation exchange. A principal component analysis (PCA) showed that both anthropogenic (PC1, 50.7%) and geogenic (PC2, 19.9%) factors determined the quality of the phreatic groundwater in the study area. The human health risk assessment demonstrated that 98.9%, 92.0%, and 80.5% of the groundwater samples exceeded the permissible limit of the total noncarcinogenic risk for children, adult females, and adult males, respectively. The monitoring results from 2022 to 2023 suggested that phreatic groundwater contamination could not be mitigated through natural attenuation under the existing external pressures. Measures need to be taken to decrease the contamination of phreatic groundwater and enhance the groundwater sustainability in the Tabu River Basin. The findings of this study can provide a reference for sustainable groundwater development in the Tabu River Basin and other arid and semi-arid regions worldwide.

Graphical Abstract

1. Introduction

Clean groundwater is a crucial resource for industrial, agricultural, and domestic purposes in arid and semi-arid regions, influencing human health and social sustainable development [1,2]. Moreover, it serves as a significant supply source for rivers, lakes, and wetlands, thereby maintaining ecological balance [3]. However, the deterioration of groundwater quality has considerably reduced the availability of water resources, resulting in a global sustainability concern [4]. A comprehensive understanding of hydrogeochemical characteristics and contamination status is crucial for the protection of groundwater resources [5,6].
Anthropogenic activities, such as agriculture and industry, significantly contribute to the contamination of groundwater on a global scale, increasing the levels of various contaminating factors in groundwater including salinity, nitrogen, etc. [4]. There has been a growing focus on geogenic-contaminated groundwater in recent years [7,8,9]. Geogenic-contaminated groundwater refers to groundwater that contains abnormally high concentrations of hazardous substances derived from hostrocks or aquifer matrices. These hazardous substances are enriched through complex geological and hydrogeochemical processes [9,10]. For instance, geogenic factors, such as fluoride-bearing minerals dissolution, cation exchange, and alkaline conditions, can lead to the occurrence of high F groundwater [11,12]. Moreover, the co-occurrence of geogenic and anthropogenic contaminants in groundwater has been reported in various locations, such as in Rajasthan in India [13], the Bist-Doab region of Punjab in India [14], and the Pearl River Delta in China [15]. However, knowledge regarding the driving forces that control the multiple contaminations of groundwater is still limited due to complex hydrogeochemical conditions and anthropogenic activities.
It is crucial that we distinguish the effects of geogenic and anthropogenic factors on hydrogeochemical composition in order to develop a comprehensive understanding of the geochemistry and quality of groundwater [16]. Generally, contaminants from various sources exhibit significant variations in the hydrogeochemical parameters and isotopic composition, which can serve as reliable indicators for tracing their origins [17,18]. For example, chemical fertilizers exhibit high NO3/Cl ratios, a low Cl content, and high δ18O-NO3 values, whereas manure and sewage are characterized by low NO3/Cl ratios, a high Cl content, and low δ18O-NO3 values [6]. Additionally, multivariate statistical analyses, such as principal component analysis (PCA) and hierarchical cluster analysis (HCA), are robust methods for analyzing the sources of contaminants in groundwater [19,20]. HCA can assess the similarities and differences among the samples [21]. PCA is commonly employed to reduce data dimensionality and identify the primary factors influencing water quality [22]. Therefore, utilizing both HCA and PCA could enhance the interpretation of hydrogeochemical parameters and isotopic composition.
The primary concerns regarding contaminated groundwater are the potential health risks to individuals associated with long-term exposure [5,6]. For example, the consumption of water with elevated NO3 levels can lead to a reduced oxygen-carrying capacity, resulting in health issues, such as blue baby syndrome [23] and thyroid disease [24]. At lower F concentrations, water consumers are susceptible to dental caries, while, at concentrations higher than the stipulated levels, it can lead to dental fluorosis, skeletal fluorosis, crippling fluorosis, and adverse effects on the kidneys [25,26]. Exceeding the pollution limit for a specific contaminant in groundwater does not necessarily pose a threat to human health, as the potential risk depends on various factors such as exposure pathways and target population [27]. In addition, the concentration of contaminants in groundwater below the pollution limit does not guarantee the absence of threats to human health, as the assessment of health risks should consider all hazardous substances and multiple exposure pathways [28]. Therefore, conducting a comprehensive human health risk assessment associated with groundwater quality is crucial for the management of water resources and the protection of human health.
The Tabu River Basin is situated in an agriculture and pasture interlaced area of the North Yinshan Mountain, which serves as a national ecological barrier for northern China [29]. Phreatic groundwater is the primary water source for domestic and agricultural purpose in the Tabu River Basin, playing a crucial role in social sustainable development [30]. This phreatic groundwater is primarily found in quaternary deposits with good permeability, such as sandy gravels, pebbles, and sands, and is buried at a shallow depth ranging from 1 to 5 m. The long-term cultivation of crops and livestock poses a significant threat to the groundwater quality in the Tabu River Basin due to the shallow burial depth and high permeability of phreatic aquifers. In addition, the co-occurrence of arsenic, fluoride, and TDS in groundwater due to geogenic factors has also been observed in the Yinshan Mountain region [8]. Therefore, it can be inferred that both geogenic and anthropogenic factors can affect the groundwater quality in the Tabu River Basin. Investigating the hydrogeochemical characteristics, quality, and human health risks of groundwater is crucial for the exploitation and utilization of groundwater resources in the Tabu River Basin, which, to the best of our knowledge, has not received attention yet.
From the perspectives of geological conditions and external factors, the Tabu River Basin is an ideal case study for investigating hydrochemistry and groundwater pollution under the influences of anthropogenic and geogenic factors. Therefore, hydrogeochemical and isotopic analyses coupled with multivariate analytical methods were used to elucidate the factors influencing phreatic groundwater contamination in the Tabu River Basin. The objectives of this study were to: (1) investigate the hydrogeochemical characteristics of phreatic groundwater in the Tabu River Basin; (2) identify the spatial patterns of phreatic groundwater contaminants; (3) clarify the geogenic and anthropogenic factors regulating phreatic groundwater contamination; and (4) assess the human health risks associated with contaminated phreatic groundwater through multiple exposure pathways.

2. Materials and Methods
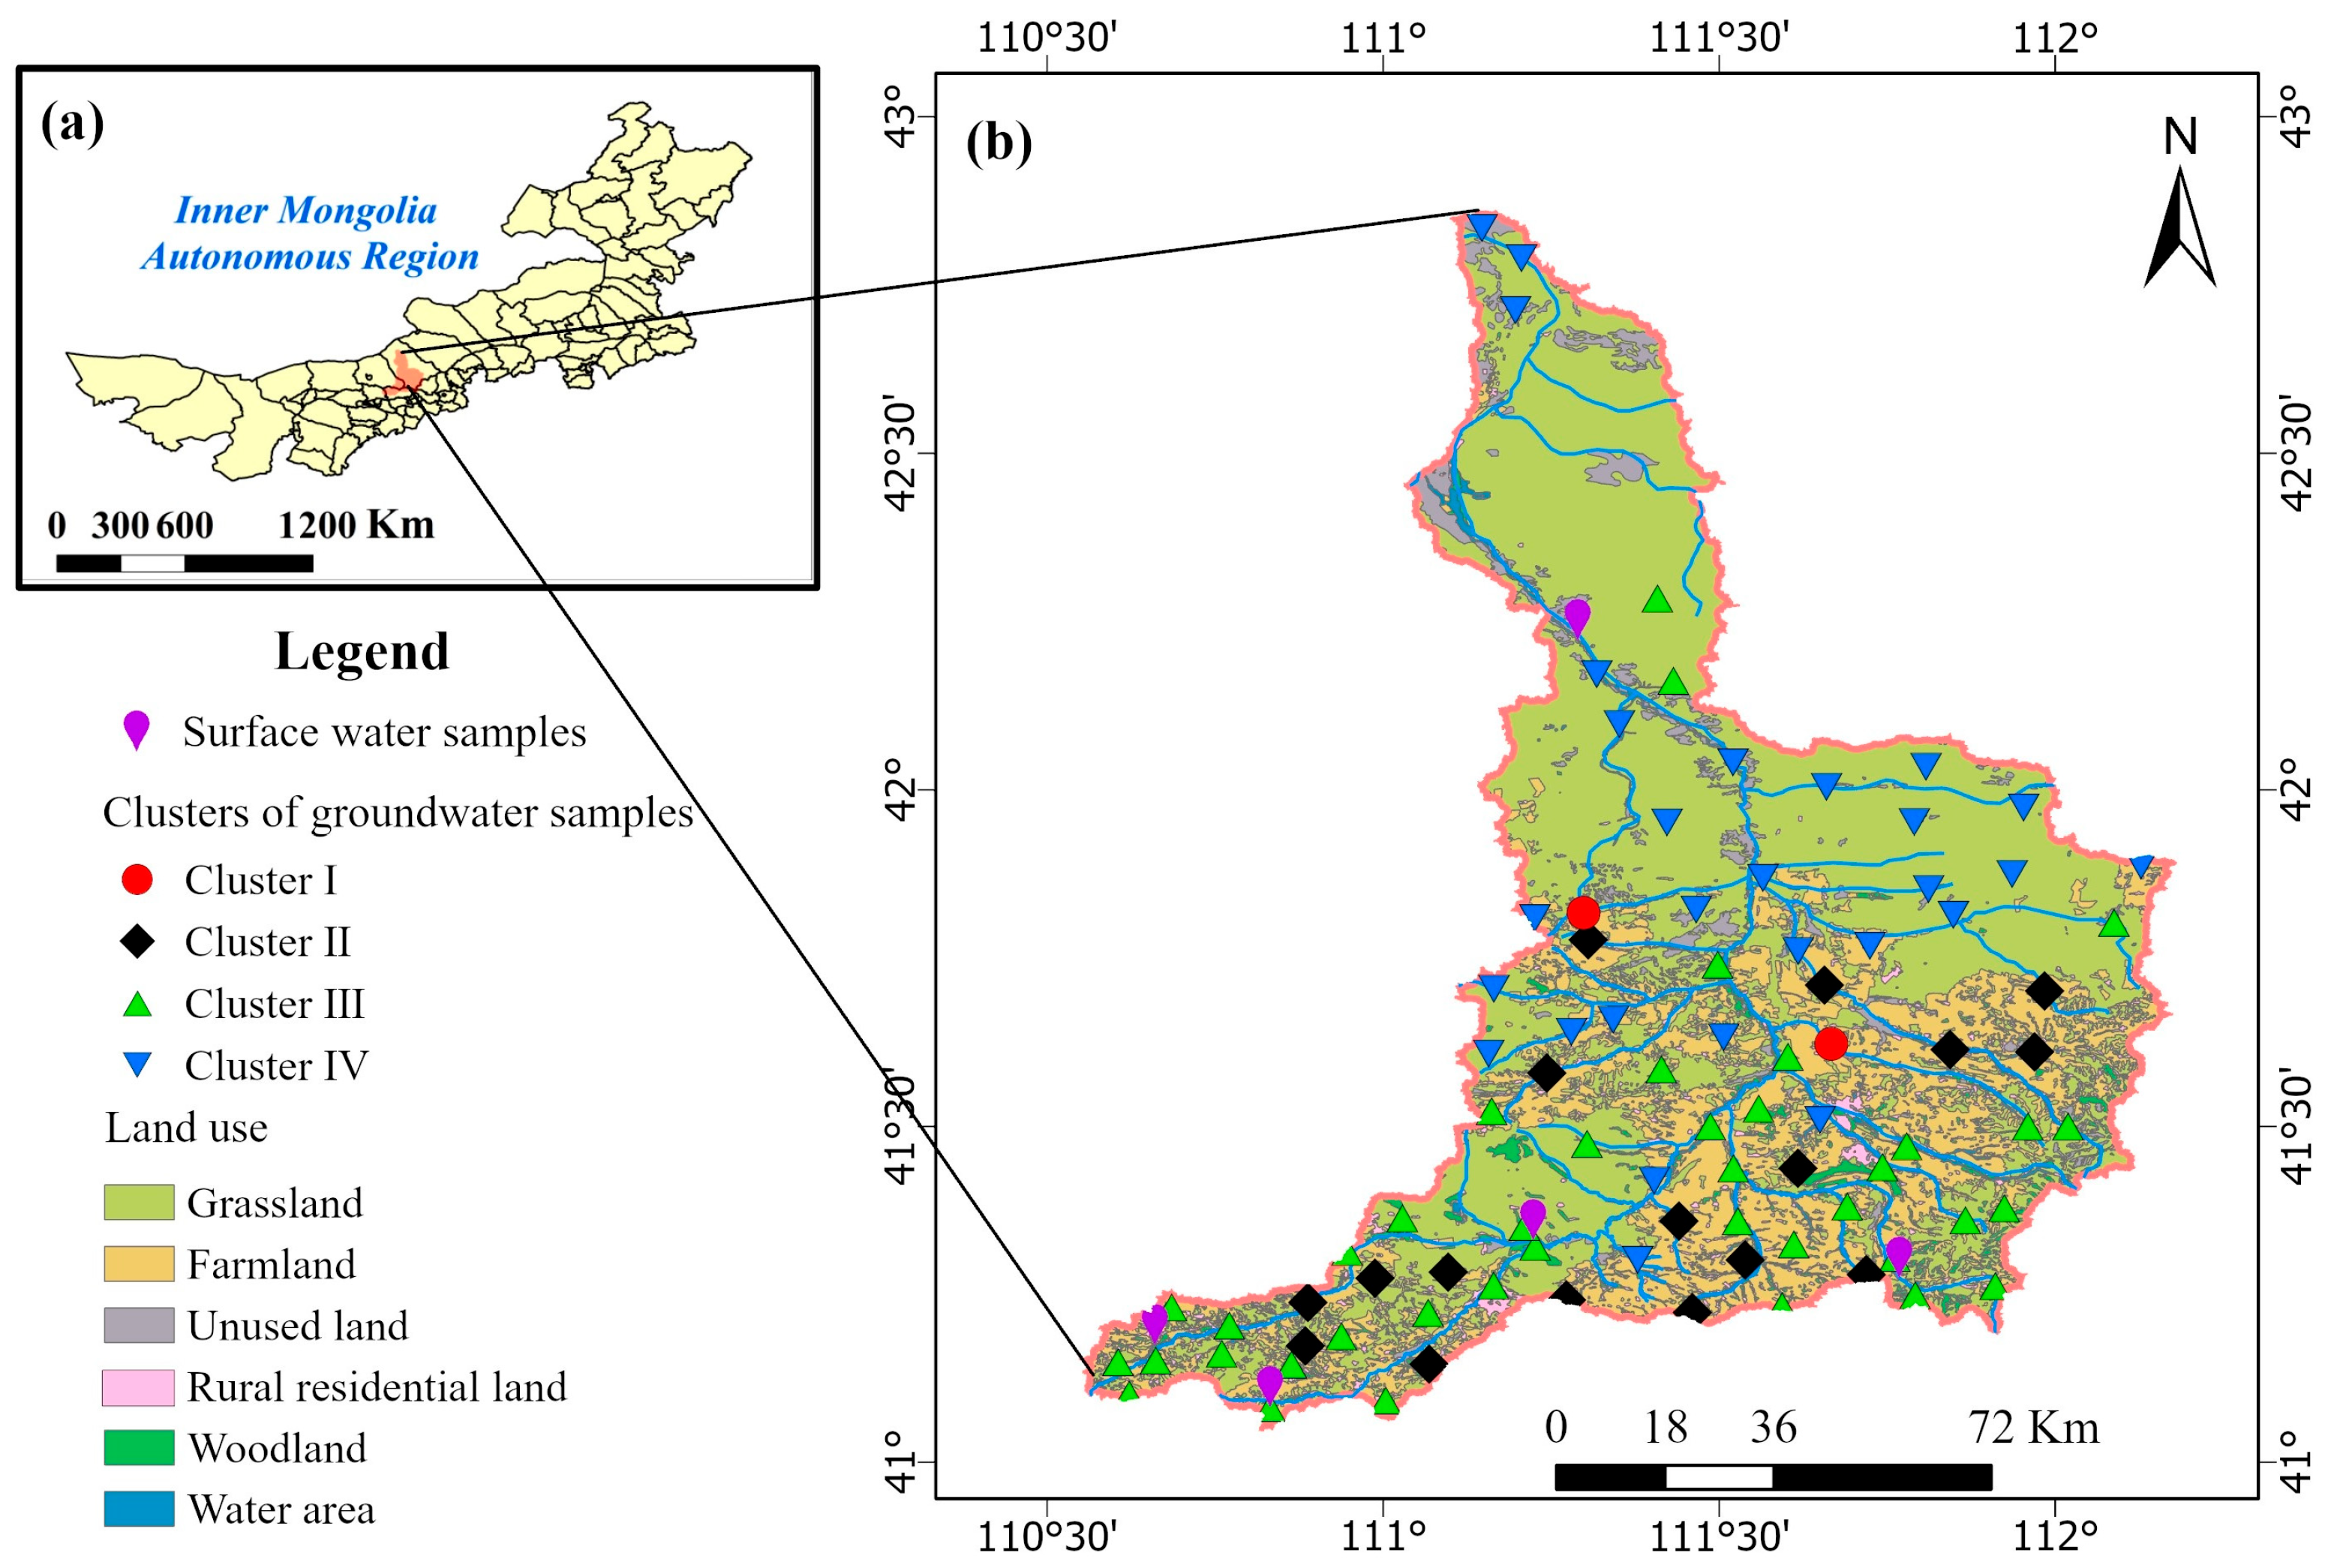
2.1. Study Area

The Tabu River Basin is located in the northern foothills of the Yin Mountains in the Inner Mongolia Autonomous Region (Figure 1a). The terrain slopes from the south to the north, with elevations ranging from 900 to 2100 m. The Tabu River flows from the southwest to the north. The study area has an arid and semi-arid climate with low rainfall and high evaporation rates. The average annual rainfall is 311.2 mm, and the majority of this occurs between July and September, accounting for approximately 80% of the total annual rainfall. The average annual evaporation is 1365.2 mm, and the average annual temperature ranges between 1 and 6 °C. The concentrated rainfall and extensive evaporation have led to prolonged drought conditions for most surface water. Meanwhile, the majority of surface water in the research area is mainly replenished by groundwater, as it remains dry for long periods except during the rainy season. The primary land use types in the study area are grassland and farmland, and industrial activities are limited in this area (Figure 1b). The grassland is primarily located downstream of the Tabu River, whereas farmland is mainly found in the middle and upper reaches (Figure 1b). Livestock (cattle and sheep) and crop production are integrated at the household level in the Tabu River Basin. In this region, livestock manure is commonly used as a plant fertilizer after qualified preparation. Due to the lack of surface water, groundwater acts as the primary water source for agricultural activities in the grassland and farmland of the Tabu River Basin. Therefore, the management of groundwater resources is crucial for sustainable development in the study area.
The precipitation, evaporation, and temperature data were acquired from the National Data Center for Meteorological Sciences (http://data.cma.cn/, accessed on 1 December 2023). The land use data for 2020 were obtained from the Data Center for Resources and Environmental Sciences at the Chinese Academy of Sciences (http://www.resdc.cn/, accessed on 1 December 2023).
A detailed hydrogeological description can be found in our previous study [30]. Briefly, phreatic groundwater is mainly located in quaternary deposits with good permeability. The burial depth of the phreatic groundwater approximately ranges from 1 to 5 m, and the thickness of the phreatic aquafer approximately ranges from 10 to 20 m. The quaternary deposits mainly consist of sandy gravels, pebbles, and sands. Groundwater flows from the south to the north. Rivers serve as the primary discharge pathway for groundwater, while precipitation acts as the main source of groundwater recharge in the study area [30]. However, the discharge from river to groundwater is negligible, as the Tabu River is generally dry, aside from the flood season.

2.2. Sampling and Analysis

A total of 87 samples of phreatic groundwater (with a burial depth ranging from 0.75 to 22.15 m; Table 1) from the overall the Tabu River Basin groundwater was collected in May 2022. All groundwater samples were taken from wells that served for domestic and agricultural irrigation. Prior to sampling, the groundwater wells were purged for approximately 5 min and the sample bottles were rinsed with abstracted water three times. Each water sample was filtered using a 0.45 μm membrane filter (PES) [31]. The samples for anion and cation analysis were stored in 100 mL poly-ethylene bottles. The samples for δ2H-H2O and δ18O-H2O analyses were collected and sealed in 10 mL Eppendorf plastic tubes. The samples for δ15N- NO3 and δ18O-NO3 analyses were collected and sealed in 10 mL Eppendorf tubes. All samples were kept at 4 °C before analysis. In addition, five samples of surface water were collected in May 2022 (Figure 1). The sampling processes and parameter analyses of the surface water were the same as those of the groundwater.
Temperature, pH, and ORP were analyzed using a multiparameter instrument (Pro Plus, YSI, Yellow Springs, OH, USA). Na+, K+, Ca2+, and Mg2+ concentrations were measured using inductively coupled plasma optical emission spectrometry (Optima 8300, PerkinElmer, Waltham, MA, USA) according to a Chinese standard (water quality—determination of 32 elements—inductively coupled plasma optical emission spectrometry) [32]. SO42−, Cl, NO3, and F concentrations were measured using ion chromatography (850 Professional IC, Metrohm, Switzerland) with Na2CO3 and NaHCO3 as the eluent [33]. The HCO3 concentration was measured using acid–base titration (HCl and NaOH) within 24 h after sampling with phenolphthalein and methyl orange as indicators. Total dissolved solids (TDS) were determined using gravimetric analysis (the difference in weight between the water sample before and after drying at 105 °C [34]).
δ2H-H2O and δ18O-H2O were measured using a high-precision isotopic water analyzer (L2130-i, Picarro, Santa Clara, CA, USA). The values of δ2H-H2O and δ18O-H2O were reported as per mille (‰) relative to the Vienna Standard Mean Ocean Water (VSMOW). The reproducibility of the triplicate measurements was less than 0.2‰ and ± 0.1 ‰ for δ2H-H2O and δ18O-H2O, respectively. The denitrification method was used to analyze δ15N-NO3 and δ18O-NO3 with Pseudomonas aureofaciens as the denitrifying bacteria [35]. Briefly, NO3 in the groundwater sample was fully converted to N2O gas by Pseudomonas aureofaciens in reaction bottles using a constant temperature shaker (25 °C and 180 rpm) after 12 h of incubation. After purification and extraction, N2O was introduced to an isotope ratio mass spectrometer (MAT 253, Thermo Fisher Scientific, Waltham, MA, USA) to measure δ15N-NO3 and δ18O-NO3. δ15N-NO3 and δ18O-NO3 were reported as per mille (‰) relative to air and VSMOW, respectively. The δ15N-NO3 and δ18O-NO3 values were calibrated through four international standards (USGS32, USGS34, and USGS35, as well as IAEA-N3). The reproducibility of the triplicate measurements was less than ±0.3 ‰ and ±0.5 ‰ for δ15N-NO3 and δ18O-NO3, respectively.

2.3. Data Handling

The ionic charge balance error percentage was calculated to ensure the accuracy of the hydrogeochemical analysis (Equation (1)). The relationships between the hydrogeochemical parameters and isotopic composition, including pH, Na+, K+, Ca2+, Mg2+, HCO3, SO42−, Cl, NO3, F, TDS, and δ18O-H2O, were analyzed using Spearman correlation (SC) [36]. These hydrogeochemical parameters were also used for HCA and PCA to gain additional insights [22]. The statistical analyses, including SC (‘corrplot’ package), HCA (‘factoextra’ package), and PCA (‘factoextra’ package), were conducted using R software (R version 4.3.0) [37]. Prior to HCA and PCA, the data were standardized. Ward’s method using Euclidean distance was employed to separate different clusters in the HCA. Wald’s method is an algorithm for data classification and clustering, which is a distance-metric-based approach that aims to cluster similar data points together and separate dissimilar data points (for more details about the Wald’s method, see Nourani et al., 2022 [38]). The variation in hydrochemistry parameters between 2022 and 2023 was analyzed by the Wilcoxon test using R software [20].
% ICBE = Mg 2 + + Ca 2 + + Na + + K + - HCO 3 - + SO 4 2 - + NO 3 - + Cl - + F - Mg 2 + + Ca 2 + + Na + + K + + HCO 3 - + SO 4 2 - + NO 3 - + Cl - + F - × 100

2.4. Human Health Risk Assessment (HHRA)

Generally, dermal and oral contact are the most common pathways of exposure to groundwater pollutants for human beings. Consequently, an assessment of human health risk was conducted by calculating the oral (HQoral) and dermal (HQdermal) hazard quotient and the resulting total non-carcinogenic health risk (HItotal) according to Equations (2)–(7) based on the model recommended by the United States Environmental Protection Agency [28]. The empirical parameters are summarized in Table S1.
H Q oral = CD I oral Rf D oral
CD I oral = C i × IR × EF × ED BW × AT
H Q dermal = CDI dermal Rf D oral × AB S gi
CD I Dermal = C i × K × S a × T × EV × CF × EF × ED BW × AT
HI total = i = 1 n H I i
HI i = HQ oral + HQ dermal

3. Results and Discussion

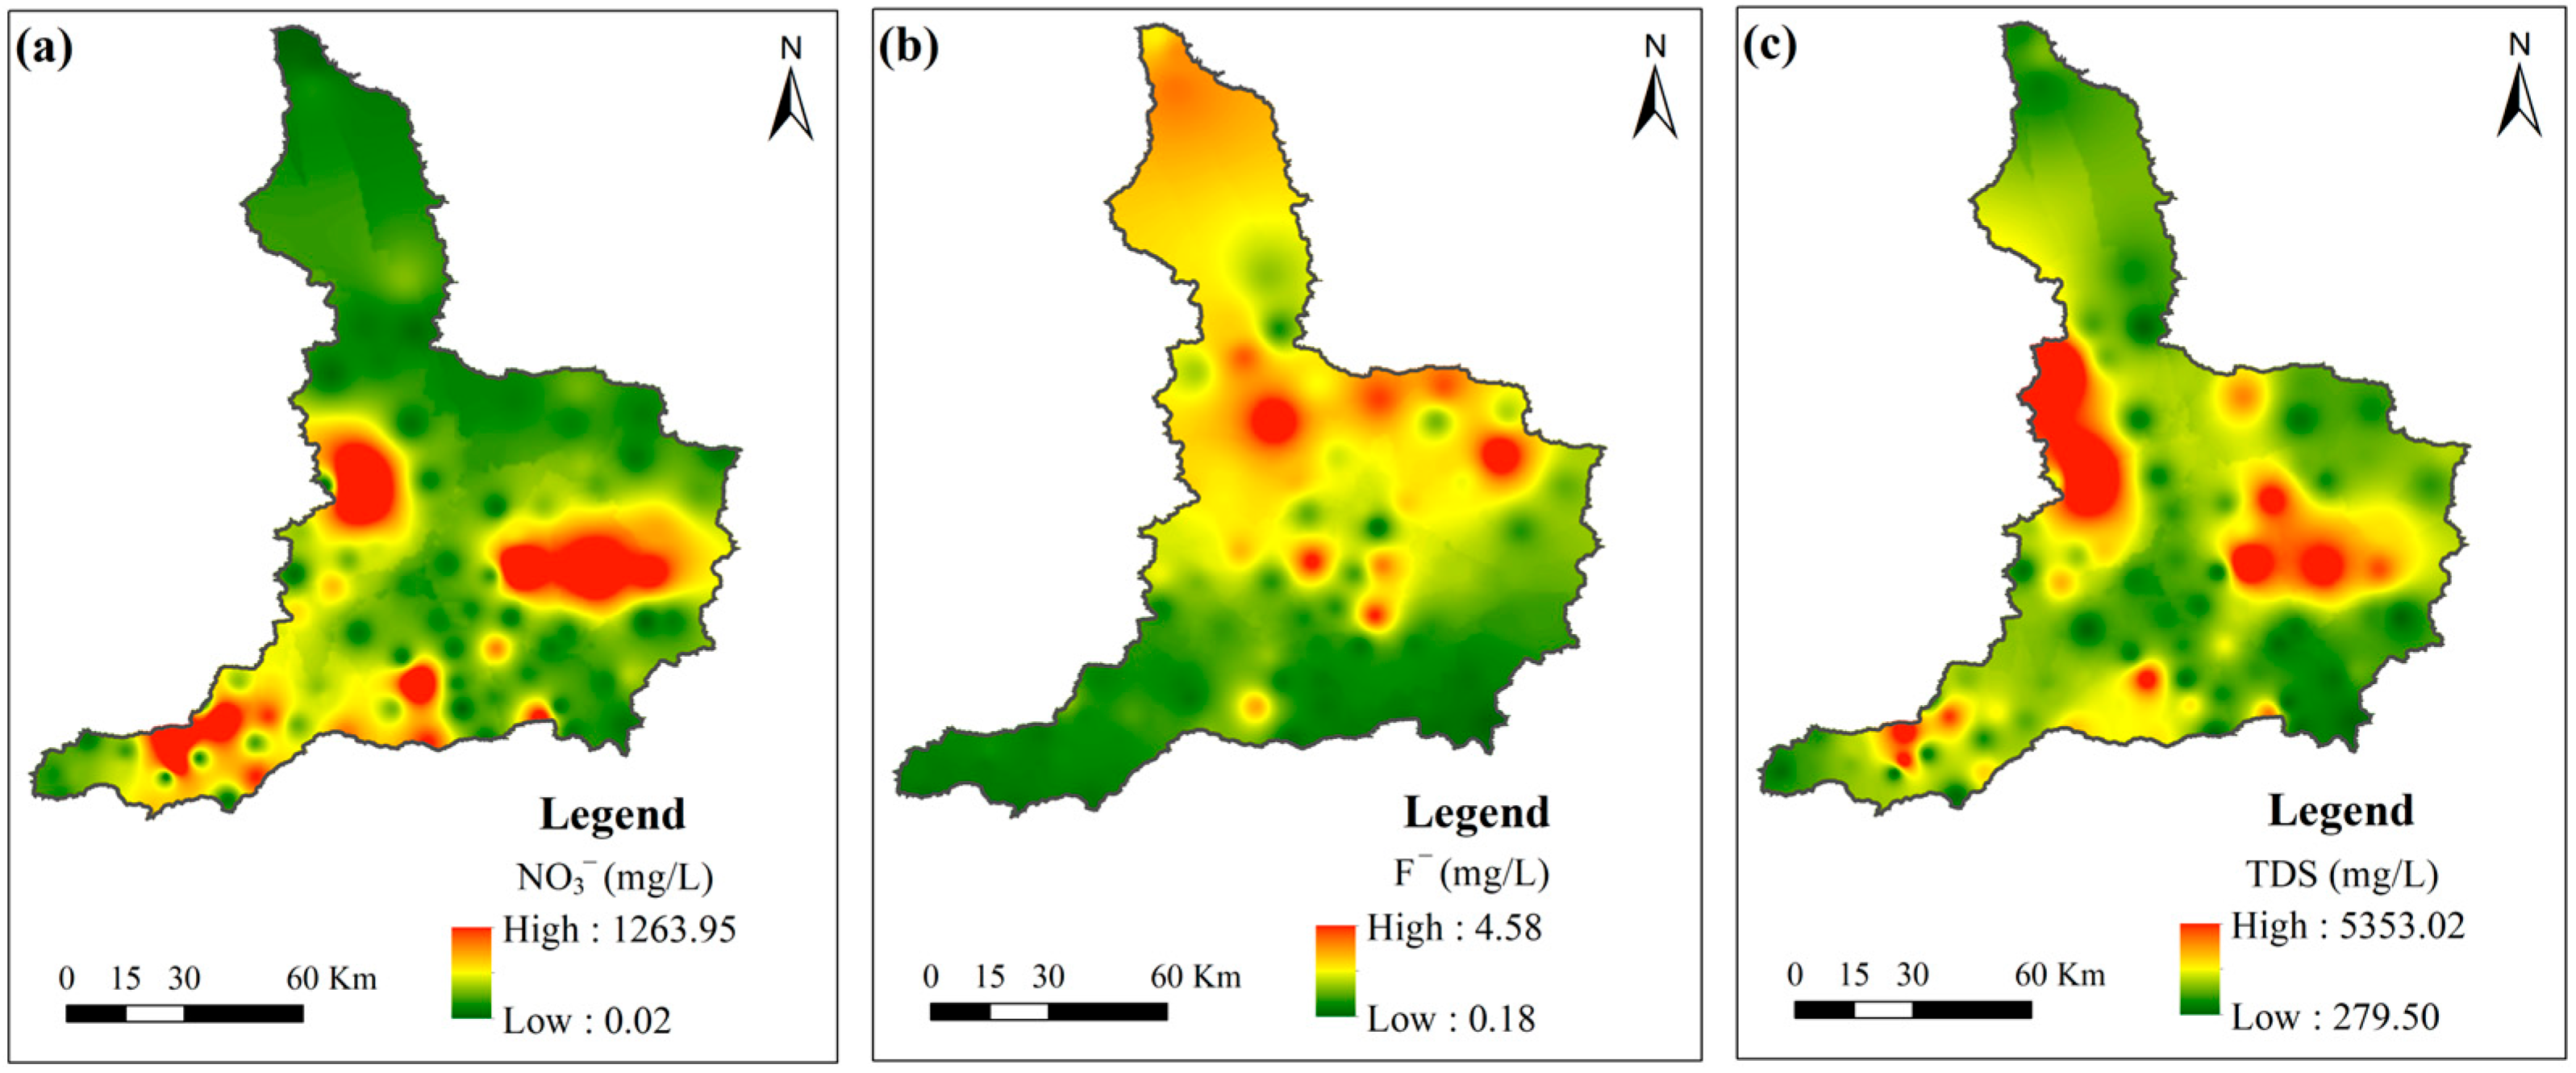
3.1. General Hydrogeochemical Parameters of Groundwater Samples and the Spatial Distribution of Groundwater Pollution

A statistical summary of the hydrogeochemical and isotopic parameters of the phreatic groundwater in the Tabu River Basin is exhibited in Table 1. The pH values of the groundwater ranged from 7.37 to 8.66 (median: 8.10), indicating a slightly alkaline condition. The TDS ranged from 278.0 to 5398.5 mg/L, with 77.0% and 2.3% of samples classed as slightly saline (1000 < TDS < 3000 mg/L) [39] and moderately saline water (3000 < TDS < 10,000 mg/L), respectively. Only 20.7% of the samples were classified as freshwater (TDS < 1000 mg/L). The relative abundance of major anions followed the order of SO42− > HCO3 > Cl, while the order of major cations was Ca2+ > Na+ > Mg2+ ≫ K+. The groundwater samples were scattered near the local meteoric water line (LMWL) (Figure S1), indicating that precipitation is the primary source of recharge for groundwater in the study area.
The concentration of NO3 in the phreatic groundwater ranged from 0 to 1274.0 mg/L, with a median value of 81.3 mg/L (Table 1). A total of 67.8% of groundwater samples exceeded the acceptable limit of NO3 (50.0 mg/L) [40]. The high NO3 groundwater was mainly distributed in the upper and middle reaches of the Tabu River Basin (Figure 2a), which are characterized by extensive farmland and rural residential areas (Figure 1b). This result suggests the significant impact of anthropogenic activities. The concentration of F ranged from 0.2 to 4.6 mg/L (median: 0.8 mg/L; Table 1) in the phreatic groundwater. A total 31.0% of groundwater samples exceeded the acceptable limit of F (1.5 mg/L) [40]. The high F groundwater was mainly distributed in the downstream area of the Tabu River Basin (Figure 2b) with less anthropogenic activity (Figure 1b), indicating a geogenic origin.

3.2. Influences of Anthropogenic Factors on Groundwater Quality

Generally, the concentration of NO3 in groundwater is naturally below 10 mg/L [5]. Therefore, a high NO3 concentration in groundwater might be the result of anthropogenic input. Chemical fertilizers, manure, and sewage are common anthropogenic sources of NO3 in groundwater in agricultural areas [6,41,42]. Chemical fertilizers contain high concentrations of NO3 and low concentrations of Cl, while manure and sewage have high concentrations of both NO3 and Cl [43,44]. In this study, NO3 exhibited a significant positive correlation with Cl (R = 0.69, p < 0.001; Figure 3), suggesting that manure and sewage are potential sources of the high concentration of NO3 in the phreatic groundwater.
Generally, contaminants from various sources exhibit significant variations in hydrogeochemical parameters and isotopic composition, which can serve as reliable indicators for tracing their origins [17,18]. Chemical fertilizers exhibit high NO3/Cl ratios, a low Cl content, and high δ18O-NO3 values, whereas manure and sewage are characterized by low NO3/Cl ratios, a high Cl content, and low δ18O-NO3 values [6]. The dual isotopes of NO315N-NO3 and δ18O-NO3) were used to identify the source of NO3 in phreatic groundwater. As shown in Figure 4a, the majority of the groundwater samples were scattered in the zone associated with manure and sewage, suggesting that manure and sewage were the primary sources of NO3. To further investigate the contribution of manure and sewage to the enrichment of NO3, a dual logarithmic diagram of Cl/Na+ and NO3/Na+ was used. As shown in Figure 4b, the groundwater samples, and particularly those with a high NO3 concentration, were mainly located near the zone of agricultural activities rather than sewage, indicating that NO3 in the phreatic groundwater primarily originates from manure. Moreover, groundwater with a high NO3 concentration showed a substantial overlap with farmland areas in terms of spatial distribution (Figure 1b and Figure 2a), where crop–livestock integration was widely observed and manure served as a plant fertilizer after a qualified preparation. This result further demonstrated the primary contribution of manure to the enrichment of NO3. Only a small proportion of groundwater samples fell within the overlapping ranges of the NH4+ fertilizer, soil NH4+, and sewage (Figure 4a), suggesting a limited impact on NO3 enrichment in the phreatic groundwater.
In addition to NO3, the TDS was also found to be abnormally high in groundwater. A previous study reported that the long-term and intensive use of groundwater for irrigation in an arid environment, where water discharges only through evapotranspiration and infiltration, can lead to an accelerated accumulation of salt in the phreatic groundwater [47,48]. The Tabu River Basin is located in an arid and semi-arid region, and groundwater is the primary water resource for irrigation [30]. In this study, the TDS showed a significant positive correlation with NO3 (R = 0.71, p < 0.001). Moreover, the high NO3 area showed a substantial overlap with the high TDS area in terms of spatial distribution, (Figure 2a,c), where farmland was widely distributed (Figure 1b). Therefore, the use of groundwater for irrigation significantly contributed to the high TDS in the phreatic groundwater.
Anthropogenic activities can also contribute to the enrichment of F, such as the discharge of sewage and an excessive use of fertilizers [6,49]. In this study, there was no significant correlation between F and NO3 (p > 0.05; Figure 3), indicating that anthropogenic activities had a negligible impact on the enrichment of F in phreatic groundwater. Additionally, areas of high F groundwater overlapped with the grassland in the Tabu River Basin, where anthropogenic activities were limited (Figure 1b and Figure 2b). This result further demonstrated that anthropogenic activity was not the primary factor controlling F enrichment in the phreatic groundwater.

3.3. Influences of Geogenic Factors on Groundwater Quality

3.3.1. Evaporation

Evaporation plays a crucial role in groundwater quality, particularly in arid and semi-arid regions [12,50]. Most of the groundwater samples fell on the lower right of the global meteoric water line (Figure S1), indicating the influence of evaporation. Theoretically, the concentrations of hazardous substances and δ18O-H2O value in groundwater can increase simultaneously during the evaporation processes [6]. However, δ18O-H2O exhibited no significant correlation with NO3, TDS, and F (p > 0.05; Figure 3). Therefore, the influence of evaporation on the phreatic groundwater quality was limited.

3.3.2. Interaction between Surface Water and Groundwater

Phreatic surface water can introduce contaminants into groundwater through hydrologic exchange [12]. Therefore, the surface water quality and its influence on groundwater were investigated. For the surface water, the NO3 content ranged from 1.9 to 38.2 mg/L (median: 32.0 mg/L; Table S3) in the Tabu River Basin. A total of 78.2% of the groundwater samples had a significantly higher NO3 content than 38.2 mg/L (Table S2). If the NO3 in groundwater mainly originates from surface water, groundwater with a higher NO3 content than the surface water should be formed through evaporative concentration. However, evaporation had no significant influence on groundwater quality (Figure 3). Moreover, our previous study demonstrated that surface water was recharged by groundwater in the Tabu River Basin rather than being discharged to groundwater [30]. These results indicate that the contamination of the phreatic groundwater cannot be attributed to surface water’s input.

3.3.3. Water–Rock Interactions

In addition to evaporation, water–rock interactions are also crucial geogenic factors influencing groundwater quality [9]. Generally, water–rock interactions, such as dissolution/precipitation and ion exchange processes, generally have a limited effect on the NO3 concentration but have significant effects on the F concentration [23,51,52]. The dissolution of fluorine-bearing minerals, such as fluorite (CaF2), can serve as a substantial source of F in groundwater (Equation (8)). This process can be facilitated by reducing the availability of Ca2+ through cation exchange (Equation (9)) or carbonate precipitation (Equation (10)) in aquifers.
CaF2 → Ca2+ + 2F
Ca2+ + 2NaX = 2Na+ + CaX2
Ca2+ + 2HCO3 → CaCO3 + H2O + CO2
A linear relationship between (Na+ + K+ − Cl) and (Ca2+ + Mg2+) − (HCO3 + SO42−) with a slope close to −1 generally indicates cation exchange [12]. As shown in Figure 5a, the majority of the high F groundwater samples were distributed along the ’y = −x’ line, demonstrating the significant effect of cation exchange on the enrichment of F in the phreatic groundwater.
The saturation index was used to assess the influence of the carbonate precipitation on F enrichment [12]. In this study, the majority of groundwater samples were unsaturated with respect to fluorite (Figure 5b), facilitating the continuous dissolution of fluorite by the groundwater in the aquifers. Additionally, there was a significant positive correlation between F and SIfluorite (Figure 5b), indicating the contribution of fluorite dissolution to F enrichment in the groundwater. As shown in Figure 5c, calcite was oversaturated in the groundwater, whereas fluorite was unsaturated. Carbonate precipitation continuously occurred, leading to a decrease in Ca2+ concentrations (Equation (10)). The decrease in Ca2+ concentrations make fluorite unsaturated in groundwater, thereby promoting fluorite dissolution (Equation (8)) [12,53]. Therefore, this result suggested the potential enhancement of fluorite dissolution due to calcite precipitation. Theoretically, if carbonatites precipitation dominates the dissolution of fluorine-bearing minerals, an increase in F concentration should be accompanied by a decrease in Ca2+ concentrations [12]. In this study, F exhibited a significant negative correlation with Ca2+ (R = −0.49, p < 0.01; Figure 3). Therefore, carbonate precipitation in the aquifers significantly contributed to the enrichment of F in the phreatic groundwater in the study area.

3.3.4. Alkaline Condition and Competitive Adsorption

Under an alkaline condition, an increase in OH can promote the reaction shown in Equation (11), promoting the release of F from fluorine-bearing minerals into groundwater [53]. Moreover, alkaline conditions can enhance the desorption of F that is adsorbed on silicate (Equations (12) and (13)) [54]. In this study, the groundwater was in a slightly alkaline condition (Table 1). There was a significant positive correlation between F and pH (R = 0.44, p < 0.001; Figure 3), confirming the contribution of the alkaline condition to the enrichment of F in the phreatic groundwater.
CaF2 + 2OH → Ca(OH)2 + 2F
KAl2[AlSi3O10]F2 + 2OH → KAl2[AlSi3O10][OH]2 + 2F
KMg3[AlSi3O10]F2 + 2OH → KMg3[AlSi3O10][OH]2 + 2F
As shown in Figure 3, F exhibited a positive correlation with HCO3 (R = 0.40, p < 0.001) in this study, suggesting an association between the release of HCO3 and the enrichment of F. HCO3 can reduce the adsorption sites on the sorbent, facilitating the release of F from the aquifer into the groundwater [6]. Additionally, the weathering of carbonates and silicates coexisting with fluoride can simultaneously elevate the levels of F and HCO3 in groundwater [6]. Therefore, the competitive sorption and weathering processes associated with HCO3 significantly contributed to the enrichment of F in the phreatic groundwater.

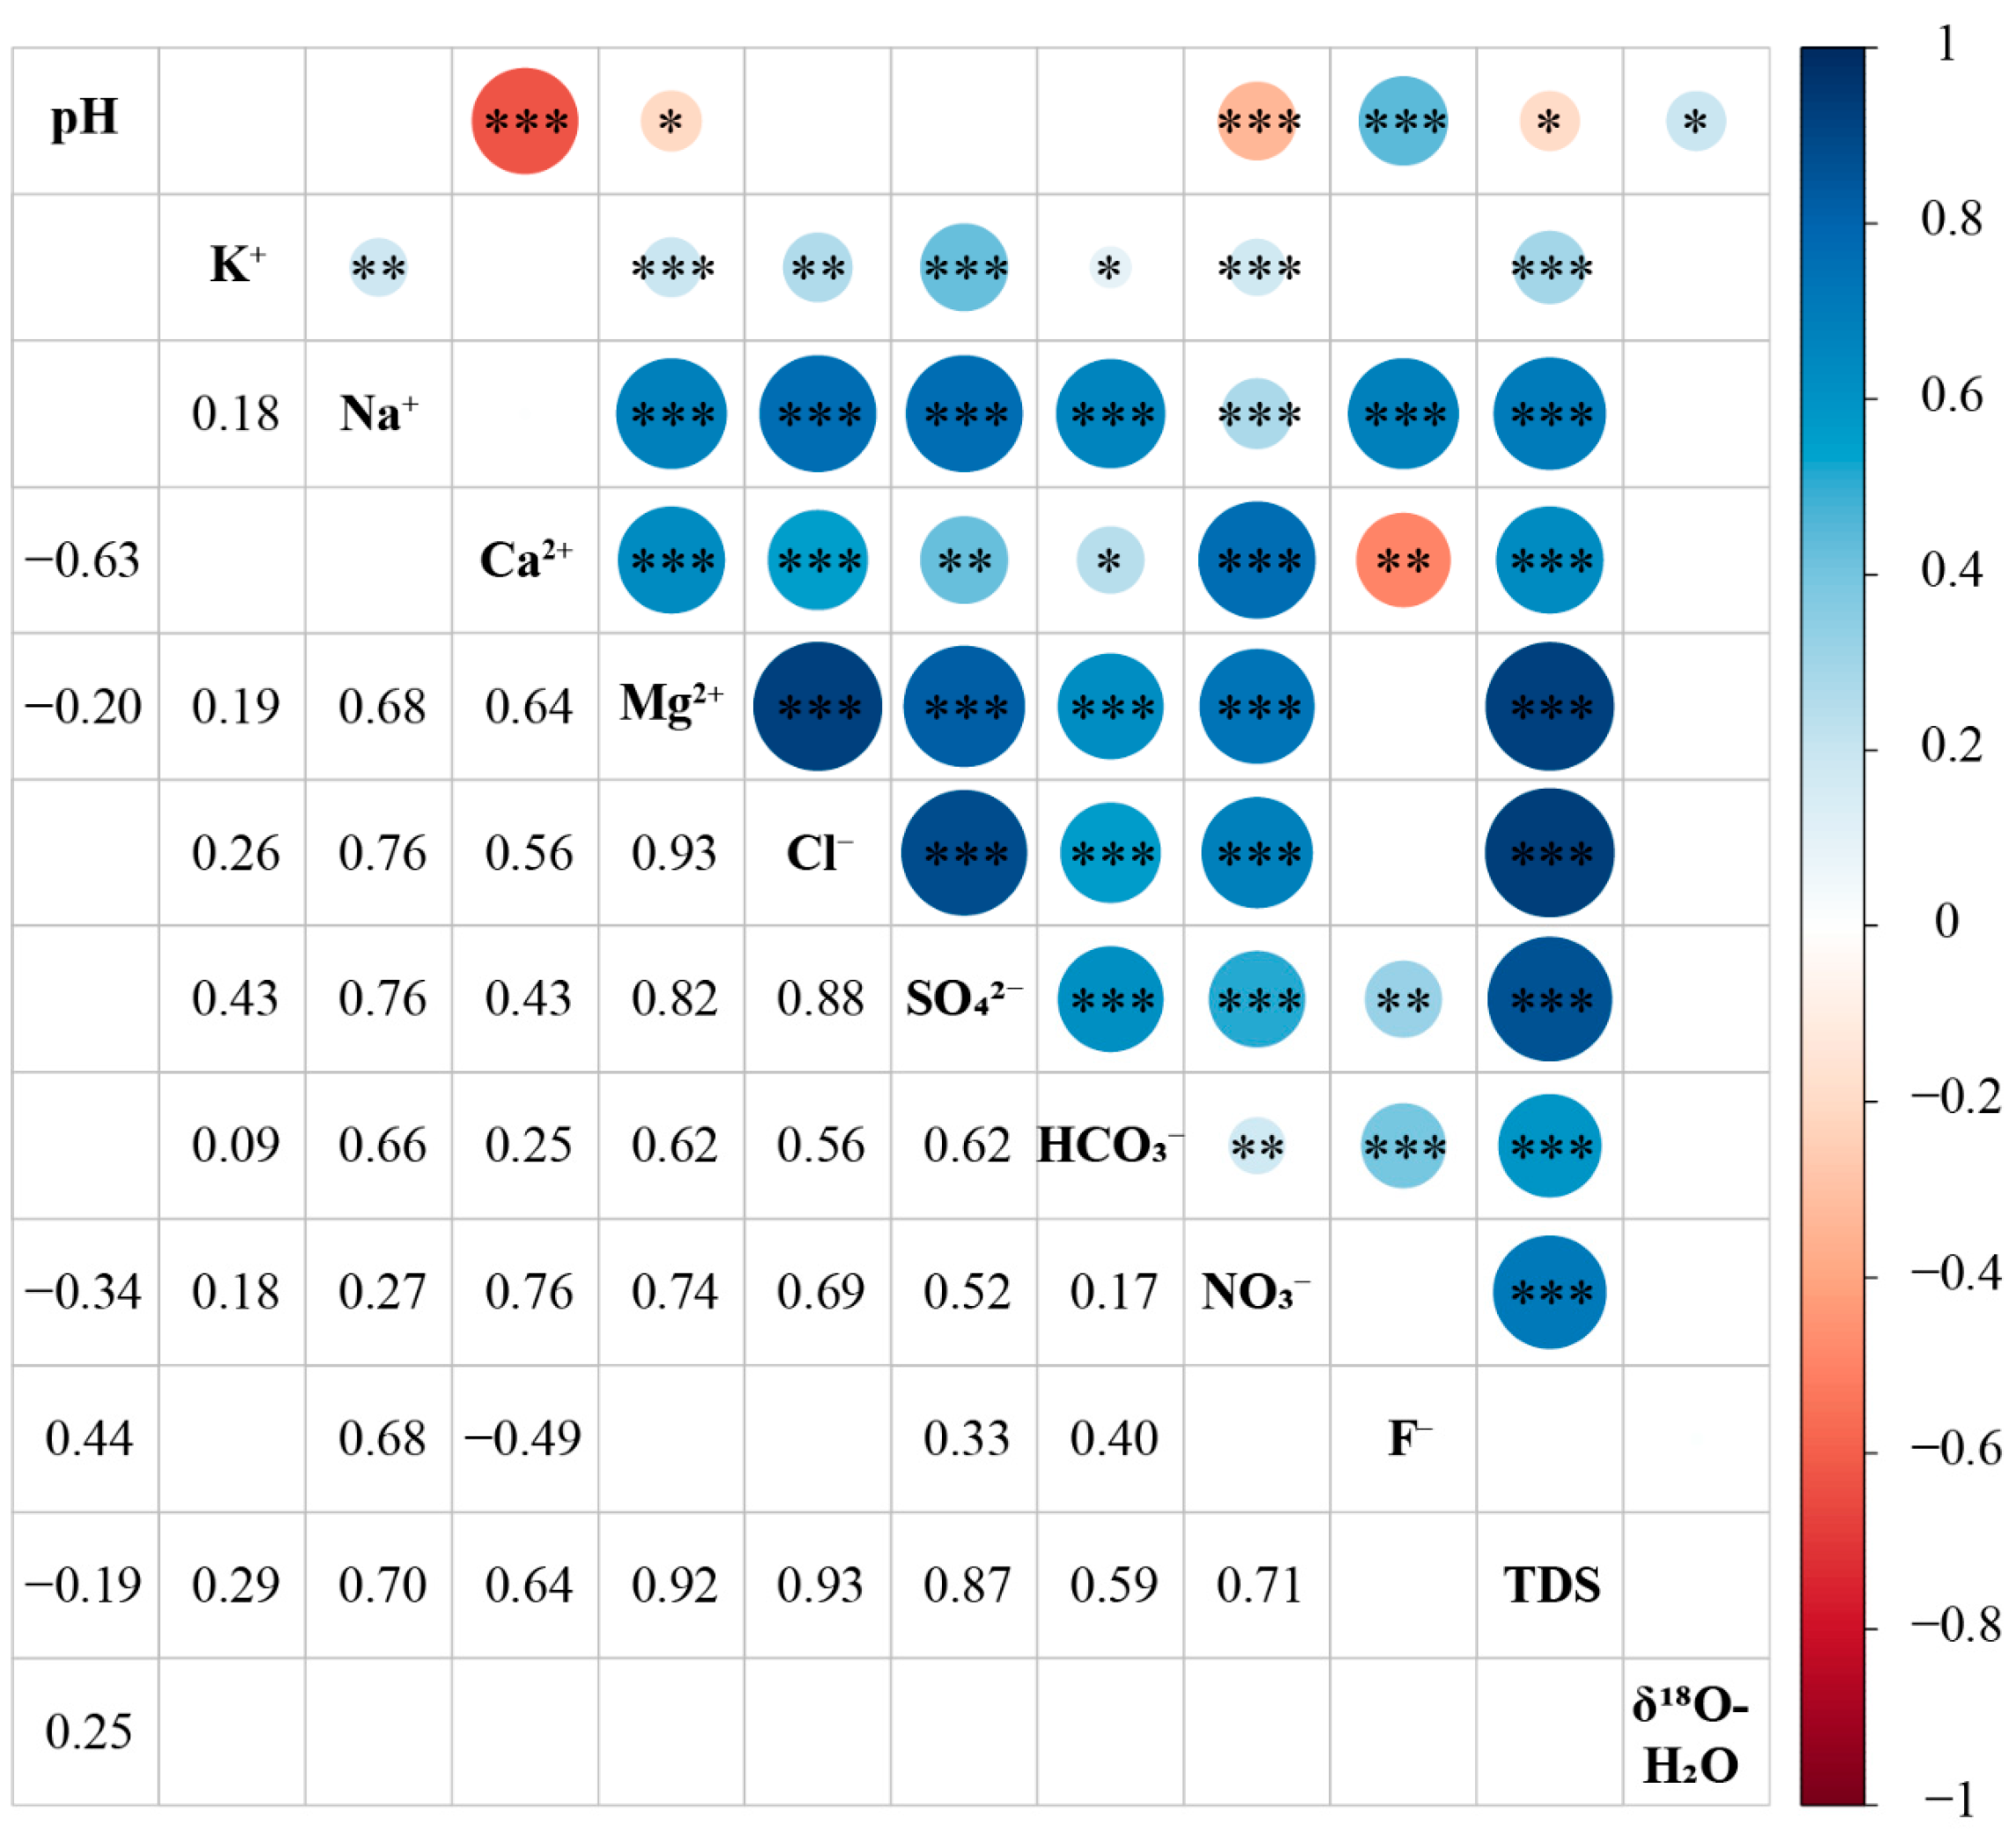
3.4. HCA and PCA Based on Hydrogeochemical Parameters

HCA was used to split the phreatic groundwater samples into four clusters (clusters I, II, III, and IV) (Figure S2). The hydrogeochemical parameters of the four groundwater clusters are exhibited in Table S2. As shown in Figure 6, cluster I was identified as seriously polluted groundwater with high concentrations of NO3 (median: 1232.5 mg/L) and F (median: 2.3 mg/L). Cluster II was identified as seriously polluted groundwater with high concentrations of NO3 (median: 570.2 mg/L) and low concentrations of F (median: 0.6 mg/L). Cluster III was identified as slightly polluted groundwater with low concentrations of NO3 (median: 62.3 mg/L) and F (median: 0.6 mg/L). Cluster IV was also identified as slightly polluted groundwater with low concentrations of NO3 (median: 50.0 mg/L) and high concentrations of F (median: 2.1 mg/L).
Cluster I was identified as Na-Cl·SO4 groundwater (Figure 7a) with a high TDS (median: 4709.2 mg/L; Table S2). Cluster II was identified as mixed Ca·Mg-Cl groundwater with a high TDS (median: 1661.8 mg/L; Table S2). Both clusters I and II were seriously influenced by anthropogenic factors, but their major cations showed significant differences, which might be attributed to geogenic processes. As shown in Figure 7b, the Gibbs diagram indicated that cluster I was located in the zone of evaporation dominance, whereas cluster II was distributed in the zone of rock dominance. The precipitation of Ca2+ and Mg2+ occurs prior to Na+ under alkaline conditions [55]. Thus, the percentage of Na+ increased, whereas that of Ca2+ and Mg2+ decreased during the evaporation process. Therefore, the difference in major cations between clusters I and II was primarily attributed to evaporation.
Cluster III was identified as Ca-HCO3 groundwater (Figure 7a) with a low TDS (median: 538.4 mg/L; Table S2). Cluster IV was identified as mixed Ca·Na-HCO3 groundwater (Figure 7a) with a low TDS (median: 795.4 mg/L; Table S2). Both clusters III and IV were slightly polluted by anthropogenic inputs. The percentage of Na+ in the groundwater of cluster IV was higher than that of cluster III. The Gibbs diagram indicates that the cation-exchange process occurred in the groundwater of cluster III and IV, which might contribute to the difference in the major cation (Figure 7b). The chloro-alkaline indices (CAI-I and CAI-II) refer to ion exchange processes that take place when one ion is substituted by another ion at the solid material surface of soil or rock, such as clay minerals, organic matter, or metal oxyhydroxides [56]. Therefore, CAIs were used to assess the impact of the cation-exchange process in this study (Figure 8). Higher absolute values of these indices indicate a stronger cation exchange in the groundwater environment [57]. The cluster IV groundwater was primarily located in the cation-exchange zone (Figure 8), indicating the substitution of Ca2+ by Na+ (Equation (14)) [11]. Conversely, the groundwater of cluster III was mainly located in the reverse cation-exchange zone (Figure 8), indicating the substitution of Na+ by Ca2+. Therefore, the process of cation exchange led to a higher proportion of Na+ in the cluster IV samples in comparison to the cluster III samples.
2Na − clay + Ca2+ − water → Ca2+ − clay + 2Na+ − water
Under natural conditions, HCO3 is the major anion of the phreatic groundwater in the Tabu River Basin [30]. The major anion of clusters III and IV with slight contamination was HCO3. However, the major anions of cluster I and II with serious contamination were Cl and SO42−. The groundwater in this study area was significantly polluted by manure from agricultural activities, which can elevate the levels of Cl and SO42− in the groundwater [5,43,44]. In this study, NO3 exhibited a significant positive correlation with Cl (R = 0.69, p < 0.001) and SO42− (R = 0.52, p < 0.001). Therefore, agricultural activities significantly affected the hydrochemical composition of the groundwater in clusters I and II.
As shown in Figure 9, PCA based on the hydrogeochemical parameters and δ18O-H2O explained 70.6% of the variance between the groundwater samples using the first two principal components (PC1 and PC2). PC1, which accounted for 50.7% of the variance, exhibited a negative correlation with NO3, TDS, Mg2+, Cl, SO42−, HCO3, and Na+ (Table S4). As agricultural activity enhanced the inputs of NO3, SO42−, Cl, and TDS, PC1 can be interpreted as those anthropogenic factors influencing groundwater quality. PC2 explained 19.9% of the variance, which was negatively correlated with pH, F, Na+, and HCO3, but positively correlated with Ca2+ (Table S4). In the negative direction of PC2, F was positively correlated with pH and HCO3 (Figure 9), indicating the influences of alkaline conditions and competitive adsorption on the enrichment of F [6,10]. In the positive direction of PC2, Ca2+ was negatively correlated with F and Na+, suggesting the influences of cation exchange and fluorine-bearing mineral dissolution on the enrichment of F [12]. Therefore, PC2 could be interpreted as geogenic factors regulating the enrichment of F in groundwater. The results of the PCA further demonstrated that the enrichment of NO3 and F was dominated by anthropogenic and geogenic factors, respectively.

3.5. Assessment of the Risk to Human Health

The long-term consumption of groundwater contaminated with NO3 and F may pose health risks to humans, particularly when used as a source of daily drinking and bathing water without proper precautions being taken [5]. Thus, NO3 and F were considered in the assessment of non-carcinogenic risk for children and adults (females and males) [58]. As exhibited in Table S5, the HItotal varied between 0.97 and 39.50 (median: 4.79) for children, 0.57 and 23.09 for adult females (median: 2.80), and 0.42 and 16.96 for adult males (median: 2.06). A total of 86.2%, 60.9%, and 51.7% of the groundwater samples were found to exceed the permissible limit (HItotal = 1) for children, adult females, and adult males, respectively. Moreover, the spatial distribution of HItotal indicated that groundwater posed a potential risk to children, adult females, and adult males in almost the whole Tabu River Basin (Figure 10a–c). Therefore, the phreatic groundwater environment of the Tabu River Basin is facing challenges. The health threats of NO3 and F to humans through both oral and dermal contact followed the order of children > adult females > adult males.
The HQtotal values of NO3 varied between 0 and 37.30 for children (median: 2.38), 0 and 21.81 for adult females (median: 1.39), and 0 and 16.00 for adult males (median: 1.02) (Table S5). A total of 86.2%, 58.6%, and 51.7% of the groundwater samples were found to exceed the permissible limit of 1 for children, adult females, and adult males, respectively. The HQtotal values of F varied between 0.21 and 5.36 (median: 0.90) for children, 0.12 and 3.14 for adult females (median: 0.52), and 0.09 and 2.30 for adult males (median: 0.38) (Table S5). A total of 44.8%, 31.0%, and 18.4% of the groundwater samples for children, adult females, and adult males were observed to have HQtotal values exceeding 1, respectively. Therefore, the contamination of phreatic groundwater in the Tabu River Basin poses potential risks to human health due to both anthropogenic and geogenic factors, with anthropogenic contamination (NO3) being more serious than geogenic contamination (F).
For the dermal contact pathway, the HIdermal values for both NO3 and F were less than 1 for children, adult females, and adult males (Table S5), suggesting that NO3 and F in the groundwater do not pose a non-carcinogenic risk to humans through the dermal contact pathway. For the oral contact pathway, HIoral values for both NO3 and F varied between 0.97 and 39.35 (median: 4.78) for children, 0.57 and 23.00 for adult females (median: 2.79), and 0.42 and 16.87 for adult males (median: 2.05), respectively. The HIoral values were close to HItotal, highlighting the potential risks of the oral contact pathway to human health. Therefore, most of the phreatic groundwater in the Tabu River Basin can be utilized for domestic rather than drinking purposes. However, high-quality groundwater for drinking purposes can be obtained by drilling wells downstream of the Tabu River Basin, where the human health risks are at an acceptable level (Figure 10).
From the perspective of the spatial distribution, the health risks associated with the groundwater in the middle and upper reaches are primarily influenced by NO3, whereas downstream, they are mainly affected by F (Figure S3). Therefore, the risks for the population of these different regions are also different due to different contamination conditions.

3.6. Development Trends and Countermeasures for Groundwater Contamination

In order to obtain the development trends of the contamination in the Tabu River Basin, 37 samples of phreatic groundwater were collected from some of the 2022 (Figure S4; Table S6) sites in May 2023. A comparison of NO3 and F in the groundwater samples between 2022 and 2023 was conducted. As shown in Figure 11, the NO3 and F content in phreatic groundwater remained stable from 2022 to 2023 (Wilcoxon test, p > 0.05), suggesting that the contamination of phreatic groundwater could not be mitigated through natural attenuation under existing external pressures. Therefore, measures need to be taken to decrease the impact of groundwater contamination and enhance groundwater sustainability in the Tabu River Basin.
It is important to take specific measures for areas with different contamination conditions in the Tabu River Basin. For the middle and upper reaches of the Tabu River Basin, NO3 needs to be controlled (Figure 2). Manure should be centrally disposed of after collection rather than being discharged in a disorderly manner. Moreover, the government should assist local residents with optimizing fertilizer usage to enhance efficiency and decrease overall nitrogen fertilizer consumption. Additionally, exploring the use of novel materials like polymer adsorbent [59] and composite adsorbent [60] presents potential solutions for addressing groundwater pollution. For the high-F groundwater downstream of the Tabu River Basin (Figure 2), it is impracticable to decrease the F content in the phreatic groundwater through artificial measurement, as F is a geogenic contaminant. Therefore, no measures need to be taken against geogenic high F groundwater unless it needs to be used for drinking purposes in the future. If so, strong fluorine removal engineering technology can be used after high-F groundwater has been extracted to waterworks [54]. In addition, Cl and other hazardous substances from chemical fertilizers, manure, and wastewater should be considered during water treatment if groundwater is used for drinking purpose.

4. Conclusions

Groundwater quality is critical for human health and sustainable development in northern China, as it is the main clean water resource. In addition to anthropogenic effects, geogenic processes may play an important role in groundwater quality variation. In this study, a study area in the Tabu River Basin was selected to investigate the contributions of anthropogenic and geogenic effects in phreatic groundwater quality evolution. Additionally, the effects of phreatic groundwater quality on human health were also evaluated. The main conclusions are as follows:
(1)
Agricultural activity is the primary anthropogenic factor influencing the quality of phreatic groundwater. NO3 pollution in the groundwater primarily originates from manure, and the high level of TDS is highly associated with irrigation.
(2)
The enrichment of F in the phreatic groundwater is dominated by geogenic factors, including alkaline conditions, competitive adsorption, the dissolution of fluorine-bearing minerals, and cation exchange.
(3)
Phreatic groundwater with high NO3 and F contents poses significant threats to human health through the oral contact pathway, especially for children. Most of the phreatic groundwater in the Tabu River Basin can be utilized for domestic purposes, with the exception of drinking water.
(4)
The contamination of phreatic groundwater cannot be mitigated through natural attenuation under existing external pressures. Measures need to be taken to decrease contamination of phreatic groundwater and enhance groundwater sustainability in the Tabu River Basin.

Supplementary Materials

The following supporting information can be downloaded at: https://www.mdpi.com/article/10.3390/su16156328/s1, Table S1: Parameters involved in a human health risk assessment [61]; Table S2: Hydrogeochemical parameters of the groundwater samples in 2022; Table S3: Hydrogeochemical parameters of the surface water samples; Table S4: Results of principal component analysis; Table S5: Results of human health risk assessment; Table S6: Hydrogeochemical parameters of the groundwater samples in 2023; Figure S1: Plot of δ2H-H2O vs. δ18O-H2O for groundwater samples in the Tabu River Basin [62]; Figure S2: Results of hierarchical cluster analysis; Figure S3: Distributions of HQoral of NO3 and F for (a) children, (b) adult females, and (c) adult males; Figure S4. (a) Location of the Tabu River basin in the Inner Mongolia Autonomous Region. (b) Land use map of the Tabu River Basin and the location of sampling sites in 2022.

Author Contributions

Conceptualization, J.Z. and Y.Z. (Yuanzheng Zhang); methodology, J.J. and Y.Z. (Yuanzheng Zhang); software, Y.N.; formal analysis, Y.Z. (Yuanzheng Zhang); validation, M.W.; investigation, Z.L., M.W., Z.W. and Y.Z. (Yiping Zhao); data curation, Z.W. and Y.Z. (Yiping Zhao); writing—original draft preparation, J.Z. and Y.Z. (Yuanzheng Zhang); writing—review and editing, J.X. and Y.Z. (Yuanzheng Zhang); visualization, J.Z. and Y.N.; supervision, J.X. and Z.L.; funding acquisition, J.Z., J.J. and J.X. All authors have read and agreed to the published version of the manuscript.

Funding

This research was supported by the Basic Scientific Research Foundation Special Project of the China Institute of Water Resources and Hydropower Research (No. MK2022J05), the Project of Collaborative Innovation Center for Grassland Ecological Security (Eco-hydrological Characteristics and Ecosystem Services Assessment in Tabu River Watershed, No. MK0143A032021), and the National Key Research and Development Program of China (No. 2023YFC3707902).

Data Availability Statement

The original contributions presented in the study are included in the article/Supplementary Materials, further inquiries can be directed to the corresponding author/s.

Acknowledgments

We are grateful to all the editors and anonymous reviewers for their helpful comments that greatly improved the quality of the manuscript.

Conflicts of Interest

The authors declare no conflicts of interest.

References

  1. Pandey, S.; Mohapatra, G.; Arora, R. Groundwater quality, human health risks and major driving factors in arid and semi-arid regions of Rajasthan, India. J. Clean. Prod. 2023, 427, 139149. [Google Scholar] [CrossRef]
  2. Wang, X.K.; Xiao, C.L.; Yang, W.F.; Liang, X.J.; Zhang, L.Z.; Zhang, J. Analysis of the quality, source identification and apportionment of the groundwater in a typical arid and semi-arid region. J. Hydrol. 2023, 625 Pt B, 130169. [Google Scholar] [CrossRef]
  3. Jolly, I.D.; Mcewan, K.L.; Holland, K.L. A review of groundwater-surface water interactions in arid/semi-arid wetlands and the consequences of salinity for wetland ecology. Ecohydrology 2010, 1, 43–58. [Google Scholar] [CrossRef]
  4. Lapworth, D.J.; Boving, T.B.; Kreamer, D.K.; Kebede, S.; Smedley, P.L. Groundwater quality: Global threats, opportunities and realising the potential of groundwater. Sci. Total Environ. 2022, 811, 152471. [Google Scholar] [CrossRef] [PubMed]
  5. Xiao, Y.; Hao, Q.C.; Zhang, Y.H.; Zhu, Y.C.; Yin, S.Y.; Qin, L.M.; Li, X.H. Investigating sources, driving forces and potential health risks of nitrate and fluoride in groundwater of a typical alluvial fan plain. Sci. Total Environ. 2022, 802, 149909. [Google Scholar] [CrossRef] [PubMed]
  6. Su, H.; Li, H.; Chen, H.; Li, Z.; Zhang, S.Z. Source identification and potential health risks of fluoride and nitrate in groundwater of a typical alluvial plain. Sci. Total Environ. 2023, 904, 166920. [Google Scholar] [CrossRef] [PubMed]
  7. Li, J.X.; Zhou, H.L.; Qian, K.; Xie, X.J.; Xue, X.B.; Yang, Y.J.; Wang, Y.X. Fluoride and iodine enrichment in groundwater of North China Plain: Evidences from speciation analysis and geochemical modeling. Sci. Total Environ. 2017, 598, 239–248. [Google Scholar] [CrossRef] [PubMed]
  8. Jia, Y.F.; Xi, B.D.; Jiang, Y.H.; Guo, H.M.; Yang, Y.; Lian, X.Y.; Han, S.B. Distribution, formation and human-induced evolution of geogenic contaminated groundwater in China: A review. Sci. Total Environ. 2018, 643, 967–993. [Google Scholar] [CrossRef]
  9. Wang, Y.X.; Li, J.X.; Ma, T.; Xie, X.J.; Deng, Y.M.; Gan, Y.Q. Genesis of geogenic contaminated groundwater: As, F and I. Crit. Rev. Environ. Sci. Technol. 2020, 51, 2895–2933. [Google Scholar] [CrossRef]
  10. Ferraro, A.; de Sario, S.; Attanasio, A.; Di Capua, F.; Gorgoglione, A.; Fratino, U.; Mascolo, M.C.; Pirozzi, F.; Trancone, G.; Spasiano, D. Phosphorus recovery as struvite and hydroxyapatite from the liquid fraction of municipal sewage sludge with limited magnesium addition. J. Environ. Qual. 2022, 52, 584–595. [Google Scholar] [CrossRef]
  11. Chen, J.; Gao, Y.Y.; Qian, H.; Ren, W.H.; Qu, W.G. Hydrogeochemical evidence for fluoride behavior in groundwater and the associated risk to human health for a large irrigation plain in the Yellow River Basin. Sci. Total Environ. 2021, 800, 149428. [Google Scholar] [CrossRef] [PubMed]
  12. Huang, L.W.; Sun, Z.Y.; Zhou, A.G.; Bi, J.B.; Liu, Y.D. Source and enrichment mechanism of fluoride in groundwater of the Hotan Oasis within the Tarim Basin, Northwestern China. Environ. Pollut. 2022, 300, 118962. [Google Scholar] [CrossRef]
  13. Coyte, R.M.; Singh, A.; Furst, K.E.; Mitch, W.A.; Vengosh, A. Co-occurrence of geogenic and anthropogenic contaminants in groundwater from Rajasthan, India. Sci. Total Environ. 2019, 688, 1216–1227. [Google Scholar] [CrossRef]
  14. Lapworth, D.J.; Krishan, G.; MacDonald, A.M.; Rao, M. Groundwater quality in the alluvial aquifer system of northwest India: New evidence of the extent of anthropogenic and geogenic contamination. Sci. Total Environ. 2017, 599–600, 1433–1444. [Google Scholar] [CrossRef] [PubMed]
  15. Huang, G.X.; Song, J.M.; Han, D.Y.; Liu, R.N.; Liu, C.Y.; Hou, Q.X. Assessing natural background levels of geogenic contaminants in groundwater of an urbanized delta through removal of groundwaters impacted by anthropogenic inputs: New insights into driving factors. Sci. Total Environ. 2023, 857 Pt 2, 159527. [Google Scholar] [CrossRef]
  16. Qu, S.; Duan, L.; Shi, Z.M.; Mao, H.R.; Wang, G.C.; Liu, T.X.; Yu, R.H.; Peng, X.H. Identifying the spatial pattern, driving factors and potential human health risks of nitrate and fluoride enriched groundwater of Ordos Basin, Northwest China. J. Clean. Prod. 2022, 376, 134289. [Google Scholar] [CrossRef]
  17. Torres-Martínez, J.A.; Mora, A.; Knappett, P.S.; Ornelas-Soto, N.; Mahlknecht, J. Tracking nitrate and sulfate sources in groundwater of an urbanized valley using a multi-tracer approach combined with a bayesian isotope mixing model. Water Res. 2020, 182, 115962. [Google Scholar] [CrossRef] [PubMed]
  18. Carrey, R.; Ballesté, E.; Blanch, A.R.; Lucena, F.; Pons, P.; López, J.M.; Rull, M.; Solà, J.; Micola, N.; Fraile, J.; et al. Combining multi-isotopic and molecular source tracking methods to identify nitrate pollution sources in surface and groundwater. Water Res. 2021, 188, 116537. [Google Scholar] [CrossRef]
  19. Varol, M. Use of water quality index and multivariate statistical methods for the evaluation of water quality of a stream affected by multiple stressors: A case study. Environ. Pollut. 2020, 266, 115417. [Google Scholar] [CrossRef]
  20. Zhang, Y.Z.; Liu, Y.D.; Zhou, A.G.; Zhang, L. Identification of groundwater pollution from livestock farming using fluorescence spectroscopy coupled with multivariate statistical methods. Water Res. 2021, 206, 117754. [Google Scholar] [CrossRef]
  21. Yang, J.; Ye, M.; Tang, Z.; Jiao, T.; Song, X.; Pei, Y.; Liu, H.H. Using cluster analysis for understanding spatial and temporal patterns and controlling factors of groundwater geochemistry in a regional aquifer. J. Hydrol. 2020, 583, 124594. [Google Scholar] [CrossRef]
  22. Paca, J.M.; Santos, F.M.; Pires, J.C.M.; Leitão, A.A.; Boaventura, R.A.R. Quality assessment of water intended for human consumption from Kwanza, Dande and Bengo rivers (Angola). Environ. Pollut. 2019, 254, 113037. [Google Scholar] [CrossRef] [PubMed]
  23. Chen, J.; Wu, H.; Qian, H. Groundwater nitrate contamination and associated health risk for the rural communities in an agricultural area of Ningxia, Northwest China. Expo. Health 2016, 8, 349–359. [Google Scholar] [CrossRef]
  24. Aschebrook-Kilfoy, B.; Heltshe, S.L.; Nuckols, J.R.; Sabra, M.M.; Shuldiner, A.R.; Mitchell, B.D.; Airola, M.; Holford, T.R.; Zhang, Y.W.; Ward, M.H. Modeled nitrate levels in well water supplies and prevalence of abnormal thyroid conditions among the old order amish in Pennsylvania. Environ. Health 2012, 11, 6. [Google Scholar] [CrossRef] [PubMed]
  25. Srivastava, S.; Flora, S.J.S. Fluoride in drinking water and skeletal fluorosis: A review of the global impact. Curr. Environ. Health Rep. 2020, 7, 140–146. [Google Scholar] [CrossRef] [PubMed]
  26. Dar, F.A.; Kurella, S. Fluoride in drinking water: An in-depth analysis of its prevalence, health effects, advances in detection and treatment. Mater. Today Proc. 2023; in press. [Google Scholar]
  27. Zhai, Y.Z.; Lei, Y.; Wu, J.; Teng, Y.G.; Wang, J.S.; Zhao, X.B.; Pan, X.D. Does the groundwater nitrate pollution in China pose a risk to human health? A critical review of published data. Environ. Sci. Pollut. Res. 2017, 24, 3640–3653. [Google Scholar] [CrossRef] [PubMed]
  28. USEPA. Risk Assessment Guidance for Superfund. Volume I: Human Health Evaluation Manual (Part A), Interim Final; EPA/540/1-89/002; Office of Emergency and Remedial Response U.S. Environmental Protection Agency: Washington, DC, USA, 1989.
  29. Yang, Y.; Liu, H.; Tao, W.H.; Shan, Y.Y. Spatiotemporal variation characteristics and driving force analysis of precipitation use efficiency at the north foot of Yinshan Mountain. Water 2024, 16, 99. [Google Scholar] [CrossRef]
  30. Jin, J.; Liu, T.; Wang, M.; Liao, Z.; Zhang, J. Hydrochemical and isotopic explanations of the interaction between surfacewater and groundwater in a typical-desertified steppe of northern China. Sustainability 2023, 15, 11034. [Google Scholar] [CrossRef]
  31. Muscetta, M.; Bianco, F.; Trancone, G.; Race, M.; Siciliano, A.; D’Agostino, F.; Sprovieri, M.; Clarizia, L. Washing bottom sediment for the removal of arsenic from contaminated italian coast. Processes 2023, 11, 902. [Google Scholar] [CrossRef]
  32. Trancone, G.; Spasiano, D.; Race, M.; Luongo, V.; Petrella, A.; Pirozzi, F.; Fratino, U.; Piccinni, A.F. A combined system for asbestos-cement waste degradation by dark fermentation and resulting supernatant valorization in anaerobic digestion. Chemosphere 2022, 300, 134500. [Google Scholar] [CrossRef]
  33. Wang, H.; Zhu, B.; Shen, L.J.; Kang, H.Q. Size distributions of aerosol and water-soluble ions in Nanjing during a crop residual burning event. J. Environ. Sci. 2012, 24, 1457–1465. [Google Scholar] [CrossRef] [PubMed]
  34. El Housse, M.; Hadfi, A.; Karmal, I.; Tadoumant, S.; Ben-aazza, S.; Errami, M.; Belattar, M.; Mohareb, S.; Tounsi, A.; Driouiche, A. Study of scaling problem in the region of tata (Morocco): Analysis of the elemental composition, crystalline phases, and morphologies of scale deposition in water installations. Appl. Radiat. Isot. 2022, 188, 110388. [Google Scholar] [CrossRef] [PubMed]
  35. Weigand, M.A.; Foriel, J.; Barnett, B.; Oleynik, S.; Sigman, D.M. Updates to instrumentation and protocols for isotopic analysis of nitrate by the denitrifier method. Rapid Commun. Mass. Spectrom. 2016, 30, 1365–1383. [Google Scholar] [CrossRef] [PubMed]
  36. Balacco, G.; Alfio, M.R.; Fidelibus, M.D. Groundwater Drought Analysis under Data Scarcity: The Case of the Salento Aquifer (Italy). Sustainability 2022, 14, 707. [Google Scholar] [CrossRef]
  37. R Core Team. R: A Language and Environment For Statistical Computing; R Foundation for Statistical Computing: Vienna, Austria, 2024; Available online: https://www.R-project.org/ (accessed on 1 March 2024).
  38. Nourani, V.; Ghaneei, P.; Kantoush, S.A. Robust clustering for assessing the spatiotemporal variability of groundwater quantity and quality. J. Hydrol. 2022, 604, 127272. [Google Scholar] [CrossRef]
  39. NGWA. Brackish Groundwater. National Groundwater Association. Information Brief. 25 September 2017. Available online: https://www.ngwa.org/docs/default-source/default-document-library/publications/information-briefs/brackish-groundwater.pdf (accessed on 1 February 2024).
  40. WHO. Guidelines for Drinking Water Quality. Fourth Edition Incorporating the First Addendum; WHO: Geneva, Switzerland, 2017. [Google Scholar]
  41. Wang, S.Q.; Zheng, W.B.; Currell, M.; Yang, Y.H.; Zhao, H.; Lv, M.Y. Relationship between land-use and sources and fate of nitrate in groundwater in a typical recharge area of the North China plain. Sci. Total Environ. 2017, 609, 607–620. [Google Scholar] [CrossRef] [PubMed]
  42. Xuan, Y.X.; Tang, C.Y.; Cao, Y.J. Mechanisms of nitrate accumulation in highly urbanized rivers: Evidence from multi-isotopes in the Pearl River Delta, China. J. Hydrol. 2020, 587, 124924. [Google Scholar] [CrossRef]
  43. Jalali, M. Nitrate pollution of groundwater in Toyserkan, western Iran. Environ. Earth Sci. 2011, 62, 907–913. [Google Scholar] [CrossRef]
  44. Fabro, A.Y.R.; Ávila, J.G.P.; Alberich, M.V.E.; Sansores, S.A.C.; Camargovalero, M.A. Spatial distribution of nitrate health risk associated with groundwater use as drinking water in Merida, Mexico. Appl. Geogr. 2015, 65, 49–57. [Google Scholar] [CrossRef]
  45. Xue, D.M.; Botte, J.; Baets, B.D.; Accoe, F.; Nestler, A.; Taylor, P.; Cleemput, O.V.; Berglund, M.; Boeckx, P. Present limitations and future prospects of stable isotope methods for nitrate source identification in surface- and groundwater. Water Res. 2009, 43, 1159–1170. [Google Scholar] [CrossRef]
  46. Kendall, C.; Elliott, E.M.; Wankel, S.D. Tracing anthropogenic inputs of nitrogen to ecosystems. Stable Isot. Ecol. Environ. Sci. 2007, 2, 375–449. [Google Scholar]
  47. Han, D.; Song, X.; Currell, M.J.; Cao, G.; Zhang, Y.; Kang, Y. A survey of groundwater levels and hydrogeochemistry in irrigated fields in the Karamay Agricultural Development Area, northwest China: Implications for soil and groundwater salinity resulting from surface water transfer for irrigation. J. Hydrol. 2011, 405, 217–234. [Google Scholar] [CrossRef]
  48. Pauloo, R.A.; Fogg, G.E.; Guo, Z.L.; Harter, T. Anthropogenic basin closure and groundwater salinization (ABCSAL). J. Hydrol. 2021, 593, 125787. [Google Scholar] [CrossRef]
  49. Li, C.C.; Gao, X.B.; Liu, Y.S.; Wang, Y.X. Impact of anthropogenic activities on the enrichment of fluoride and salinity in groundwater in the Yuncheng Basin constrained by Cl/Br ratio, δ18O, δ2H, δ13C and δ7Li isotopes. J. Hydrol. 2019, 579, 124211. [Google Scholar] [CrossRef]
  50. Su, H.; Wang, J.D.; Liu, J.T. Geochemical factors controlling the occurrence of highfluoride groundwater in the western region of the Ordos basin, northwestern China. Environ. Pollut. 2019, 252, 1154–1162. [Google Scholar] [CrossRef] [PubMed]
  51. Kumar, M.; Das, N.; Goswami, R.; Sarma, K.P.; Bhattacharya, P.; Ramanathan, A. Coupling fractionation and batch desorption to understand arsenic and fluoride co-contamination in the aquifer system. Chemosphere 2016, 164, 657–667. [Google Scholar] [CrossRef] [PubMed]
  52. Karroum, M.; Elgettafi, M.; Elmandour, A.; Wilske, C.; Himi, M.; Casas, A. Geochemical processes controlling groundwater quality under semi arid environment: A case study in central Morocco. Sci. Total Environ. 2017, 609, 1140–1151. [Google Scholar] [CrossRef] [PubMed]
  53. Feng, F.; Jia, Y.F.; Yang, Y.; Huan, H.; Lian, X.Y.; Xu, X.J.; Xia, F.; Han, X.; Jiang, Y.H. Hydrogeochemical and statistical analysis of high fluoride groundwater in northern China. Environ. Sci. Pollut. Res. 2020, 27, 34840–34861. [Google Scholar] [CrossRef] [PubMed]
  54. Wang, W.Z.; Li, Z.; Su, H.; Xiao, J.; Han, F.P.; Li, Z. Spatial and seasonal variability, control factors and health risk of fluoride in natural water in the Loess Plateau of China. J. Hazard. Mater. 2022, 434, 128897. [Google Scholar] [CrossRef]
  55. Molinari, R.; Avci, A.H.; Argurio, P.; Curcio, E.; Meca, S.; Plà-Castellana, M.; Cortina, J.L. Selective precipitation of calcium ion from seawater desalination reverse osmosis brine. J. Clean. Prod. 2021, 328, 129645. [Google Scholar] [CrossRef]
  56. Schoeller, H. Geochemistry of groundwater. In Groundwater Studies—An International Guide for Research and Practice; UNESCO: Paris, France, 1977; pp. 1–18. [Google Scholar]
  57. Wu, C.; Wu, X.; Qian, C.; Zhu, G. Hydrogeochemistry and groundwater quality assessment of high fluoride levels in the Yanchi endorheic region, northwest China. Appl. Geochem. 2018, 98, 404–417. [Google Scholar] [CrossRef]
  58. Kaur, L.; Rishi, M.S.; Siddiqui, A.U. Deterministic and probabilistic health risk assessment techniques to evaluate non-carcinogenic human health risk (NHHR) due to fluoride and nitrate in groundwater of Panipat, Haryana, India. Environ. Pollut. 2020, 259, 113711. [Google Scholar] [CrossRef] [PubMed]
  59. Huang, Z.T.; Li, Y.R.; Mei, J.; Ding, Y.; Wang, X.B. Preparation of poly(divinylbenzene-co-methyl acrylate) adsorbent with tunable surface hydrophilicity for atrazine removal. Surf. Interfaces 2024, 49, 104371. [Google Scholar] [CrossRef]
  60. Xi, Z.M.; Diao, S.J.; Xu, R.Z.; Wei, G.Y.; Wen, J.F.; Hu, G.H.; Tang, T.; Jiang, L.; Li, X.Y.; Li, M.; et al. Construction of carboxylated-GO and MOFs composites for efficient removal of heavy metal ions. Appl. Surf. Sci. 2023, 636, 157827. [Google Scholar] [CrossRef]
  61. Wu, J.H.; Zhou, H.; He, S.; Zhang, Y.X. Comprehensive understanding of groundwater quality for domestic and agricultural purposes in terms of health risks in a coal mine area of the Ordos basin, north of the Chinese Loess Plateau. Environ. Earth Sci. 2019, 78, 446. [Google Scholar] [CrossRef]
  62. Gibson, J.J.; Edwards, T.W.D.; Bursey, G.G.; Prowse, T.D. Estimating evaporation using stable isotopes: Quantitative results and sensitivity analysis for two catchments in Northern Canada: Paper presented at the 9th Northern Res. Basin Symposium/Workshop (Whitehorse/Dawson/Inuvik, Canada-August 1992). Hydrol. Res. 1993, 24, 79–94. [Google Scholar] [CrossRef]
Figure 1. (a) Location of the Tabu River Basin in the Inner Mongolia Autonomous Region. (b) Land-use map of the Tabu River Basin and the location of the sampling sites.
Sustainability 16 06328 g001
Figure 2. Spatial distributions of (a) NO3, (b) F, and (c) TDS in the groundwater of the Tabu River Basin.
Sustainability 16 06328 g002
Figure 3. Spearman correlation heatmap; the correlation coefficients and significance levels are based on the hydrogeochemical and isotopic parameters. The symbols *, **, and *** represent statistical significance levels of p < 0.05, p < 0.01, and p < 0.001, respectively. Hypothesis testing was employed to evaluate the significance of the correlations among various hydrogeochemical and isotopic parameters.
Sustainability 16 06328 g003
Figure 4. Relationships between (a) δ15N-NO3 vs. δ18O-NO3 and (b) Cl/Na+ vs. NO3/Na+. The typical ranges of NO3 end-members, including atmospheric NO3, chemical fertilizer, NH4+ in fertilizer and rain, soil N, manure, and sewage, were derived from Xue et al. [45] and Kendall et al. [46].
Sustainability 16 06328 g004
Figure 5. Relationships between (a) (Na+ + K+ − Cl) vs. (Ca2+ + Mg2+) − (HCO3 + SO42−), (b) F vs. SIfluorite, and (c) SIcalcite vs. SIfluorite.
Sustainability 16 06328 g005
Figure 6. F and NO3 concentrations in groundwater according to the four clusters.
Sustainability 16 06328 g006
Figure 7. (a) Piper trilinear diagram. (b) Gibbs diagram for groundwater samples according to the four clusters.
Sustainability 16 06328 g007
Figure 8. Relationship between CAI-I and CAI-II (chloro-alkaline indices). CAI-I = [Cl − (Na+ + K+)]/Cl. CAI-II = [Cl − (Na+ + K+)]/(SO42− + HCO3 + CO32−). The concentrations are represented in equivalent per mille.
Sustainability 16 06328 g008
Figure 9. Principal component analysis diagram based on the hydrogeochemical and isotopic parameters.
Sustainability 16 06328 g009
Figure 10. Distributions of HItotal for (a) children, (b) adult females, and (c) adult males.
Sustainability 16 06328 g010
Figure 11. Comparison of (a) NO3 and (b) F in groundwater between 2022 and 2023. The classification was based on the results of the HCA of groundwater samples in 2022.
Sustainability 16 06328 g011
Table 1. Statistical summary of hydrogeochemical and isotopic parameters of groundwater samples and the saturation index of the selected minerals.
ParameterMinMaxMedianSD
K+ (mg/L)0.8272.62.629.2
Na+ (mg/L)8.91130.076.0166.1
Ca2+ (mg/L)23.5565.985.3108.8
Mg2+ (mg/L)11.5292.439.251.6
Cl (mg/L)17.71156.098.4190.9
SO42− (mg/L)17.9974.7100.5155.5
HCO3 (mg/L)174.0716.0293.1128.9
F (mg/L)0.24.60.81.0
NO3 (mg/L)0.01274.081.3308.0
pH7.378.668.100.29
TDS (mg/L)278.05398.5712.0882.4
Burial depth (m)0.7522.155.823.91
δ2H-H2O (‰)−111.6−32.6−75.410.1
δ18O-H2O (‰)−15.1−4.0−10.21.5
δ15N-NO3 (‰)−4.731.214.04.7
δ18O-NO3 (‰)−7.610.8−1.12.9
SIcalcite0.261.60.910.25
SIdolomite0.013.121.710.62
SIfluorite−2.390.05−1.110.5
SIgypsum−2.41−0.74−1.660.4
Disclaimer/Publisher’s Note: The statements, opinions and data contained in all publications are solely those of the individual author(s) and contributor(s) and not of MDPI and/or the editor(s). MDPI and/or the editor(s) disclaim responsibility for any injury to people or property resulting from any ideas, methods, instructions or products referred to in the content.

