Article

Prediction of Adaptability of Typical Vegetation Species in Flood Storage Areas under Future Climate Change: A Case in Hongze Lake FDZ, China

1
School of Water Resources Science and Engineering, Yangzhou University, Yangzhou 225009, China
2
Suqian Water Conservancy Bureaut, Suqian 223800, China
*
Authors to whom correspondence should be addressed.
Sustainability 2024, 16(15), 6331; https://doi.org/10.3390/su16156331
Submission received: 25 April 2024 / Revised: 13 June 2024 / Accepted: 2 July 2024 / Published: 24 July 2024
(This article belongs to the Special Issue Editorial Board Members’ Collection Series: Climate Change and SDGs)

Abstract

:
China experiences frequent heavy rainfall and flooding events, which have particularly increased in recent years. As flood storage zones (FDZs) play an important role in reducing disaster losses, their ecological restoration has been receiving widespread attention. Hongze Lake is an important flood discharge area in the Huaihe River Basin of China. Previous studies have preliminarily analyzed the protection of vegetation zones in the FDZ of this lake, but the future growth trend of typical vegetation in the area has not been considered as a basis for the precise protection of vegetation diversity and introductory cultivation of suitable species in the area. Taking the FDZ of Hongze Lake as an example, this study investigated the change trend of the suitability of typical vegetation species in the Hongze Lake FDZ based on future climate change and the distribution pattern of the suitable areas. To this end, the distribution of potentially suitable habitats of 20 typical vegetation species in the 2040s was predicted under the SSP1-2.6, SSP2-4.5, SSP3-7.0, and SSP5-8.5 climate scenarios using the latest Coupled Model Intercomparison Project CMIP6. The predicted distribution was compared with the current distribution of potentially suitable habitats. The results showed that the model integrating high-performance random forest, generalized linear model, boosted tree model, flexible discriminant analysis model, and generalized additive model had significantly higher TSS and AUC values than the individual models, and could effectively improve model accuracy. The high sensitivity of these 20 typical vegetation species to temperature and rainfall related factors reflects the climatic characteristics of the study area at the junction of subtropical monsoon climate and temperate monsoon climate. Under future climate scenarios, with reference to the current scenario of the 20 typical species, the suitability for Nelumbo nucifera Gaertn decreased, that for Iris pseudacorus L. increased in the western part of the study area but decreased in the eastern wetland and floodplain, and the suitability of the remaining 18 species increased. This study identified the trend of potential suitable habitat distribution and the shift in the suitability of various typical vegetation species in the floodplain of Hongze Lake. The findings are important for the future enhancement of vegetation habitat conservation and suitable planting in the study area, and have implications for the restoration and conservation of vegetation diversity in most typical floodplain areas.

1. Introduction

Natural depressions, lakes, or flooded wetlands with relatively sparse populations play an important role in flood regulation, water purification, and ecological biodiversity. When such areas are designated as flood storage zones (FDZs) [1], the ecological environment undergoes serious degradation due to excessive reclamation by human beings and complex natural factors, even leading to the loss of wetlands [1]. Moreover, vegetation diversity declines sharply. Therefore, in the process of returning polders to lakes, an urgent issue is to find an effective and accurate solution for restoring vegetation diversity and maintaining the ecological balance of FDZs [2]. Previous studies have proposed some simple but effective measures for protecting vegetation in each planning zone of FDZs (in some cases, water quality was simply improved to provide vegetation with high-quality water [3].
Climate is one of the main factors affecting the geographical distribution of plant species and the pattern and structure of vegetation. However, regional climate change has not been considered in existing research on vegetation diversity protection in FDZs. Climate is closely related to the change in phenological events and the change in species range [4], and interactions often occur between vegetation diversity and climate change. Abundant vegetation diversity is conducive to regulating the regional microclimate, increasing the frequency of carbon cycling processes and maintaining overall regional biodiversity. Considering climate as a decisive factor in the adaptive changes in typical vegetation in FDZs, the influence curve between future climate and typical vegetation can provide crucial information for assessing the possible migration range and dispersion obstacles of vegetation types, predicting protected (habitats suitable for ex situ relocation, and preliminarily evaluating vegetation diversity. Exploring the impact of future climate on the future pattern of vegetation adaptability is conducive to stabilizing regional biodiversity.
In recent years, the global climate has been in a state of continuous warming. Along with it, the climate and environment of China have also undergone significant changes, with an annual average surface temperature increase of approximately 0.91 °C, which is slightly higher than the average rise globally or in the Northern Hemisphere over the same period. This excessive increase poses serious threats to biodiversity and will continuously accelerate biodiversity loss. Over the past few decades, rising temperatures have altered the distribution patterns of many species, leading to some researchers suggesting that the earth is experiencing the sixth mass extinction in its history [5,6,7]. Accordingly, species distribution modeling (SDM), an integrated modeling platform for species distribution based on R language, has been developed for exploring ecological issues related to species and the environment in the context of global change [8,9]. It is considered to be an extremely important tool and is widely used in studies on the impacts of climate change on species distributions and in the planning of protected areas. Currently, dozens of distribution prediction models have been developed and applied, such as Maxent [10], generalized linear model (GLM) [11], and random forests (RF) [12]. Although these ecological niche models have commonly been used, their application scopes and prediction performances widely vary. Therefore, the integration of multiple models is favored for achieving more stable result output [13]. In SDM, several common single models, such as flexible discriminant analysis (FDA), generalized linear model (GLM), generalized additive model (GAM), and multivariate adaptive regression spline curve (MARS), can be integrated, which improves the prediction accuracy and avoids the instability of single models [14]. As a mature multi-model ensemble platform, it can simulate the spatial distribution of species under different environmental influences in the past, present and future, through which the main influencing factors can be deduced [15].
In this study, using occurrence data and species distribution models of 20 typical vegetation species in Hongze Lake FDZ, suitable habitats in the present and future were predicted and quantified under different shared socio-economic pathways. Through field surveys and data search, these 20 vegetation species were identified as playing important roles in the ecological landscapes, animal habitats, water purification, flood control, and soil stabilization of the floodplain in Hongze Lake FDZ (Figure 1). For the nesting vegetation of migratory birds in Hongze Lake, Phragmites australis (Cav.) Trin. ex steu, Polygonum hydropiper L., Nelumbo nucifera Gaertn., etc., are the dominant species of emergent plants, while Potamogeton wrightii Morong and Hydrilla verticillate (Linn. f.) Royle are the dominant species among submerged plants [3]. These aquatic species are also the basis for improving water transparency and enhancing the water’s self-purification ability [16]. Cynodon dactylon (L.) Persoon, Tamarix chinensis Lour, Lagerstroemia indica L., and other vegetation species also play a certain role in protecting the river slopes and berms in the FDZ of Hongze Lake [17]. Similarly, ecological landscape construction is also an indispensable part of ecological diversity. By discussing the adaptability change and the expansion/contraction of the distribution area of these 20 typical vegetation species, the potential risk and ideal distribution of each species in the future can be assessed. Understanding the distribution pattern and adaptability of typical vegetation under future climate fluctuations is of great theoretical and practical significance for the conservation of introduced species and the sustainable development of vegetation diversity, water bodies and the ecological health of the study area.

2. Materials and Methods

2.1. Study Area

Located downstream of Huaihe River in the west of Jiangsu Province, Hongze Lake is the fourth largest freshwater lake in China. The FDZ of this lake is a typical example of FDZs, and it has significance for the ecosystem of Huaihe River and even Jiangsu Province [18]. Hongze Lake is located in the transition zone of the subtropical monsoon climate to the temperate monsoon climate, with four distinct seasons and abundant annual precipitation. The average annual precipitation in the lake area is 925.5 mm. Annual precipitation shows an uneven distribution, generally concentrated in the flood season, which accounts for 65.5% of the annual total [19]. Wetlands are widely distributed in the region, and they belong to water-passing lakes, with the function of upstream flood discharge. Accordingly, a large area of FDZ has formed around Hongze Lake, resulting in the phenomenon of perennial flooding, which has a significant impact on the ecological balance and species diversity in the region. Furthermore, owing to its unique geographical location, the climate in Hongze Lake and its surrounding FDZs exhibit a wide spatial variation.

2.2. Field Investigation and Collection of Occurrence Data of Species

In this study, 20 species of typical vegetation in Hongze Lake area were identified, as shown in Table 1 below. According to the obtained occurrence records, lines with missing values were deleted, and occurrence points with straight-line distances of less than 1 km (size of the raster of the climatic layer) were filtered in order to reduce the bias caused by the overlap of the data (ibid., Table 1). When using the SDM platform to analyze potential suitable habitats of species, hypothetical occurrence points of species are required to improve the prediction accuracy. However, these data are usually difficult to obtain. Therefore, 1000 hypothetical missing data points were randomly generated for each species using the default method of the model. As the study area is flat, changes in soil and topography in the next 20 years were assumed to be negligible.

2.3. Environmental Variables

In general, climatic factors strongly affect the distribution of the 20 species. For the present and future, 19 bioclimatic variables were obtained from the Earth’s surface high-resolution climate data network (www.worldclim.org, accessed on 25 March 2023) (Table 2), with a spatial resolution of 2.5 arc minutes. For the future, the latest medium-resolution climate system model BCC-CSM2-MR [20] developed by National Climate Centre of China (NCC) was selected from the global climate model of the Coupled Model International Comparison Project, Phase 6 (CMIP6) [21], which has a higher capability for simulating climate variability in China. Four climate scenarios, SSP1-2.6 (low social vulnerability, low radiative forcing background), SSP2-4.5 (medium social vulnerability, medium radiative forcing background), SSP3-7.0 (high social vulnerability, relatively high radiative forcing background), and SSP5-8.5 (high anthropogenic radiative forcing background), were selected for the period 2021–2024 (2030s).
However, there may be collinearity among environmental variables, which may exaggerate the importance of highly correlated variables and lead to overfitting of the model. The multicollinearity between variables was assessed using the variance inflation factor (VIF). The first step is to find bioclimatic variables with the largest linear correlation, and to exclude environmental factors with correlation coefficients greater than 0.7 [22]. Bioclimatic variables with the highest explanatory rates are then selected for use in predictive modeling of the distribution of each vegetation species [23].

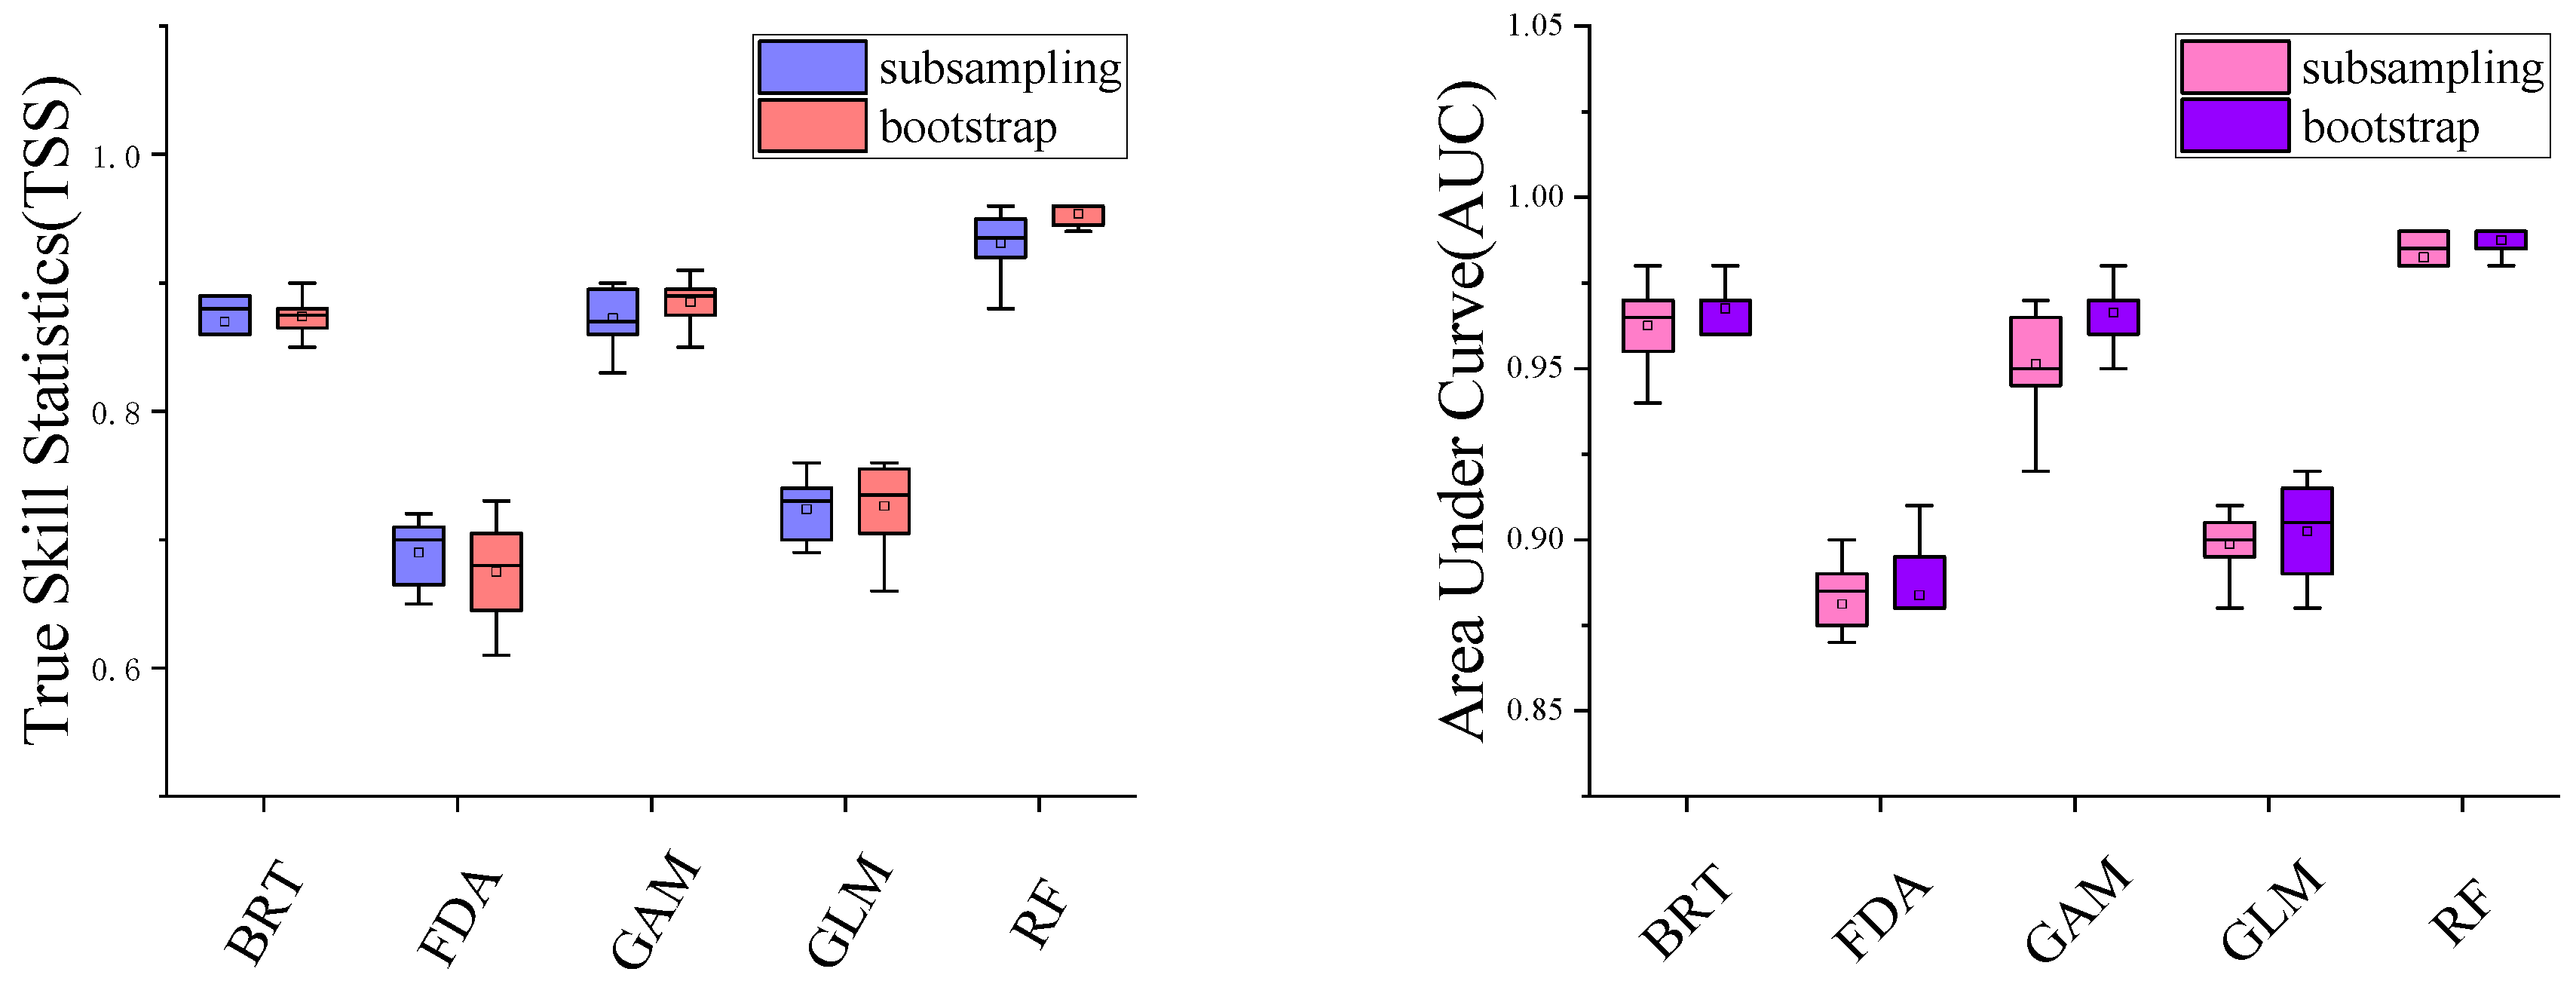
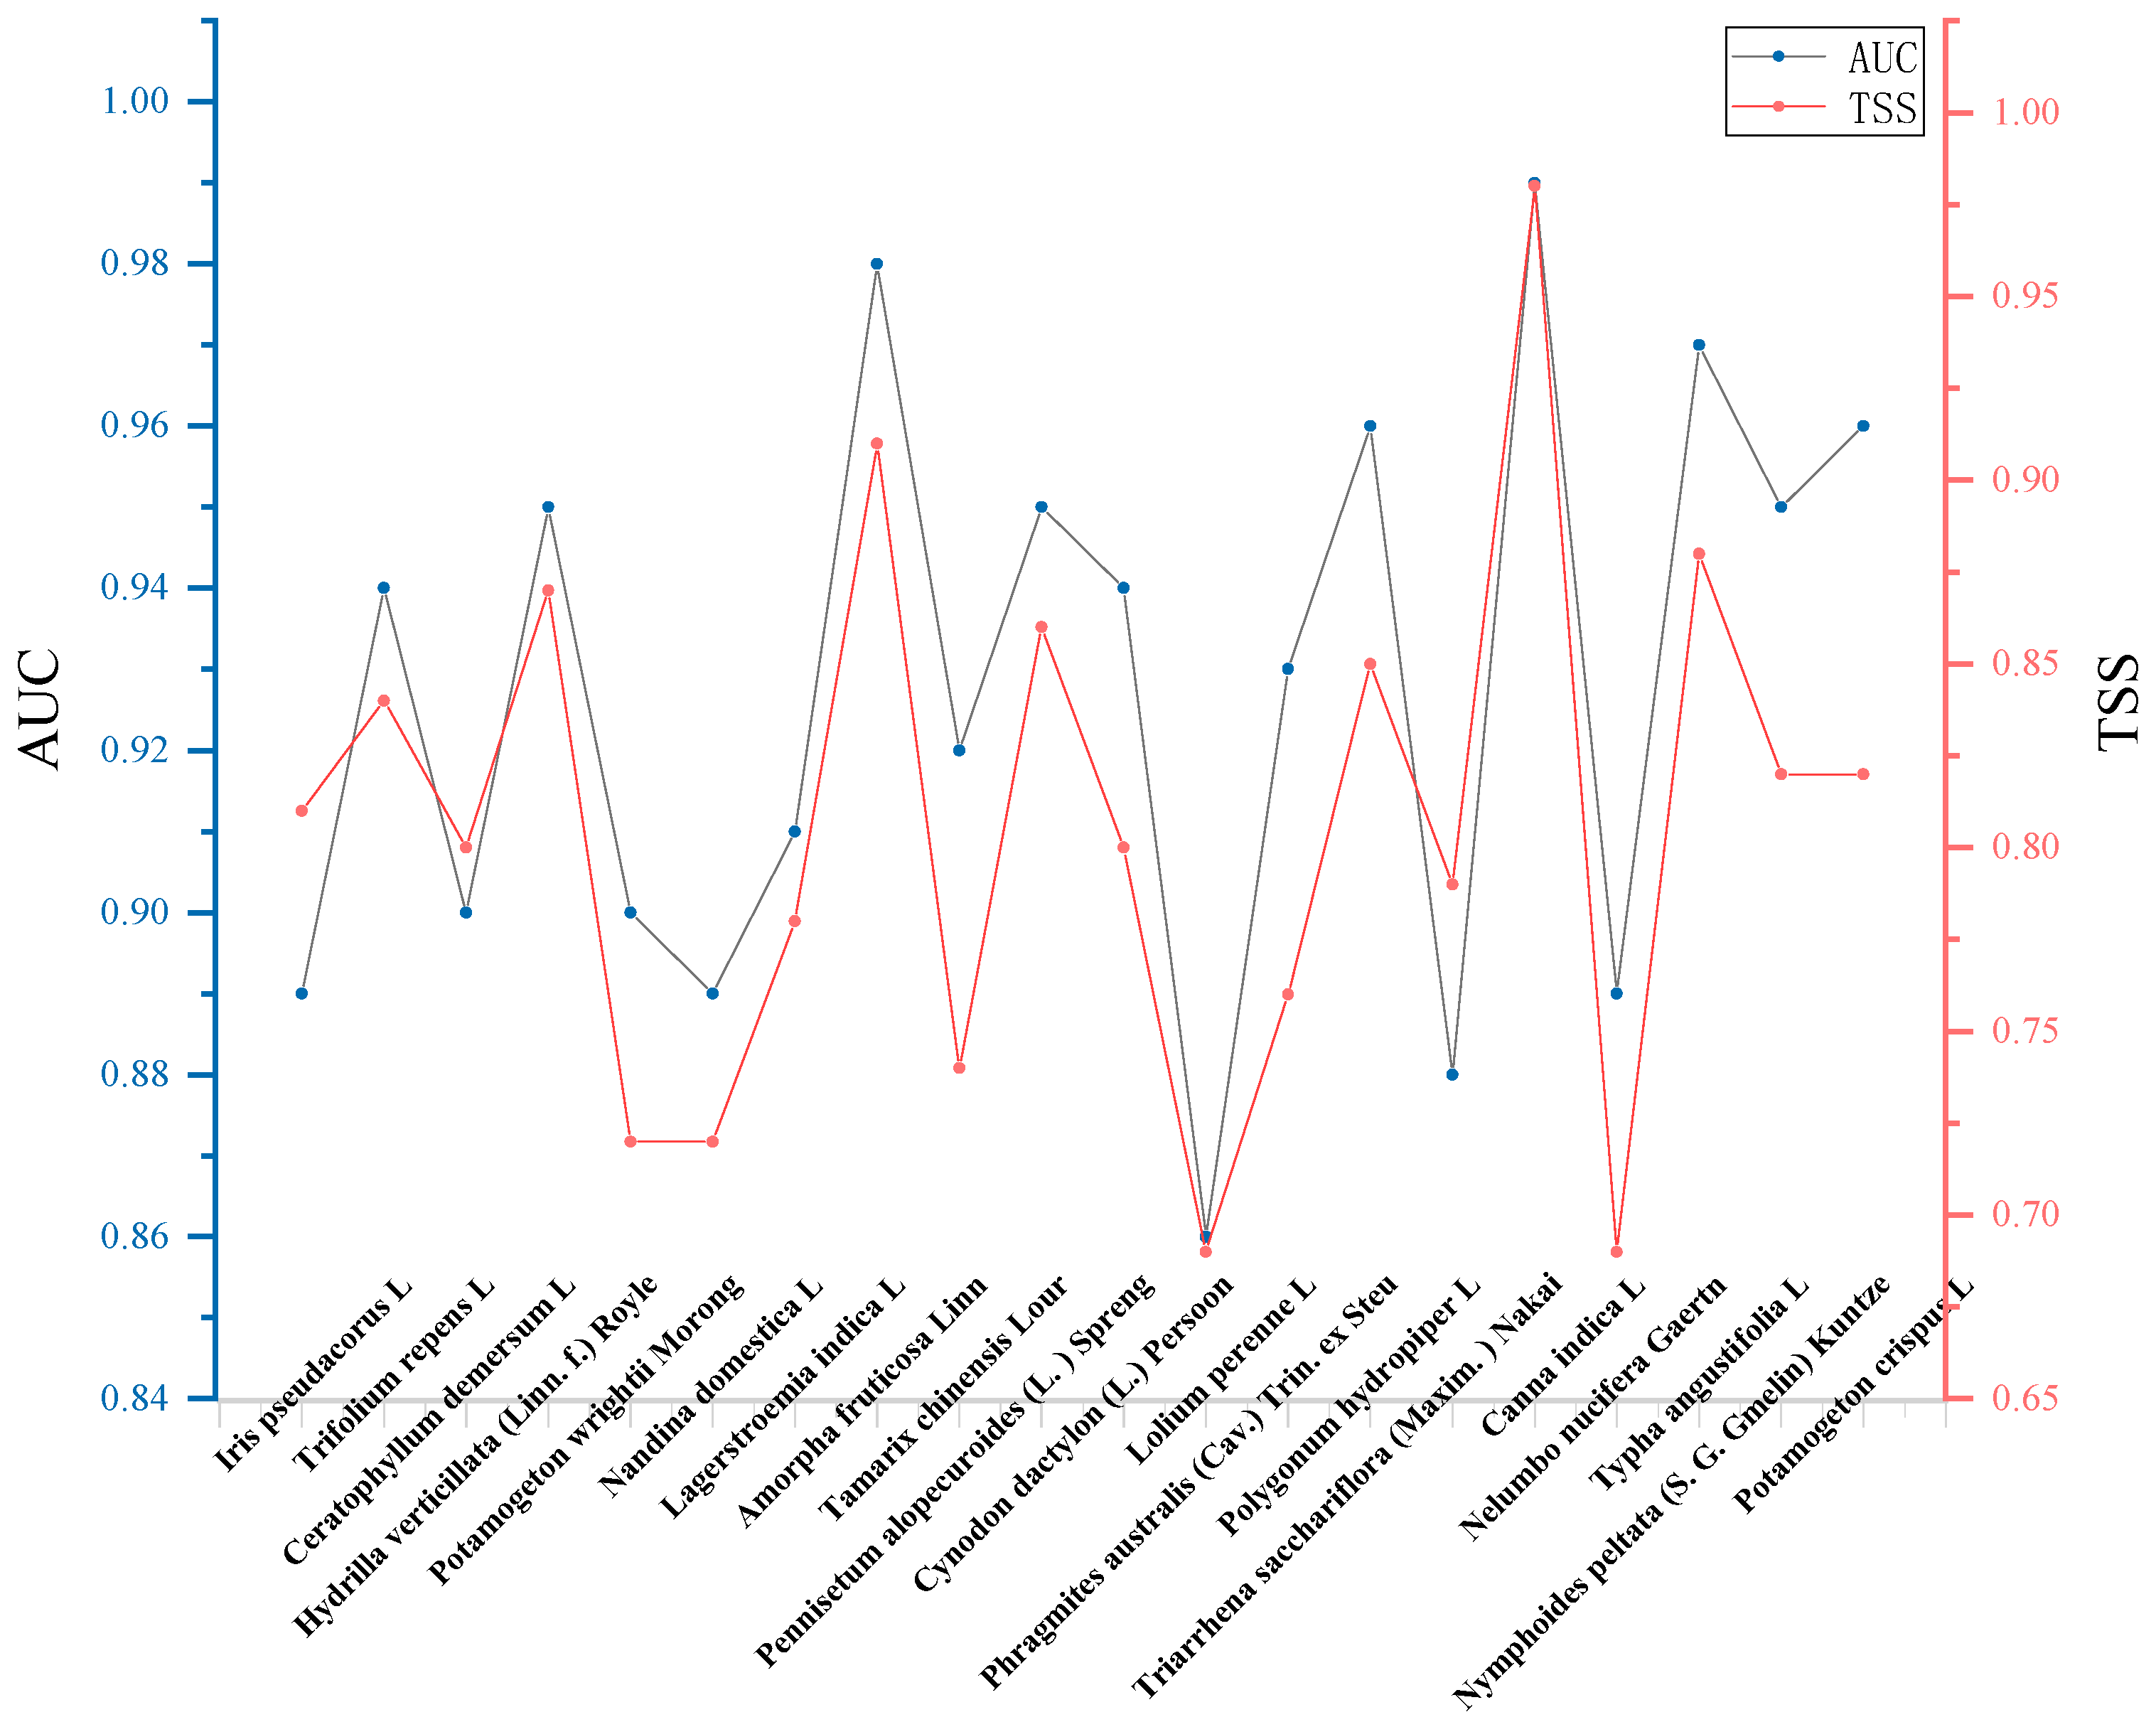
2.4. Model Simulation and Model Evaluation

In this study, the integrated model was constructed using five model algorithms, namely, RF, GLM, BRT, FDA and GAM. The RF algorithm has the advantages of learning ability, robustness and feasibility of logging regression modeling, but its main disadvantage is that the effects of its hyperparameters are extremely unclear and may lead to over-fitting [24]. GLM is a generalization of the classical linear model. As a traditional model, it is a development of the linear model for studying the non-normal distribution of response values and the succinct and straightforward linear transformations of non-linear models [25]. BRT is a statistical model of machine learning, and it has been widely used in ecological and environmental research [26,27,28,29]. Compared with statistical methods, this model is advantageous in that it can capture nonlinear relationships by combining the regression tree algorithm, which can use recursive binary splitting to eliminate the interaction between prediction variables, and use boosting to build a large-scale integrated tree into a small-scale regression tree to express the nonlinear relationship [30,31]. In addition, it has strong learning ability and flexibility for complex data and does not require the interaction or correlation of independent variables to be considered [31]. It can also capture the importance and marginal effect of independent variables [31,32], where significance quantifies the contribution of each independent variable and marginal effects indicate that the potential impact of an independent variable varies with its size [19,31]. FDA is a discriminant method for performing LDA (linear discriminant analysis) on derived responses [33,34]. These responses are obtained by assigning scores to classes, such that the transformed class labels are best predicted by regression on X. GAM is a powerful regression tool for modeling nonlinear regression effects by fitting nonparametric and parametric functions to observation data. This model has been extensively studied [34] and implemented in tools such as GLMNET [35]. The abovementioned models are desirable because of their ability to model data non-linearities almost automatically, and they have been effectively used in various applications, such as biometrics [36,37]. However, each individual algorithm has its own differences. To construct an optimal integrated model for each species, the five algorithms were integrated through the species distribution prediction platform, and the applicability of different models to the 20 typical species was evaluated.
Partitioned sampling of the data was tested using sub-sampling and bootstrap to generate replicates of each method in order to reduce uncertainty in the simulation process. Specifically, 75% of the incurred data was randomly selected for model training, and the other 25% was used as test data (dep.test) for testing model outcomes. In total, 8 k-fold tests were run, and 80 single model run results were generated for each typical vegetation.
In order to evaluate the accuracy and authenticity of the prediction, the model results were tested against two assessment metrics, namely the area under ROC curve (AUC) and the real skill curve (TSS). We often use the AUC value as the evaluation criterion for models because often the ROC under curve cannot clearly indicate which classifier performs better, and as a numerical value, the classifier with a larger AUC corresponds to better performance, and TSS based on sensitivity and specificity calculated from the presence and absence records are frequently used metrics for model performance. By combining these two indicators, the over-dependence of the model can be effectively avoided [38,39]. An AUC value higher than 0.9 indicates superior model performance, whereas a value lower than 0.5 indicates inferior to random performance [40]. TSS is defined as the sum of sensitivity and specificity minus 1, and the range is [0, 1]. As TSS is a threshold-related index used for binary prediction data, the prediction of the model is continuously converted into binary prediction by setting the threshold through the maxTSS method. Specifically, TSS = 0.55–0.7 indicates average prediction results, TSS = 0.7–0.85 indicates good prediction results, and TSS > 0.85 indicates highly accurate results, implying that the model can accurately reflect the potential distribution of species [41].
In this study, the single model AUC values of each typical vegetation species were mostly stable at 0.9 and above, while the TSS value was mostly stable at 0.75 or above, which met the criteria for screening the individual model results to construct a combined model and outputting the result projections in ASCII format. The values of species occurrence probability for each grid cell (0.1′ × 2.5′) were used to classify the modeled potential distribution area into four classes based on the probability of occurrence: low adaptability (0–0.2), medium adaptability (0.2–0.4), high adaptability (0.4–0.6), and optimum adaptability (>0.6).

2.5. Potential Distribution under Current Climate Conditions

Model Accuracy

The simulation revealed that the AUC and TSS values of each typical vegetation single model were higher under both the sub-sampling statistical method and the bootstrap statistical method, with the AUC and TSS values being above 0.85 and 0.75, respectively, in both methods. Due to the large amount of image data for 20 types of vegetation under 5 single algorithms, Trifolium repens L. was taken as an example. (Figure 2).
It is noteworthy that the AUC and TSS values of the ensemble model of 20 typical vegetation species were higher than 0.9 and 0.7, implying higher accuracy over individual models. Therefore, the species distribution predicted by the combined model can reduce the uncertainty associated with the individual models themselves and improve the accuracy and stability of the model to some extent (Figure 3).

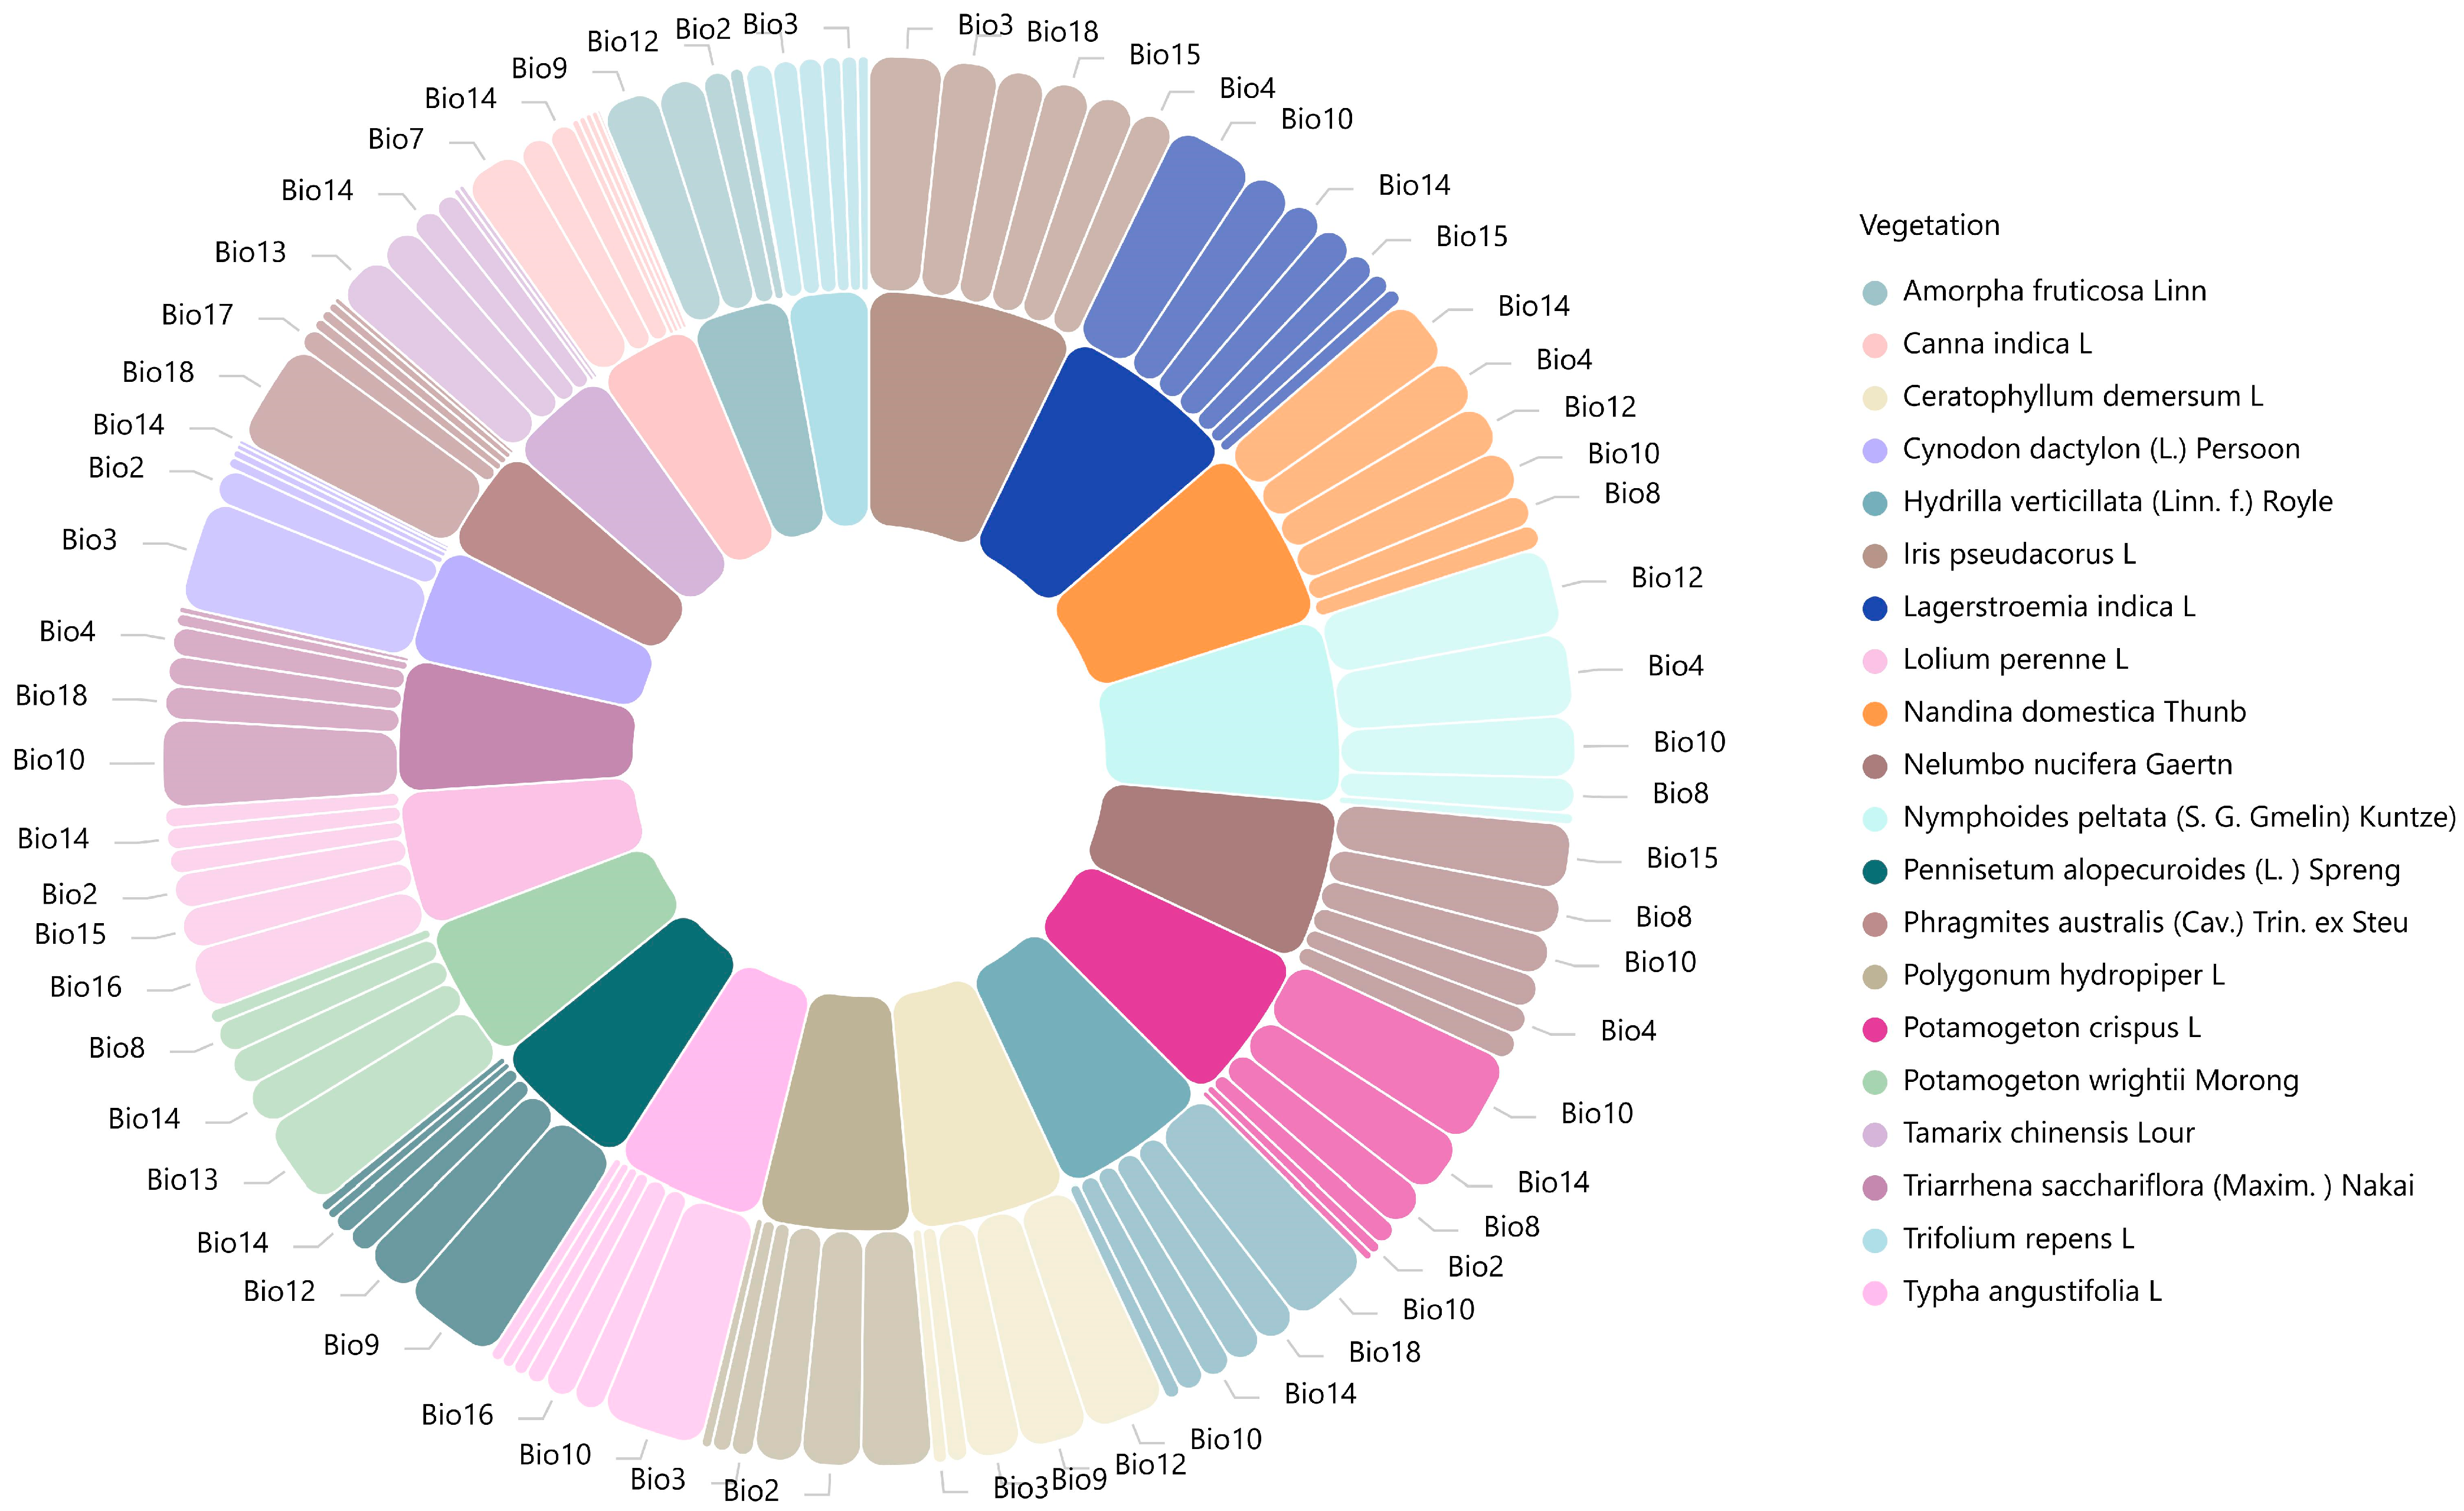
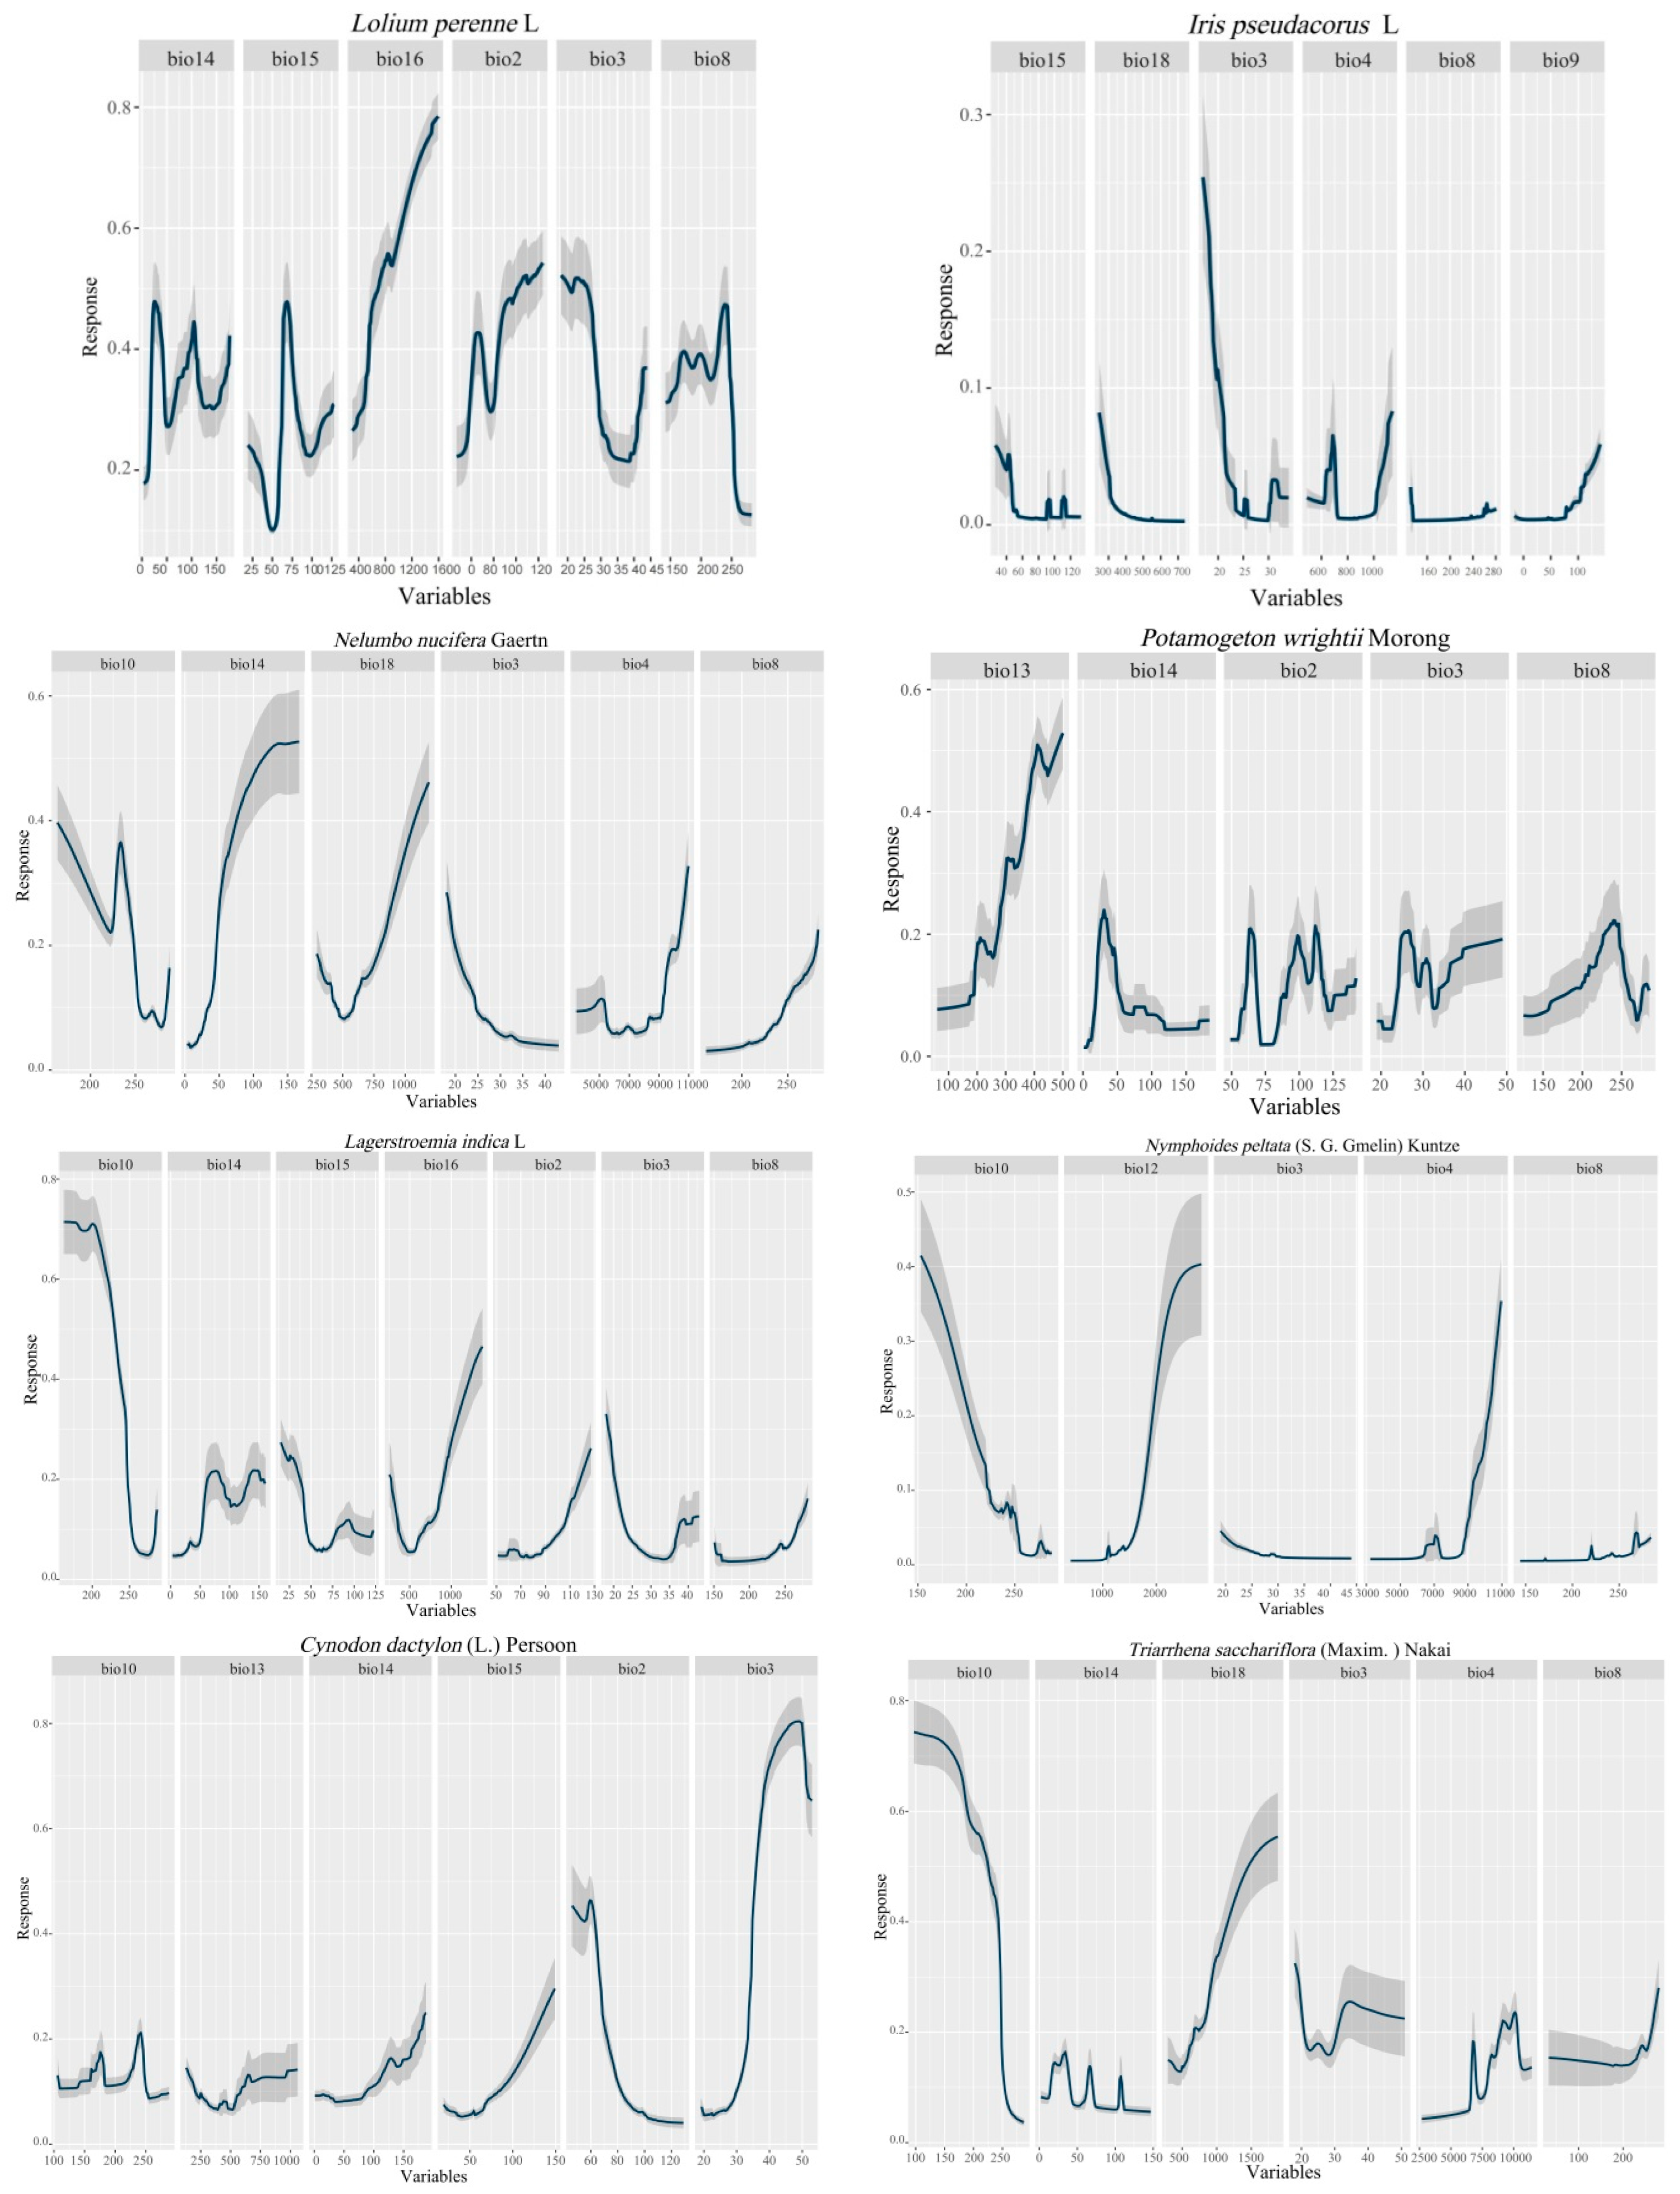
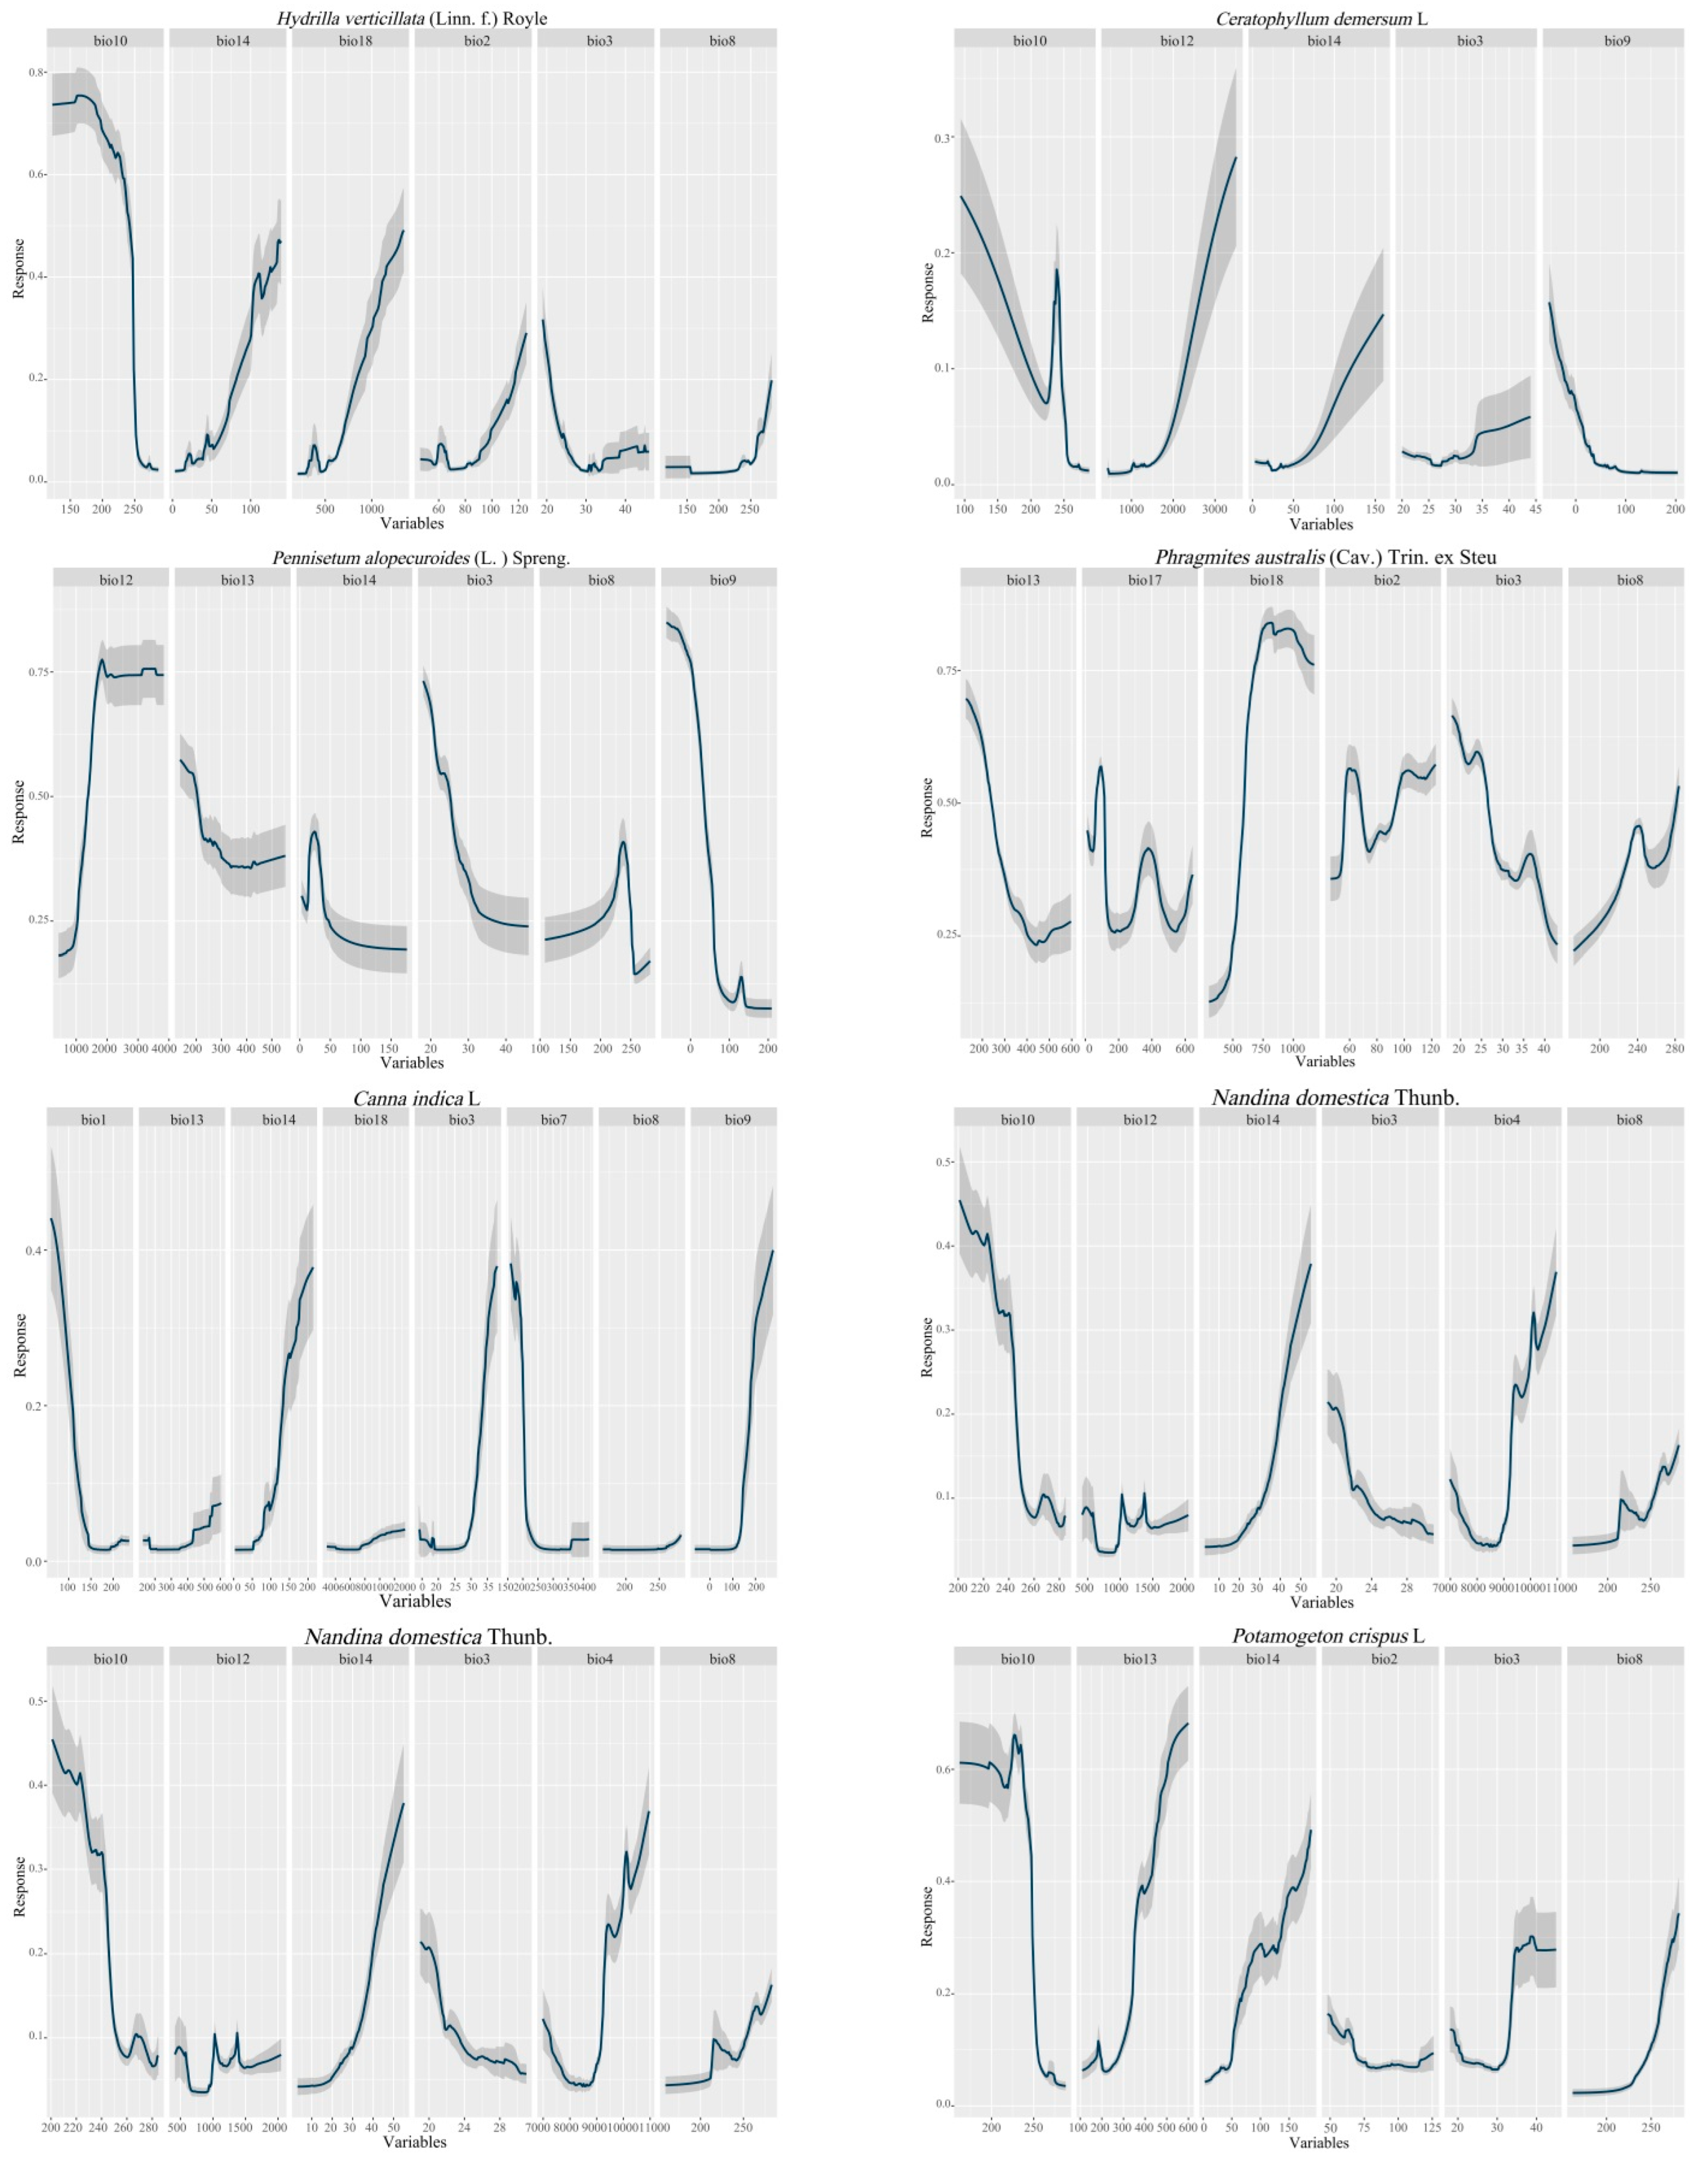
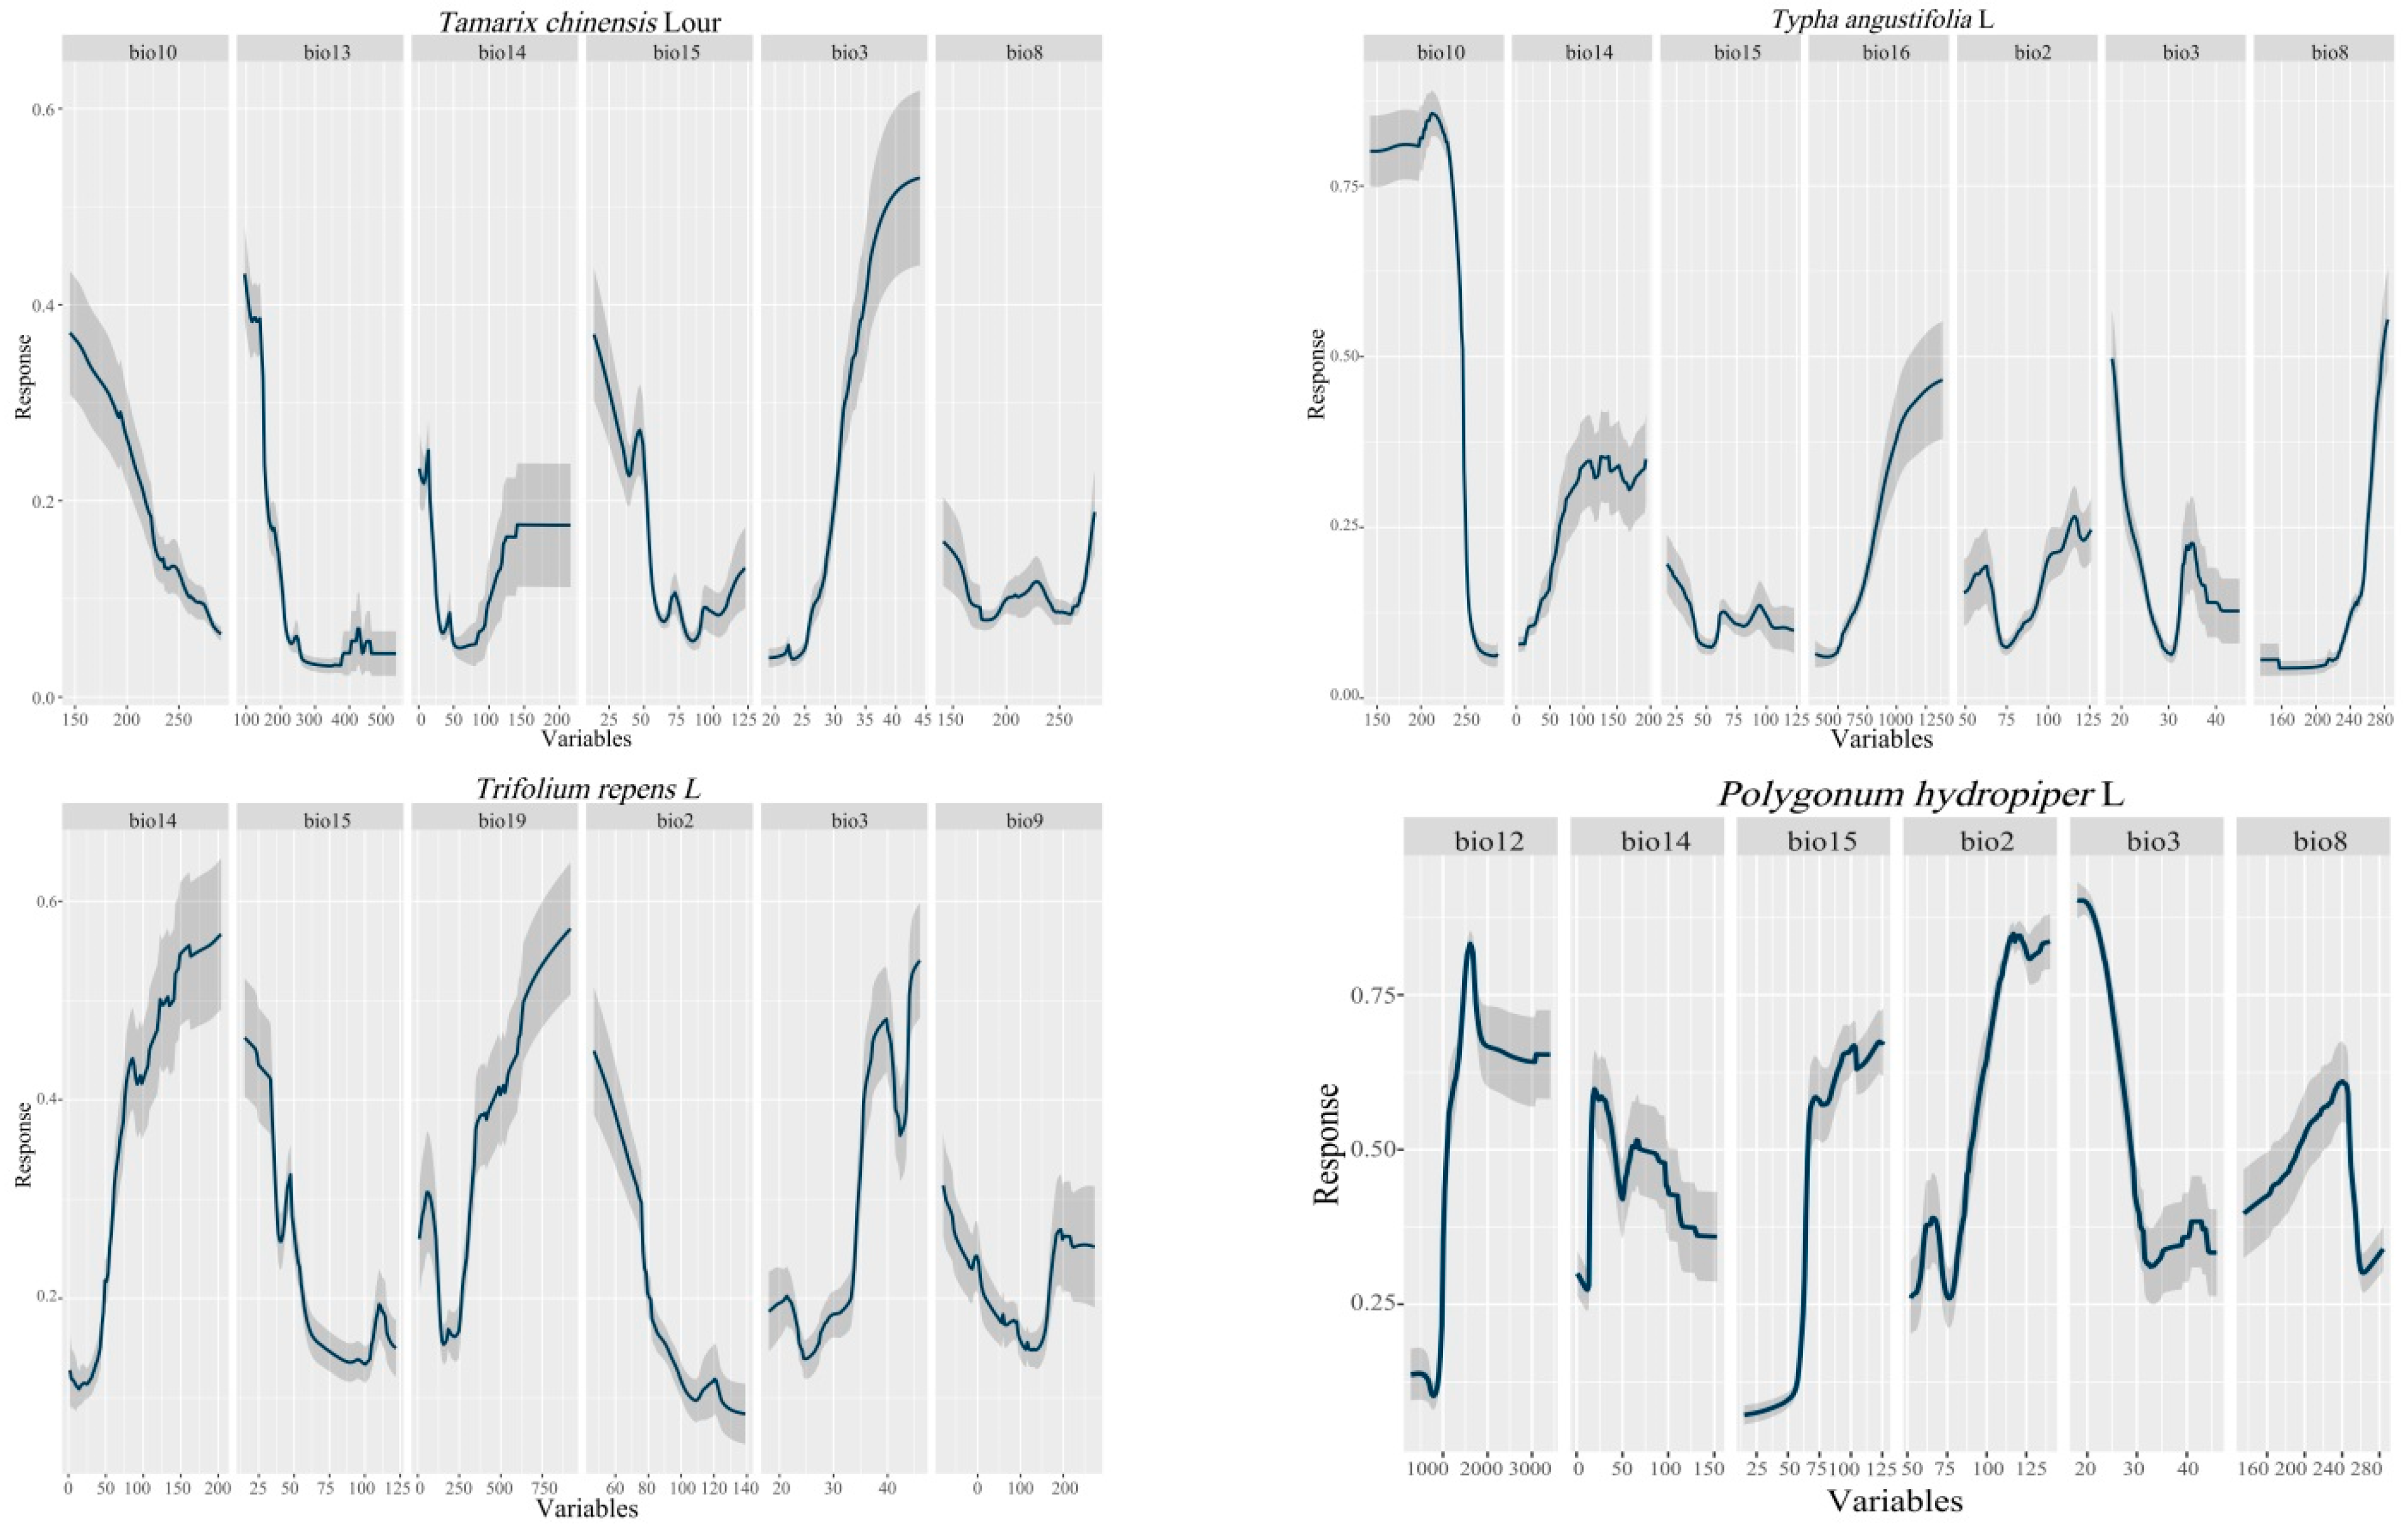
2.6. Environmental Variable Weight and Response Curve

The most explanatory bioclimatic factors for each vegetation species were screened for modeling by multiple covariance of the climate influencing factors of 20 typical vegetation species with regularized training gain, the results of which are shown in Table 3 as well as Figure 4. Isothermality (Bio3) appeared as an influential factor for all tested species, except for five typical vegetation species, namely Canna indica L., Amorpha fruticose Linn, Tamarix chinensis Lour, Trifolium repens and Lolium perenne L. The top two largest contributing variables and ranked importance of each species cumulatively accounted for more than 75% of the total contribution, and the average temperature of the wettest season (Bio8) and precipitation in the driest month (Bio14) were also important for the growth of most of the species as well as for the dispersal of the community.
According to the environmental variable response curves (Figure 5), signified by the variable confidence ranges of 20 typical vegetation species showing the response curves for Bio3, adaptability showed a negative correlation with isothermality for 13 vegetation species, namely Triarrhena sacchariflora (Maxim.) Nakai, Hydrilla verticillate, Pennisetum alopecuroides, Phragmites australis, Nandina domestica L., Typha angustifolia L., Amorpha fruticosa, Lolium perenne, Iris pseudacorus, Nelumbo nucifera Gaertn, Polygonum hydropiper L., Nymphoides peltate (S. G. Gmelin) Kuntze, and Largerstroemia indica. Evidently, these vegetation species could not withstand the situation of a high ratio of average intra-day temperature to average annual temperature to some extent. In contrast, Tamarix chinensis, Cynodon dactylon and Trifolium repens. Showed better responses to Bio3 and showed higher adaptability to strong isothermal conditions. Regarding the response to Bio8, most species showed positive feedback, except for Ceratophyllum demersum L., Polygonum hydropiper and Potamogeton wrightii, which showed lower adaptability during the wettest season with the mean temperature being higher than 25 °C. At the same time, Bio10 showed a negative response to isothermality. Bio10 also plays an important role for the studied submerged plants such as shrubs and trees. In addition, the rainfall variable Bio14 is also very important for many species; in the driest season, Pennisetum alopecuroides, Lagerstroemia indica and Polygonum hydropiper, showed the strongest responses to rainfall of approximately 30 mm, 70 mm, and 40 mm, respectively. The growth of the remaining species was proportional to rainfall within the highest threshold.

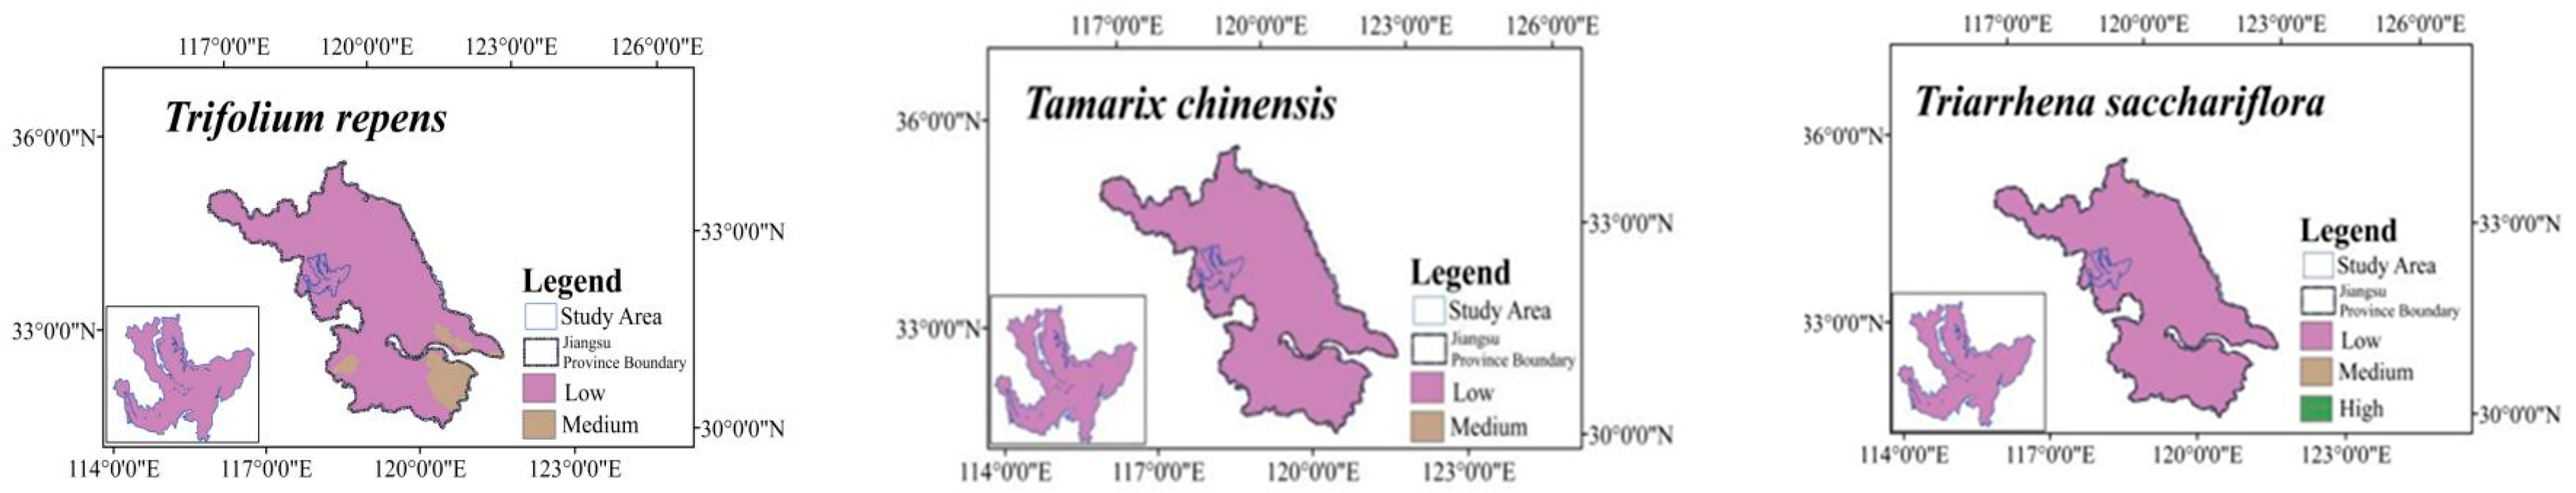
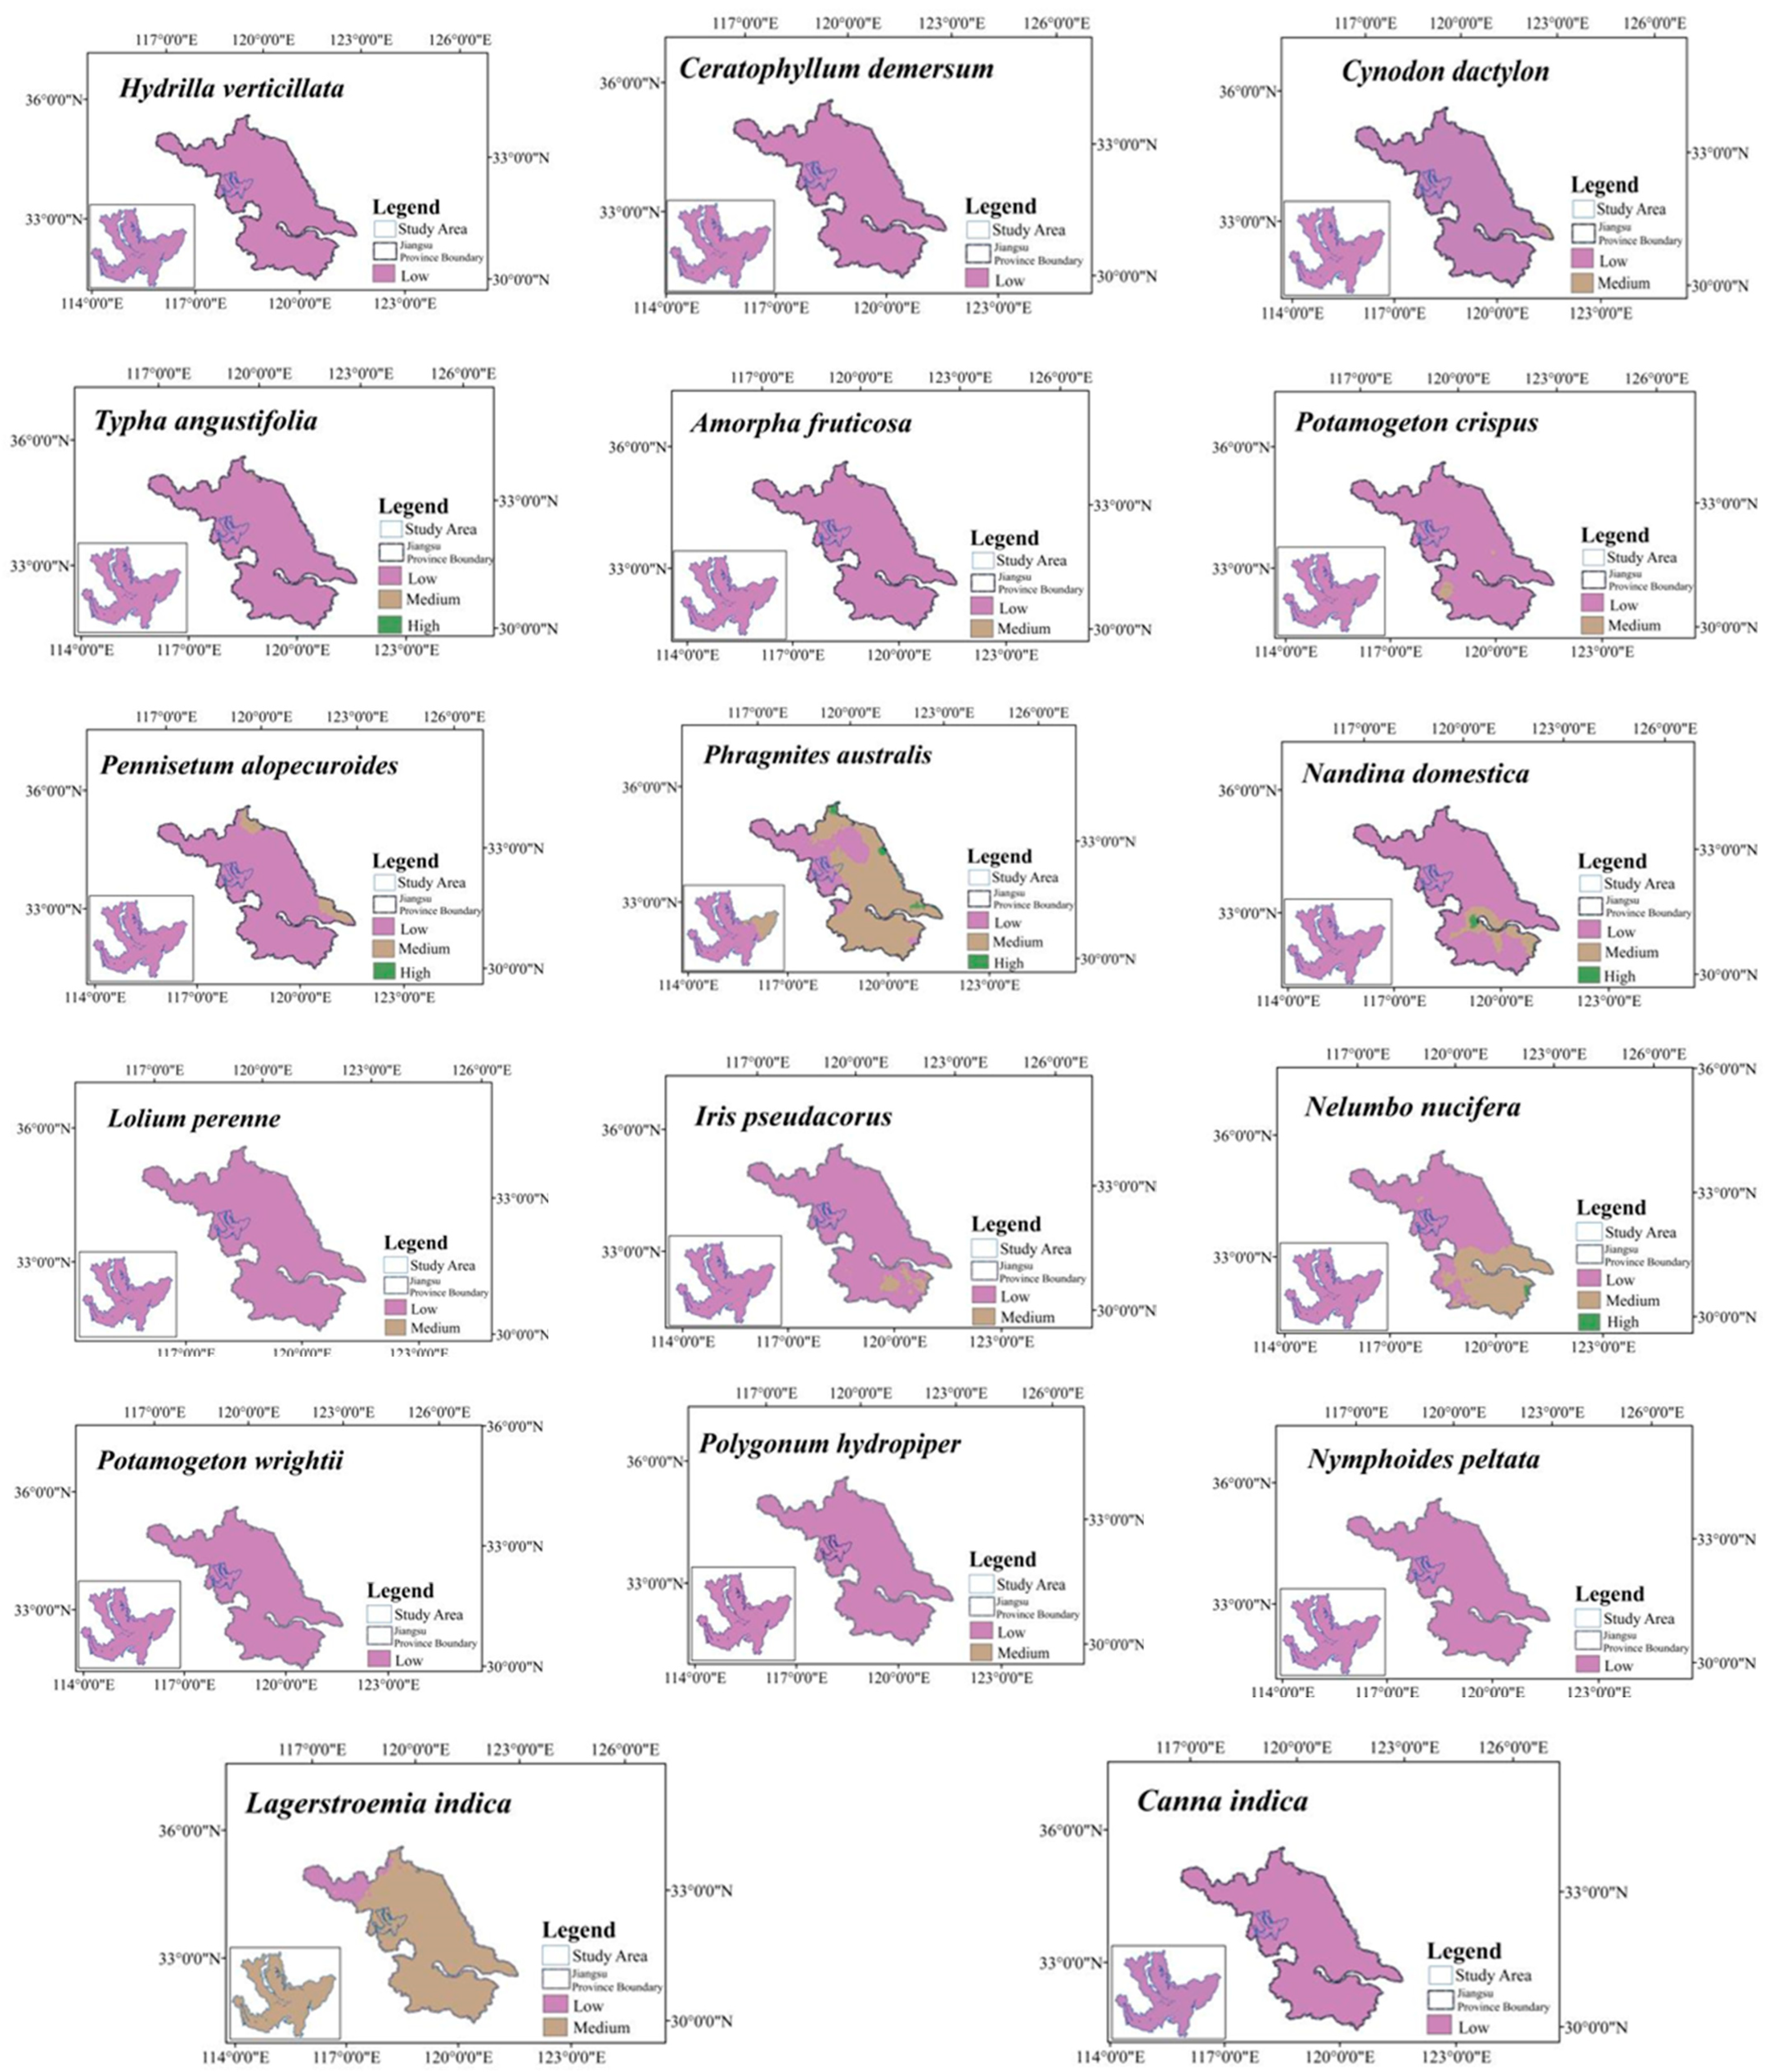
2.7. Typical Vegetation Adaptability Patterns under Current Climatic Conditions

Using the simulation results and spatial geographic analysis, the distribution area of each typical vegetation was divided into four classes according to the probability value of occurrence of the species: low, medium, high, and highest. Figure 6 shows the suitable habitat zoning of the 20 typical plant species in the Hongze Lake FDZ under the current climate conditions. For each species, the predicted suitable habitat was usually larger than the actual distribution range. Most of these species showed predominantly low adaptability for survival in the study area. Phragmites australis showed low adaptability over a large area in the western part of the study area, and its adaptability gradually increased as it spread outwards from the western part, extending into a wide area of medium adaptability. Compared with other typical vegetation, Lagertroemia indica showed medium adaptability for survival throughout the study area, and it has a wider and more continuous habitat within the study area, as it is more tolerant to all types of soil, prefers warm and humid climates, and favors soil habitats. These findings are more in line with the current four-seasonal climate characteristics of the study area.

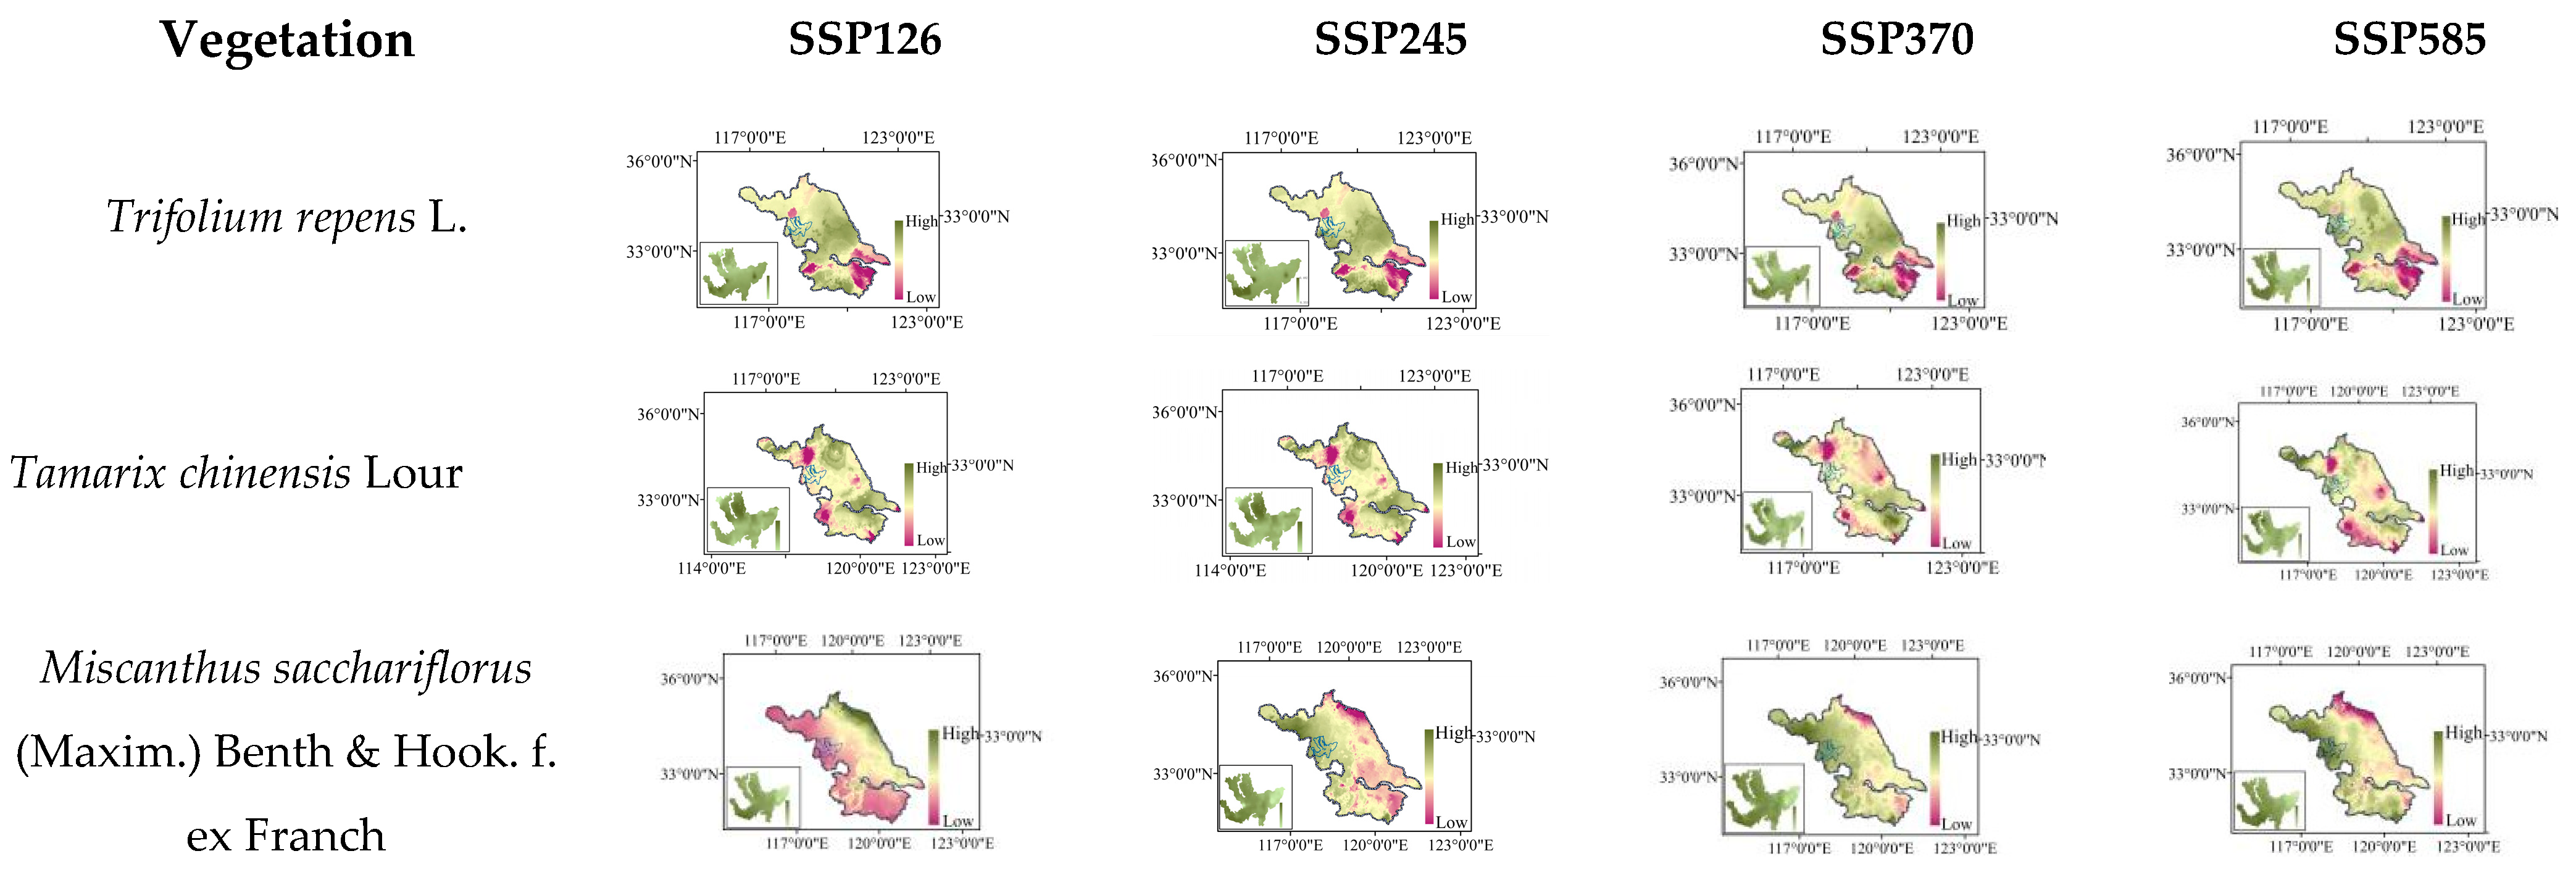
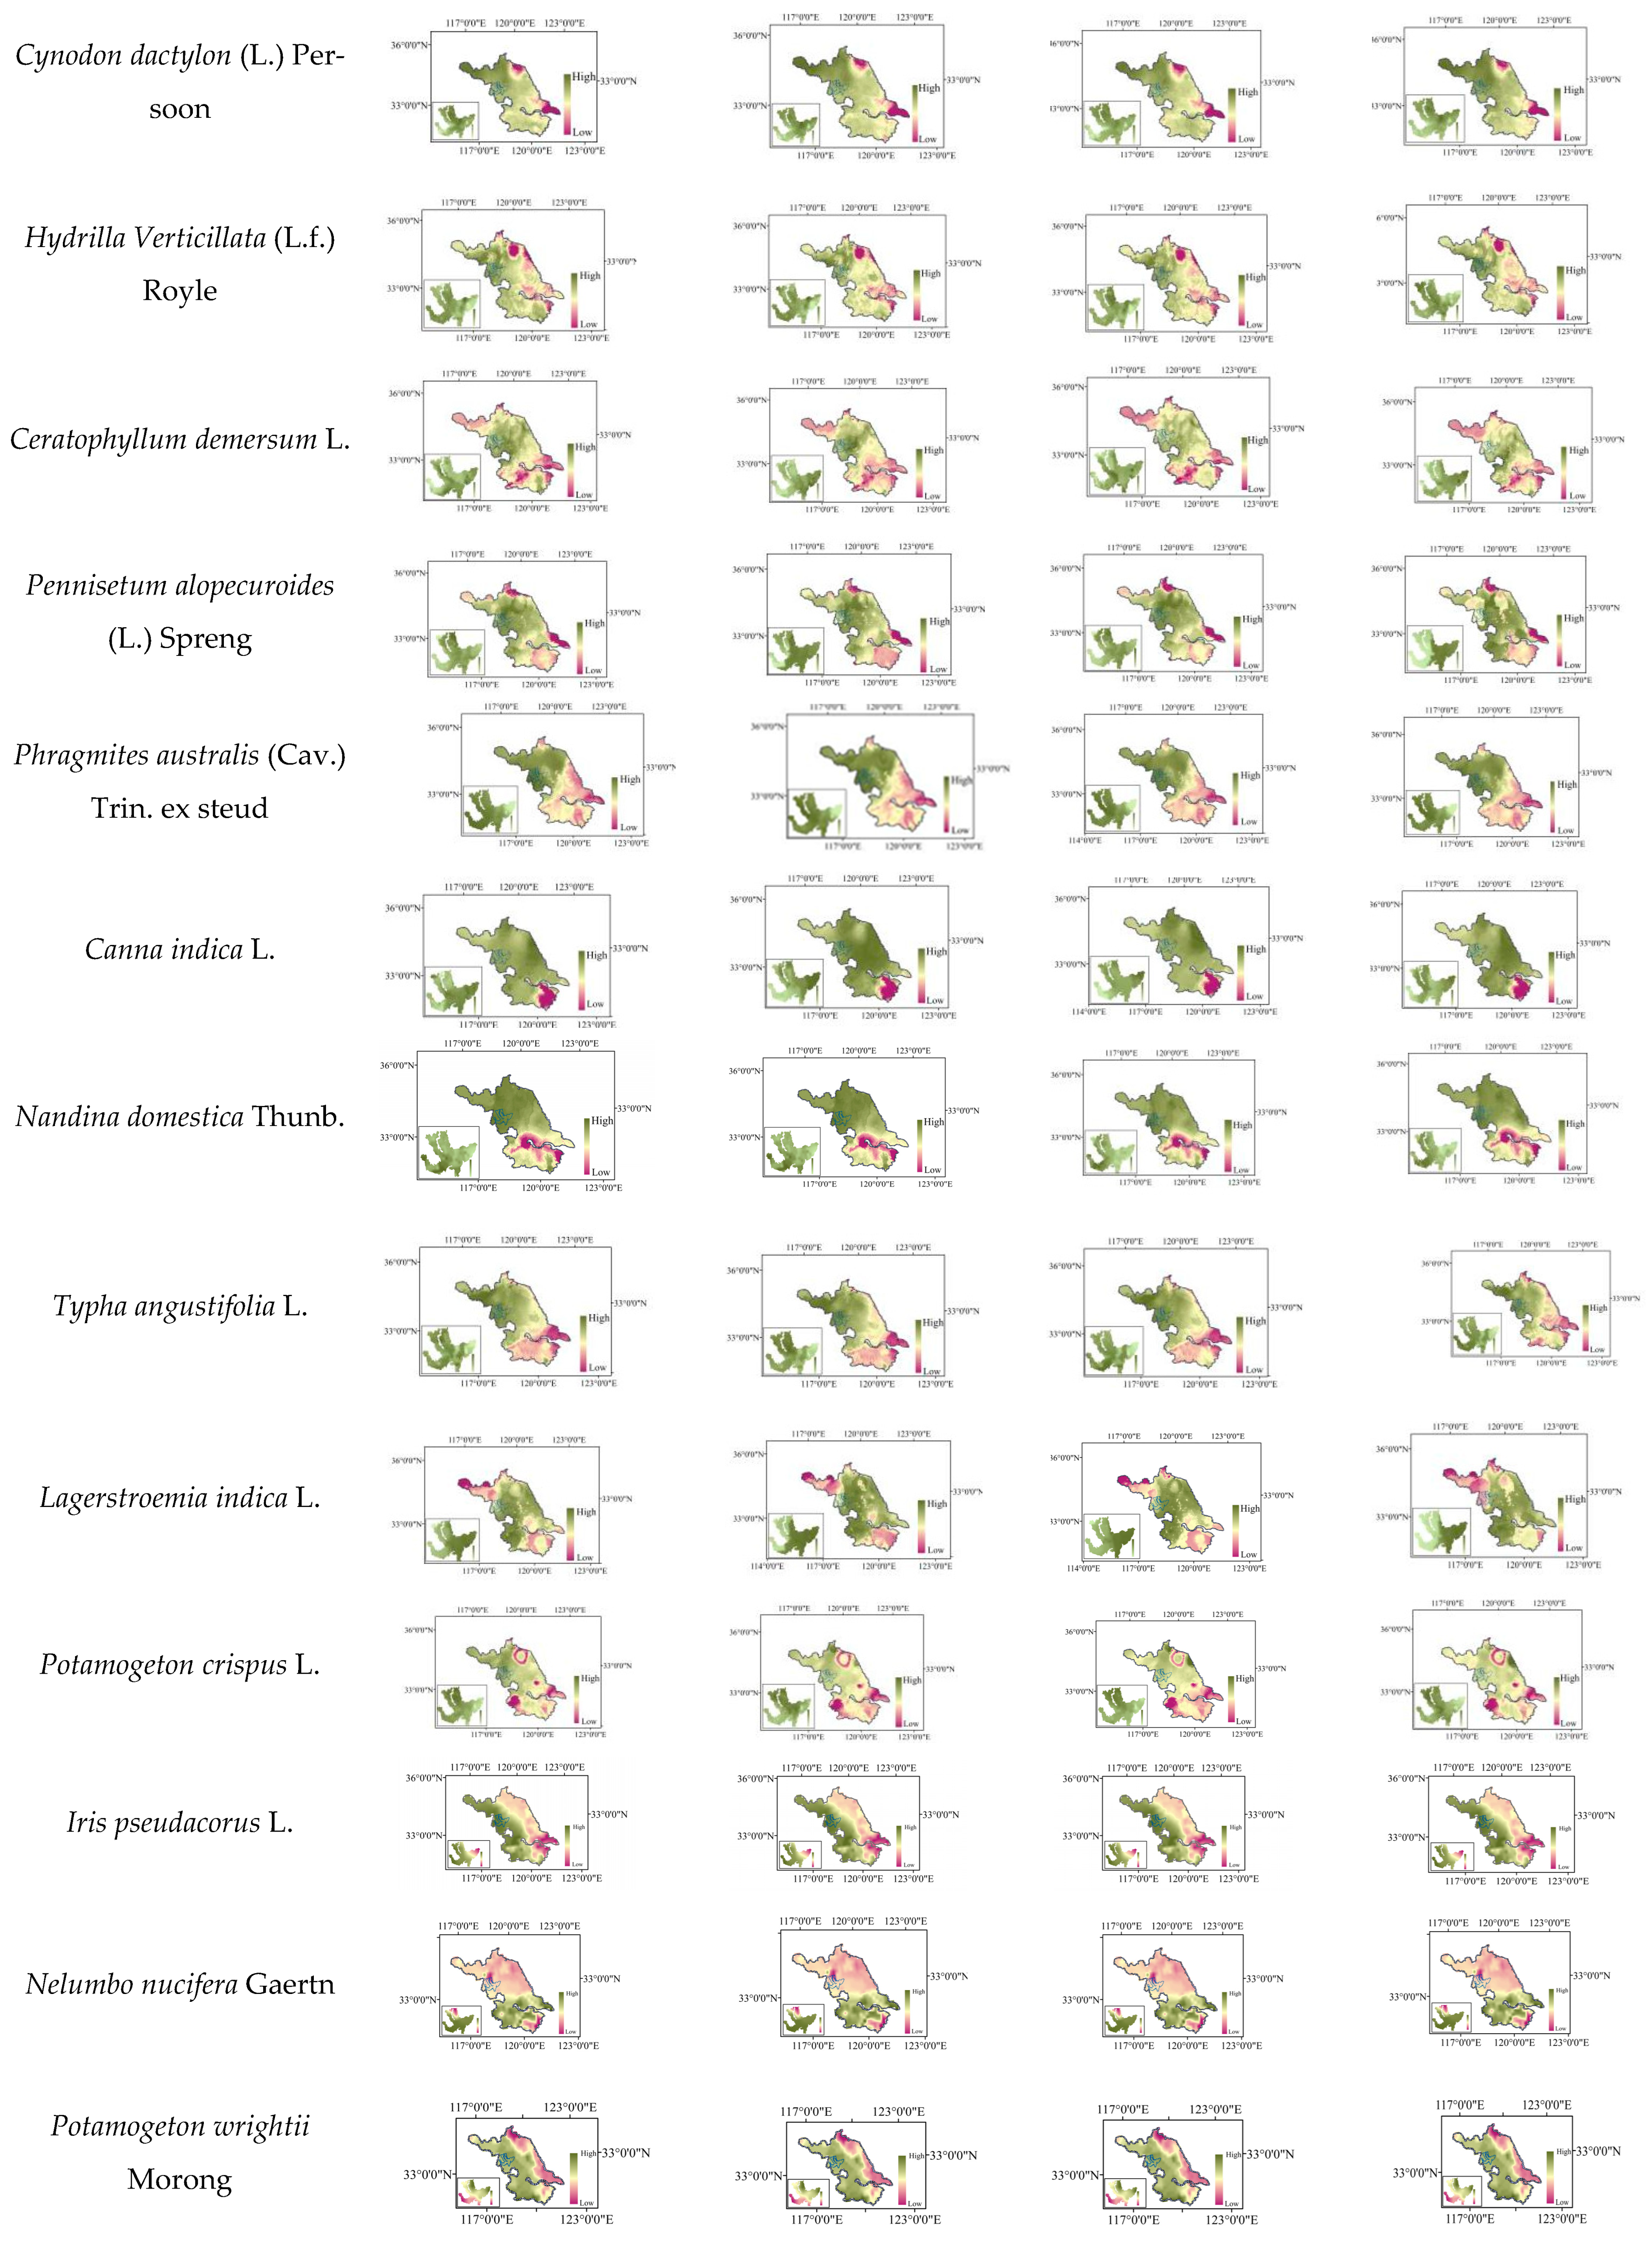
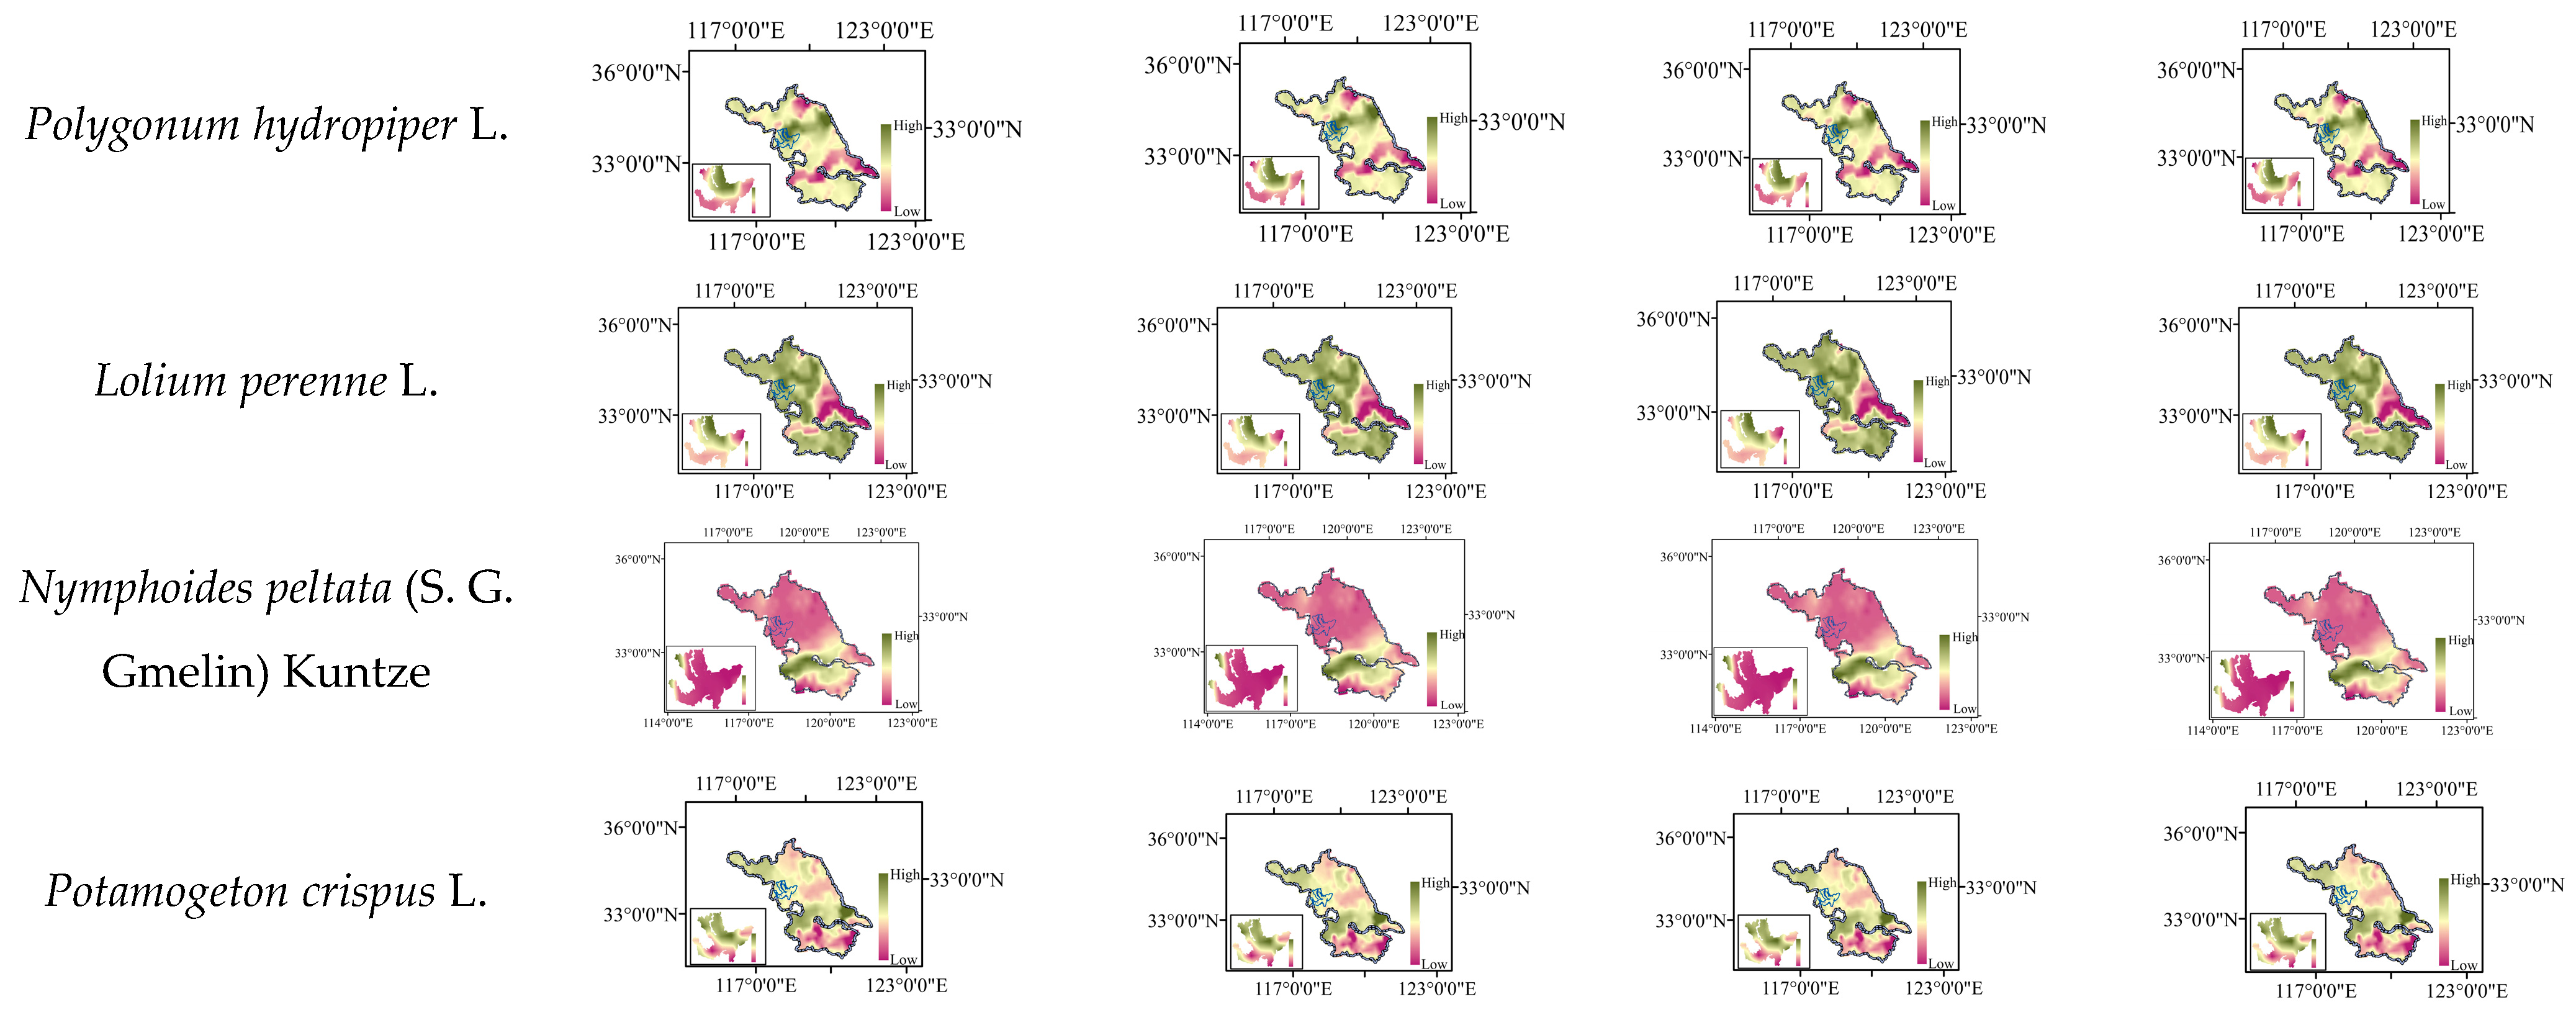
2.8. Distribution Changes under Future Climate Scenarios

The projected changes in suitable habitat under the four different climate scenarios and area migration in the 2040s are shown in Figure 7, Table 4 and Table 5. According to Figure 7, the adaptability changes in different vegetation species under the four climate scenarios are the same, and the color block interval also reflects their adaptability changes. And according to the results of the integrated model in SDM, with reference to the current climatic scenario, the western part of the study area will have more suitable climatic conditions for the survival of vegetation, while the eastern wetland will have poorer climatic conditions. Under SSP126, SSP245, SSP370, and SSP585, the area of suitable climate will decrease by 26.58 km2, 23.64 km2, 28.84 km2, and 22.93 km2, respectively. Although the adaptability of plants in the entire region will remain low under the four scenarios, it will slightly increase in most parts of the central and western regions. The adaptability of Ceratophyllum demersum will improve throughout the study area, with larger increases in low-altitude areas in the southeast and middle of the study area, and no prominent increase in other relatively high-altitude areas. The adaptability of six plant species will slightly improve but it will remain low in the study area. The adaptability of Phragmites australis in the study area will also increase, with the original low-suitability area transforming into a medium-suitability area. Therefore, the future climate will promote reed growth. In particular, six typical vegetation types will exhibit a large growth in adaptability: Amorpha fruticose, Tamarix chinensis, Trifolium repens, Cynodon dactylon, Lolium perenne and Canna indica. The adaptability of Amorpha fruticose, will increase by more than 50%, and a large part of wetlands in the middle and east of the study area will be extended to the most suitable area, while a small part of FDZ in the west will also be extended to a highly suitable area; the distribution area is shown in Table 5 (the same for other species). The adaptability of canna will increase by more than 70%, with the whole area transforming into the most suitable area. Therefore, the future climate will promote the growth of canna. Furthermore, low-suitability areas of Tamarix chinensis, Trifolium repens, Cynodon dactylon and Lolium perenne will transform to high-suitability areas. The adaptability of Potamogeton crispus and Polygonum hydropiper will increase by 20–30%, and the entire area will change from a low-suitability area to a medium-suitability area. Among these 20 typical species, only Nelumbo nucifera will experience an overall decline in adaptability under the four climate scenarios, with the most obvious decline at the periphery of the study area, a small decline in the middle, and the whole area transforming into a low-adaptability area. The changes in the adaptability of these 20 typical species under the four different climate scenarios are generally consistent. Except for Pennisetum alopecuroides, the changes in adaptability are consistent under the SSP126 and SSP370 scenarios. The adaptability expansion of the FDZ on the east and west sides of the study area is approximately 10%, and vertically, the adaptability in the middle part of the study area increases to approximately 18%. The pattern of adaptability change under SSP245 and SSP585 differs from that under the first two scenarios. The vertical growth in adaptability in the middle and eastern FDZ remains relatively fast, reaching approximately 17%, but in the northwest, the growth is maintained at approximately 4%.
Through spatial geographic analysis, the areas of suitable zones for these 20 species under the four different climate scenarios were calculated (Table 5). The entire study area appears to be highly suitable for Canna indica. This species has high ornamental value and plays an important role in maintaining the abundance and diversity of aquatic organisms. Therefore, it can be selected as a vegetation species for vigorous planting and protection. However, because of the reduction in adaptability of Nelumbo nucifera throughout the region, conservation measures should be actively taken now to prevent a widespread shrinkage of its growth area. Species that are more widely distributed in lower habitats are priority species for conservation and risk management. When using the results for actual planting and restoration, the impacts of land use and surrounding areas, such as water quality, vegetation cover, interspecific competition, invasive species, and human activities must be taken into consideration.

3. Discussion

In this study, an integrated platform for species distribution prediction was developed to predict the habitat adaptability of 20 typical vegetation species in Hongze Lake and its surrounding FDZ under the current climate and different future climate scenarios. Specifically, the dynamic change ranges and habitat distribution patterns of these 20 typical vegetation species in the Hongze Lake FDZ under future climate change are predicted. The AUC and TSS values of the model verify its capability to fully describe the distribution patterns of the 20 species. The integrated results of the model validate the reliability and accuracy of the habitat predictions for these 20 typical vegetation species.
Species distribution prediction models are often used to predict endangered species in order to achieve timely conservation. In this study, the potential distribution of each typical vegetation species was predicted by constructing an integrated model, so as to determine the suitable growth area of each typical vegetation under the future climate. The species distribution prediction model was used to predict the future structure of regional species in FDZs to provide a basis for regional ecological conservation. According to the flora and previous studies, these 20 typical plants are widely distributed in East China, and the investigation on the study area also confirmed the existence of these plants. It is noteworthy that the prediction results of different models will differ because they have different algorithms and simulation processes. In this study, the integrated model was evaluated using AUC and TSS, which can effectively reflect model performance and be used to compare the performances of multiple individual models. Regarding individual models, RF, GAM, and BRT showed good performance in predicting the potential distribution of these 20 species, whereas the performances of FDA and GLM were not ideal. The integrated model after screening showed higher accuracy than individual models, which proves that the integrated model can better predict suitable areas for the growth of these 20 species. This is in agreement with the results of previous studies using integrated prediction models for three species of Ephedra [42] and Paeonia lactiflora [43]. However, due to the diversity of growth characteristics and calculation parameters of different species, the matching degree between niche model and species cannot rely solely on simple test values. In the future, other indicators can be further considered to comprehensively test the model.
Climate and topography play a key role in the survival of plants, and the topography of the study area is relatively flat, with small differences in elevation change. Therefore, the influence of topography was ignored, and temperature and precipitation were selected as the main factors affecting the changes in the pattern of these vegetation species. Among these 20 species, aquatic plants and shrubs account for a relatively larger proportion, and they are more humidity-loving plants, which reflects the strong control of the climatic conditions of the study area over the vegetation. Isothermality (Bio3) is the dominant factor of all the studied vegetation species, and the average temperature in the wettest season (Bio8) and the precipitation in the driest month (Bio14) are also very important to most species. These reflect the characteristics of the study area in the subtropical and warm temperate climate transition zone, with the characteristics of some northern lakes and attributes of southern lakes [44]. However, different species show different responses to temperature and rainfall variables, and some of them have negative correlations with these variables, which is related to the growth habit of the vegetation itself. The response of plants to high values of the variables may affect their photosynthesis and thus their growth. Therefore, the response mechanisms and results should be comprehensively considered.
In the study area, except for Nelumbo nucifera and Iris pseudacorus, the remaining 18 vegetation species showed an overall trend of increasing adaptability in the future climate scenarios. Therefore, efforts should be made to protect and cultivate these species according to their specific characteristics and pathways. The adaptability of Trifolium repens will considerably increase under the climate scenario of the 2040s. However, Trifolium repens is extremely invasive and exclusionary, and the extension of its stolon will have adverse effects on the quality and function of other lawns and the surrounding ecological environment, thus significantly reducing the diversity of lawn plant communities. This species is classified as an invasive plant by the “Catalogue of Invasive Alien Species in China” [45]. Therefore, the risk of its uncontrolled expansion should be considered and timely interventions implemented to avoid the narrowing of the growth space of other species. Lolium perenne and Pennisetum alopecuroides, as two excellent grass species, have high forage value [46,47]. Therefore, their introduction and cultivation can be increased in a higher suitable area according to their suitable living space, and farmers and herders should be encouraged to cultivate this species. Similarly, under the premise of preserving the health of the water body, the proliferation of species in high-adaptability areas should be promoted for Ceratophyllum demersum, Hydrilla verticillate, Nymphoides peltate, Iris pseudacorus, Polygonum hydropiper, Nelumbo nucifera, and other aquatic species, which not only have ornamental value but can also absorb trace elements in the water body and improve water quality. Canna indica Nandina domestica and Lagerstroemia indicva also belong to landscape vegetation, and their adaptability will increase in the future climate. Therefore, their planting area can be expanded to improve the ecological landscape of the study area. According to existing studies, Amorpha fruticose, Tamarix chinensis and Cynodon dactylon also have desirable functions of soil stabilization and salinity improvement [48,49]. Therefore, they can be planted more intensively in suitable areas within the study area, through which the prevention of soil erosion and improvement in soil salinity can be achieved.
Thus far, many studies have paid attention to changes in the potential adaptive zones of vegetation species under future climate change, and most of them predicted the changes in the adaptive zones of single species. The Hongze Lake FDZ is an area for inundation and storage of flood water from the Huaihe River, and its ecological stability has a far-reaching impact on the surrounding areas. Comparative analyses of typical vegetation in the FDZ in potential high-adaptability areas under the future climate can facilitate the tracking of changes in their suitability in various regions over time, and a correct understanding of such changes will be conducive to the protection of vegetation in FDZs and guide the introduction of cultivation of species. Moreover, it has implications for strengthening in situ protection and is of great practical significance in stabilizing vegetation diversity in floodplains under the approach of returning polders to lakes.

4. Conclusions

This study constructed an integrated model on the SDM platform to simulate and predict potentially suitable habitats of 20 typical vegetation species in the FDZ of Hongze Lake, and the influence of environmental factors on these species is discussed, providing a suitable direction for vegetation protection and sustainable management in the study area. In the model evaluation, RF, GAM, and BRT show the best performance among individual models. Nevertheless, the integrated model showed improved prediction accuracy and simulated the potentially suitable habitats of the species more accurately than the individual models. Key environmental variables affecting the distribution of the 20 species were analyzed and the results showed that isothermality (Bio3) is the key environmental factor affecting all vegetation species, with the mean temperature of the wettest quarter (Bio8) and precipitation of the driest month (Bio14) also affecting most vegetation. Under the current climate conditions, most of these typical vegetation species have low adaptability in the study area. However, with continuous climate change in the future (2040s), the adaptability of Nelumbo nucifera and Iris pseudacorus will decrease, while that of the remaining 18 species will show a small or large increase, with the shrinkage of low-adaptability areas, overall expansion of high-adaptability areas, and expected improvements in the growth and diffusion of these species. The model developed in this study can be extended to the study of ecological protection in typical FDZs. This study provides some guidance for the cultivation and protection of typical vegetation species in FDZs or the prevention and control of invasion, and promotes the long-term ecological development in FDZs, so as to achieve the effect of ecological linkage between rivers and lakes.

Author Contributions

Y.J. designed the study, conducted the experiments and data analyses, completed the manuscript, and approved it for submission. L.W. designed the framework of the paper. N.L. and K.W. provided relevant data support. J.C. is the initiator of the overall support Project. All authors have read and agreed to the published version of the manuscript.

Funding

This work was supported by the projects Research on Soil and Water Conservation and Water Ecological Environment Protection Countermeasures and Measures for the Recent Construction Project of the Flood Detention and Storage Area around Hongze Lake funded by the National Key Projects.

Institutional Review Board Statement

Not applicable.

Informed Consent Statement

Not applicable.

Data Availability Statement

The data supporting the findings of this study are available from the corresponding author upon reasonable request.

Conflicts of Interest

The authors declares no competing interests. The authors declare that they have no known competing financial interests or personal relationships that could have appeared to influence the work reported in this paper.

References

  1. Wang, W.; Li, C.; Xiang, L. Research on Ecological Restoration of Flood Storage and Detention Areas. Water Res. Hydropower Eng. 2003, 7, 61–63. [Google Scholar] [CrossRef]
  2. Wang, K. Plant Ecological Restoration Technology for Flood Storage and Detention Areas: A Case Study of the Waste Grass Levee Flood Storage and Detention Area in Quanjiao County. Anhui For. Sci. Technol. 2016, 42, 27–29. [Google Scholar]
  3. Li, C.; Dong, Q.; Guo, Y.; Zhuang, L. Evaluation of vegetation construction techniques in degraded areas of Hongze Lake wetland. J. Anhui Agric. Sci. 2022, 50, 75–81. [Google Scholar] [CrossRef]
  4. Gong, L.J.; Tian, B.X.; Li, Y.G.; Wu, S. Phenological Changes of Soybean in Response to Climate Conditions in Frigid Region in China over the Past Decades. Int. J. Plant Prod. 2021, 15, 363–375. [Google Scholar] [CrossRef]
  5. Isbell, F.; Gonzalez, A.; Loreau, M.; Cowles, J.; Diaz, S.; Hector, A.; Mace, G.M.; Wardle, D.A.; O’Connor, M.I.; Duffy, J.E.; et al. Linking the influence and dependence of people on biodiversity across scales. Nature 2017, 546, 65–72. [Google Scholar] [CrossRef]
  6. Johnson, C.N.; Balmford, A.; Brook, B.W.; Buettel, J.C.; Galetti, M.; Lei, G.C.; Wilmshurst, J.M. Biodiversity losses and conservation responses in the Anthropocene. Science 2017, 356, 270–274. [Google Scholar] [CrossRef]
  7. Meng, H.H.; Zhou, S.S.; Li, L.; Tan, Y.H.; Li, J.W.; Li, J. Conflict between biodiversity conservation and economic growth: Insight into rare plants in tropical China. Biodivers. Conserv. 2019, 28, 523–537. [Google Scholar] [CrossRef]
  8. Moraitis, M.L.; Valavanis, V.D.; Karakassis, I. Modelling the effects of climate change on the distribution of benthic indicator species in the Eastern Mediterranean Sea. Sci. Total Environ. 2019, 667, 16–24. [Google Scholar] [CrossRef]
  9. Pacifici, M.; Visconti, P.; Butchart, S.H.M.; Watson, J.E.M.; Cassola, F.M.; Rondinini, C. Species’ traits influenced their response to recent climate change. Nat. Clim. Chang. 2018, 8, 750. [Google Scholar] [CrossRef]
  10. Phillips, S.J.; Anderson, R.P.; Schapire, R.E. Maximum entropy modeling of species geographic distributions. Ecol. Model. 2006, 190, 231–259. [Google Scholar] [CrossRef]
  11. McCullagh, P. Sampling bias and logistic models. J. R. Stat. Soc. Ser. B Methodol. 2008, 70, 643–664. [Google Scholar] [CrossRef]
  12. Breiman, L. Random forests. Mach. Learn. 2001, 45, 5–32. [Google Scholar] [CrossRef]
  13. Thuiller, W.; Lafourcade, B.; Engler, R.; Araujo, M.B. BIOMOD—A platform for ensemble forecasting of species distributions. Ecography 2009, 32, 369–373. [Google Scholar] [CrossRef]
  14. Coetzee, B.W.T.; Robertson, M.P.; Erasmus, B.F.N.; van Rensburg, B.J.; Thuiller, W. Ensemble models predict Important Bird Areas in southern Africa will become less effective for conserving endemic birds under climate change. Glob. Ecol. Biogeogr. 2009, 18, 701–710. [Google Scholar] [CrossRef]
  15. Naimi, B.; Araujo, M.B. sdm: A reproducible and extensible R platform for species distribution modelling. Ecography 2016, 39, 368–375. [Google Scholar] [CrossRef]
  16. Zhao, H.; Wu, R. Analysis of the purification effect and influencing factors of aquatic vegetation on the water environment of Hongze Lake lakeside wetland. Agric. Sci. Technol. 2012, 13, 211–216. [Google Scholar] [CrossRef]
  17. Shi, Q.; Hua, J.; Chen, C. The Erosion Prevention Effect of Different Plant Communities on the Embankment of Hongze Lake. Bull. Soil Water Conserv. 2022, 42, 42–48. [Google Scholar] [CrossRef]
  18. Yuan, X.; Yuan, Y. Research on the Planning and Design of Returning the Hongze Lake to the Lake. Water Conserv. Technical Superv. 2022, 133–143. [Google Scholar]
  19. Chen, C.; Zhang, M.; Xu, M.; Wang, L. Ecological Risk Assessment of Hongze Lake Basin. People’s Yangtze River 2021, 52, 36–40. [Google Scholar] [CrossRef]
  20. Tian, Z.; Jiang, D. Analysis of Climate Simulation Capability of CCSM4 with Different Resolutions for East Asia and China. Atmos. Sci. 2013, 37, 171–186. [Google Scholar] [CrossRef]
  21. O’Neill, B.C.; Kriegler, E.; Riahi, K.; Ebi, K.L.; Hallegatte, S.; Carter, T.R.; Mathur, R.; van Vuuren, D.P. A new scenario framework for climate change research: The concept of shared socioeconomic pathways. Clim. Chang. 2014, 122, 387–400. [Google Scholar] [CrossRef]
  22. Dormann, C.F.; Elith, J.; Bacher, S.; Buchmann, C.; Carl, G.; Carre, G.; Marquez, J.R.G.; Gruber, B.; Lafourcade, B.; Leitao, P.J.; et al. Collinearity: A review of methods to deal with it and a simulation study evaluating their performance. Ecography 2013, 36, 27–46. [Google Scholar] [CrossRef]
  23. Jiang, Y.B.; Wang, T.J.; Wu, Y.P.; Hu, R.G.; Huang, K.; Shao, X.M. Past distribution of epiphyllous liverworts in China: The usability of historical data. Ecol. Evol. 2018, 8, 7436–7450. [Google Scholar] [CrossRef] [PubMed]
  24. Ao, Y.L.; Li, H.Q.; Zhu, L.P.; Ali, S.; Yang, Z.G. The linear random forest algorithm and its advantages in machine learning assisted logging regression modeling. J. Pet. Sci. Eng. 2019, 174, 776–789. [Google Scholar] [CrossRef]
  25. Payne, R.W. Developments from analysis of variance through to generalized linear models and beyond. Ann. Appl. Biol. 2014, 164, 11–17. [Google Scholar] [CrossRef]
  26. Alahuhta, J.; Antikainen, H.; Hjor, J.; Helm, A.; Heino, J. Current climate overrides historical effects on species richness and range size of freshwater plants in Europe and North America. J. Ecol. 2020, 108, 1262–1275. [Google Scholar] [CrossRef]
  27. Alavipanah, S.; Schreyer, J.; Haase, D.; Lakes, T.; Qureshi, S. The effect of multi-dimensional indicators on urban thermal conditions. J. Clean. Prod. 2018, 177, 115–123. [Google Scholar] [CrossRef]
  28. Fraker, M.E.; Keitzer, S.C.; Sinclair, J.S.; Aloysius, N.R.; Dippold, D.A.; Yen, H.; Arnold, J.G.; Daggupati, P.; Johnson, M.V.V.; Martin, J.F.; et al. Projecting the effects of agricultural conservation practices on stream fish communities in a changing climate. Sci. Total Environ. 2020, 747, 141112. [Google Scholar] [CrossRef]
  29. Guo, G.H.; Wu, Z.F.; Xiao, R.B.; Chen, Y.B.; Liu, X.N.; Zhang, X.S. Impacts of urban biophysical composition on land surface temperature in urban heat island clusters. Landsc. Urban Plan. 2015, 135, 1–10. [Google Scholar] [CrossRef]
  30. Carslaw, D.C.; Taylor, P.J. Analysis of air pollution data at a mixed source location using boosted regression trees. Atmos. Environ. 2009, 43, 3563–3570. [Google Scholar] [CrossRef]
  31. Elith, J.; Leathwick, J.R.; Hastie, T. A working guide to boosted regression trees. J. Anim. Ecol. 2008, 77, 802–813. [Google Scholar] [CrossRef]
  32. Hu, Y.F.; Dai, Z.X.; Guldmann, J.M. Modeling the impact of 2D/3D urban indicators on the urban heat island over different seasons: A boosted regression tree approach. J. Environ. Manag. 2020, 266, 110424. [Google Scholar] [CrossRef]
  33. Hastie, T.; Tibshirani, R.; Botstein, D.; Brown, P. Supervised harvesting of expression trees. Genome Biol. 2001, 2, RESEARCH0003. [Google Scholar] [CrossRef] [PubMed]
  34. Hastie, T.; Tibshirani, R. Generalized Additive Models: Some Applications. J. Am. Stat. Assoc. 1987, 82, 371–386. [Google Scholar] [CrossRef]
  35. Friedman, J.; Hastie, T.; Tibshirani, R. Regularization Paths for Generalized Linear Models via Coordinate Descent. J. Stat. Softw. 2010, 33, 1–22. [Google Scholar] [CrossRef] [PubMed]
  36. Guisan, A.; Edwards, T.C.; Hastie, T. Generalized linear and generalized additive models in studies of species distributions: Setting the scene. Ecol. Model. 2002, 157, 89–100. [Google Scholar] [CrossRef]
  37. Hastie, T.; Tibshirani, R. Generalized additive models for medical research. Stat. Methods Med. Res. 1995, 4, 187–196. [Google Scholar] [CrossRef]
  38. Allouche, O.; Tsoar, A.; Kadmon, R. Assessing the accuracy of species distribution models: Prevalence, kappa and the true skill statistic (TSS). J. Appl. Ecol. 2006, 43, 1223–1232. [Google Scholar] [CrossRef]
  39. Swets, J.A. Measuring the accuracy of diagnostic systems. Science 1988, 240, 1285–1293. [Google Scholar] [CrossRef]
  40. Zhao, G.; Cui, X.; Wang, Z.; Fan, B. Prediction of potential suitable growth areas for Chinese jujube under the background of climate change. Sci. Silvae Sin. 2021, 57, 158–168. [Google Scholar] [CrossRef]
  41. Luo, M.; Wang, H.; Lv, Z. Evaluating the Performance of Biomod2 and MaxEnt Distribution Prediction Models Using Giant Panda Data. Chin. J. Appl. Ecol. 2017, 28, 4001–4006. [Google Scholar] [CrossRef]
  42. Guo, L.F.; Gao, Y.; He, P.; He, Y.; Meng, F.Y. Modeling for Predicting the Potential Geographical Distribution of Three Ephedra Herbs in China. Plants-Basel 2023, 12, 787. [Google Scholar] [CrossRef] [PubMed]
  43. Bi, Y.Q.; Zhang, M.X.; Chen, Y.; Wang, A.X.; Li, M.H. Applying Biomod2 for modeling of species suitable habitats:a case study of Paeonia lactiflora in China. Zhongguo Zhong Yao Za Zhi. 2022, 47, 376–384. [Google Scholar] [CrossRef] [PubMed]
  44. Gao, F.; Qian, Y.; Wang, G. Characteristics and Existing Problems of Hongze Lake Wetland Ecosystem. Environ. Sci. Technol. 2010, 33, 1–5. [Google Scholar] [CrossRef]
  45. Huang, Y.; Zhang, K.; Sun, L.; Zhang, J.; Li, S.; Hu, Z.; Wang, R.; Li, X.; Xiong, Q.; Jie, W. Effects of Trifolium repens invasion on soil animals in urban lawn ecosystems. J. Ecol. 2018, 38, 8489–8499. [Google Scholar] [CrossRef]
  46. Zhang, T.; Zhao, C.; Fu, J.; Liu, L.; Li, X. Effects of Aspergillus spinosus on the quality and yield of perennial ryegrass forage. J. Ecol. 2019, 38, 3667–3672. [Google Scholar] [CrossRef]
  47. Zhou, Y.; Zhang, J.; Liu, Y.; Yangfu, L.; Zhou, J. Effect of Propionic Acid on the Silage Quality and Microbial Flora of Hybrid Pennisetum. J. Anim. Nutr. 2023, 35, 5404–5417. [Google Scholar] [CrossRef]
  48. Wang, Q.; Chen, P.; Fu, Y.; Wei, S. Effect of Tamarix shrub grass community on surface soil improvement in mudflat of Binzhou Port. Wetl. Sci. 2023, 21, 541–548. [Google Scholar] [CrossRef]
  49. Shao, T.; Yan, X.; Jia, B.; Xu, L.; Ma, Z.; Ren, Y.; Long, X. Study on the Improvement of Coastal Viscous Saline-alkali Land by Planting Herbal Plant Dogtooth Root. Soils 2023, 25, 1–7. Available online: https://kns.cnki.net/kcms2/detail/32.1118.P.20230629.0918.002.html (accessed on 9 January 2023).
Figure 1. Overview map of the study area.
Sustainability 16 06331 g001
Figure 2. Accuracy test results of 10 single model algorithms (taking Trifolium repens L. as an example).
Sustainability 16 06331 g002
Figure 3. Accuracy of each vegetation prediction model.
Sustainability 16 06331 g003
Figure 4. The contribution rates of various bio factors to different vegetation types.
Sustainability 16 06331 g004
Figure 5. Response curves.
Sustainability 16 06331 g005aSustainability 16 06331 g005bSustainability 16 06331 g005c
Figure 6. Current distribution of suitable vegetation areas.
Sustainability 16 06331 g006aSustainability 16 06331 g006b
Figure 7. Change rate range of suitable areas for 20 typical vegetation species under different climate scenarios.
Sustainability 16 06331 g007aSustainability 16 06331 g007bSustainability 16 06331 g007c
Table 1. Typical vegetation species and their occurrence times in Hongze Lake FDZ.
VegetationIris
pseudacorus L.
Ceratophyllum
demeser L.
Hydrilla
verticillata (Linn. f.) Royle
Potamogeton
wrightii Morong
Number of
occurrences
246234222186
VegetationCynodon
typist (L.) Persoon
Lolium
perenne L.
Phragmites
australis (Cav.)
Trin.
ex steu
Polygonum
hydropiper L.
Number of occurrences3521641084454
VegetationLagerstroemia indica L.Amorpha
fruticosa Linn
Tamarix
chinensis Lour
Trifolium
repens L.
Number of occurrences163550257602
VegetationCanna
indica L.
Nelumbo
nucifera Gaertn
Typha
angustifolia L.
Nymphoides
peltata (S. G. Gmelin)
Kuntze
Number of occurrences250191379444
VegetationNandina
domestica Thunb
Triarrhena sacchariflora (Maxim.) NakaiPennisetum
alopecuroides (L.) Spreng
Potamogeton
crispus L.
Number of occurrences126249509335
Data sourceson-the-spot investigation + (GBIF, http://www.gbif.org, accessed on 13 February 2023), (CVH, http://www.cvh.org/, accessed on 13 February 2023), (http://www.nsii.org/, accessed on 15 February 2023)
Table 2. Environmental variables.
Environment VariablesVariable Description
Bio1Annual Mean Temperature (°C)
Bio2Mean diurnal range (mean of monthly (max temp–min temp)) daily average temperature range (°C).
Bio3Isothermicity (Bio 2/Bio 7) (×100) Isothermicity
Bio4Temperature seasonality (standard deviation × 100) coefficient of seasonal variation of temperature.
Bio5Max Temperature of Warmest Month Maximum temperature in hottest month (°C)
Bio6Min Temperature of Coldest Month Minimum temperature in coldest month (°C)
Bio7Temperature annual range (Bio 5–Bio 6) Temperature annual range (°C)
Bio8Mean temperature of wet quarter (°C)
Bio9Mean Temperature of Driest Quarter Average temperature in the driest quarter (°C)
Bio10Mean temperature of warm quarter average temperature in the warmest quarter (°C)
Bio11Mean temperature of coldest quarter average temperature (°C)
Bio12Annual Precipitation (mm)
Bio13Precipitation of Wettest Month in the wettest month (mm)
Bio14Precipitation of Driest Month (mm)
Bio15Seasonal variation of precipitation (coefficient of variation) (mm)
Bio16Precipitation in the driest quarter of precision of wet quarter (mm)
Bio17Precipitation in the wettest quarter of precision of drill quarter (mm)
Bio18The warmest quarterly precipitation of Precipitation of Warmest Quarter (mm)
Bio19The coldest quarterly precipitation of Precipitation of Coldest Quarter (mm)
Table 3. Importance proportion of bioclimatic variables for different vegetation species %.
Vegetation NameBio1Bio2Bio3Bio4Bio5Bio6Bio7Bio8Bio9Bio10Bio11Bio12Bio13Bio14Bio15Bio16Bio17Bio18Bio19
Bio
Iris pseudacorus L. 47.727.5 29.930.8 30.1 36
Ceratophyllum demersum L. 9.3 35.152.3 44.1 13.3
Hydrilla verticillata (Linn. f.) Royle 23.710.2 17.8 57.1 19.5 26.3
Potamogeton wrightii Morong 23.59.4 20.9 58.728.6
Nandina domestica Thunb 15.634.7 21.1 31.2 32.3 45.6
Lagerstroemia indica L. 13.610.7 24.6 56.2 25.419.131
Amorpha fruticosa Linn 0.9 36.830.6 17.8 9
Tamarix chinensis Lour 27.5 3.7 4.1 36.618.916
Trifolium repens L. 16.410.5 7.4 17.612.1 15.6
Pennisetum alopecuroides (L.) Spreng 6.5 16.966.1 35.46.513
Cynodon dactylon (L.) Persoon 22.671 7 3.835.3
Lolium perenne L. 22.812.8 15.7 14.326.839.9
Phragmitesaustralis (Cav.) Trin. ex steu 7.23.8 7.4 6 14.770.2
Polygonum hydropiper L. 38.614.4 6.9 45.8 12.130.6
Nelumbo nucifera Gaertn 4.318.7 8.3 56.6 19.2 21.7
Triarrhena sacchariflora (Maxim) Nakai4.2 4.2 404.621.8 4.917.2 2
Canna indica L. 17.317.7 30.5 26.4 42.2 22.1
Typha angustifolia L. 8.49.4 20.6 66.9 12.38.120.2
Nymphoides peltata (S. G. Gmelin) Kuntze 7.353.5 22.6 39.7 55.7
Potamogeton crispus L. 7.55.7 27.9 59.4 39.714.9
Table 4. Variation range of the survival rates of 20 typical vegetation species under different climate scenarios (%).
Vegetation NameChange Range of Suitable Area
SSP126SSP245SSP370SSP585
Iris pseudacorus L.−2~2.9−2~3.0−2~2.9−2~3.1
Ceratophyllum demersum L.8.7~10.68.9~11.98.3~10.47.9~11.0
Hydrilla verticillate (Linn. f.) Royle4.7~7.44.0~7.35.0~7.64.7~7.8
Potamogeton wrightii Morong10.2~18.212.9~19.39.2~16.48.8~18.5
Nandina domestica Thunb5.9~10.85.7~8.95.5~10.74.5~9.8
Lagerstroemia indica L.17.6~24.416.2~24.218.1~24.816.7~24.0
Amorpha fruticose Linn53.7~65.955.6~65.953.5~65.751.7~64.5
Tamarix chinensis Lour42.2~46.841.5~46.444.8~48.844.3~49.2
Trifolium repens L.35.5~44.435.3~48.235.4~44.437.7~45.8
Pennisetum alopecuroides (L.) Spreng11.0~18.04.7~18.210.4~17.83.7~16.9
Cynodon dactylon (L.) Pers46.3~48.946.2~49.046.6~49.447.2~49.8
Lolium perenne L.34.3~37.935.0~38.033.3~38.330.9~37.4
Phragmites australis (Cav.) Trin. ex steu0.2~12.60.3~13.80.0~12.60.0~12.6
Polygonum hydropiper L.22.3~28.122.3~28.113.3~27.412.9~28.0
Nelumbo nucifera Gaertn−10.0~−2.5−9.8~−2.5−10.3~−2.5−10.2~−2.8
Triarrhena sacchariflora (Maxim.) Nakai4.2~7.44.2~6.54.2~6.54.0~7.4
Canna indica L.72.8~73.373.3~74.672.6~73.472.7~73.5
Typha angustifolia L.5.8~9.85.9~10.36.2~10.06.5~10.0
Nymphoides peltate (S. G. Gmelin) Kuntze0.4~1.00.5~1.30.3~1.00.3~1.0
Potamogeton crispus L.22.7~26.825.2~28.122.8~26.122.9~25.8
Table 5. Changes in the area of suitable vegetation areas under different SSPs in the future (×102 km2).
Vegetation SSPsFuture (~2040s)
NameSSP126SSP 245SSP 370SSP 585
Classification of
Suitable Habitat
LowMediumHighMostLowMediumHighMostLowMediumHighMostLowMediumHighMost
Trifolium repens L. 35.84 35.84 35.84 35.84
Tamarix chinensis Lour 35.84 35.84 35.84 35.84
Triarrhena sacchariflora (Maxim.) Nakai35.84 35.84 35.84 35.84
Cynodon dactylon (L.) Persoon 35.84 35.84 35.84 35.84
Hydrilla verticillata (Linn. f.) Royle35.84 35.84 35.84 35.84
Ceratophyllum demersum L. 35.84 35.84 35.84 35.84
Pennisetum alopecuroides (L.)
Spreng
12.42 23.42 14.12 21.72 13.97 21.87 20.77 15.07
Phragmites australis (Cav.) Trin. ex steu 35.84 35.84 35.84 35.84
Canna indica L. 35.84 35.84 35.84 35.84
Nandina domestica Thunb35.84 35.84 35.84 35.84
Typha angustifolia L.35.84 35.84 35.84 35.84
Amorpha fruticosa Linn 1.0434.78 0.6635.18 0.9134.93 18.3317.51
Potamogeton crispus L. 35.84 35.84 35.84 35.84
Lolium perenne L. 35.84 35.84 35.84 35.84
Iris pseudacorus L.35.84 35.84 35.84 35.84
Nelumbo nucifera Gaertn35.84 35.84 35.84 35.84
Potamogeton wrightii Morong35.84 35.84 35.84 35.84
Polygonum hydropiper L. 35.84 35.84 35.84 35.84
Nymphoides peltata (S. G. Gmelin) Kuntze35.84 35.84 35.84 35.84
Lagerstroemia indica L.35.84 35.84 35.84 35.84
Disclaimer/Publisher’s Note: The statements, opinions and data contained in all publications are solely those of the individual author(s) and contributor(s) and not of MDPI and/or the editor(s). MDPI and/or the editor(s) disclaim responsibility for any injury to people or property resulting from any ideas, methods, instructions or products referred to in the content.

