Abstract
Cooperative Intelligent Transport Systems (C-ITS) address contemporary transportation challenges, as Connected Vehicles (CVs) can play a pivotal role in enhancing efficiency and safety. The role of central governing authorities in shaping traffic management policies for CVs influences decision-making processes and system performance. In this work, the role of central governing authorities in the traffic management of a mixed traffic network is examined, integrating System Optimum principles with game theory. More specifically, we introduce and develop a framework that models and analyses the strategic interactions between different stakeholders in a mixed traffic environment, considering central governing authorities with varying levels of control. The results indicate how the various levels of control of a central governing authority may have an impact on the network in terms of traffic measures. Through a strategic games analysis, the trade-offs associated with centralized control mechanisms are demonstrated and recommendations are offered for policymakers and practitioners to optimize traffic management strategies.
1. Introduction
Cooperative Intelligent Transportation Systems (C-ITS) are expected to improve the driving experience through the provision of constant and real-time Vehicle-to-Vehicle (V2V) and Vehicle-to-Infrastructure (V2I) services [,,]. C-ITS services contribute to the establishment of novel data-rich ecosystems that facilitate numerous applications and services aimed at increasing road safety, reducing traffic congestion, and promoting environmental sustainability, all while enhancing the overall quality and productivity of the travelers’ experience [].
Currently, there is an increasing need for central governing authorities, such as traffic management centers, to adopt these disruptive trends and technologies, which are typically provided by private sector business-to-consumer vendors []. From an operational point of view, it is expected that central governing authorities will retain their role in managing and controlling traffic by relying on alliances formed with other parties, thus reshaping conventional traffic management.
Washimi [] discusses the development of traffic control systems that manage multiple intersections and are facilitated by official development aid, emphasizing the need for innovative policy adjustments in the face of evolving technologies. Furthermore, Kerber [] explores the challenges of data governance in CVs, particularly the accessibility and ownership of in-vehicle data, which are crucial for the implementation of effective traffic management strategies. The work by Alghuson et al. [] delves into the implementation of telematics-based traffic law enforcement and network management systems, highlighting the role of government in allocating resources to support these technologies. Additionally, Li et al. [] address the emerging importance of legal and regulatory standards that various government levels must design to accommodate highly automated vehicles within urban settings. Extending this discussion, Andraško et al. [] emphasize the critical role of cooperative and automated mobility in enabling smarter and safer traffic flows within the European Union, pointing to sustainable data governance as a cornerstone for effective traffic management systems. Similarly, Li et al. [] provide insights into urban traffic control strategies under a mixed traffic environment, showcasing the potential of CVs to alleviate congestion and enhance traffic safety. The integration of CVs presents both opportunities and challenges for urban transportation systems. Gruyer et al. [] and Jadaan et al. [] further elaborate on the benefits and challenges of CVs, exploring their impact on public transportation systems and traffic congestion. These studies collectively underscore the intricate relationship between technological advancements in transportation and the corresponding need for robust and adaptive policy frameworks.
While numerous studies have explored various aspects of C-ITS and CVs in traffic management, there remains a significant gap in the comprehensive integration of multiple stakeholder perspectives within mixed traffic environments. Existing research, such as the work by Kerber [] on data governance and Alghuson et al. [] on telematics-based traffic law enforcement, highlights the complexities of data accessibility and regulatory challenges. However, these studies often examine isolated elements of traffic systems without considering the dynamic interactions between central authorities, private service providers, and diverse driver types. The current methodologies fall short in addressing the holistic coordination required for network optimization in real-world scenarios, as noted by Andraško et al. [] and Li et al. [].
To address the existing challenges, our proposed framework aims to fill the gap by integrating System Optimum principles into a game theory-based model that captures the strategic interactions among different stakeholders. This approach not only addresses the trade-offs associated with varying levels of central control but also provides actionable insights for policymakers to enhance traffic management strategies, thereby overcoming the limitations of previous works and contributing to the establishment of more efficient, safer, and more sustainable urban transport systems. More specifically, the present work demonstrates a method that integrates traditional principles of traffic assignment into game theory for the formulation of a framework capable of modeling and analyzing varying control levels of a central governing authority in a mixed traffic road network. The proposed framework incorporates the principles of User Equilibrium [], System Optimum [], and Cournot–Nash oligopoly [] into a multiclass traffic assignment model, in which three different types of players interact simultaneously for the achievement of individual benefits.
In addition, prior related scientific works have examined specific aspects of traffic systems or theoretical models in isolation, without integrating multiple stakeholder perspectives into real-world scenarios. Moreover, the dynamic interactions among central authorities, private service providers, and various driver types are not considered in a comprehensive manner, overlooking holistic coordination for network optimization and are limited to specific scenarios.
To this end, the innovative aspects of this work rely on the comprehensive modeling of interactions among diverse stakeholders and the practical application of CVs’ technologies for network optimization. C-ITS technologies are integrated with game theory principles, providing a basis for the holistic examination of interactions among different players and enabling the exploration of various equilibrium situations through the quantification of network metrics.
Literature Review
Models of game theory are used in transportation analysis as they constitute robust tools to develop frameworks for the solution of complex problems []. Chen and Ben-Akiva [] develop an approach for the dynamic analysis of traffic control and traffic assignment problems which relies on noncooperative game theory principles. Their approach includes a game with two players, i.e., a traffic authority and highway users, and its scope is to generate the maximum benefits for both. Li and Ray [] introduce a methodology based on noncooperative game theory to provide a solution to the problem of balancing both User Equilibrium and System Optimum in traffic assignment. Levy et al. [] correlate the traffic theory principles of User Equilibrium and System Optimum with game theory by developing a simple two-player game, which allows for the emergence of a stable System Optimum through cooperation. The work focuses on the prisoner’s dilemma, as it shows the significant implications of mode choice problems, and on the Route Choice Game, which contributes to the understanding of congestion formation as a simple binary network. Wang and Tang [] adopt the perspective of game theory to examine the quantitative relation between User Equilibrium and System Optimum. By using a noncooperative game analysis, it is shown that System Optimum and User Equilibrium can be integrated into a pure-strategy Nash equilibrium under infinite strategy sets.
Larsson and Patriksson [] utilize the principles of game theory to represent the traffic system in a noncooperative Stackelberg game with two types of players. The leader of the game is the traffic manager, while the travelers are considered the followers. The objective of the traffic manager is to achieve society’s goals and establish network efficiency considering the current traffic. The travelers adapt their behavior based on the infrastructure changes posed by the traffic manager. These changes in traveler behavior are depicted by adjusting route choices or travel modes. Wang et al. [] apply game theory for traffic demand management. Game theory is used to analyze the reactions of multiple coexisting users of a network who have different behaviors and conflicting interests. A game theory-based model was developed, representing the perspective of traffic demand management departments and traffic participants’ traffic demands. Du et al. [] exploit the perspective of a pure-strategy atomic routing game to develop a coordinated online in-vehicle routing mechanism for smart vehicles with real-time information exchange and portable computation capabilities.
More advanced concepts rely on coupling game theory with bilevel optimization. Shang and Abdel Aziz [] develop a model that is based on Stackelberg games with the aim to provide public authorities with the capability to plan payment mechanisms for private–public partnership (PPP) transportation projects. The objective of the model is to generate an optimum solution which maximizes, in parallel, the overall performance of the project in terms of both social welfare and private investment. For a solution to the optimization problem, a variable elimination method and a genetic algorithm are used. Yue and You [] develop a mixed-integer bilevel programming (MIBP) modeling framework and a solution algorithm for optimal supply chain design and operation. In this model, the follower has the capability to make discrete decisions, e.g., facility location, technology selection, and the opening/shutting down of production lines. Burger et al. [] propose a motion planning algorithm that generates interaction-aware behavior for highly interactive scenarios. The algorithm relies on the reformulation of a bilevel optimization problem that frames the interactions between two decision makers as a Stackelberg game. Kand and Rakha [] propose a decision-making process for merging maneuvers based on game theory. Their model includes two noncooperative players that make decisions as the drivers of subject and lag vehicles but does not consider advanced communication technologies.
Wang and Zhang [] present various interaction schemes among multiple authorities by developing a series of different network design strategies based on competitive, cooperative, chronological, Stackelberg, and mixed schemes. The behaviors of the subregions are expressed through multiple-level games and the description of the various game behaviors of regional authorities is achieved through the development of Network Design Problem (NDP) models. Chen and Ren [] propose a game theory-based framework to model the interactions between vehicles during merging processes. Two distinct types of players are defined in the model and considered as competitors. The model parameters are assessed through a bilevel estimation methodology which is developed as a least squares problem in its upper level and a linear complementarity problem in its lower level, with the purpose of searching for equilibria.
The next chapters describe the methodological framework, the case study to which the framework was applied and tested, and finally the results.
2. Materials and Methods
2.1. Theoretical Background
The developed framework was made with the purpose of formulating a game theory-based traffic management model for mixed traffic conditions, in which both conventional and CVs coexist. More specifically, the proposed framework integrates three different types of players with the objective of executing multiclass traffic assignment in a network to achieve optimum mixed equilibria conditions for the whole network. Each player has different interests and tries to achieve different benefits. The concept for the framework’s design and development relies on an extensive study of previous works related to mixed traffic flows and game theory, including Altman et al. [,], Boulogne et al. [], Harker [], and Yang et al. [], extending the correlation of CVs’ technologies and C-ITS services with the presented methodologies and frameworks.
The first type of player, i.e., the Uncooperative Egoistic (UE) player, represents the portion of travelers in the network who can find their routes from an origin to a destination (O-D) with the minimum travel time and therefore no longer have an incentive to seek different routes. These travelers are considered the drivers of conventional vehicles with no access to dynamic/real-time information about road network conditions, relying on static route choices without benefiting from dynamic updates.
The second type of player, i.e., the System Optimizer (SO) player, represents the portion of travelers who choose their routes with the objective of minimizing their total travel time in the network. These drivers are considered the drivers of CVs, whose dynamic/real-time information provision is provided by a central governing authority, e.g., a traffic management center in the road network. The objective of the central governing authority has System Optimum principles and could include the provision of real-time information via Variable Message Signs (VMSs).
Finally, the third type of player, i.e., the Cournot–Nash player, represents the portion of self-optimizing oligopoly Cournot travelers whose objective is to minimize the total costs of the specific team they belong to. These drivers of CVs are typically subscribed to private service providers (e.g., Waze, Google) and have access to dynamic/real-time information that align with the individual objectives of their private service provider.
The differentiation among the three types of players and the benefits they wish to achieve is expressed through their unique cost functions, which define their strategies and behaviors towards choosing routes in the network. These differences associated with the cost functions, referred to as the “perceived cost of each player”, are formulated based on the variances in the marginal costs that affect each player.
The marginal cost can be defined as the impact of an additional vehicle on a path between an O-D pair on the overall network cost []. The fundamental economic principle of marginal cost pricing states that road users using congested roads should pay a toll equal to the difference between the marginal social cost and the marginal private cost to maximize the net social benefit []. In the traffic assignment literature [], the concept of marginal cost toll has been used for converting a User Equilibrium flow pattern to a System Optimum within a road network with fixed demand.
The basis of the proposed framework relies on traffic assignment principles, where multiple players simultaneously make route choices within a network and the corresponding costs associated with these choices are expressed through distinct cost functions reflecting their individual strategies, objectives, and rationalities. The “perceived cost of each player” represents the subjective expense that each player associates with traversing a particular link or path within the network (according to their strategy), guiding their decision-making process in selecting routes. This “perceived cost” relies on the following terms to describe and differentiate the various cost components associated with each player:
- The actual cost (private cost) is the cost perceived by an individual traveler based on his/her travel choices, capturing the individual’s personal expenditure in terms of time or resources for a specific travel route.
- The full marginal cost is the change in the total cost of the transport network due to the introduction of an additional vehicle. It emphasizes the comprehensive consideration of network-wide effects associated with an incremental change in travel demand.
- The partial marginal cost (oligopoly cost) is the change in the total cost shared among a subset of travelers (oligopoly) due to an additional vehicle. It reflects the impact on a specific group of travelers in an oligopolistic setting.
The link cost perceived by the UE player aligns with their marginal private cost (actual cost). The UE player’s strategy is based solely on the direct impact on his/her travel experience, with no considerations for the broader network. The actual cost perceived by the UE player is a straightforward representation of the travel time on a given path and is synonymous with the private cost incurred by an individual traveler, emphasizing the self-centric strategy of the UE player.
The SO player’s perceived cost extends beyond their individual journey, incorporating the full marginal social cost incurred. This cost reflects the change in the network’s total cost resulting from an additional vehicle. Focused on system-level optimization, the SO player considers the broader implications of his/her route choice on the entire network. The full marginal cost is calculated as the change in the network’s total cost due to the introduction of an extra vehicle. Specifically, a factor representing the derivative of travel time with respect to the flow on the path is added to formulate the full marginal cost. The inclusion of the derivative term reflects the systemic perspective of the SO player’s strategy, accounting for the network-wide implications of individual decisions.
The CN player’s perceived cost involves the partial marginal social cost. This cost captures the change in the oligopoly Cournot–Nash travelers’ total cost due to an additional vehicle. The CN player operates in an environment where strategic interactions among players influence their perceived costs. Therefore, a factor representing the change in the oligopoly travelers’ total cost is added, capturing the strategy of the CN player, who considers not only individual travel time, but also its collective impact on the oligopoly. This is achieved via the derivative of travel time with respect to the flow on the paths attributable to the CN players.
To formulate and calculate the “perceived cost for each player”, the following three equations were integrated into the model, capturing the different strategies of the three players:
where
- : User Equilibrium player.
- : System Optimum player.
- : Cournot–Nash player.
- : the flow on a link.
- : the cost of a link.
- : cost of link as perceived the UE player.
- : cost of link as perceived the SO player.
- : cost of link as perceived the CN player.
- : flows on the links where UE conditions apply.
- : flows on the links where SO conditions apply.
- : flows on the links where CN conditions apply.
Game theory principles are exploited to capture the decision-making behaviors of the three different players within the network. The players represent different stakeholders with distinct preferences and objectives related to their route choices, as they are players in a strategic game. In the strategic game, each player seeks to optimize his/her utility (cost) while considering the actions of the others. The different behaviors of the players and their impacts on traffic flow are analogous to the strategic interactions in a strategic game. Each player aims to make the best decision based on his/her individual objectives and the anticipated actions of the other players. Following Nash equilibrium principles, no player has an incentive to unilaterally deviate from his/her strategy. Within the multiclass traffic assignment model that is developed, the iteration process serves as a convergence towards equilibrium, where the players’ actions and decisions are stabilized based on the interplay of various factors. Hence, route choice is modeled as a game, where the route choice decisions made by the players align with their strategies, expressed by their cost functions, and affect the overall outcome, i.e., the traffic distribution in the network.
2.2. Framework Structure
Each player’s unique cost perspective aligns with their strategy, be it individual optimization, system-level efficiency, or strategic oligopoly interactions. To this end, to perform traffic assignment for the three different players simultaneously, a model was developed in R (version 2022.02.01+461), a free software environment for statistical computing and graphics []. The inputs to the model include:
- A network assignment matrix.
- A network demand matrix.
- A matrix with other network characteristics, i.e., capacity, free flow, or other parameters.
The outputs include:
- The network link flows of each player.
- The total network link flows.
- The total network link costs.
The model inputs are as follows:
- : network assignment matrix.
- : routes between the network’s O-D pairs ().
- : network links.
- : network demand matrix.
- : number of players.
- .
- : The set of network characteristics that should be considered in the computational process. could be comprised, for example, of links’ capacities and links’ effect parameters.
Regarding , it should be noted that it is a binary matrix where “1” applies for the links that are part of an individual route for an O-D pair, while “0” applies to the links that are not part of the same individual route. The link costs are calculated through the equation below:
where
- : link free flow.
- : the congestion effect parameter on a link.
Multiclass Traffic Assignment Algorithm Framework
For the framework’s implementation, an algorithm that performs multiclass traffic assignment and flow distribution within a network was developed. The algorithm aims to optimize the distribution of traffic demand across various routes, considering the strategies of the three different players.
The algorithm iteratively computes route flows, link flows, and costs, resulting in balanced traffic distribution across the network for the three different players. The logic and the calculative steps executed by the algorithm begin with reading the input data, which includes the assignment matrix using information about possible routes between O-D pairs, the capacity and free flow travel times of links, and the traffic demand of the different players and the O-D pairs.
Key parameters are initialized to control aspects of player strategy, link cost calculations, and the number of iterations to be performed. These key parameters are set to control player behavior, link cost calculations, and overall simulation dynamics, reflecting the distinct objectives and rationalities of each strategy. The algorithm initializes the matrices of link flows, route flows, route flows per player, and link flows per player, which store information about link and route flows of the different players throughout the iterations.
The assignment matrix is pre-processed by removing unnecessary columns and converting them into a matrix format for efficient computations. Initial link costs are then calculated using free flow travel times and link flows. These costs affect route choices and represent the perceived costs that guide the players’ decisions.
The algorithm enters its main loop, iterating over a predefined number of iterations. Within each iteration, it processes all O-D pairs and, for each O-D pair, iterates over all players. This iterative process captures the coexistence and interactions among the players in the traffic assignment process, as they continuously adapt their route choices based on the changing conditions within the network. Player-specific decision-making is performed based on each player’s strategy. After demand distribution, the algorithm updates the route flows and link flows based on the distributed demand. It also updates the link flows per player to account for the changes in link flows for each player.
The algorithm’s flowchart is presented in Figure 1 below.
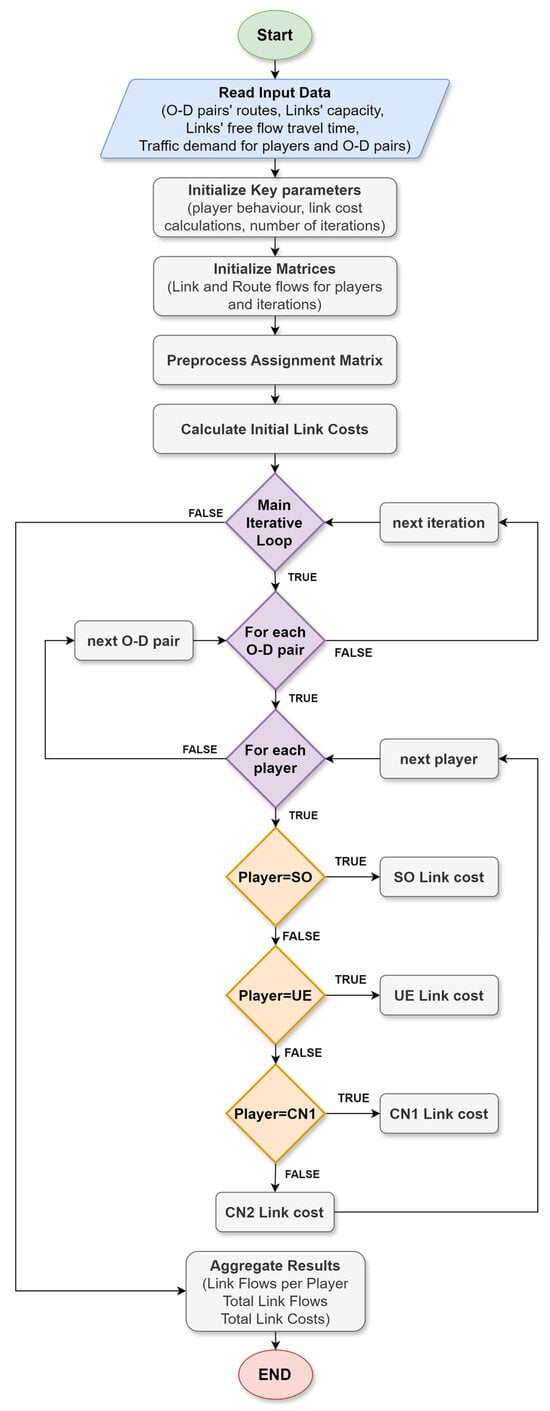
Figure 1.
Framework of multiclass traffic assignment algorithm.
3. Case Study
The road network in which the proposed framework is tested includes the urban and peri-urban area of the city of Thessaloniki (Greece). The network includes links with lengths ranging from 0.25 to approximately 9 km. The speed limits on the Peripheral Ring Road (outer and inner) vary from 80 km/h (west segment) to 90 km/h (east segment). The traffic demand is distributed among several O-D pairs. The supply and demand data, as well as the network characteristics, i.e., links, nodes and their features, used for network modeling relied upon recently updated and calibrated macroscopic traffic assignment models used for planning purposes, and, more specifically, on the VISUM model for the city of Thessaloniki from the Hellenic Institute of Transport (CERTH-HIT) (https://www.imet.gr/index.php/en/, accessed on 8 July 2024). The road network covers key areas from the western gateway to the city up to the eastern area of Thessaloniki Airport. The design of the road network followed a comprehensive node–link structure, including major intersections that act as nodes and arterial roads that form the connecting links. These road segments included in the case study network were selected to represent the primary roads containing vehicular movement within the urban and peri-urban network of the city. The case study network is presented in Figure 2 below.
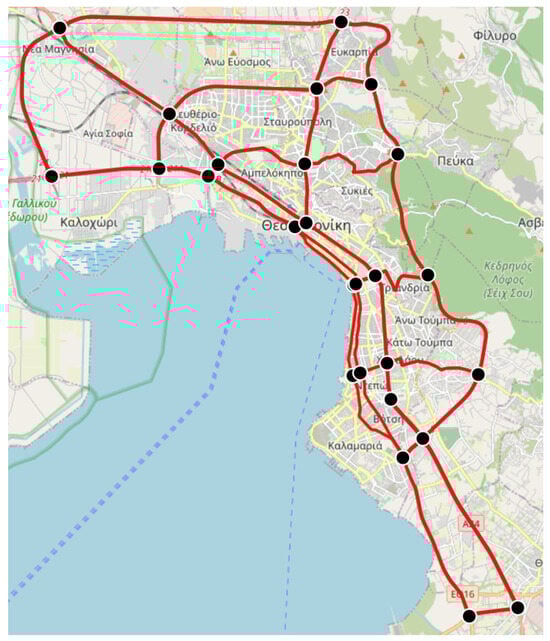
Figure 2.
Case study network, where the red lines indicate the network links and the black circles indicate the network nodes.
The application of the proposed framework to the case study network required the definition of routes for the various O-D pairs. The O-D pairs were defined based on the most typical routes used by travelers in the city of Thessaloniki. Multiple routes for each O-D pair were considered, to capture the variability in traveler choices in a real-life network. These routes were defined using historical traffic pattern data from representative samples of private and commercial CVs, provided by Floating Car Data (FCD) from (CERTH-HIT). This approach ensured diversity and accurately reflected the reality of travelers’ having multiple route choices. The dataset used to run the multiclass traffic assignment part of the model is publicly available on Zenodo (https://zenodo.org/records/11504432, accessed on 8 July 2024).
3.1. Development of Strategic Games
The development of strategic games allows us to comprehensively assess the proposed framework’s performance and develop traffic management policies for a mixed traffic network. These strategic games represent typical network conditions in the case study network and help in evaluating and quantifying the framework outputs for situations that resemble typical daily traffic scenarios. A key element in the strategic games’ design is the integration of a sensitivity analysis through the concept of a systematic variance in traffic demands for the three different players. This sensitivity analysis integration concept has the objective of identifying critical thresholds.
3.2. Key Performance Indicators
The evaluation metrics used to quantify the framework outcomes across the various strategic games were selected to capture Key Performance Indicators (KPIs) of the case study network. The purpose was to represent the network’s dynamics under the coexistence of the different players and express these dynamics in terms of network efficiency indicators. These indicators express parameters of sustainability, efficiency, and user experience and are either extracted directly from the framework outcomes or calculated based on the latter. The KPIs are presented in Table 1 below.

Table 1.
Evaluation metrics used to quantify framework outcomes across various strategic games.
Moreover, the link total travel time was reprocessed using the BPR function [], which is specifically formulated for the road network of Thessaloniki, to refine the values generated by the model and convert them to more realistic ones. The formula is presented below:
where
- : link total travel time;
- : link free flow travel time;
- : link total flow;
- : link capacity.
The parameters and were selected for each link of the case study network according to Table 2 [], which presents the various values of the parameters α and β calculated from the BPR function.
Table 2.
Parameters α and β from the BPR function used for the case study network.
The link total CO2 emissions were calculated according to [], assuming the vehicles in the case study network belonged to the category of passenger cars using diesel fuel: Euro 4.
3.3. Strategic Games
The games were designed under the principle of Nash equilibrium [], where each player acts rationally and independently, seeking to optimize their own performance within the case study network. The players operate simultaneously, making decisions based on their individual objectives and the available information. The strategy of each player influences the payoffs of the other players.
The allocation of the total network demand for each O-D pair is examined among four players, UE, SO, CN1, and CN2. A demand allocation–distribution mechanism was designed to capture the behavior and the characteristics of each player in each game. The logic for the demand allocation begins with the assignment of a portion of the total demand to the UE player, followed by a portion to the SO player. The remaining demand is then allocated among the two CN players, considering factors such as market share and user base. A sensitivity analysis is performed by varying the demand allocation percentages among the players to understand how different network situations affect the equilibrium conditions and the overall network performance.
Strategic Game for SO Player Dominance
In a strategic game resembling the conditions of SO player dominance, a central governing authority responsible for centralized traffic management and information provision increases its resources and capabilities to improve real-time information and service provisions to travelers. Private service providers have a minimal presence in the market, and only a few travelers rely on their services. This strategic game relies on a gradual increase in the number of travelers who have access to and use the real-time information provided by the central governing authority (SO player).
To represent the increased demand allocation to the SO player, a gradual increase in the demand allocated to the SO player is performed, followed by a reduction to the demand allocated to the UE player. This allocation of a lower percentage of the total demand to the UE player reflects a shift away from conventional commuting patterns. The objective of this strategic game is to observe how an increased allocation to the SO player affects network equilibrium and performance.
The allocation of increased demand to the SO player reflects several conditions within the road network that could drive the demand towards more reliance on SO behavior. One of the primary reasons for increased demand allocation to the SO player is a significant improvement in the provision of real-time information to travelers by a central governing authority, including the deployment of a network of VMS installations throughout the city, providing up-to-the-minute traffic information, travel times, suggested routes, and congestion and accident information.
Furthermore, the central governing authority could promote a culture of cooperative optimization among travelers by actively encouraging the use of real-time data for route decisions. Public awareness campaigns, training programs, events, and workshops could educate travelers about the benefits of using real-time information to optimize their routes, emphasizing the advantages of collective optimization. Additionally, the central governing authority could introduce incentives, such as access to dedicated lanes and parking spots, for travelers who follow routing recommendations.
Table 3 below presents the traffic demand allocations among the four players in the strategic game, defined in terms of various scenarios.
Table 3.
Traffic demand allocation among the four players in the strategic game, defined in terms of various scenarios.
The results of this strategic game are compared to those of a strategic game representing a network situation which consists mainly of travelers complying with the UE player strategy. This scenario reflects the limited involvement of the central governing authority and the low market penetration of private service providers. The central governing authority, which is responsible for centralized traffic management, has limited resources and capabilities in this scenario. The detailed presentation of the results of this game is beyond the scope of this work, as they serve only comparison purposes.
3.4. Results
The main result observed across all the scenarios (2.a to 2.f) of the strategic game is a consistency in the links’ total flows, total travel times, and total delay patterns. The links that accumulate the highest total flows, total travel times, and total delays are identical to those in the situation of UE player dominance, although (obviously) with different values. This result indicates that there are underlying factors or network characteristics beyond the players’ strategies that influence overall system behavior.
The stability in the indicators’ patterns suggests that changes in the demand percentages of the four players do not lead to significant alterations in the overall network dynamics. This result could be attributed to the limited impact of the CN players, as their total demand remains relatively low, i.e., at 5% each. This limited penetration rate of CVs in the network is not sufficient to cause substantial changes in the overall traffic dynamics compared to the case where conventional drivers dominate (UE player dominance). Moreover, the role of the SO player, with demand percentages ranging from 20% to 70%, does not seem significant enough to override the dominant influence of the UE player. This could lead to the interpretation that SO network-wide optimization goals may play only an intermediate role without drastically altering the overall equilibrium in the network. Network characteristics, such as the road network’s structure and the link configurations, seem to contribute to the observed consistency in the results, as certain critical links or routes consistently experience higher costs, irrespective of the changes in the players’ demand percentages.
The observed changes across Scenarios 2.a to 2.f relate to the distribution of the players’ flows across the case study network links. The observed change in the players’ link flows reflects the dynamic interactions and adjustments between the SO and UE players as their demand percentages vary. Each scenario represents a different equilibrium state, with the observed variation in the players’ link flows indicating the system’s responsiveness to these changes. The demand percentages for each scenario of the strategic game are presented in Figure 3 below, while the shifts in the dominant players’ (UE and SO) link flows across Scenarios 2.a to 2.f are presented on the network maps in Figure 4.
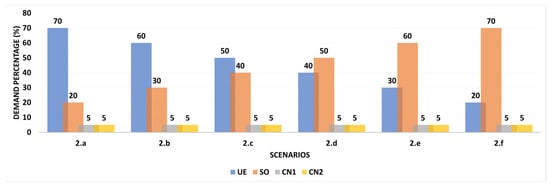
Figure 3.
Players’ demand percentages across the different scenarios of the strategic game.
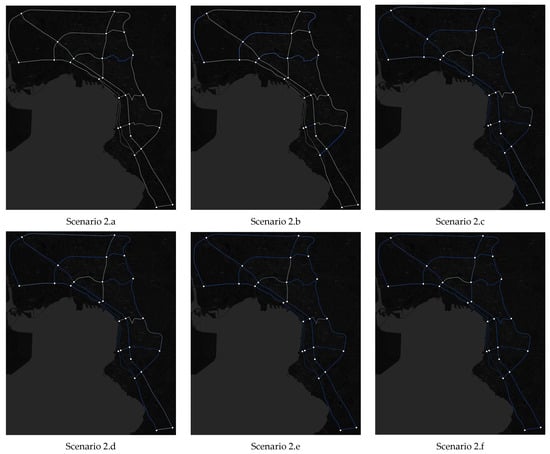
Figure 4.
SO-dominant link flows (blue) and UE-dominant link flows (gray) across the different scenarios of the strategic game.
As can be seen by inspecting Figure 4, in Scenario 2.a, where the UE player is dominant, the UE flows outscore all other players’ flows across all network links. Transitioning to Scenario 2.b, subtle shifts emerge as a few links (some sections in the eastern and western parts of the Peripheral Ring Road and a few road segments connecting the west part of the city to the Peripheral Ring Road) show heightened SO flows. The greatest shift is observed in Scenario 2.c, where almost the whole network experiences an increase in SO flows, with only a few secondary road segments maintaining higher UE flows.
In Scenario 2.d, a slight increase is observed in the number of road segments experiencing higher UE flows, mainly in road segments that serve as connectors of the city center and the eastern central part of the city to the Peripheral Ring Road. As the demand percentage of the SO player increases from 20% to 40%, the system experiences a transition toward a more optimized state. The SO player, with its focus on overall network efficiency, starts influencing the traffic patterns on more links. This results in higher flows on links favored by the SO player as it aims to balance the overall network. More specifically, in Scenario 2.d, where the SO demand increases to 50%, there is a delicate balance between the UE and SO flows. Some links still show higher UE flows, indicating that the dominance of the UE player persists on specific routes. The SO player’s influence is significant but not yet enough to outscore UE player preferences on all links. The SO player, with its goal of minimizing overall system travel costs, encourages the traffic’s distribution along the specific routes mentioned above, which seem to have the capability to balance the network’s efficiency.
Finally, in Scenarios 2.e and 2.f, a gradual decrease is noted in the relative significance of these links in the network dynamics. As the demand of the UE player decreases from 30% to 20%, the influence of the player decreases as well. The SO player gains more control over traffic distribution, resulting in higher flows on links preferred by him/her. This shift continues and, by Scenario 2.f, the UE player’s dominance decreases further.
Regarding the consistency in the results of Scenarios 2.a to 2.f, the link’s average “perceived cost”—travel time—for the four players follows the same pattern across all scenarios, with the SO player having the highest value, followed by the CN1 and CN2 players, and last by the UE player. The network-wide optimization strategy of the SO player incurs higher average “costs” for his/her users. This result follows the player’s decision—making processes for optimizing the overall efficiency of the network, even if they involve rerouting traffic, with consequences. While the SO player aims for holistic optimization, the CN players strike a balance between cooperative strategies and individual benefits. The UE player, prioritizing self-interested objectives, incurs lower “perceived costs” for his/her users, contributing, however, to suboptimal overall network efficiency.
In terms of overall network performance, the lowest link average total travel time, lowest link average total delay, highest link speed, and lowest link average total CO2 emissions occur in Scenario 2.b, suggesting that the demand distribution in this scenario leads to a more favorable equilibrium in the overall performance of the network. In Scenario 2.b, with a demand distribution of SO: 30%, UE: 60%, and CN1 = CN2: 5%, there appears to be a balance between the SO player, who pursues network-wide optimization, and the UE player, who prioritizes individual costs minimization. This balance may result in a more efficient allocation of traffic flows across the network, leading to improved traffic efficiency and to the minimization of environmental impacts. The presence of the CN players, even at a relatively low demand percentage of 5% each, may also contribute to improved traffic distribution.
While the UE player’s demand is still dominant in Scenario 2.b, it is lower than in Game 1 (UE: 80% demand). This reduction in the UE player’s dominance seems to lead to a more balanced distribution of traffic, considering both individual- and network-wide optimization objectives. The specific distribution of demand percentages among the four players in Scenario 2.b seems to create a synergistic effect, where the SO player’s influence is substantial, but there are also cooperative contributions from the CN players. This strategic distribution seems to lead to a more harmonious traffic equilibrium, with better payoffs for the whole network in terms of all indicators.
The sensitivity of the network to demand distributions is evident, particularly in scenarios that achieve better equilibrium configurations. More specifically, Scenario 2.b demonstrates the most favorable equilibrium, indicating that achieving optimal equilibrium involves a careful balance between the players’ demand percentages. The overall network performance improvements observed in Scenario 2.b could guide traffic management policies to emphasize schemes that incorporate both cooperative and individualistic behaviors at certain penetration rates.
However, the links’ average total travel time and delay are highest in Scenarios 2.c and 2.d, despite the relatively balanced distribution of UE and SO demands. Such an outcome indicates that the degree of network-wide optimization achieved by the SO player in these scenarios might still be insufficient to override the individual objectives of the UE player, even in the case of a balanced presence of both players in the network. Additionally, the 5% demand allocated to each CN player does not significantly impact the network dynamics, indicating that their influence is minimal at this penetration rate.
The figures below present the links’ average total travel time and average total delay across all scenarios of the strategic game (Figure 5 and Figure 6) and the links’ speed and average total CO2 emissions as well (Figure 7 and Figure 8).
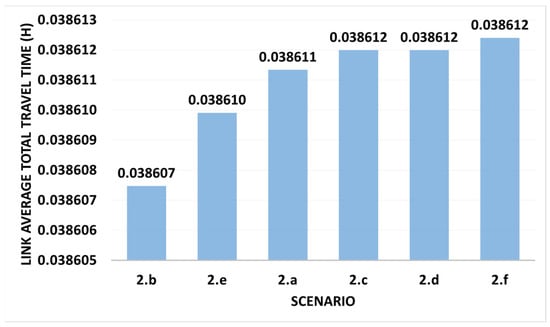
Figure 5.
Link average total travel time across all scenarios of the strategic game.
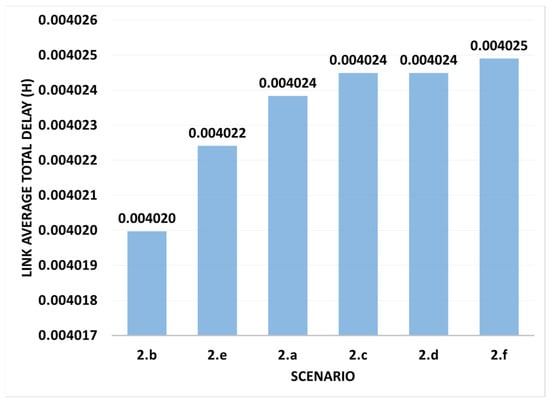
Figure 6.
Link average total delay across all scenarios of the strategic game.
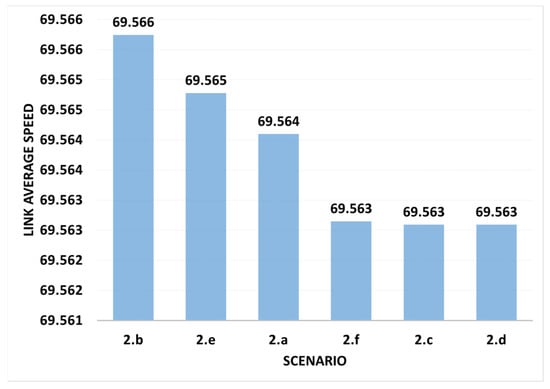
Figure 7.
Link average speed across all scenarios of the strategic game.
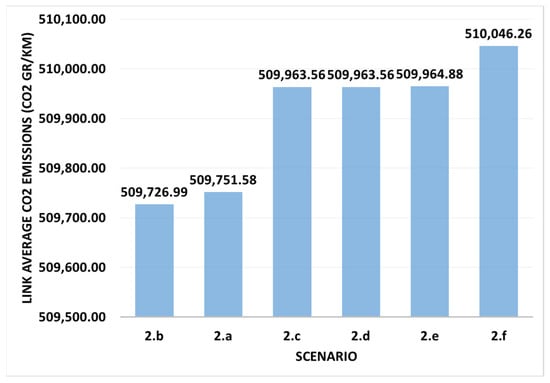
Figure 8.
Link average total CO2 emissions across all scenarios of the strategic game.
4. Discussion
Based on the nature of this strategic game, where the focus is on the examination of SO dominance in the network, traffic management policies should center around the concept of network-wide optimization measures and their balance with individual goals.
The empowerment of the SO player, expressed through the increased role of a central governing authority, leads to the development and implementation of policies that allow for their strategic influence of traffic patterns across the entire network. The prioritization of traffic signal coordination and management on the routes that were identified to contribute to network-wide optimization would ensure smoother traffic flows aligned with the SO player’s objectives. This could be achieved through the introduction of dynamic traffic management systems that allow the central governing authority to adapt traffic signal timings and lane allocations based on real-time data and evolving demand scenarios. Moreover, incentivizing effective traffic rerouting could be achieved through the design of financial incentives, i.e., reduced parking fees and lower public transport ticket prices, which reward SO drivers for successful rerouting strategies that contribute to network balance and cost minimization.
The role of urban mobility planning is evident in the achievement of a balance between individual and network-wide goals, as through urban mobility planning activities both cooperative and competitive elements among players can be seamlessly integrated, fostering a holistic approach to traffic equilibrium.
In general, the implementation of adaptive planning strategies that allow for continuous adjustments based on evolving demand patterns could ensure that policies remain effective in balancing individual and network-wide goals. Moreover, the establishment of public input mechanisms for public input in the urban mobility planning process could allow travelers to contribute insights into their travel preferences while considering broader system optimization goals.
Overall, adopting regulatory flexibility, such as an agile framework that allows for adjustments based on real-time data and performance metrics, combined with pilot projects to test policy effectiveness, can create an environment that empowers the central governing authority.
With respect to a multi-player perspective, the proposed framework considers the preferences and behaviors of three different entities, i.e., drivers of conventional vehicles (the UE player), drivers compliant to real-time information provided by a central governing authority (the SO player), and the drivers of CVs with access to C-ITS services from private service providers (the CN player). This allows traffic managers to understand how different decision-making criteria impact traffic flow patterns, leading to policy and infrastructure decisions, as the simulation of the different player behaviors and their effects on traffic flow distributions provide insights into network efficiency. Bottlenecks, congestion-prone areas, and underutilized routes can be identified, facilitating the prioritization of targeted improvements for optimal traffic flow.
The proposed framework’s ability to analyze the route choices of different types of drivers enhances our understanding of how commuters make decisions in a mixed traffic environment. This insight can guide the design of better route information systems, signage, and incentives to promote route choices that alleviate congestion. The impact of policy interventions on traffic flows is an aspect that can be assessed by the proposed model. Considering aspects of transport infrastructure planning, the simulation of traffic flow patterns under different types of driver penetration rates could assist in long-term infrastructure planning through the identification of capacity expansions or new roadways for CVs.
The SO and CN players in the model demonstrate the cooperative nature of CVs. Real-time information sharing and collaboration with a central governing authority can contribute to the collective optimization of traffic flows, to reductions in congestion, and to the enhancement of overall mobility efficiency. The SO player’s relationship to a central governing authority mirrors the integration of centralized traffic management in connected mobility scenarios. This integration allows for real-time monitoring, control, and information dissemination, enabling proactive traffic management strategies. As CVs become more prevalent, this framework could serve as a testing ground for integrating their real-time data into traffic management systems. This integration could help optimize traffic signal timings, route guidance, and incident management, leveraging the collective intelligence of CVs.
With respect to game theory concepts, the present study exploits such concepts to capture the decision-making behaviors of different players within a network. The players represent different stakeholders with distinct preferences and objectives related to route choices. The three different players are players of a strategic game. Each player seeks to optimize his/her utility (cost) while considering the actions of the others. The different behaviors of the players and their impacts on the traffic flow are analogous to their strategic interactions within the game. Each player aims to make the best decision based on their individual objectives and the anticipated actions of the other players.
Following Nash equilibrium principles, no player has an incentive to unilaterally deviate from his/her strategy. The iteration process of the proposed framework algorithm serves as a convergence towards equilibrium, where players’ actions and decisions are stabilized based on the interplay of various factors. Specifically, route choice is modeled as a game, where the decisions made by the players align with their strategies and affect the overall outcome, i.e., the traffic distribution in the network.
The algorithm proposed in this study targets the optimization of two interdependent optimization problems. Its upper level represents the management of the overall network, optimizing the traffic flow distribution across the network, with the objective of minimizing the total travel time, congestion, and other metrics by handling link flows and route choices. Its lower level represents the route choice decisions made by players, where each player aims to minimize their individual costs, considering the costs resulting from the upper-level optimization. The bilevel optimization structure ensures that upper-level decisions influence lower-level player choices, determining the link costs that affect route selection.
Further Research
The directions for further research relate first to the proposed model’s enhancement and extension, to address any drawbacks through the integration of new variables and parameters capable of capturing additional dimensions of CCAM technologies and their relationship to traffic management. Enhancements could include the incorporation of advanced algorithms and simulation techniques as well, enabling the prediction of different scenarios, such as accidents and adverse weather conditions. Integrated simulation techniques could evaluate the performance of various traffic management strategies that include CCAM technologies under unexpected event scenarios. The resilience and preparedness of transport systems could be examined with an emphasis on the resilience of CCAM-enabled networks and their capability to bolster the performance of conventional networks in adverse events.
From the perspective of sustainability and the environment, the integration of sustainability metrics and environmental factors could be carried out for the evaluation of the ecological footprint of mixed traffic networks in transport systems. This way, the potential of CCAM technologies could be further investigated and more precisely measured to promote greenhouse emission reductions, air quality improvement, and sustainable mobility trends.
Overall, the integration of tailored cost functions into the proposed model, considering objectives beyond travel time, could provide a tool for a more holistic approach to traffic management. In such a framework, cost functions that consider air quality and vehicles’ emissions and fuel consumption could be developed to represent the distinct decision-making processes of the various types of drivers in the network. Environmental impact metrics, such as CO2 emissions and air pollutant concentrations, could be integrated into the cost functions and data on vehicle types, while fuel efficiency and traffic patterns could further enhance them. From another perspective, the inclusion of safety-related parameters into these cost functions could be examined, considering factors such as accident rates, the severity of accidents, proximity to high-risk areas, and the cost of damages. This concept could focus on the prioritization and development of traffic management and control strategies for certain routes capable of an increase in road safety. The performance of these strategies could be assessed using historical accident data and road infrastructure characteristics.
The extension of the proposed model to capture all users (any transport mode) in a road network could serve as a tool for a more comprehensive understanding of the stakeholders’ dynamics and facilitate the development of personalized traffic management strategies that account for both social welfare and individual goals. Leveraging game theory and multi-class traffic assignment, the identification and definition of various classes of users could be performed, extending beyond drivers of conventional and C-ITS-equipped vehicles to public transport fleets, cyclists, pedestrians, micromobility users, logistics companies, and emergency vehicle fleets, with each being attributed distinct characteristics and behaviors. Players’ strategies and interactions could consider elements such as road space and priority negotiations. The respective cost functions of the users’ classes should be enhanced with parameters such as the comfort of each transport mode. The core concepts of User Equilibrium and System Optimum could be combined with the principles of discrete choice theory to integrate mode choice models that would simulate the individual characteristics, trip attributes, and perceived utility of each user class. Moreover, dynamic user behaviors including mode switching could be accounted for in relation to changing network conditions.
Following this logic, the dimension of the coexistence of autonomous vehicles (AVs) with conventional and C-ITS-equipped ones could be investigated. In this area, the aspects that could be considered include AV factors such as lane-changing behaviors, sensing capabilities, perception, decision-making, and control algorithms. The decision-making strategies of AV drivers could be investigated in the context of adding integration algorithms for trajectory planning, path following, obstacle avoidance, and collision avoidance into their cost functions. Furthermore, the dimension of AVs’ capability for communication with C-ITS-equipped vehicles and infrastructure, i.e., traffic signals, road signs, and traffic management centers, could be examined to determine whether it is feasible to integrate them into the model.
5. Conclusions
The aim of this work was to propose an innovative framework that integrates traffic assignment with game theory principles for the examination and analysis of strategic interactions in mixed road traffic networks. Three different types of players, i.e., Uncooperative Egoistic (UE), System Optimizer (SO), and Cournot–Nash (CN) players, were integrated into a multiclass traffic assignment model to assess the manner in which various levels of central governing authority control impact traffic management. The key findings showcase that the SO player’s strategies significantly enhance overall network efficiency but should be balanced with the user-centric behaviors of the UE and CN players to achieve the optimal traffic distribution. The case study network examined (the city of Thessaloniki) indicates that through the implementation of a mixed approach that combines centralized and decentralized elements, better traffic outcomes are generated, such as reduced travel times, delays, and CO2 emissions. Future research suggestions include the scaling and expansion of the proposed framework to different networks and the integration of more complex player behaviors. Furthermore, the coupling of the framework with existing traffic management systems could enhance real-time data exchange and decision-making, thus providing valuable insights for policy and infrastructure planning. Overall, a comprehensive solution for optimizing traffic management is proposed, considering both conventional vehicles and CVs, with the objective of contributing to the establishment of safer, more efficient, and more sustainable urban transport systems.
Author Contributions
Conceptualization, A.K., I.P. and E.M.; Methodology, A.K. and I.P.; Validation, I.P. and E.M.; Formal analysis, A.K.; Resources, E.M.; Writing—original draft, A.K.; Writing—review & editing, A.K. and I.P.; Visualization, A.K.; Supervision, I.P. and E.M.; Project administration, E.M. All authors have read and agreed to the published version of the manuscript.
Funding
The work was funded by the Special Account for Research Funds of the Aristotle University of Thessaloniki (AUTh), under the project with ID: 74353.
Institutional Review Board Statement
Not applicable.
Informed Consent Statement
Not applicable.
Data Availability Statement
The raw data supporting the conclusions of this article will be made available by the authors on request.
Conflicts of Interest
The authors declare no conflict of interest.
References
- Baskar, L.; De Schutter, B.; Hellendoorn, J.; Papp, Z. Traffic control and intelligent vehicle highway systems: A survey. IET Intell. Transp. Syst. 2011, 5, 38–52. [Google Scholar] [CrossRef]
- Fernandes, P.; Nunes, U. Platooning with IVC-Enabled Autonomous Vehicles: Strategies to Mitigate Communication Delays, Improve Safety and Traffic Flow. IEEE Trans. Intell. Transp. Syst. 2012, 13, 91–106. [Google Scholar] [CrossRef]
- Kim, S.-W.; Gwon, G.-P.; Choi, S.-T.; Kang, S.-N.; Shin, M.-O.; Yoo, I.-S.; Lee, E.-D.; Frazzoli, E.; Seo, S.-W. Multiple vehicle driving control for traffic flow efficiency. In Proceedings of the 2012 IEEE Intelligent Vehicles Symposium, Madrid, Spain, 3–7 June 2012; pp. 462–468. [Google Scholar]
- Abdelkader, G.; Elgazzar, K.; Khamis, A. Connected Vehicles: Technology Review, State of the Art, Challenges and Opportunities. Sensors 2021, 21, 7712. [Google Scholar] [CrossRef] [PubMed]
- Kotsi, A.; Mitsakis, E. C-ITS enabled dynamic traffic management as a service. In Proceedings of the Workshop Models and Methods for Researching Information Systems in Transport 2020, St. Petersburg, Russia, 11–12 December 2020; pp. 184–189. [Google Scholar]
- Washimi, K. Traffic Management System Toward Connected and Automated Vehicles Era. SEI Tech. Rev. 2019, 88, 71. [Google Scholar]
- Kerber, W. Data governance in connected cars: The problem of access to in-vehicle data. J. Intellect. Prop. Inf. Technol. Electron. Commer. Law 2018, 9, 310. [Google Scholar]
- Alghuson, M.K.; Abdelghany, K. Telematics-Based Traffic Law Enforcement and Network Management System for Connected Vehicles. IEEE Internet Things J. 2021, 8, 12384–12397. [Google Scholar] [CrossRef]
- Li, S.; Sui, P.-C.; Xiao, J.; Chahine, R. Policy formulation for highly automated vehicles: Emerging importance, research frontiers and insights. Transp. Res. Part A Policy Pract. 2019, 124, 573–586. [Google Scholar] [CrossRef]
- Andraško, J.; Hamuľák, O.; Mesarčík, M.; Kerikmäe, T.; Kajander, A. Sustainable Data Governance for Cooperative, Connected and Automated Mobility in the European Union. Sustainability 2021, 13, 10610. [Google Scholar] [CrossRef]
- Li, J.; Yu, C.; Shen, Z.; Su, Z.; Ma, W. A survey on urban traffic control under mixed traffic environment with connected automated vehicles. Transp. Res. Part C Emerg. Technol. 2023, 154, 104258. [Google Scholar] [CrossRef]
- Gruyer, D.; Orfila, O.; Glaser, S.; Hedhli, A.; Hautière, N.; Rakotonirainy, A. Are Connected and Automated Vehicles the Silver Bullet for Future Transportation Challenges? Benefits and Weaknesses on Safety, Consumption, and Traffic Congestion. Front. Sustain. Cities 2021, 2, 607054. [Google Scholar] [CrossRef]
- Jadaan, K.; Zeater, S.; Abukhalil, Y. Connected Vehicles: An Innovative Transport Technology. 2017. [Procedia Engineering]. Available online: https://www.sciencedirect.com (accessed on 16 April 2024).
- Wardrop, J.G.; Whitehead, J.I. Correspondence. Some Theoretical Aspects of Road Traffic Research. Proc. Inst. Civ. Eng. 1952, 1, 767–768. [Google Scholar] [CrossRef]
- Peeta, S.; Mahmassani, H.S. System optimal and user equilibrium time-dependent traffic assignment in congested networks. Ann. Oper. Res. 1995, 60, 81–113. [Google Scholar] [CrossRef]
- Ahmad, F.; Al-Fagih, L. Game Theory Applications in Micro and Macroscopic Simulation in Transportation Network: A Comprehensive Review. IEEE Access 2023, 11, 93635–93663. [Google Scholar] [CrossRef]
- Chen, O.; Ben-Akiva, M. Game-Theoretic Formulations of Interaction Between Dynamic Traffic Control and Dynamic Traffic Assignment. Transp. Res. Rec. J. Transp. Res. Board 1998, 1617, 179–188. [Google Scholar] [CrossRef]
- Li, C.; Anavatti, S.G.; Ray, T. Application of a non-cooperative game theory based traffic assignment. In Proceedings of the 2013 International Conference on Advances in Computing, Communications and Informatics (ICACCI), Mysore, India, 22–25 August 2013; pp. 1124–1128. [Google Scholar]
- Levy, N.; Klein, I.; Ben-Elia, E. Emergence of cooperation and a fair system optimum in road networks: A game-theoretic and agent-based modelling approach. Res. Transp. Econ. 2018, 68, 46–55. [Google Scholar] [CrossRef]
- Wang, C.; Tang, Y.-Q. The discussion of system optimism and user equilibrium in traffic assignment with the perspective of game theory. Transp. Res. Procedia 2017, 25, 2970–2979. [Google Scholar] [CrossRef]
- Larsson, T.; Patriksson, M. Side constrained traffic equilibrium models—Traffic management through link tolls. In Equilibrium and Advanced Transportation Modelling; Springer: Boston, MA, USA, 1998; pp. 125–151. [Google Scholar]
- Wang, D.-J.; Yan, Q.-P.; Luo, S.-L. Game-theory based analysis and research of the urban traffic demand management model and underlying problems. In Logistics: The Emerging Frontiers of Transportation and Development in China; American Society of Civil Engineers: Reston, VA, USA, 2009; pp. 160–167. [Google Scholar]
- Du, L.; Chen, S.; Han, L. Coordinated Online In-Vehicle Navigation Guidance Based on Routing Game Theory. Transp. Res. Rec. 2015, 2497, 106–116. [Google Scholar] [CrossRef]
- Shang, L.; Aziz, A.M.A. Stackelberg Game Theory-Based Optimization Model for Design of Payment Mechanism in Performance-Based PPPs. J. Constr. Eng. Manag. 2020, 146, 04020029. [Google Scholar] [CrossRef]
- Yue, D.; You, F. Stackelberg-game-based modeling and optimization for supply chain design and operations: A mixed integer bilevel programming framework. Comput. Chem. Eng. 2017, 102, 81–95. [Google Scholar] [CrossRef]
- Burger, C.; Fischer, J.; Bieder, F.; Tas, O.S.; Stiller, C. Interaction-Aware Game-Theoretic Motion Planning for Automated Vehicles using Bi-level Optimization. In Proceedings of the 2022 IEEE 25th International Conference on Intelligent Transportation Systems (ITSC), Macau, China, 8–12 October 2022; pp. 3978–3985. [Google Scholar]
- Kang, K.; Rakha, H.A. Game Theoretical Approach to Model Decision Making for Merging Maneuvers at Freeway On-Ramps. Transp. Res. Rec. 2017, 2623, 19–28. [Google Scholar] [CrossRef]
- Wang, H.; Zhang, X. Game theoretical transportation network design among multiple regions. Ann. Oper. Res. 2014, 249, 97–117. [Google Scholar] [CrossRef]
- Chen, W.; Ren, G. A Game Theory-Based Approach for Modeling Freeway On-Ramp Merging and Yielding Behavior in an Autonomous Environment. In Proceedings of the CICTP 2022, Changsha, China, 8–11 July 2022; pp. 45–56. [Google Scholar]
- Altman, E.; Basar, T.; Srikant, R. Nash equilibria for combined flow control and routing in networks: Asymptotic behavior for a large number of users. IEEE Trans. Autom. Control 2002, 47, 917–930. [Google Scholar] [CrossRef]
- Altman, E.; Basar, T.; Jimenez, T.; Shimkin, N. Competitive routing in networks with polynomial costs. IEEE Trans. Autom. Control 2002, 47, 92–96. [Google Scholar] [CrossRef]
- Boulogne, T.; Altman, E.; Kameda, H.; Pourtallier, O. Mixed equilibrium (ME) for multiclass routing games. IEEE Trans. Autom. Control 2002, 47, 903–916. [Google Scholar] [CrossRef]
- Harker, P.T. Multiple Equilibrium Behaviors on Networks. Transp. Sci. 1988, 22, 39–46. [Google Scholar] [CrossRef]
- Yang, H.; Zhang, X.; Meng, Q. Stackelberg games and multiple equilibrium behaviors on networks. Transp. Res. Part B Methodol. 2007, 41, 841–861. [Google Scholar] [CrossRef]
- Yang, H.; Huang, H.-J. Principle of marginal-cost pricing: How does it work in a general road network? Transp. Res. Part A Policy Pract. 1998, 32, 45–54. [Google Scholar] [CrossRef]
- Miller, T.C.; Tobin, R.L.; Friesz, T.L. Stackelberg Games on a Network with Cournot-Nash Oligopolistic Competitors. J. Reg. Sci. 1991, 31, 435–454. [Google Scholar] [CrossRef]
- Sheffi, Y. Urban Transportation Networks; Prentice-Hall: Englewood Cliffs, NJ, USA, 1985; Volume 6. [Google Scholar]
- R: The R Project for Statistical Computing (r-project.org). Available online: https://www.r-project.org/ (accessed on 20 February 2023).
- Mitsakis, E.A. Optimal Design of Transport Networks. Ph.D. Thesis, The Aristotle University of Thessaloniki, Thessaloniki, Greece, 2011. [Google Scholar]
- Available online: https://www.eea.europa.eu/emep-eea-guidebook (accessed on 15 January 2024).
- Kreps, D.M. Nash equilibrium. In Game Theory; Palgrave Macmillan: London, UK, 1989; pp. 167–177. [Google Scholar]
Disclaimer/Publisher’s Note: The statements, opinions and data contained in all publications are solely those of the individual author(s) and contributor(s) and not of MDPI and/or the editor(s). MDPI and/or the editor(s) disclaim responsibility for any injury to people or property resulting from any ideas, methods, instructions or products referred to in the content. |
© 2024 by the authors. Licensee MDPI, Basel, Switzerland. This article is an open access article distributed under the terms and conditions of the Creative Commons Attribution (CC BY) license (https://creativecommons.org/licenses/by/4.0/).