Article

Impact of Environmental Conditions on Soil Geochemistry in Southern Kazakhstan

by
Anuarbek A. Kakabayev
1,
Botagoz U. Sharipova
1,
Natalia V. Baranovskaya
2,
Javier Rodrigo-Ilarri
3,*,
María-Elena Rodrigo-Clavero
3,
Giuseppe Lo Papa
4,
Ekaterina A. Bazilevskaya
5,
Svetlana Muratbekova
1,
Nurgul Nurmukhanbetova
1,
Shynar Durmekbayeva
6,
Gaziza B. Toychibekova
7,
Rakhat Kurmanbayev
8 and
Aigul Zhumabayeva
1
1
Scientific Research Laboratory on Water Quality, Sh. Ualikhanov Kokshetau University, Abai Str., 76, Kokshetau 020000, Kazakhstan
2
Department of Geoecology and Geochemistry, National Research Tomsk Polytechnic University, Tomsk 634050, Russia
3
Instituto de Ingeniería del Agua y del Medio Ambiente (IIAMA), Universitat Politècnica de València, 46022 Valencia, Spain
4
Department of Agricultural, Food and Forest Sciences, University of Palermo, Viale delle Scienze Palermo, 90128 Palermo, Italy
5
Department of Ecosystem Science and Management, The Pennsylvania State University, 409 Agricultural Sciences and Industries Building, University Park, PA 16802, USA
6
Department of Biology, Pedagogical Institute, Shokan Ualikhanov Kokshetau University, Abai Str., 76, Kokshetau 020000, Kazakhstan
7
Department of Ecology and Chemistry, Yasawi International Kazakh-Turkish University, Turkestan City 161200, Kazakhstan
8
Department of Biology, Geography and Chemistry, Korkyt Ata Kyzylorda University, Kyzylorda 120000, Kazakhstan
*
Author to whom correspondence should be addressed.
Sustainability 2024, 16(15), 6361; https://doi.org/10.3390/su16156361
Submission received: 20 June 2024 / Revised: 17 July 2024 / Accepted: 20 July 2024 / Published: 25 July 2024

Abstract

:
This study investigated the elemental composition of soils in Kyzylorda and Turkestan (southern Kazakhstan), an area rich in natural resources but facing potential environmental threats from industry and agriculture. The goal was to establish baseline geochemical values and assess soil contamination risks. Soil samples were collected from across the region and analyzed using ICP-MS and INAA techniques, providing a comprehensive profile of 72 elements. Statistical analysis revealed significant variations in elemental concentrations, with enrichments observed for specific elements when compared with reference values. Notably, both regions shared a core set of elements including rare earth elements (yttrium series: holmium, erbium, thulium), noble metals (gold, platinum, ruthenium, palladium), and tungsten. Enrichment patterns, however, provided distinct insights. Rare earth element enrichments likely reflect the region’s geology, while elevated radioactive elements necessitate further investigation to understand potential environmental and health risks. Enrichment of iron group elements might be linked to a combination of geological factors and anthropogenic activities like mining or industrial processes. A significantly higher number of elements exceeded background levels in Kyzylorda compared with Turkestan, suggesting greater element accumulation in Kyzylorda’s soil. This difference could be attributed to variations in regional geology or historical anthropogenic activities. The established geochemical baseline for 72 elements and the identified areas of potential contamination will inform land management practices, guide future environmental monitoring efforts, and ultimately contribute to the safeguarding of public health in southern Kazakhstan.

1. Introduction

Environmental pollution stands as one of the most pressing challenges facing our modern world. Natural factors, alongside human activities (anthropogenic factors), harm the health of ecosystems, creating an urgent need for comprehensive environmental assessments. In numerous urban centers across the globe, alarming levels of pollution have impaired the vital agroecological functions of soils [1,2]. Cultivating food crops near areas ravaged by anthropogenic pollution poses a significant risk. These crops can take up high levels of chemical elements from the contaminated soil, ultimately leading to their fixation within the plants themselves. This absorption can disrupt enzymatic processes, carbohydrate and protein metabolism, as acidic environments favor the formation of mobile forms of aluminum, iron, manganese, and copper, which can poison plants at high concentrations. Acidic soil reduces the presence of beneficial microorganisms that fix nitrogen, thus slowing down its accumulation and the nitrogen nutrition of plants. For instance, large-scale human activity is blamed for the ecological crisis in the Aral Sea region. The widespread expansion of irrigation areas in the Syr Darya and Amu Darya river valleys was accompanied not only by water withdrawal, disruption of the hydrological regime of rivers, salinization of fertile lands, but also by the introduction of a huge amount of chemicals into the environment [3,4].
Air pollution, caused by increasing industrial activities, is another major risk factor for human health. These industrial pollutants are persistent and spread widely throughout the environment, where they are toxic to living things. These elements eventually settle in the soil, where they become fixed. Additionally, they can be transferred through food webs, increasing in concentration as they move up the chain [5,6,7]. Kazakhstan faces numerous environmental challenges due to its extensive industrial development. The nation copes with desertification, human-driven soil degradation, scarce and polluted water resources, and air pollution that threatens public health [8,9,10,11,12,13,14,15,16,17,18]. Forests have shrunk, leading to biodiversity loss [19]. Industrial and radiation pollution, alongside the accumulation of toxic and hazardous waste, further burden the country [20,21].
The combination of these environmental problems highlights the varied nature of human-caused (anthropogenic) soil pollution. Studies show that sources and types of soil contamination vary greatly depending on location. Large industrial facilities are especially concerning, creating zones of pollution that spread beyond their borders. These zones contain not only heavy metals but also a wide variety of other harmful chemicals. Due to South Kazakhstan’s concentration of industrial, mining, and oil refining enterprises, a comprehensive study of the region’s soil chemistry is particularly important.
This research makes an original contribution by providing the first comprehensive analysis of elemental makeup across southern Kazakhstan’s soils. By establishing this geochemical baseline and pinpointing potential areas of concern, the study offers valuable insights to inform land management practices and future environmental monitoring efforts in southern Kazakhstan.

2. Materials and Methods

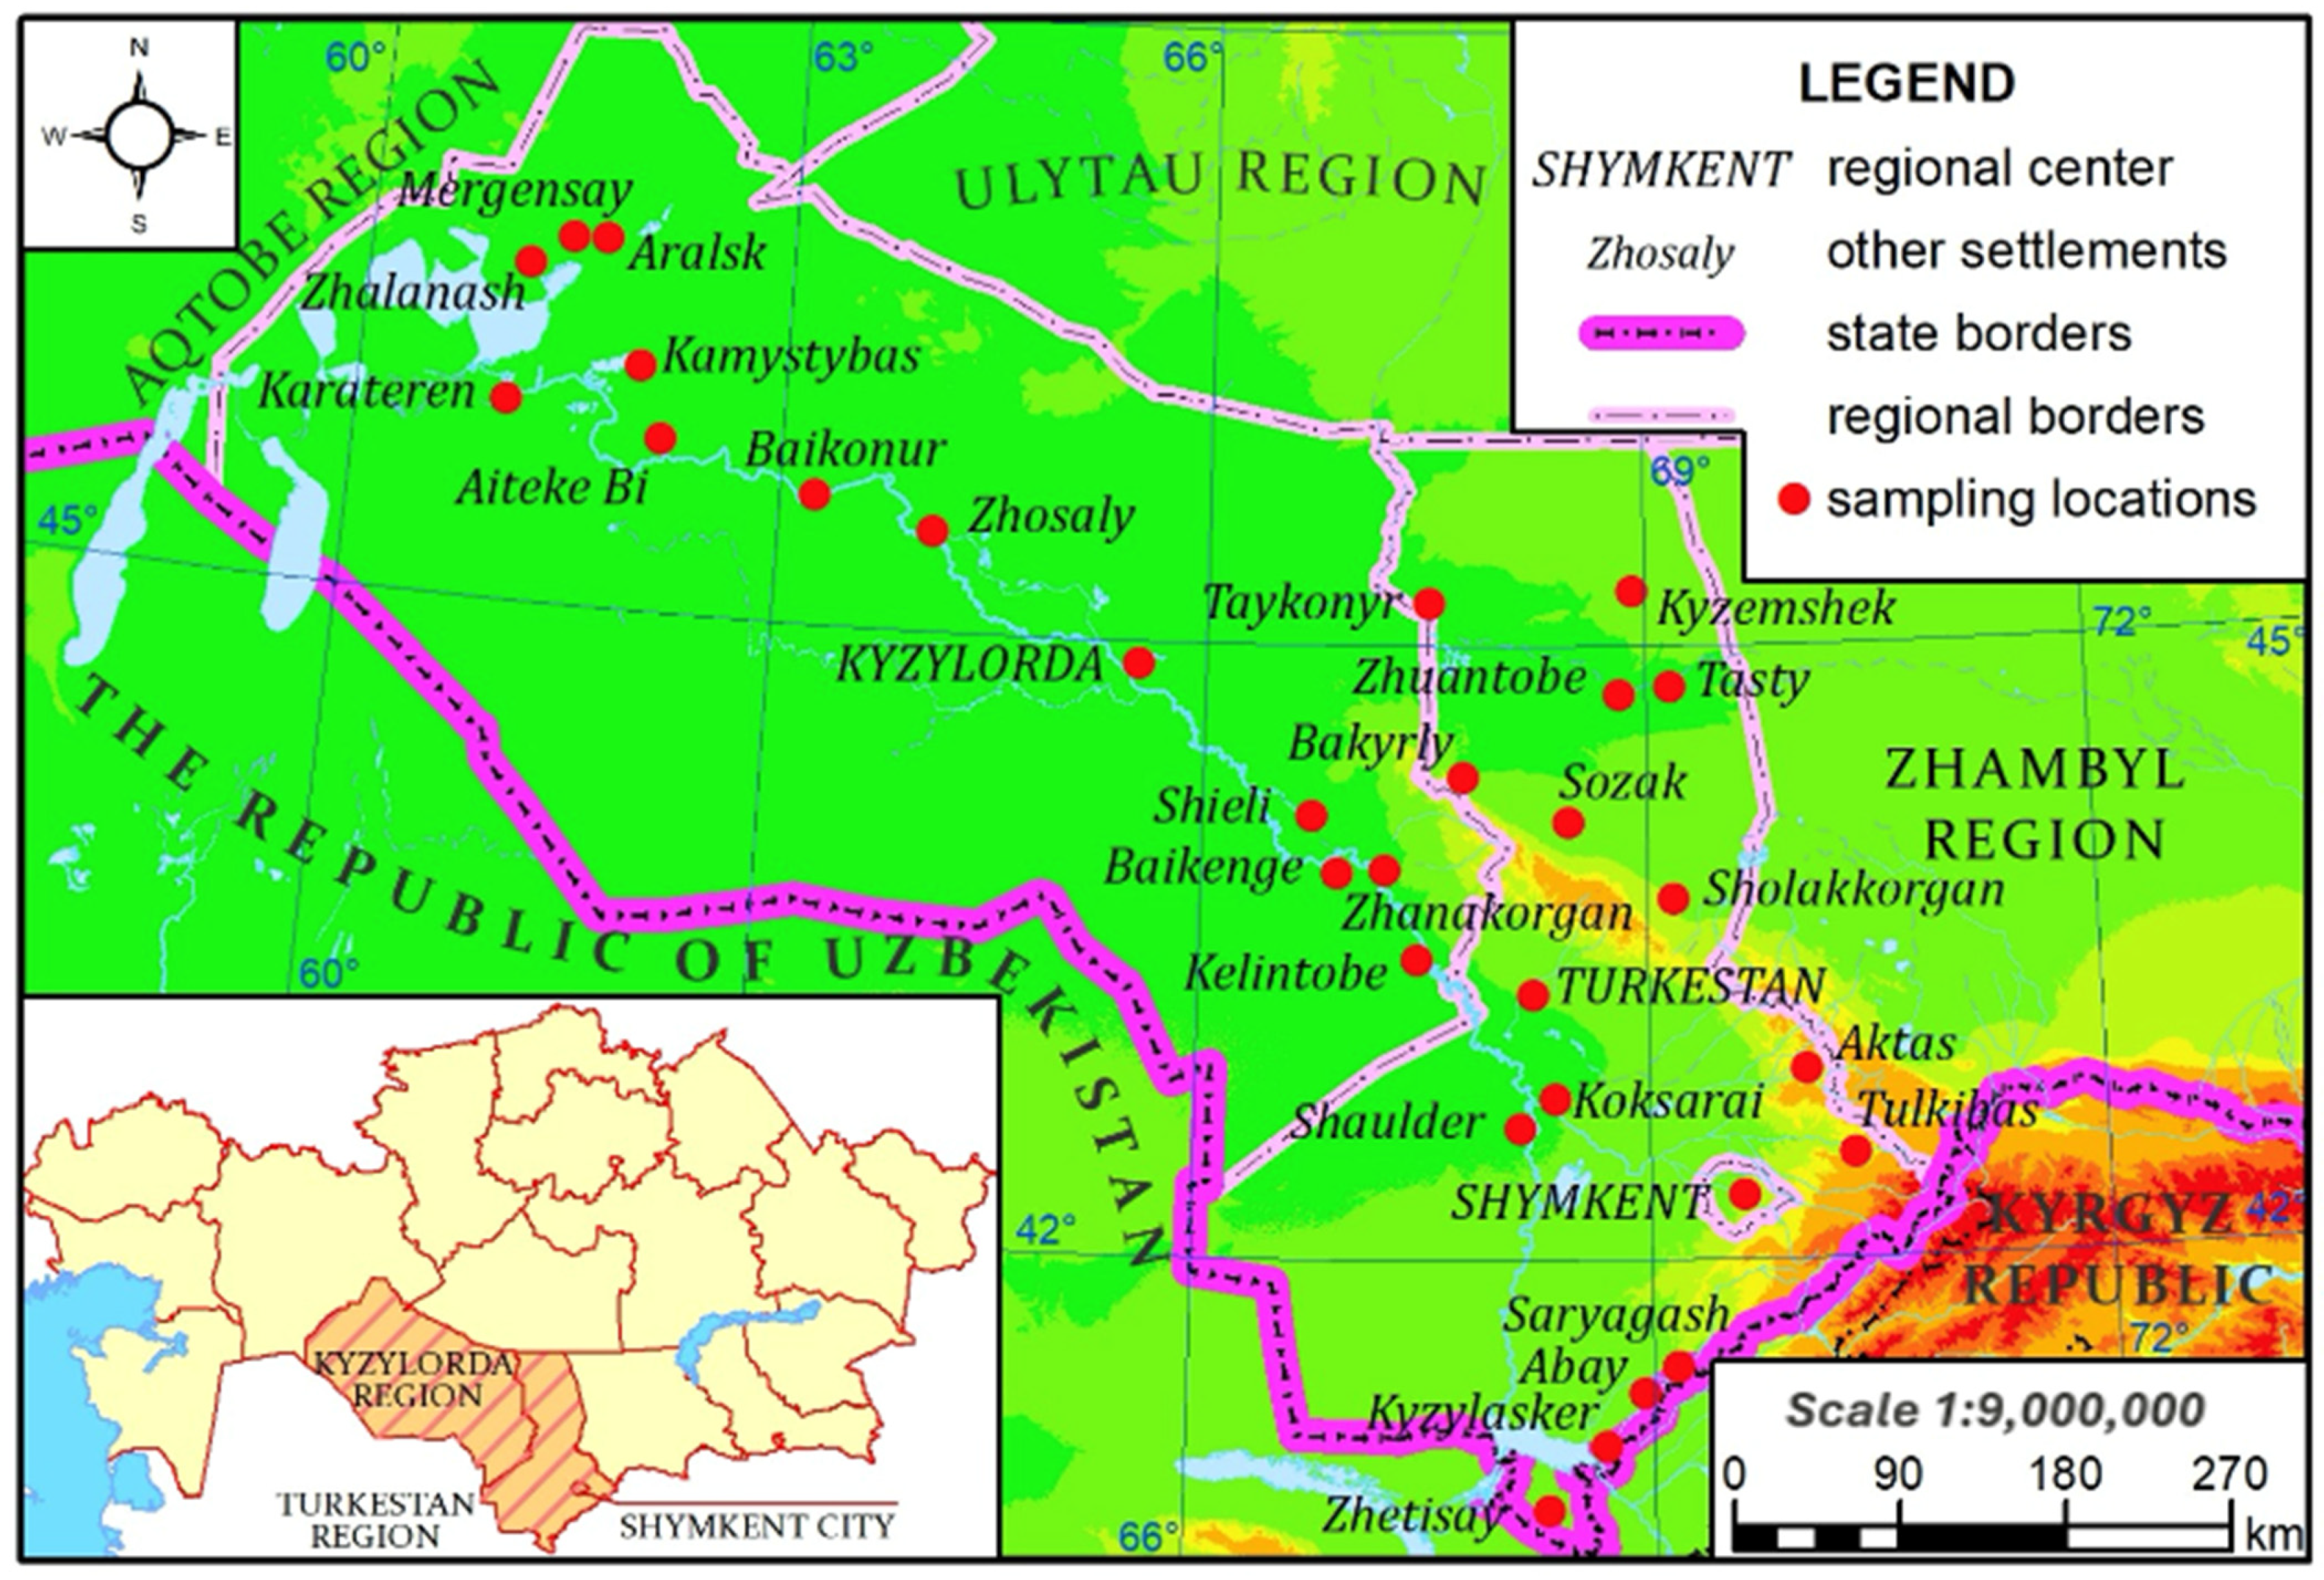
2.1. Description of the Study Area

This research focuses on the Kyzylorda and Turkestan regions of southern Kazakhstan, bordering Uzbekistan (Figure 1). Kyzylorda lies in southern Kazakhstan’s Turan Lowland, along the lower Syr Darya River. Encompassing a vast 226,000 square kilometers, the region is divided administratively into seven districts, one city (Kyzylorda), and Baikonur, a city with a separate administration. The Syr Darya River is Kyzylorda’s main water source. Its low banks, composed of loess-like loams and sands, are susceptible to erosion, forming winding branches and channels. The river flows close to the center of the region and eventually empties into the northern part of the Small Aral Sea. Reflecting its importance, most settlements line the riverbanks.
Despite rich reserves of minerals, oil, and gas, the Kyzylorda region faces significant environmental challenges. Arid climate, limited water, desertification, and human activities, like pollution from oil, industry, vehicles, and improper waste management, all threaten the region’s ecology. This contamination affects both ground and surface waters.
The Turkestan region of Southern Kazakhstan encompasses an area of 117,300 km2 within the arid Turan Lowland. Administratively divided into 14 districts, it contains three major cities, each with regional significance: Turkestan, Arys, and Kentau. Notably, the larger city of Shymkent, though geographically located within the region, has a separate administration as a city of national significance. Hydrologically, the region is defined by two principal waterways: the prominent Syr Darya River, flowing south to northwest, and the Shu River, traversing the northern portion. The climate exhibits a marked continental character, with extended hot summers and mild, shorter winters. Scarce precipitation levels classify the region as arid (sampling point coordinates provided in Table 1).
The Turkestan region boasts a wealth of natural resources. These resources encompass a diverse range of mineral deposits, including barite, coal, iron ores, polymetallic ores, uranium, phosphorus, bentonite clays, vermiculite, talc, asbestos, granite marble, gypsum, and quartz sands. This abundance of resources offers potential for significant economic development. However, the ecological situation in the Turkestan region presents a significant challenge, considered one of the most concerning in Kazakhstan. This is primarily attributed to the presence of numerous industrial enterprises, including petrochemical facilities, chemical–pharmaceutical plants, cement factories, uranium mining operations, and non-ferrous metallurgy works. Shymkent, the region’s industrial hub, is a major contributor to air pollution. Industrial emissions, particularly formaldehyde, nitrogen oxides, and sulfur oxides, significantly degrade air quality within the city and surrounding areas.

2.2. Geology and Soil Characteristics

The unique geological makeup of South Kazakhstan results in a diverse range of mineral resources with varying economic importance. Metals, phosphorites, fluorspar, building materials, and certain non-metallic raw materials play a significant role in the region’s industry. Hard coal deposits, while present, are generally small-scale and often located far from established industrial centers, limiting their economic viability. The overall distribution of mineral deposits across South Kazakhstan exhibits spatial heterogeneity. Notably, metallic mineralizations are primarily concentrated in areas with surface outcrops of the Paleozoic basement. The Aral Sea region serves as an exception, where iron ore deposits are not directly associated with the basement complex.
Non-metallic minerals exhibit a more dispersed distribution compared with metallic ores. However, some of the most commercially valuable non-metallic resources, such as phosphorites, fluorspar, and barite, are also found in surface exposures. Conversely, the location of exploited construction materials, including clays, sands, gravels, limestone, and building stone, is primarily driven by local industrial demand. Consequently, the most significant developments for these resources are situated within the proximity of established industrial centers, reflecting a close relationship between resource extraction and industrial consumption.
The soil cover of the region exhibits a high degree of heterogeneity, reflecting the diverse climatic and geological conditions across South Kazakhstan [22,23]. Arenosols, a type of Arenosol according to the World Reference Base for Soil Classification (WRB) [24], dominate in desert areas due to the predominance of sandy substrates and shallow soil development (Leptosols). The Syr Darya River floodplain features Fluvisols (alluvial soils) alongside Solonchaks (saline soils). These soils support meadow vegetation with scattered riparian forests and shrublands dominated by Salix (willow), Populus (turang), and Alnus (alder) species. Extensive reed beds are characteristic of the delta and coastal zones.
The northern portion of the region transitions to Chernozems (brown soils) while the southern region is dominated by loams and Cambisols (gray soils) and Regolosols. In foothill areas, fertile brown forest soils prevail, typically formed on elevated river terraces. The southern mountain slopes are characterized by Kastanozems (chestnut–carbonate soils) exhibiting moderate fertility and moisture retention capacity.
Steppe regions harbor various types of Chernozems (black soils) distinguished by high organic matter content and good fertility. Conversely, arid zones are dominated by Cambisols, Regolosols, and Solonchaks. These soils are characterized by high salinity and limited agricultural potential. Additionally, sandy Arenosols with low fertility and moisture content are present within the territory.
South Kazakhstan boasts a wealth of natural resources, including deposits of barite, coal, iron and polymetallic ores, uranium, phosphorus, bentonite clays, vermiculite, talc, asbestos, granite, marble, gypsum, and quartz sands. However, this resource abundance comes at a cost. The region grapples with one of the most concerning ecological situations in the country due to the presence of numerous industrial enterprises. These industrial facilities encompass petrochemical plants, chemical–pharmaceutical plants, cement factories, uranium mining operations, and non-ferrous metallurgy enterprises. Notably, Shymkent city, a major center for this industrial activity, suffers from significant air pollution. Emissions from these facilities, including formaldehyde, nitrogen oxides, and sulfur oxides, degrade air quality and pose health risks.

2.3. Soil Sampling and Chemical Analysis

Soil samples were collected during the summer period from plots within household farms owned by local residents in 30 settlements across the Turkestan and Kyzylorda regions (Figure 1). A total of 47 samples were obtained [25]. Following established protocols [26], the “envelope method” was employed for sample collection. This method involves outlining a 10 × 10 m square sampling area. Samples were obtained from the upper soil horizon, at a depth of 0–20 cm. To create a representative composite sample for each location, five individual soil sub-samples were randomly collected from within the designated sampling area and then thoroughly mixed. The initial weight of each composite sample ranged from 500 to 600 g. After collection, each sample was transferred to a labeled paper bag for transport.
In the laboratory, the soil samples underwent a multi-step preparation process to ensure consistency and facilitate further analysis. First, the samples were air-dried at ambient temperature. Next, they were sieved through a 1 mm mesh sieve to remove any large particles or debris. Finally, the sieved soil was pulverized using a vibratory grinder to achieve a homogenous fine powder. The homogenized soil material was then subjected to a process known as quartering, to obtain a representative sub-sample with a weight suitable for subsequent laboratory analyses. Quartering involves repeatedly dividing the sample into four equal portions and then discarding two diagonally opposite quarters. This process is continued until the desired sub-sample weight is achieved. A duplicate sample was also created from the remaining homogenized material. This duplicate sample was packaged in a Kraft paper bag for secure storage and potential future analyses.
Quantitative chemical analysis of the prepared soil samples was performed using two complementary methods:
  • Inductively coupled plasma mass spectrometry (ICP-MS): This technique was employed at the accredited chemical analytical center “Plasma” located in Tomsk, Russia. ICP-MS offers high sensitivity and allows for the detection of a broad spectrum of elements within the sample.
  • Instrumental neutron activation analysis (INAA): This technique was carried out at the base of the TPU International Innovative Research and Education Center “Uranium Geology.” INAA provides a complementary approach for elemental analysis, offering high accuracy for specific elements.
By employing both ICP-MS and INAA, the research aimed to obtain a comprehensive understanding of the elemental composition of the collected soil samples.

3. Results

Analytical studies were carried out by two methods: instrumental neutron activation analysis (INAA) and inductively coupled plasma mass spectrometry (ICP-MS).
Instrumental neutron activation analysis (INAA) is a highly sensitive modern method of analysis, sufficiently effective for the determination of rare-earth and radioactive elements in biotic and abiotic objects. The reason for choosing this particular method of analysis is the advantages of INAA application in the field of biogeochemistry, which have been described in the studies of various scientists [27,28,29]. In the INAA method there is no chemical preparation of the sample, which eliminates errors due to the introduction or removal of elements together with reagents. The INAA method consists in irradiating the samples under study in a reactor with a stream of thermal neutrons and then measuring the induced activity on a gamma spectrometer with semi-conductor detectors, i.e., the signal is taken from the nuclei of chemical elements, so the physical state of the sample does not affect the result. This allows the determination of a wide range of elements in a variety of objects.
Inductively coupled plasma analysis with mass spectrometric termination (ICP-MS) is also a highly sensitive method that determines a wide range of elements from Li to U. The principle of operation of the method is based on the correspondence of atoms of chemical elements to strictly defined resonance frequencies at which they emit or absorb light. Thus, the spectroscope allows one to see lines (dark or light) on the spectrum in certain places characteristic of a particular element. The intensity of these lines depends on the amount of matter and its state. The relative and/or absolute intensities of the lines are used to determine the quantitative content of the analyzed components in the sample.
The reason for choosing soil as an object of research is that soils can preserve traces of various influences for a long time. Consequently, the study of the accumulation and distribution of chemical elements in soils contributes to the assessment of the state of the landscape, its development history, and the impact of pollutants. Soil research allows one to study in detail the chemical and mineral composition of soils and underlying parent rocks, movable and gross forms of macro- and microelements, radionuclides and other indicators, as well as to characterize and assess the percentage of disturbed lands in the process of economic activity [30]. The soil types studied here can be referred to as culture soils as they are indicators of physical transformation. The sampling was carried out in the plots of subsidiary farming—vegetable gardens, orchards, etc. These plots are part of the agrolandscape—a complexly organized multidimensional ecosystem of land with a certain appearance and appropriate structure that functions in a way that is dependent on the farming system.

3.1. Chemical Elements Distribution

The concentrations of 72 chemical elements were quantified in the collected soil samples (Table 2).
Values falling below the instrumental detection limit were substituted with one half of the limit value. Conversely, abnormally high concentrations exceeding three standard deviations above the mean were replaced with the sample mean plus three standard deviations. This approach aimed to minimize the influence of extreme values on the overall data distribution.
Table 2 summarizes the elemental concentrations observed in the analyzed soil samples. As evident from the table, the highest average concentrations were recorded for calcium (Ca), at 5.35%, and iron (Fe), at 2.44%. Notably, the elements, including sodium (Na), magnesium (Mg), aluminum (Al), sulfur (S), and potassium (K), all exhibited concentrations exceeding 1000 mg/kg. Elements such as chlorine (Cl), silicon (Si), phosphorus (P), barium (Ba), manganese (Mn), strontium (Sr), zinc (Zn), arsenic (As), rubidium (Rb), chromium (Cr), cerium (Ce), lanthanum (La), bromine (Br), neodymium (Nd), titanium (Ti), nickel (Ni), cobalt (Co), and copper (Cu) displayed concentrations ranging from 10 to 100 mg/kg.
Elements with concentrations of 1 mg/kg or higher included lead (Pb), scandium (Sc), vanadium (V), thorium (Th), lithium (Li), yttrium (Y), samarium (Sm), caesium (Cs), hafnium (Hf), boron (B), uranium (U), ytterbium (Yb), praseodymium (Pr), zirconium (Zr), gadolinium (Gd), gallium (Ga), iodine (I), dysprosium (Dy), and europium (Eu).
The remaining elements were detected at concentrations below 0.1 mg/kg. These elements included antimony (Sb), terbium (Tb), tantalum (Ta), erbium (Er), selenium (Se), lutetium (Lu), beryllium (Be), holmium (Ho), molybdenum (Mo), cadmium (Cd), bismuth (Bi), germanium (Ge), niobium (Nb), tin (Sn), thulium (Tm), thallium (Tl), tungsten (W), mercury (Hg), palladium (Pd), tellurium (Te), indium (In), rhodium (Rh), gold (Au), rhenium (Re), iridium (Ir), platinum (Pt), ruthenium (Ru), and osmium (Os).
The obtained results show quite a wide range of values for all of the studied elements. Such a wide range of values can be explained by the fact that the territory of the region is characterized by a variety of soils and by a complex structure of soil cover. Developing in arid conditions, soils of the studied territory are characterized by their vulnerability and their low resistance to anthropogenic loads, creating a high internal danger of degradation and desertification processes [36].
To assess the spatial homogeneity of element distribution within the soil samples, the coefficient of variation (CV) was calculated, which is calculated by the formula CV = δ/M*100%, where δ is the standard deviation and M is the sample mean. The following criteria were employed to interpret the CV values:
  • CV < 39%: Homogeneous distribution
  • CV 40–79%: Heterogeneous distribution
  • CV 80–159%: Highly heterogeneous distribution
  • CV ≥ 160%: Extremely heterogeneous distribution (Table 3)
The analysis revealed that approximately 57% of the investigated elements exhibited a homogeneous distribution (CV < 39%) within the soil samples. This group was predominantly composed of lithophilic elements, including rare earth elements (REEs). Conversely, the most pronounced spatial heterogeneity (high CV values) was observed for siderophile elements (rhenium (Re) and iridium (Ir)), as well as silicon (Si) and boron (B).
This uneven distribution pattern suggests the influence of factors that disrupt the background elemental concentrations in the soil. Potential contributors to this heterogeneity include anthropogenic activities (technogenic factors) and the presence of mineral deposits in the vicinity of the sampling locations.
The Shapiro–Wilk test for normality [37] was used to evaluate whether the distribution of element concentrations in the soil samples followed a normal distribution. This test considers two criteria: skewness (asymmetry) and kurtosis (excess kurtosis). For a data set to be considered normally distributed, both the skewness statistic (ta) and the kurtosis statistic (te) must be less than or equal to 3 (ta ≤ 3 and te ≤ 3).
The results indicate that the following elements exhibited concentrations that conformed to a normal distribution: lithium (Li), beryllium (Be), aluminum (Al), phosphorus (P), potassium (K), calcium (Ca), titanium (Ti), vanadium (V), manganese (Mn), cobalt (Co), zinc (Zn), gallium (Ga), germanium (Ge), arsenic (As), selenium (Se), strontium (Sr), yttrium (Y), zirconium (Zr), niobium (Nb), ruthenium (Ru), palladium (Pd), cadmium (Cd), indium (In), tin (Sn), antimony (Sb), iodine (I), caesium (Cs), lanthanum (La), cerium (Ce), praseodymium (Pr), neodymium (Nd), samarium (Sm), gadolinium (Gd), terbium (Tb), dysprosium (Dy), holmium (Ho), erbium (Er), thulium (Tm), ytterbium (Yb), lutetium (Lu), platinum (Pt), thallium (Tl), lead (Pb), bismuth (Bi), and thorium (Th). The concentrations of the remaining elements deviated from a normal distribution.
Comparative data on the content of chemical elements in soils and lithosphere according to literature data show that the elements for which these parameters are known are characterized by lower content in soils of the studied territory (Table 2). As a rule, in ecological–geochemical studies for comparative analysis, three main standards are used: hygienic standards, background geochemical levels and Clarke numbers of chemical elements [38]. The Clarke number (noted hereafter as Clarke) is a key indicator in geochemistry. It is this indicator that is used to assess the content of an element in the soil as low, medium or high. Clarkes (global and regional) are used in formulas for the calculation of a territory’s pollution indicators and their values are taken into account when setting the maximum permissible concentrations (MPC), especially for heavy metals and metalloids.
Because hygienic standards are defined only for a narrow range of elements, because there are not so many soils that are referred to in these standards and because there are data regarding only a small range of elements, in the comparative analysis we used Clarkes according to [31,32]. Comparative analysis showed that the main part of the chemical elements in the soil of the territory of Southern Kazakhstan are contained below the Clarkes (Figure 2a,b).
Insignificant excesses of Clarkes have such elements as sulfur, calcium, zinc, selenium, strontium and uranium, higher excesses of Clarkes have bromine and antimony. However, in comparison with MPC [39], antimony has no exceedances. Exceedances of MPC were found for such elements as nickel (3.2×), zinc (3.7×), copper (3.3×), cobalt (2×), chromium (9×), arsenic (3×), and sulfur (9×). According to [40], arsenic and zinc are referred to as a first, or high, hazard class. Nickel, chromium, copper and cobalt are attributed to the second, or low, hazard class. This naturally causes concern, as the soil samples were taken at the homestead plots of the residents of the region under study, where food crops are grown. At the same time, one must pay attention to the lack of manganese in the soil, as its content is 3.5-times lower than the MPC, a finding which is also confirmed by the literature data [41].
For comparative analysis we took data on soils in the territory of Kazakhstan, including Northern Kazakhstan [33] and the Semipalatinsk test site (STS) [34]. Soils of these territories are also subject to anthropogenic load, as are soils from the territory of Southern Kazakhstan. For the conditionally background soil, we took data from the Tyumen Federal Nature Reserve [35]. Comparative analysis with soils of other territories (Figure 3) showed insignificant differences in some elements, such as calcium, arsenic, bromine, strontium, cesium, barium, lanthanum, cerium, neodymium, and europium.
Elevated content of the listed elements can be associated with metalogenic features of the subsoil of the territory of Southern Kazakhstan. This is also confirmed by high indices of concentration coefficient of chemical elements relative to the Tyumen Federal Nature Reserve [35] (Figure 4).

3.2. Elements Correlation

For the elements analyzed using INAA method, the pairwise correlation coefficients within the soil samples were calculated (see Table S1 included as Supplementary Material). These coefficients assess the degree of linear correlation between the concentrations of different elements.
A statistically significant positive correlation (p-value < 0.05) at a confidence level of 90–95% was observed between the elements chromium (Cr), iron (Fe), cobalt (Co), arsenic (As), rubidium (Rb), cesium (Cs), thorium (Th), and the group of rare earth elements (REEs) including scandium (Sc), lanthanum (La), samarium (Sm), ytterbium (Yb), and lutetium (Lu).
Several noteworthy features emerged from the correlation analysis:
  • Negative correlations: Bromine (Br) and strontium (Sr) exhibited negative correlations with a significant number of other elements. This indicates that higher concentrations of Br and Sr are not typically accompanied by increased concentrations of other elements.
  • Iron deposit indicator: Positive correlations were identified between cobalt (Co), arsenic (As), and zinc (Zn). This finding may suggest the presence of iron deposits within the study area, as these elements are often associated with iron mineralization.
  • Uranium associations: Uranium (U) displayed positive correlations with numerous elements at a moderate significance level (p-value between 0.05 and 0.1). These correlations suggest a potential association of U with various elements in the soil.
  • Macroelement associations: Barium (Ba) exhibited highly significant positive correlations (p-value < 0.01) with several macroelements at a moderate to strong level (0.4–0.6) including sodium (Na), calcium (Ca), scandium (Sc), chromium (Cr), and iron (Fe). This suggests a potential geochemical association between Ba and these major rock-forming elements. Additionally, these correlations may indicate industrial pollution, for example, during technological processes leading to the formation of large masses of dust.
  • Correlations between arsenic (As), lanthanum (La) and cerium (Ce) may indicate contamination from phosphate fertilizers.
The results of the pairwise correlation analysis support the existence of geochemical associations among the analyzed elements. These associations are further corroborated by the cluster analysis presented in Figure 5.

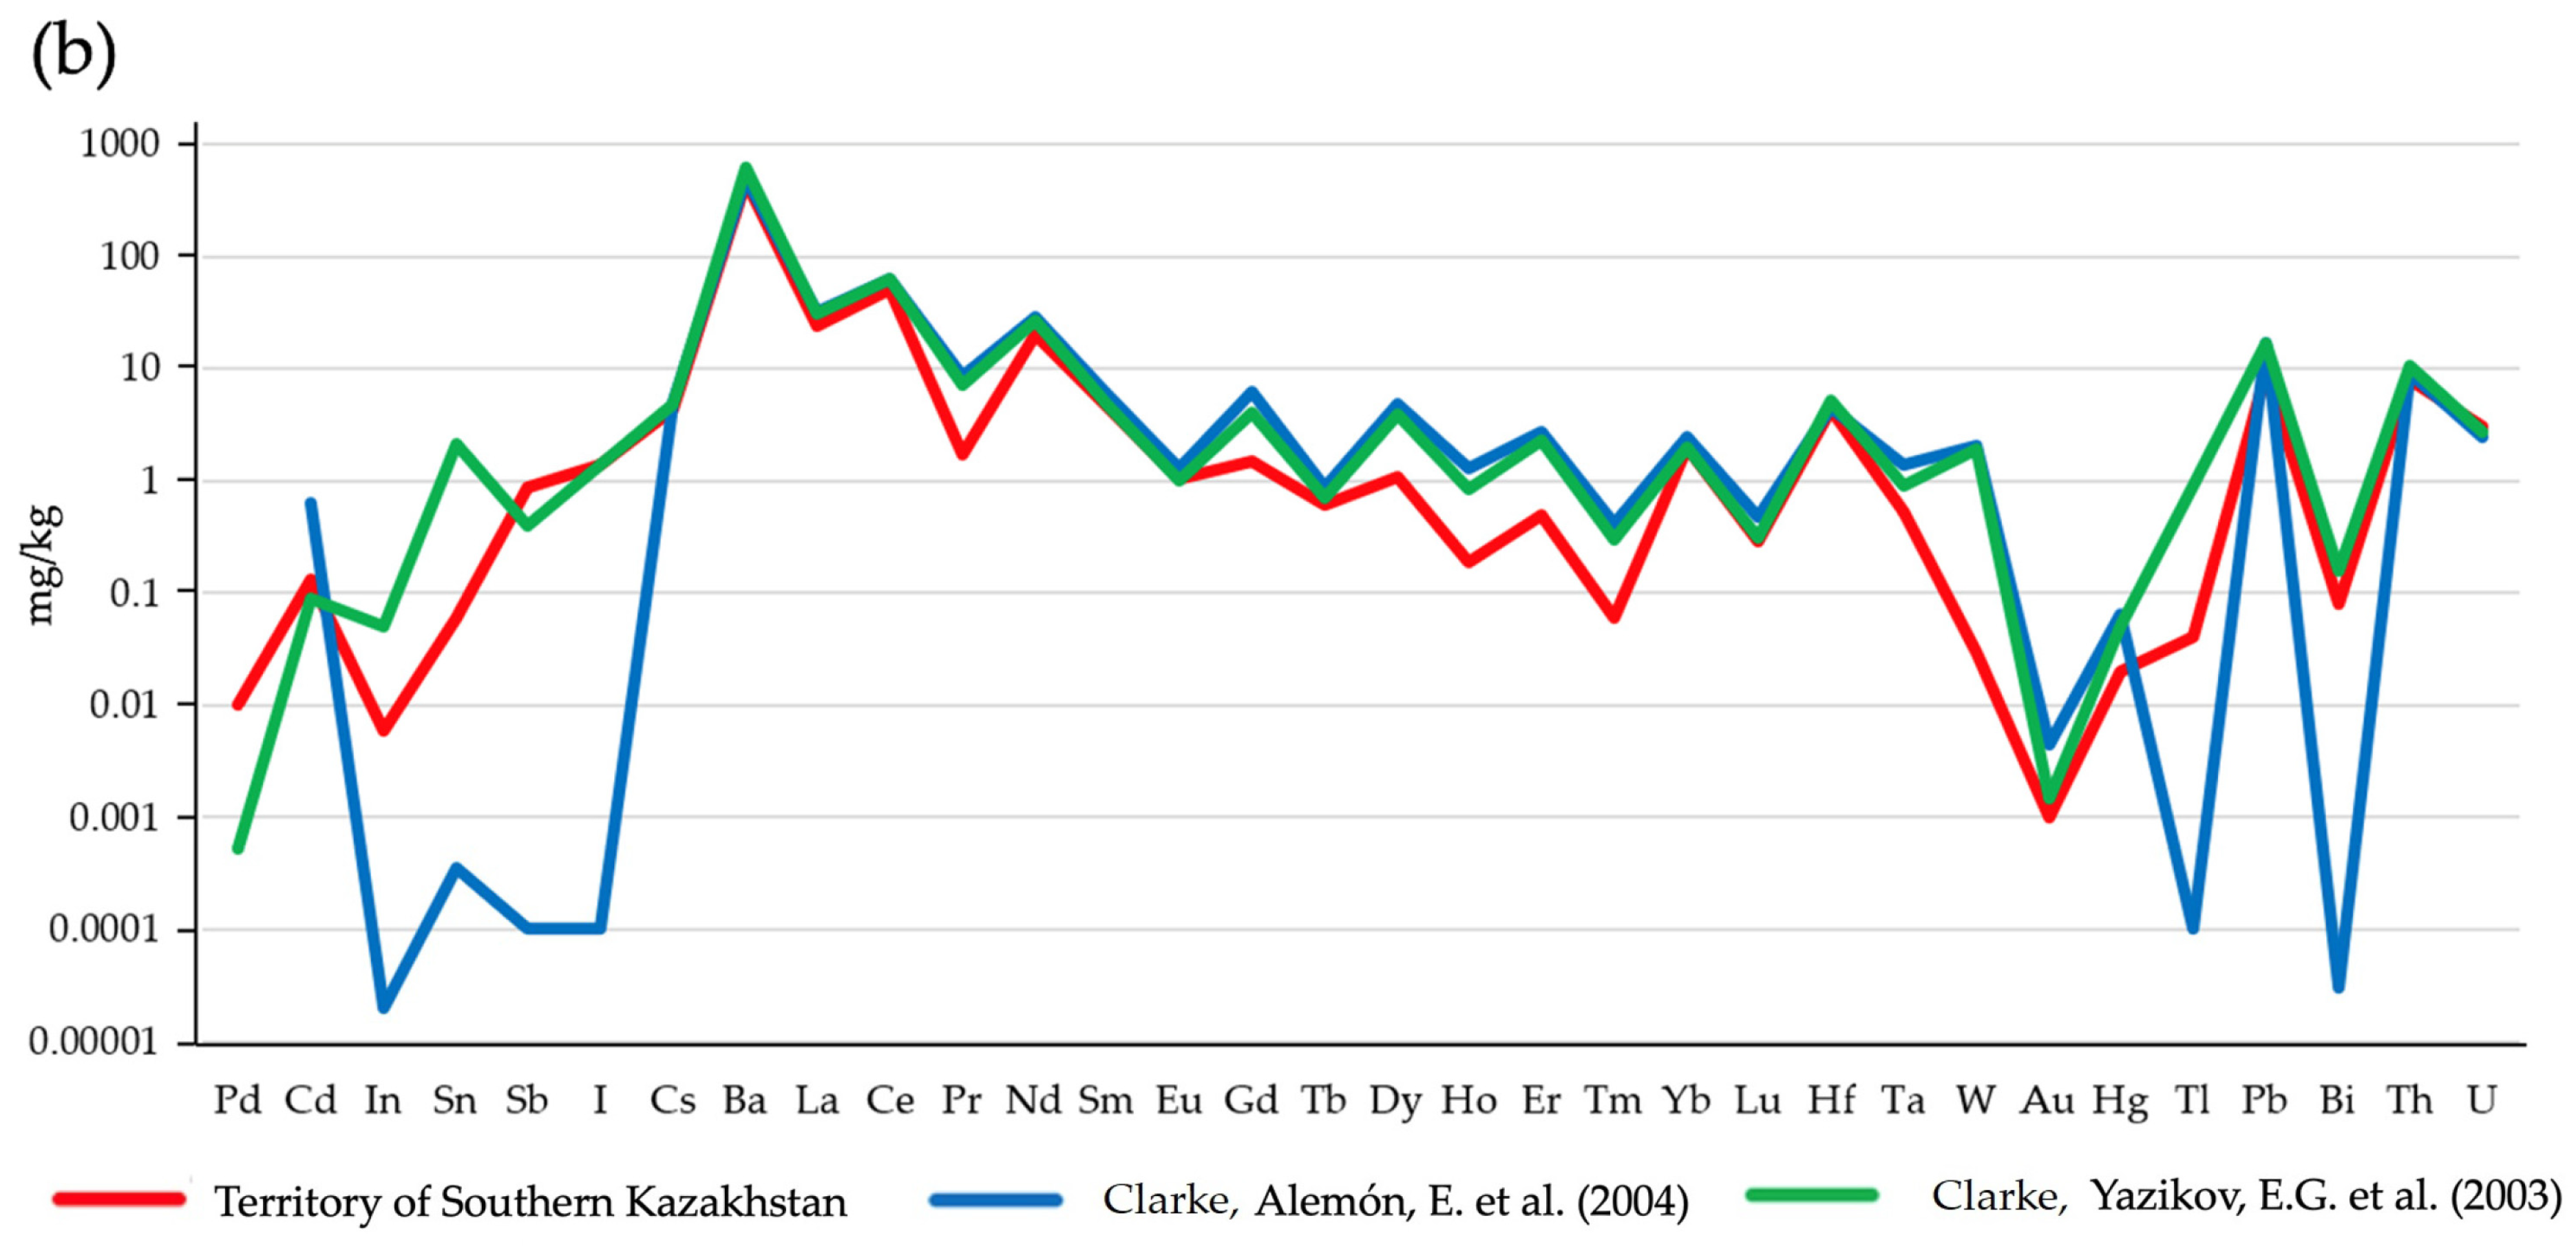
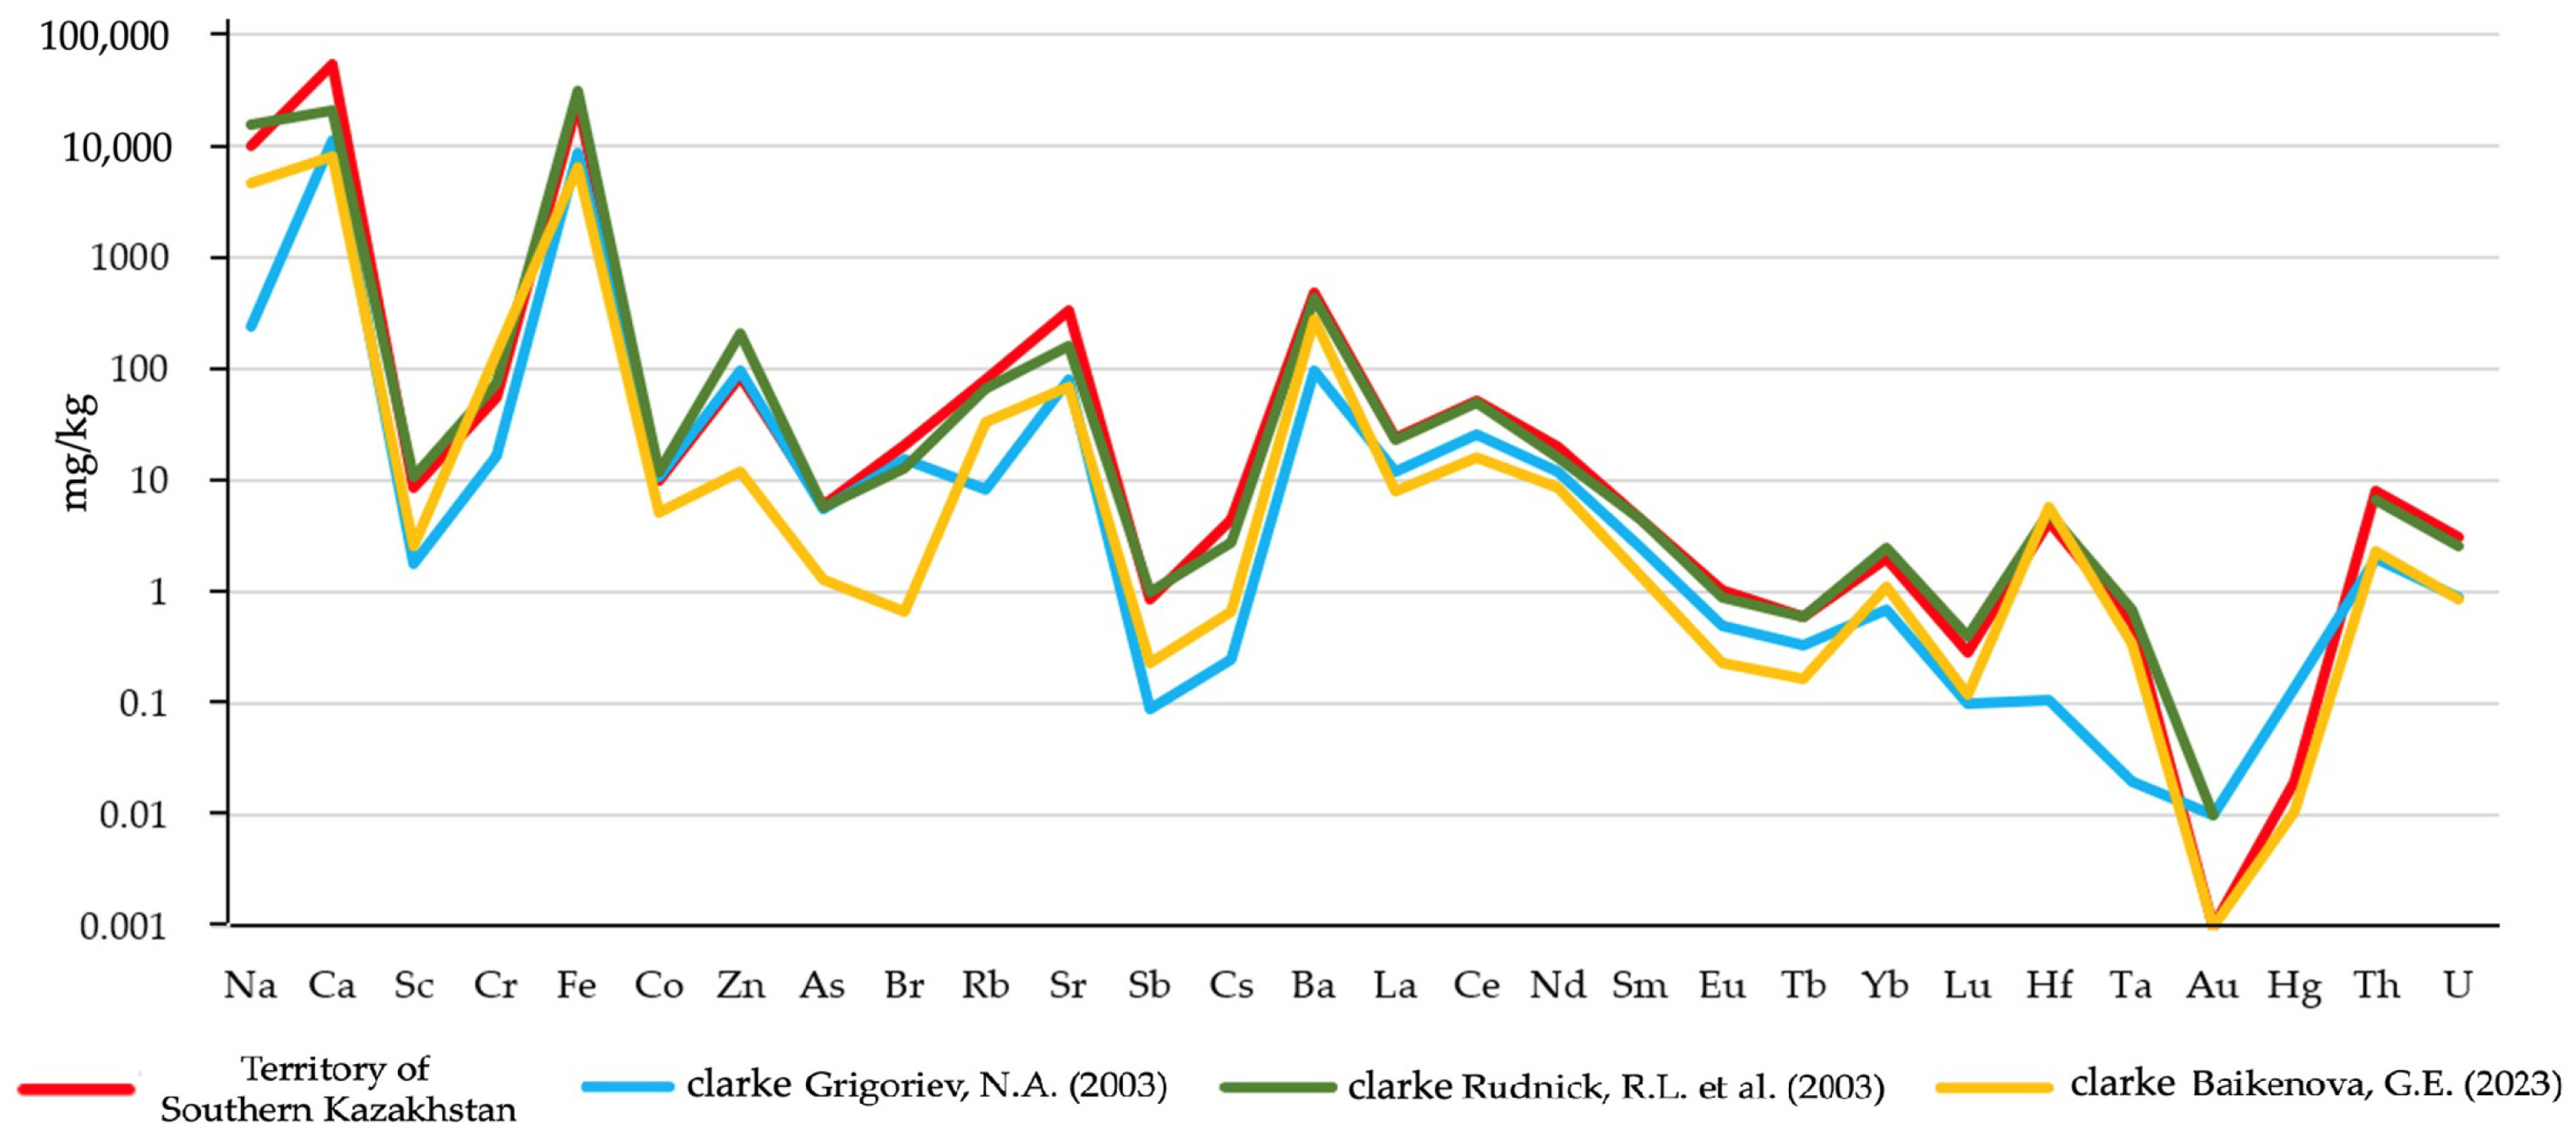
3.3. Relative Abundance of Elements of Interest

Average elemental concentrations within the soil cover served as the basis for calculating concentration Clarkes. Defined as the relative abundance of a chemical element, typically in the Earth’s crust, the Clarke was used as a reference point. Calculations employed the Clarkes for continental soil elements [42] and the upper continental crust [31]. The derived Clarkes facilitated the construction of geochemical series. These series represent groupings of elements whose abundances in the investigated environmental component deviate significantly from the established Clarkes [43]. Table 4 presents the geochemical series of chemical elements within the soil of the study area, established in relation to the aforementioned Clarkes.

4. Discussion

Analysis of the South Kazakhstan soil cover revealed elevated concentrations of Te, I, Se, Ca, Rb, S, Br, U, Sr, and As when compared with established Clarkes. These elements may constitute the foundation of the region’s distinct geochemical fingerprint. Furthermore, concentrations of several rare earth elements (Sc, Ce, Eu) were also found to be higher than established Clarkes. The research also identified a crucial aspect of soil contamination in South Kazakhstan: its predominantly polyelemental nature. Unlike areas with single-element (monoelemental) contamination, the presence of multiple elements poses significant challenges for developing standardized remediation procedures.
The study identified high concentrations of specific chalcophile elements in South Kazakhstan’s soil cover: selenium (Se), tellurium (Te), and sulfur (S). Chalcophile elements have a strong affinity for sulfur and are often found in association with sulfide minerals in rocks. Selenium (Se) exhibited enrichment when compared with its average global content in surface soil (0.4 mg/kg [43]) and the Earth’s crust (0.15 mg/kg [44]). This enrichment likely stems from human activities like industrial processes and mining [45]. Tellurium (Te), a much rarer element, with an average crustal abundance of only 0.002 mg/kg [46], forms weakly mobile tellurites during rock weathering. These tellurites are then adsorbed by iron-containing oxides in soil and water, limiting their movement [46]. Weathering processes at sulfide ore deposits can also contribute to the release of Se and Te into the surrounding soil [47]. Interestingly, the analysis revealed lower sulfur content (0.07%) in the soil compared with the Earth’s crust (0.14%) [48], suggesting potential loss through environmental processes.
Arsenic (As), another element detected in South Kazakhstan’s soil, exceeded the maximum permissible concentration (MPC) by a factor of three. This is concerning, despite its classification as a chalcophile element. With an average abundance of 5.6 mg/kg in Earth’s crust [31], arsenic can form its own minerals or substitute for phosphate in rocks. This substitution introduces a health risk, as toxic arsenic becomes incorporated into the phosphate cycle [31]. The study suggests that ore dumps containing arsenic-bearing minerals are likely the primary culprit, continuously releasing arsenic into the environment [45].
Analysis revealed variations in the content of several elements across South Kazakhstan’s soil cover. Rubidium (Rb), a lithophilic element (Group I), displayed an average soil concentration of 35 mg/kg, which is lower than the Earth’s crustal average of 98 mg/kg [44]. This finding suggests that the soil inherits its rubidium content from parent rocks. While Rb can partially substitute for potassium (K) in plant compounds, it cannot replace K in essential metabolic processes. At high concentrations, rubidium can become toxic to plants [44].
Calcium (Ca) and strontium (Sr), both belonging to Group II (lithophilic elements), exhibited contrasting behavior in South Kazakhstan’s soil. Calcium, a prevalent element in the Earth’s crust (3.89%) and soil (1.5%), is a constituent of minerals like gypsum and dolomite mined in the study area [48]. Strontium, sharing similar geochemical and biochemical properties with calcium, often associates with it in natural environments. Plant roots take up Sr through both convective transport and exchange diffusion [48]. The ratio of absorbed calcium to strontium likely depends on the source and uptake rate of these elements [49]. Notably, Sr accumulates in aboveground plant parts despite slower transfer from roots to shoots [50].
To assess soil contamination in South Kazakhstan, the research employed the total pollution index (Ztpi). This index considers background element concentrations and categorizes pollution severity based on a health-based hazard scale [30]. Notably, the scale defines “high” pollution as a Ztpi value between 32 and 128. To identify regional biogeochemical specificities, the study calculated concentration coefficients, leading to the geochemical series presented in Table 5. Analysis of both Kyzylorda and Turkestan regions revealed concerningly high Ztpi values, of 62 and 34 conventional units (c.u.), respectively, indicating significant soil contamination.
Table 5 reveals a significant difference in soil elemental composition between the neighboring Kyzylorda and Turkestan regions. Kyzylorda exhibits a wider geochemical specificity, with a higher number of identified elements (42). However, a core set of elements is common to both regions. This shared signature includes rare earth elements from the yttrium series (holmium, erbium, thulium), noble metals like gold, platinum, ruthenium, and palladium, alongside tungsten. These shared elements suggest a potential underlying geological similarity between the two regions. These findings are consistent with the region’s history of intensive resource extraction in its desert and desert–steppe ecosystems.
The abundant natural resources of oil, gas, mineral salts, and building materials in the region attract significant development. However, Table 5 also highlights the cost of this activity: a worsened environmental situation due to increased anthropogenic pressure on the soil cover. Natural factors like flat terrain, arid climate, salinization, and low soil fertility contribute to degradation and desertification. Economic activity further alters the soil, often significantly, from its natural state. Irrational land use and ecological overload lead to the formation of unique technogenic desert soils (“technozems”) of varying classifications. These can be caused by destructive farming practices, chemical pollution, industrial emissions, infrastructure development, and unregulated traffic [51]. Mining activities, particularly large-scale open-pit operations, pose a substantial threat due to extensive environmental transformations and lasting damage.
The presence of heavy metals and other pollutants in the soil necessitates the development of objective assessments to track their accumulation and behavior. This information is crucial for implementing effective environmental protection strategies in the region.

5. Conclusions

This study established baseline geochemical values for a comprehensive range of 72 elements within the soils of the Kyzylorda and Turkestan regions, South Kazakhstan. Utilizing advanced analytical techniques like inductively coupled plasma mass spectrometry (ICP-MS) and instrumental neutron activation analysis (INAA), the research yielded a highly resolved picture of the region’s elemental composition. Analysis revealed significant and concerning findings regarding element accumulation and distribution patterns. Compared with established reference values and existing scientific literature, the study identified enrichment of specific elements in South Kazakhstan’s soils. Notably, rare earth elements (REEs) were enriched, likely reflecting the underlying geological makeup of the region. However, further investigation is warranted to determine the specific REE types and their potential environmental implications. The presence of elevated radioactive elements necessitates further study to assess potential environmental and human health risks. Understanding the type, source, and distribution of these radioactive elements is crucial for developing appropriate mitigation strategies. Additionally, iron group elements exhibited enrichment, possibly linked to a combination of geological factors and anthropogenic activities such as mining or industrial processes. Further research is required to elucidate the relative contributions of these potential sources. The study also found a significantly higher number of elements exceeding background levels in the Kyzylorda region compared with Turkestan. This suggests a greater degree of element accumulation within Kyzylorda’s soil, potentially due to variations in geological processes or historical anthropogenic activities in the two regions.
These findings raise critical concerns about the potential transfer of accumulated elements through food chains. Elevated levels of elements in plants consumed by humans and animals can have detrimental health effects. This underscores the importance of further research that goes beyond examining individual elements in isolation. A more comprehensive understanding of how these elements interact and exert combined effects on living organisms is crucial. Studying these synergistic effects is essential for developing effective environmental protection strategies and safeguarding public health in the region.

Supplementary Materials

The following supporting information can be downloaded at: https://www.mdpi.com/article/10.3390/su16156361/s1, Table S1: Linear correlation coefficients of chemical elements in soil on the territory of South Kazakhstan.

Author Contributions

Conceptualization, A.A.K. and B.U.S.; methodology, A.A.K., N.V.B. and A.Z.; software, B.U.S. and N.V.B.; validation, B.U.S., N.V.B. and A.Z.; formal analysis, A.A.K., B.U.S. and S.D.; investigation, B.U.S., N.V.B., G.B.T., S.D. and R.K.; resources, A.A.K.; data curation, B.U.S., G.B.T. and R.K.; writing—original draft preparation, A.A.K. and B.U.S.; writing—review and editing, J.R-I. and M.-E.R.-C.; visualization, J.R.-I. and M.-E.R.-C.; supervision, J.R.-I., G.L.P., E.A.B., S.M. and N.N.; project administration, A.A.K.; funding acquisition, J.R.-I. All authors have read and agreed to the published version of the manuscript.

Funding

This research was co-funded by the Erasmus + CBHE project «Land management, Environment and SoLId-WastE: inside education and business in Central Asia» (LESLIE). Project number: ERASMUS-EDU-2023-CBHE nº 101129032.

Data Availability Statement

Data are contained within the article.

Conflicts of Interest

The authors declare no conflicts of interest.

References

  1. Qiao, P.; Wang, S.; Lei, M.; Guo, G.; Yang, J.; Wei, Y.; Gou, Y.; Li, P.; Zhang, Z. Influencing factors identification and the nested structure analysis of heavy metals in soils in entire city and surrounding the multiple pollution sources. J. Hazard. Mater. 2023, 449, 130961. [Google Scholar] [CrossRef] [PubMed]
  2. Boente, C.; Albuquerque, M.T.D.; Gallego, J.R.; Pawlowsky-Glahn, V.; Egozcue, J.J. Compositional baseline assessments to address soil pollution: An application in Langreo, Spain. Sci. Total Environ. 2022, 812, 152383. [Google Scholar] [CrossRef] [PubMed]
  3. Ruziev, I.B. Integrated Solution of Water and Land Resources Use Problems in EECCA Region: Collection of Scientific Works; Dukhovny, V.A., Ed.; SIC ICWC: Tashkent, Uzbekistan, 2010; pp. 88–95. [Google Scholar]
  4. Karimov, A.; Qadir, M.; Noble, A.; Vyshpolsky, F.; Anzelm, K. Development of Magnesium-Dominant Soils under Irrigated Agriculture in Southern Kazakhstan. Pedosphere 2009, 19, 331–343. [Google Scholar] [CrossRef]
  5. Sawidis, T.; Breuste, J.; Mitrovic, M.; Pavlovic, P.; Tsigaridas, K. Trees as bioindicator of heavy metal pollution in three European cities. Environ. Pollut. 2011, 159, 3560–3570. [Google Scholar] [CrossRef]
  6. Zhou, S.; Yuan, Q.; Li, W.; Lu, Y.; Zhang, Y.; Wang, W. Trace metals in atmospheric fine particles in one industrial urban city: Spatial variations, sources, and health implications. J. Environ. Sci. 2014, 26, 205–213. [Google Scholar] [CrossRef] [PubMed]
  7. Baikenova, G.E.; Baranovskaya, N.V.; Kakabayev, A.A.; Bersimbaev, R.I.; Korogod, N.P.; Narkovich, D.V.; Kurovskaya, V.V. Indicators of the state of the ecosystems based on the hair compositions of the northern Kazakhstan residents. Bull. Tomsk. Polytech. Univ. Geo Assets Eng. 2021, 332, 148–158. (In Russian) [Google Scholar]
  8. Shakenova, J.K. Desertification—The problem of Kazakhstan. Colloq. J. 2019, 34–36. [Google Scholar]
  9. Bahralinova, A.S.; Makenova, M.M.; Seifullin, S.; Isaeva, Z.B. Zhaiylymdardyn sholeyttenui zhane tozuy Kazakhstani n manyzdy ekologicheskikh maselesi retinde. Curr. Sci. Res. Mod. World 2019, 67–70. [Google Scholar]
  10. Sekenova, J.E.; Beisembayeva, A.B. Problems of desertification of territories in Central Asia. Way Sci. 2016, T.1, 79–80. [Google Scholar]
  11. Hu, Y.; Han, Y.; Zhang, Y. Land desertification and its influencing factors in Kazakhstan. J. Arid Environ. 2020, 180, 104203. [Google Scholar] [CrossRef]
  12. Akiyanova, F.Z.; Abitbayeva, A.D.; Yegemberdiyeva, K.B.; Temirbayeva, R.K. Problems of desertification of the territory of Kazakhstan: Status and forecast. Life Sci. J. 2014, 11, 341–345. [Google Scholar]
  13. Saparov, A.; Sharypova, T.; Saparov, G.; Yeleshev, R. Soil resources and soil fertility of the Republic of Kazakhstan. New Methods Results Landsc. Res. Eur. Cent. Asia Sib. 2018, 1, 99–104. [Google Scholar] [CrossRef]
  14. Toktar, M.; Lo Papa, G.; Kozybayeva, F.E.; Dazzi, C. Ecological restoration in contaminated soils of Kokdzhon phosphate mining area (Zhambyl region, Kazakhstan). Ecol. Eng. 2016, 86, 1–4. [Google Scholar] [CrossRef]
  15. Sharipova, B.U.; Kakabayev, A.A.; Baranovskaya, N.V.; Arynova, S.Z.; Korogod, N.P. Geochemical features of salt formations of drinking water in Southern Kazakhstan. Bull. Tomsk. Polytech. Univ. Geo Assets Eng. 2022, 333, 137–148. (In Russian) [Google Scholar]
  16. Abubakirova, K.D.; Bazarbayeva, T.A. State of water resources of the Republic of Kazakhstan. Sci. New Technol. 2014, 62–64. [Google Scholar]
  17. Rzymski, P.; Klimaszyk, P.; Niedzielski, P.; Marszelewski, W.; Borowiak, D.; Nowinski, K.; Baikenzheyeva, A.; Kurmanbayev, R.; Aladin, N. Pollution with trace elements and rare-earth metals in the lower course of Syr Darya River and Small Aral Sea, Kazakhstan. Chemosphere 2019, 234, 81–88. [Google Scholar] [CrossRef]
  18. Information Bulletin on the State of the Environment of the Republic of Kazakhstan. 2019. p. 376. Available online: https://ecogosfond.kz/orhusskaja-konvencija/dostup-k-jekologicheskoj-informacii/jekologijaly-zha-daj/orsha-an-otrany-zhaj-k-ji-turaly-a-paratty-bjulletender/kz-a-paratty-bjulletender-2019-zh-ru-informacionnye-bjulleteni-za-2019-g/ (accessed on 25 April 2024).
  19. Zhang, Y.; Zhang, D.; Li, W.; Li, Y.; Zhang, C.; Guan, K.; Pan, B. Characteristics and utilization of plant diversity and resources in Central Asia. Reg. Sustain. 2020, 1, 1–10. [Google Scholar] [CrossRef]
  20. Tursunova, R.; Kabdrakhmanova, S.; Selenova, B.; Akatan, K.; Shaimardan, Y.; Kabdrakhmanova, A. Monitoring of polychlorinated biphenyls (PCBs) in environmental objects of the city Ust-Kamenogorsk in Kazakhstan. Energy Procedia 2018, 153, 215–220. [Google Scholar] [CrossRef]
  21. Ramazanova, E.; Lee, S.H.; Lee, W. Stochastic risk assessment of urban soils contaminated by heavy metals in Kazakhstan. Sci. Total Environ. 2021, 750, 141535. [Google Scholar] [CrossRef]
  22. Durasov, A.M.; Tazabekov, T.T. Soils of Kazakhstan; Kainar: Almaty, Kazakhstan, 1981; p. 152. [Google Scholar]
  23. Saprykin, F.Y. Geochemistry of Soils and Nature Protection; Nedra: Moscow, Russia, 1989; p. 231. [Google Scholar]
  24. Food and Agriculture Organization of the United Nations (FAO). World Reference Base. Available online: https://www.fao.org/soils-portal/data-hub/soil-classification/world-reference-base/en/ (accessed on 23 May 2024).
  25. Derzhavina, L.M.; Bulgakova, D.S. Methodical Guidelines for the Comprehensive Monitoring of Soil Fertility of Agricultural Land; FGNU “Rosinformagroteh”: Moscow, Russia, 2003; p. 240. [Google Scholar]
  26. GOST 17.4.2.01-81; Nature Protection. Soils. Nomenclature of Indicators of Sanitary Condition. Standardinform: Moscow, Russia, 2008; p. 4.
  27. El-Taher, A. INAA and DNAA for uranium determination in geological samples from Egypt. Appl. Radiat. Isot. 2010, 68, 1189–1192. [Google Scholar] [CrossRef]
  28. Muzafarov, A.M.; Kulmatov, R.A. Multi-element analysis of chemical elements in soil samples using instrumental neutron activation method. Univ. Tech. Sci. 2020, 81, 100–104. [Google Scholar]
  29. Alemón, E.; Herrera, L.; Ortiz, E.; Longoria, L.C. Instrumental nuclear activation analysis (INAA) characterization of environmental air filter samples. Appl. Radiat. Isot. 2004, 60, 815–823. [Google Scholar] [CrossRef]
  30. Yazikov, E.G.; Shatilov, A.Y. Geoecological Monitoring. Educational Manual for Universities; Publishing House: Tomsk, Russia, 2003; 336p. [Google Scholar]
  31. Grigoriev, N.A. Average content of chemical elements in rocks composing the upper part of the continental crust. Geochemistry 2003, 7, 785–792. [Google Scholar]
  32. Rudnick, R.L.; Gao, S. Composition of the continental crust. In Treatise on Geochemistry; Elsevier: Amsterdam, The Netherlands, 2003; Volume 3, pp. 1–64. [Google Scholar]
  33. Baikenova, G.E. Ecological and Biogeochemical Assessment of Accumulation and Distribution of Chemical Elements in Natural and Anthropogenic Ecosystems of Northern Kazakhstan. Ph.D. Thesis, University of Kokshetau, Kokshetau, Kazakhstan, 2023. [Google Scholar]
  34. Jambayev, M.T.; Baranovskaya, N.V.; Lipikhina, A.V.; Boev, V.V.; Apsalikova, Z.S.; Raiymkulova, M.K.; Sudyko, A.F. Indicators of nuclear technogenesis on the example of the territories adjacent to the former Semipalatinsk test site. Bull. Tomsk. Polytech. Univ. Geo Assets Eng. 2019, 330, 217–229. (In Russian) [Google Scholar]
  35. Boyev, V.V.; Perminova, T.S.; Baranovskaya, N.V. Distribution of micro- and macroelements in soils of the Tomsk region. In Biogeo-Chemistry of Chemical Elements and Compounds in Natural Environments: Proceedings of the II International School-Seminar for Young Researchers in Memory of Professor V.B. Ilyin; Tyumen State University Publishing House: Tyumen, Russia, 2016; pp. 197–200. [Google Scholar]
  36. Otarov, A.; Ibrayeva, M.A.; Usipbekov, M. Brief characteristic of soil cover and analysis of the current state of soil fertility of South Kazakhstan region. Soil Sci. Agrochem. 2008, 70–78. [Google Scholar]
  37. Shapiro, S.S.; Wilk, M.B. An analysis of variance test for normality (complete samples). Biometrika 1965, 52, 591–611. [Google Scholar] [CrossRef]
  38. Kasimov, N.S.; Vlasov, D.V. Clarkes of chemical elements as comparison standards in ecogeochemistry. Vestn. Mosc. Univ. Geogr. 2015, 7–17. [Google Scholar]
  39. Maximum Permissible Concentrations (MPC) of Chemicals Substances in Soil: Hygienic Standards; Federal Center for Hygiene and Epidemiology of Rospotrebnadzor: Moscow, Russia, 2006; 15p.
  40. GOST 17.4.1.02-83; Nature Protection. Soils. Classification of Chemical Substances for Pollution Control. Standardinform: Moscow, Russia, 2008; p. 4.
  41. Faizov, K.S.; Asanbayev, I.K.; Akhmetova, K.K. Soil pollution of Kazakhstan by chemical toxicants. Hydrometeorol. Ecol. 2001, 156–165. [Google Scholar]
  42. Yaroshevsky, A.A. Clarkes of geospheres. In Handbook on Geochemical Prospecting for Minerals; Nedra: Moscow, Russia, 1990; pp. 7–14. [Google Scholar]
  43. Saet, Y.E.; Revich, B.A.; Yanin, E.P.; Achkasov, A.I.; Bazarevich, I.L.; Onishchenko, T.L.; Pavlova, L.N.; Sarkisyan, S.S.; Smirnova, R.S.; Trefilova, N.Y. Geochemistry of the Environment; Nedra: Moscow, Russia, 1990; p. 335. [Google Scholar]
  44. Kabata-Pendias, A.; Mukherjee, A.B. Trace Elements from Soils to Humans; Springer: Berlin/Heidelberg, Germany, 2007; p. 449. [Google Scholar]
  45. Boev, V.A. Se in soils and agricultural crops in the south of the Tyumen region. Tyumen State Univ. Her. 2013, 92–99. [Google Scholar]
  46. Greenwood, N.N.; Earnshaw, A. Chemistry of the Elements; Pergamon Press: Oxford, UK, 1984; p. 1542. [Google Scholar]
  47. Pyrzynska, K. Determination of selenium species in environmental samples. Microchim. Acta 2002, 140, 55–62. [Google Scholar] [CrossRef]
  48. El-Bassam, N.; Tietjen, C. Municipal sludge as organic fertilizer with special reference to the heavy metals constituents. In Soil Organic Matter Studies; IAEA: Vienna, Austria, 1977; Volume 2, p. 253. [Google Scholar]
  49. Tyler, G. Leaching of metals from the A-horizon of a spruce forest soil. Water Air Soil Pollut. 1981, 15, 353–369. [Google Scholar] [CrossRef]
  50. Burger, A.; Lichtscheidl, I. Strontium in the environment: Review about reactions of plants towards stable and radioactive strontium isotopes. Sci. Total Environ. 2019, 653, 1458–1512. [Google Scholar] [CrossRef] [PubMed]
  51. Kobegenova, H.N.; Shakenova, T.K. Degradation of soil properties as a result of natural and anthropogenic factors on the territory of the Republic of Kazakhstan. Bull. Sholem Aleichem Amur State Univ. 2017, 32–38. [Google Scholar]
Figure 1. Location of soil samples on the territory of Kyzylorda and Turkestan regions.
Sustainability 16 06361 g001
Figure 2. Elemental composition of soil of the territory of Southern Kazakhstan, in comparison with Clarkes (mg/kg, logarithmic scale). (a,b) Comparison with Clarkes described in [29,30].
Sustainability 16 06361 g002aSustainability 16 06361 g002b
Figure 3. Elemental composition of soils of the territory of Southern Kazakhstan in comparison with soils of other regions (mg/kg, logarithmic scale). Comparison with Clarkes described in [31,32,33].
Sustainability 16 06361 g003
Figure 4. Concentration coefficients of chemical elements in the territory of Southern Kazakhstan relative to the Tyumen Federal Nature Reserve.
Sustainability 16 06361 g004
Figure 5. Dendrogram of correlation matrix of the geochemical spectrum of elements in the soil of South Kazakhstan.
Sustainability 16 06361 g005
Table 1. Coordinates of sampling points.
SettlementCoordinatesSettlementCoordinates
Aralsk46°47′ N 61°40′ EJuantobe44°45′51″ N 68°49′52″ E
Zhalanash46°39′25″ N 61°08′13″ ETasty44°48′02″ N 69°10′11″ E
Mergensay46°47′56.47″ N 61°25′24.64″ EBakyrly44°21′47″ N 67°46′04″ E
Kamystybas46.199722° N 61.799444° ESozak44°08′25″ N 68°28′30″ E
Karateren45°58′47″ N 61°03′01″ ESholakkorgan43°45′54″ N 69°10′33″ E
Aiteke bi45°51′06″ N 62°08′59″ ETurkestan43°18′07″ N 68°16′09″ E
Baikonur45°37′ N 63°19′ EShaulder42°46′36″ N 68°22′08″ E
Zhosaly45°29′17″ N 64°05′32″ EAktas42°55′29″ N 70°02′04″ E
Kyzylorda44°51′ N 65°31′ ETulkibas42°29′24″ N 70°17′24″ E
Shieli44°09′47″ N 66°44′43″ EKoksarai42°38′53″ N 68°09′11″ E
Zhanakorgan43°54′16″ N 67°15′04″ EShymkent42°19′0″ N 69°35′45″ E
Baikenge43°53′20″ N 66°55′05″ ESaryagash41.4667° N 69.1667° E
Kelintobe43°28′03″ N 67°27′28″ EAbay41°20′55″ N 68°56′40″ E
Taikonyr45°12′32″ N 67°32′04″ EKyzylasker41°05′34″ N 68°41′48″ E
Kyzemshek45°16′01″ N 68°55′34″ EZhetisay40.7753° N 68.3272° E
Table 2. Indicators of chemical element content in soil (mg/kg) of the territory of Southern Kazakhstan, in comparison with literature data.
Southern Kazakhstan[31][32][33][34] [35]
ElementMean ± St. Error
Min//Max
CVStd. DevSkewnessKurtosis
Li7.16 ± 0.63
2.28//134
422.970.550.000730249.3--
Be0.21 ± 0.02
0.06//0.38
430.090.45−0.472.32.10.6--
B3.77 ± 1.28
0.69//24
1596.012.967.9534179.3--
* Na9942 ± 330
4097//13,210
171684−1.185.3920,70024,26024115,5494640
Mg9477 ± 1867
1494//38,048
9287552.556.4617,70014,9503805--
Al3872 ± 324
1296//6324
3915220.14−0.8876,10081,5006100--
Si580 ± 154
93//3677
1247224.0918.03283,200-3975--
P516 ± 37
178//870
331720.003−0.13690655882--
S1508 ± 278
523//5250
8613031.923.1114006212801--
Cl642 ± 126
81//2244
925901.572.011500370---
K1449 ± 130
513//2761
426120.47−0.4822,30023,2402834--
* Ca53,521 ± 1837
30,186//69,729
189367−0.510.00538,90025,66011,30720,6868055
* Sc8.59 ± 0.37
2.63//12
221.91−1.222.8715.6141.7810.82.6
Ti14 ± 1.48
4.31//31
506.940.780.283930384017--
V8.77 ± 0.72
3.09//17
393.390.460.781209728.4--
* Cr56 ± 2.35
17//74
2112−1.113.3492.49216.975.4137
Mn388 ± 31
152//732
381480.330.1770774569--
* Fe24,436 ± 1073
6360//32,070
225469−1.563.9940,60039,180844431,1046379
* Co10 ± 0.46
3.52//14
232.36−1.222.011717.310.612.05.1
Ni13 ± 2.69
3.75//66
9812.643.7615.9354720.3--
Cu10 ± 1.21
2.98//29
565.691.854.97392817.7--
* Zn86 ± 3.827
38.81//138
2319.510.362.0475679620512
Ga1.41 ± 0.1
0.71//2.29
340.480.28−1.011917.52.5--
Ge0.06 ± 0.004
0.03//0.09
330.020.0003−1.010.000131.40.07--
* As6.02 ± 0.35
2.92//9.57
301.810.045−0.830.000564.85.65.71.3
Se0.39 ± 0.03
0.19//0.68
370.150.69−0.530.000020.090.6--
* Br21 ± 3.101
6.23//88
7415.813.1812.970.00021.615.312.80.68
* Rb79 ± 2.7
26.70//102
1713.76−2.038.2598848.367.434
* Sr333 ± 19.081
171.47//583
2997.300.530.512703207915970
Y5.20 ± 0.36
0.73//2.46
331.710.24−1.1226218.9--
Zr1.65 ± 0.11
0.001//0.15
310.51−0.36−0.821601933.5--
Nb0.06 ± 0.01
0.02//0.57
630.040.630.7912120.2--
Mo0.16 ± 0.03
0.0001//0.002
850.141.993.941.561.10.2--
Ru0.0003 ± 0.00008
0.0001//0.001
860.00041.020.92-0.000340.01--
Rh0.005 ± 0.001
0.0005//0.02
940.0042.707.83-----
Pd0.01 ± 0.001
0.73//2.46
440.0050.04−0.40-0.000520.02--
Cd0.13 ± 0.01
0.04//0.25
440.060.30−0.460.640.090.24--
In0.006 ± 0.001
0.002//0.01
440.0030.931.480.000020.050.01--
Sn0.06 ± 0.005
0.02//0.11
390.020.05−0.420.000352.10.07--
* Sb0.88 ± 0.047
0.38//1.51
270.240.381.100.00010.40.091.00.23
Te0.01 ± 0.002
0.001//0.04
1120.011.541.69--0.02--
I1.38 ± 0.15
0.3//3.19
520.721.051.150.00011.441--
* Cs4.43 ± 0.21
1.20//6.34
251.09−1.022.1154.90.252.80.66
* Ba473 ± 14.46
176.67//546
1673.75−2.7510.2151062498437276
* La24 ± 0.71
16.48//32
153.62−0.140.2932311222.97.9
* Ce51 ± 2.07
21.06//71
2110.55−1.002.2463632649.916
Pr1.71 ± 0.1
0.95//2.62
280.480.42−0.718.77.13--
* Nd20 ± 0.851
10.76//30
214.34−0.28−0.1129271216.28.5
* Sm4.44 ± 0.146
2.99//6,00
170.740.260.215.74.72.54.51.4
* Eu1.05 ± 0.050
0.64//1.88
240.261.373.451.31.00.50.90.23
Gd1.52 ± 0.1
0.81//2.35
300.460.29−0.816.34.02.5--
* Tb0.61 ± 0.033
0.31//1.00
280.170.32−0.280.890.70.340.60.17
Dy1.08 ± 0.07
0.56//1.69
310.340.30−0.944.83.91.8--
Ho0.19 ± 0.01
0.10//0.30
320.060.29−0.941.30.830.3--
Er0.49 ± 0.03
0.24//0.78
320.160.22−0.932.72.30.9--
Tm0.06 ± 0.004
0.03//0.10
320.020.18−0.980.420.30.12--
* Yb1.98 ± 0.077
0.95//2.80
200.39−0.261.162.52.00.72.51.1
* Lu0.29 ± 0.012
0.13//0.41
210.06−0.171.010.480.310.10.40.12
* Hf4.29 ± 0.201
0.95//6.13
241.03−1.043.464.55.30.115.25.8
* Ta0.54 ± 0.036
0.01//0.78
340.18−1.432.311.40.90.020.70.35
W0.03 ± 0.005
0.001//0.11
710.021.603.902.031.90.03--
Re0.0006 ± 0.0002
0.0001//0.004
1370.00022.587.61-0.000190.002--
Os0.0001 ± 0.00001
0.00005//0.0002
580.000013.5212.34-0.000030.01--
Ir0.0004 ± 0.0002
0.00005//0.005
2210.00024.4220.17-0.000020.02--
Pt0.0003 ± 0.00006
0.00005//0.001
990.000060.78−0.73-0.00050.01--
* Au0.001 ± 0.0003
0.0001//0.01
1180.0022.668.610.00440.00150.010.010.001
Hg0.02 ± 0.003
0.001//0.06
870.021.522.550.0650.050.14-0.011
Tl0.04 ± 0.004
0.011//0.09
540.021.151.600.00010.90.07--
Pb9.33 ± 1.03
3.51//22
524.821.321.35171725.3--
Bi0.08 ± 0.01
0.013//0.14
450.03−0.19−0.530.000030.160.08--
* Th7.92 ± 0.347
2.97//11
221.77−0.851.089.110.526.82.3
* U3.08 ± 0.16
1.65//5.73
260.821.083.582.52.70.92.60.87
* Chemical elements analyzed by instrumental neutron activation analysis (INAA).
Table 3. Characterization of chemical element distribution by coefficient of variation for samples of soil cover of the territory of South Kazakhstan.
Homogeneous
CV ≤ 40%
Heterogeneous 40% < CV ≤ 80%Highly Heterogeneous
80% < CV < 120%
Extremely Heterogeneous
CV ≥ 120%
Na, Al, P, Ca, Sc, V, Cr, Mn, Fe, Co, Zn, Ga, Ge, As, Se, Rb, Sr, Y, Zr, Sn, Sb, Cs, Ba, La, Ce, Pr, Nd, Sm, Eu, Gd, Tb, Dy, Ho, Er, Tm, Yb, Lu, Hf, Ta, Th, ULi, Be, K, Ti, Cu, Br, Nb, Pd, Cd, In, I, W, Os, Tl, Pb, BiMg, S, Cl, Ni, Mo, Ru, Rh, Te, Pt, Au, HgB, Si, Re,
Ir
Table 4. Geochemical series of chemical elements in the soil cover of the territory of South Kazakhstan.
Criterion LevelReferenceGeochemical Series of Chemical Elements
Clarke of chemical elements in continental soils[42]Ca3.5, Rb2.2, S2.1, Br2.1, Na1.9, Mg1.8, U1.5, Sr1.3, Sc1.2, Co1.2, Cs1.1, As1.0, Ce1.0, Eu1.0, Au1.0.
Clarke of chemical elements of the upper continental crust[31]Te3.3, I2.8, Se2.6, Br2.0, Ca1.4, Sr1.2, U1.2, S1.1, Zn1.1, As1.1, Sb1.1.
Table 5. Coefficient of concentration of chemical elements in soils of Kyzylorda and Turkestan regions relative to the regional average.
RegionCoefficient of Concentration
Kyzylorda region
Ztpi = 62
Ir = 6.4, Re = 4.0, Si = 3.8, S = 2.1, Mo = 2.1, Ti = 1.8, Cl = 1.7, Nb = 1.7, In = 1.7, V = 1.5, Pt = −1.5, Hg = 1.5, Li = 1.4, Be = 1.4, Cu = 1.3, Ga = 1.3, Br = 1.3, Ru = −1.3, Bi = 1.3, Al = 1.2, Ni = 1.2, Se = 1.2, Ge = 1.1, Au = −1.1, Tl = 1.1, Na = 1.0, Ca = 1.0, Sr = 1.0, Y = 1.0, Zr = 1.0, Pd = −1.0, Cd = 1.0, Ba = 1.0, Pr = 1.0, Gd = 1.0, Dy = 1.0, Ho = −1.0, Er = 1.0, Tm = −1.0, W = −1.0, Pb = 1.0, U = 1.0
Turkestan region
Ztpi = 34
Au = −1.7, Ru = −1.4, Pd = −1.1, Hf = 1.1, W = −1.1, B = 1.0, Mg = 1.0, P = 1.0, K = 1.0, Sc = 1.0, Cr = 1.0, Mn = 1.0, Fe = 1.0, Co = 1.0, Zn = 1.0, As = 1.0, Rb = 1.0, Sb = 1.0, I = 1.0, C = s1.0, La = 1.0, Ce = 1.0, Nd = 1.0, Sm = 1.0, Eu = 1.0, Tb = 1.0, Ho = −1.0, Er = −1.0, Tm = −1.0, Yb = 1.0, Lu = 1.0, Ta = 1.0, Pt = −1.0, Th = 1.0.
Disclaimer/Publisher’s Note: The statements, opinions and data contained in all publications are solely those of the individual author(s) and contributor(s) and not of MDPI and/or the editor(s). MDPI and/or the editor(s) disclaim responsibility for any injury to people or property resulting from any ideas, methods, instructions or products referred to in the content.

