Abstract
With the rapid advancement of medical technology and the intensification of global aging trends, the health and wellness industry is flourishing, making the location and routing of health resorts increasingly crucial. This study focuses on the location and routing issues of cold chain logistics in health resorts, constructing a location-routing model that minimizes carbon emissions while considering demand uncertainty. The model employs a carbon trading strategy to achieve overall cost minimization, utilizes triangular fuzzy numbers to handle demand uncertainty, and integrates an improved genetic algorithm with the Gurobi solver for efficient optimization. The results reveal the significance of carbon trading and refrigeration costs in cold chain logistics for health resorts, highlighting the importance of reducing carbon emissions and transitioning to green energy. This research provides a comprehensive methodological approach to location-routing decisions in cold chain logistics for health resorts, laying a theoretical and practical foundation for sustainable development in this field.
1. Introduction
With increasing human life expectancy and declining birth rates, the global aging trend is intensifying, thereby increasing the demand for healthcare and elderly care services. Beard et al. [1] explored the impact of global aging on health aging policies, emphasizing the crucial need to address the rising demand for healthcare and nursing services in this context. In this context, the healthcare sector’s cold chain logistics system is particularly important, ensuring the safe transportation of crucial supplies such as medications and vaccines. However, research on carbon emissions in the field of cold chain logistics remains insufficient. Reducing carbon emissions is crucial for achieving environmental sustainability, especially considering the goals outlined in the United Nations’ 2016 Paris Agreement, which aims to significantly reduce global greenhouse gas emissions and limit global temperature rise to within 2 °C this century, with efforts to further restrict it to 1.5 °C. These goals align with principles of sustainable development [2].
Recent academic progress in location-routing problems has been significant. For instance, Yıldız E. et al. [3] developed a metaheuristic algorithm based on iterative local search and variable neighborhood search for two-level location-routing problems. Wu S. et al. [4] proposed a collaborative distribution and sales model, showing significant profit increases for service providers and effective cost mitigation in rural areas. Dharmika N. et al. [5] established a multi-objective location-routing model aimed at minimizing total costs and maximizing service levels, providing solutions for specific problems. Hu D. et al. [6] used an improved genetic algorithm to compare open location-routing problems for fuel and electric vehicles, confirming the significant cost reduction benefits of green energy vehicles. SONG L. et al. [7] constructed a fresh food distribution route optimization model for mixed fleets of fuel and electric vehicles. Li K. et al. [8] focused on the location-routing inventory problem, using an improved non-dominated sorting genetic algorithm to reduce corporate carbon emissions.
Although existing research has achieved certain results, most still primarily consider either cost minimization or environmental sustainability, without adequately combining the two. Moreover, many studies fail to fully consider demand uncertainty, a key factor in practical applications. Building on existing research, this study proposes a comprehensive location-routing model tailored to the specific needs of cold chain logistics in health resorts. The model comprehensively integrates factors such as environmental sustainability, cost minimization, and demand uncertainty. By using an improved genetic algorithm combined with the Gurobi solver to solve the model, it aims to provide an economically efficient and environmentally friendly optimization solution for cold chain logistics systems in health resorts, reducing total operating costs and promoting sustainable development.
The main contributions of this study are concentrated in four key areas. First, focusing on the dynamic healthcare sector, this paper analytically examines specific health resort areas, showcasing a forward-looking research perspective. Second, this study innovatively establishes a decision model that comprehensively considers both the location and routing of cold chain logistics, with particular emphasis on the comprehensive assessment of carbon emissions. Third, this paper proposes a strategy utilizing carbon trading mechanisms, effectively translating carbon emission minimization into overall cost optimization, which is both environmentally friendly and economically efficient. Considering demand uncertainty, this study uses the triangular fuzzy numbers method to enhance the model’s flexibility and adaptability. Lastly, by introducing an improved genetic algorithm combined with the Gurobi solver, this approach significantly enhances solution convergence speed and performance compared to traditional genetic algorithms. These innovations not only enrich theoretical research but also provide practical guidance for healthcare logistics.
The structure of this paper is outlined as follows. Section 2 reviews the latest related literature, providing a theoretical foundation and reference for this study. Section 3 elaborates on the research problem and constructs a precise location-routing model, offering a clear analytical framework for the study. Section 4 focuses on the in-depth processing and analysis of the model, ensuring a close integration of theory and practice. Section 5 thoroughly introduces the design concept and implementation process of the algorithm, demonstrating its innovativeness and practicality. Section 6 validates the effectiveness of the model and algorithm through case studies in health resort areas, assessing the model’s robustness under different environmental conditions through sensitivity analysis. Finally, Section 7 summarizes the core findings and significance of the study, offering forward-looking suggestions for future research directions, aiming to assist in further exploration in this field.
2. Literature Review
In the latest research in the field of logistics and transportation management, scholars have made significant strides through the use of innovative algorithms to delve deeply into location-routing problems, showcasing notable progress in the field. Rodriguez D. et al. [9] proposed a metaheuristic optimization strategy for the location-routing problem in transportation network design, proving its effectiveness and efficiency in medium-sized cities. Domínguez-Martín B. et al. [10] employed a branch-and-cut algorithm with over 100 nodes to effectively handle single-commodity pickup and delivery location problems. Liu Y. et al. [11] developed an innovative business model for on-demand drone parcel transport services, offering a fresh perspective in the field of drone logistics by comparing three different computational methods combined with an optimization simulation framework. JIANG H. et al. [12] utilized quantum evolutionary algorithms to address open low-carbon location-routing problems. Le Colleter T. et al. [13] constructed a vehicle-routing model combining walking and driving delivery, solving cases through the development of small and large neighborhood search metaheuristic variants, with results showing an average of 19% savings in work time. Erdoğdu et al. [14] proposed solving the green vehicle-routing problem by combining adaptive large neighborhood search with two new local search heuristics.
With the increasing focus on environmental sustainability, scholars have begun to delve into mixed-vehicle delivery strategies and their impact on carbon emissions. YANG L. et al. [15] compared the location decision and total delivery cost of charging and battery-swapping stations for electric logistics vehicles under charging and battery-swapping modes, finding that delayed delivery and public charging station fees affect logistics companies’ decisions. Kabadurmuş Ö. et al. [16] explored the relationship between carbon emissions and service levels in vehicle-routing problems, revealing that enhancing service levels leads to increased carbon emissions, total distance, and costs. YANG J. et al. [17] applied a two-stage heuristic algorithm to address the location and delivery problems of charging stations in electric vehicle logistics distribution systems. Esmaeilnejad S. et al. [18] focused on the long-term planning and optimization of electric vehicles, constructing a linear deterministic optimization model and a two-stage stochastic planning process, effectively optimizing passenger operation costs and capital costs. Dai Z. et al. [19] used competitive simulated annealing algorithms to explore the application of mixed fleets and battery swapping stations in home healthcare location-routing problems. Zhou Y. et al. [20] studied time-varying green location-routing problems, optimizing the locations of distribution centers using greedy algorithms and ant colony optimization. Dönmez S. et al. [21] used large neighborhood search algorithms to solve the mixed-fleet vehicle-routing problem with time windows and partial charging of multiple chargers, demonstrating their application potential in complex environments. Nguyen Q. et al. [22] compared the cost and carbon dioxide emissions of last-mile delivery strategies using diesel trucks, electric trucks, cargo bikes, and autonomous delivery vehicles in Paris. These studies not only provide an in-depth understanding of mixed-vehicle delivery strategies but also offer practical solutions for reducing carbon footprints in the logistics field.
In addressing specific logistics and transportation management problems, scholars have proposed a series of innovative solutions. Rossi T. et al. [23] introduced a rolling inventory model that eliminates barriers to implementing multimodal transport of perishable food items. Pu X. et al. [24] developed an optimization model aimed at minimizing travel distances and logistics costs for urban multi-site vehicle-routing problems, validating its effectiveness through a chemical reaction optimization algorithm. He X. et al. [25] successfully solved the collection challenge of free-floating shared bicycles using heuristic methods. LI Y. et al. [26] focused on pre-cooling location-routing models for agricultural products, achieving cost-efficient optimization for multi-type services in villages and towns. In the same year, Caramia M. et al. [27] proposed a two-stage model that excels in waste management, finding the optimal location allocation solutions by effectively clustering customers and allocating facilities to these clusters without overlap, thereby significantly reducing carbon dioxide emissions. Aloullal A. et al. [28] studied a multi-period single-assignment-hub location-routing model under a hub-and-spoke setting, using heuristic algorithms to solve time-dependent decision problems. Soto-Mendoza V et al. [29] effectively addressed open routing problems for collection and delivery locations using node and flow formulations. These studies not only demonstrate innovative approaches in logistics and supply chain management to environmental challenges but also provide practical and efficient solutions to related problems.
This study builds upon previous research to thoroughly investigate site selection path issues in medical resort cold chain logistics. Table 1 comprehensively summarizes the innovations and differences in key features and research outcomes between this study and traditional research.

Table 1.
Summary and comparison of site selection path features.
3. Problem Description and Modeling
3.1. Problem Description
This study focuses on the location and route planning of cold chain logistics centers in health resort areas. The core task includes determining the optimal logistics center locations and designing efficient goods transportation routes. Factors considered include the distances from dispatch points to logistics centers, from logistics centers to customer nodes, and between customer nodes, as well as the storage capacities of the logistics centers. The aim is to achieve the lowest total cost, minimal total carbon emissions, and optimal delivery routes.
Under the premise of considering environmental sustainability and uncertainty in customer demand, this paper aims to select appropriate distribution centers and propose the best delivery strategies. While adhering to the restrictions of the maximum carrying capacity of vehicles and the storage capacity of distribution centers, the focus of the study is to optimize the entire logistics process. This includes reducing the construction and operational costs of logistics centers, minimizing the costs of refrigeration and damaged goods, and minimizing transportation costs and carbon emissions.
This study assumes that the distribution centers have an adequate number of homogeneous delivery vehicles; the transportation process only includes the delivery phase; each vehicle departs from and ultimately returns to a designated distribution center; all transported goods are of the same type, and temperature conditions remain constant during transportation; carbon emission calculations only include carbon dioxide emissions; customer order splitting is not involved; and there is no route congestion during delivery, with vehicles traveling at a constant speed.
3.2. Model Establishment
3.2.1. Parameter Description
The parameters required for the model are shown in Table 2.
Table 2.
Model parameters.
3.2.2. Cost Variable Analysis
- The operational cost () of the logistics center:The operational cost of the logistics center primarily comprises rent and storage costs. The storage costs are dependent on the quantity of goods stored in the logistics center, as expressed in Equation (1).
- The daily fixed cost () of the vehicles:Refrigerated trucks departing from dispatch points or distribution centers incur a fixed daily cost upon activation, including the driver’s salary, vehicle depreciation, maintenance fees, etc. This part of the cost is related to the number of refrigerated trucks, as shown in Equation (2).
- Refrigeration cost ():The refrigeration cost mainly refers to the cost of refrigerants used to maintain the temperature inside the vehicle. In this paper, the refrigeration cost includes the refrigerant consumed during the journey from the dispatch point to the distribution center and from the distribution center to the customer nodes. The refrigeration cost during transportation is positively correlated with the vehicle’s operating time. Since the vehicle’s doors are opened only once during the loading and unloading process and the volume remains consistent, the refrigeration cost during this stage is also positively correlated with time. The total refrigeration cost is shown in Equation (3).
- Transportation cost ():The transportation cost primarily consists of the fuel consumption cost of the refrigerated truck during transportation. Fuel consumption is estimated using the load estimation method, which assumes a certain linear relationship between the vehicle load and fuel consumption rate. When a refrigerated truck carries goods with a weight of Q, the normal fuel consumption per unit distance is as shown in Equation (4).In this paper, the transportation cost includes the fuel consumption from the dispatch point to the distribution center and from the distribution center to the customer nodes. When the vehicle completes service to all customers, the total transportation cost for the entire process is as shown in Equation (5).
- Cost of goods damaged during vehicle delivery :As the journey from the dispatch point to the distribution center usually involves transportation using large refrigerated trucks and does not include loading and unloading of goods en route, this paper only considers the cost of goods damaged during the service process from the distribution center to the customers. This includes the cost of goods damaged due to the passage of time during delivery and the damage caused by environmental changes during loading and unloading. To better measure the cost of damaged goods, a freshness decay function is introduced, as shown in Equation (6).where represents the freshness of the goods before departure, represents the freshness at time t, and m represents the freshness decay coefficient. Since the environmental changes inside the vehicle are more significant when the doors are opened during loading and unloading, the freshness decay coefficient during the loading and unloading phase () is greater than the freshness decay coefficient during the transportation phase (). The costs of goods damaged during the transportation phase and the service phase are shown in Equations (7) and (8), respectively.The total cost of damaged goods is shown in Equation (9).
- The carbon emission cost ():The carbon emissions in cold chain logistics are higher than in general traditional logistics; hence, it is necessary to consider carbon emissions. This paper primarily focuses on carbon emissions during the transportation and storage stages. The transportation stage includes emissions from dispatch points to distribution centers and from distribution centers to customer points.In the transportation stage, carbon emissions () are generated by fuel consumption during vehicle operation. The carbon emissions investigated in this paper are measured based on vehicle load, driving distance, and a carbon dioxide coefficient [30]. Here, represents the carbon dioxide coefficient, and according to the “Provincial Greenhouse Gas Inventory Compilation Guide”, the unit fuel carbon emission coefficient is 2.38, as shown in Equation (10).In the storage stage, carbon emissions primarily stem from the electricity consumed by refrigeration equipment. The electricity consumption of refrigeration equipment is correlated with the temperature and capacity of the cold storage. The carbon emission function for cold storage is introduced as in Equation (11).where h represents the number of refrigeration units, with h = 1 for a refrigeration unit; p is the power of the refrigeration unit; t is the average working time; and is the proportion of electricity converted to carbon emissions. According to the “China Energy Statistical Yearbook”, every kilowatt hour of electricity consumed produces 0.997 Kg of carbon dioxide ( = 0.997 kg/kw·h).Therefore, the carbon emissions produced during the storage phase are as shown in Equation (12).In evaluating the carbon emissions of the model, this paper uses carbon emission costs as a measure, as in Equation (13).
3.2.3. Model Establishment
Based on the above analysis, this paper constructs a mathematical model for optimizing location and delivery in cold chain logistics. The model is established with the objective function of minimizing the total cost, which includes daily fixed costs of vehicles during location selection and delivery in cold chain logistics, operational costs, transportation costs, refrigeration costs, damaged goods costs, and carbon emission costs.
Equations (14) and (15) are the objective functions of the model. Equation (16) stipulates that at least one logistics center must be established. Equation (17) states that the goods inventory level must be greater than 0. Equation (18) is the capacity constraint of the logistics center. Equations (19) and (20) represent the constraint relationships between the total amount of goods provided by dispatch points, storage volume at the logistics center, and customer demand. Equation (21) is the capacity constraint of the transportation vehicles. Equation (22) ensures that no goods are transferred between distribution centers. Equation (23) ensures that the number of vehicles entering a distribution center equals the number exiting. Equation (24) eliminates sub-route constraints. Equations (25) and (26) ensure that each customer is visited exactly once. Equations (27) and (28) maintain time continuity. Equations (29)–(33) define the range of variables.
4. Model Processing
4.1. Integration of the Model
Based on an understanding of the new concepts proposed globally regarding emission reduction targets, the carbon emissions in the model, denoted as , are transformed by introducing a carbon share () and carbon trading price (), converting them into the minimum carbon trading cost, as shown in Equation (34).
Therefore, the model’s multi-objective functions ( and ) are transformed into a single objective function, minimizing the total cost, as shown in Equation (35).
4.2. Defuzzification of the Model
The objective function in Equation (14), as well as the constraints in Equations (19)–(21), contain fuzzy parameters. The three fuzzy numbers defining the demand quantity are denoted as , where l, m, and r are three parameters representing the most conservative estimate, the most likely value, and the most optimistic value, respectively. Referring to the method of handling triangular fuzzy numbers proposed by Fazayeli S. et al. [31], the demand quantity parameter (q) at the level in this model is equivalent to the exact form of , as shown in Equation (36).
where [0, 1]. After integration and defuzzification, the model is transformed into the following form:
5. Algorithm Design
5.1. Algorithm Concept
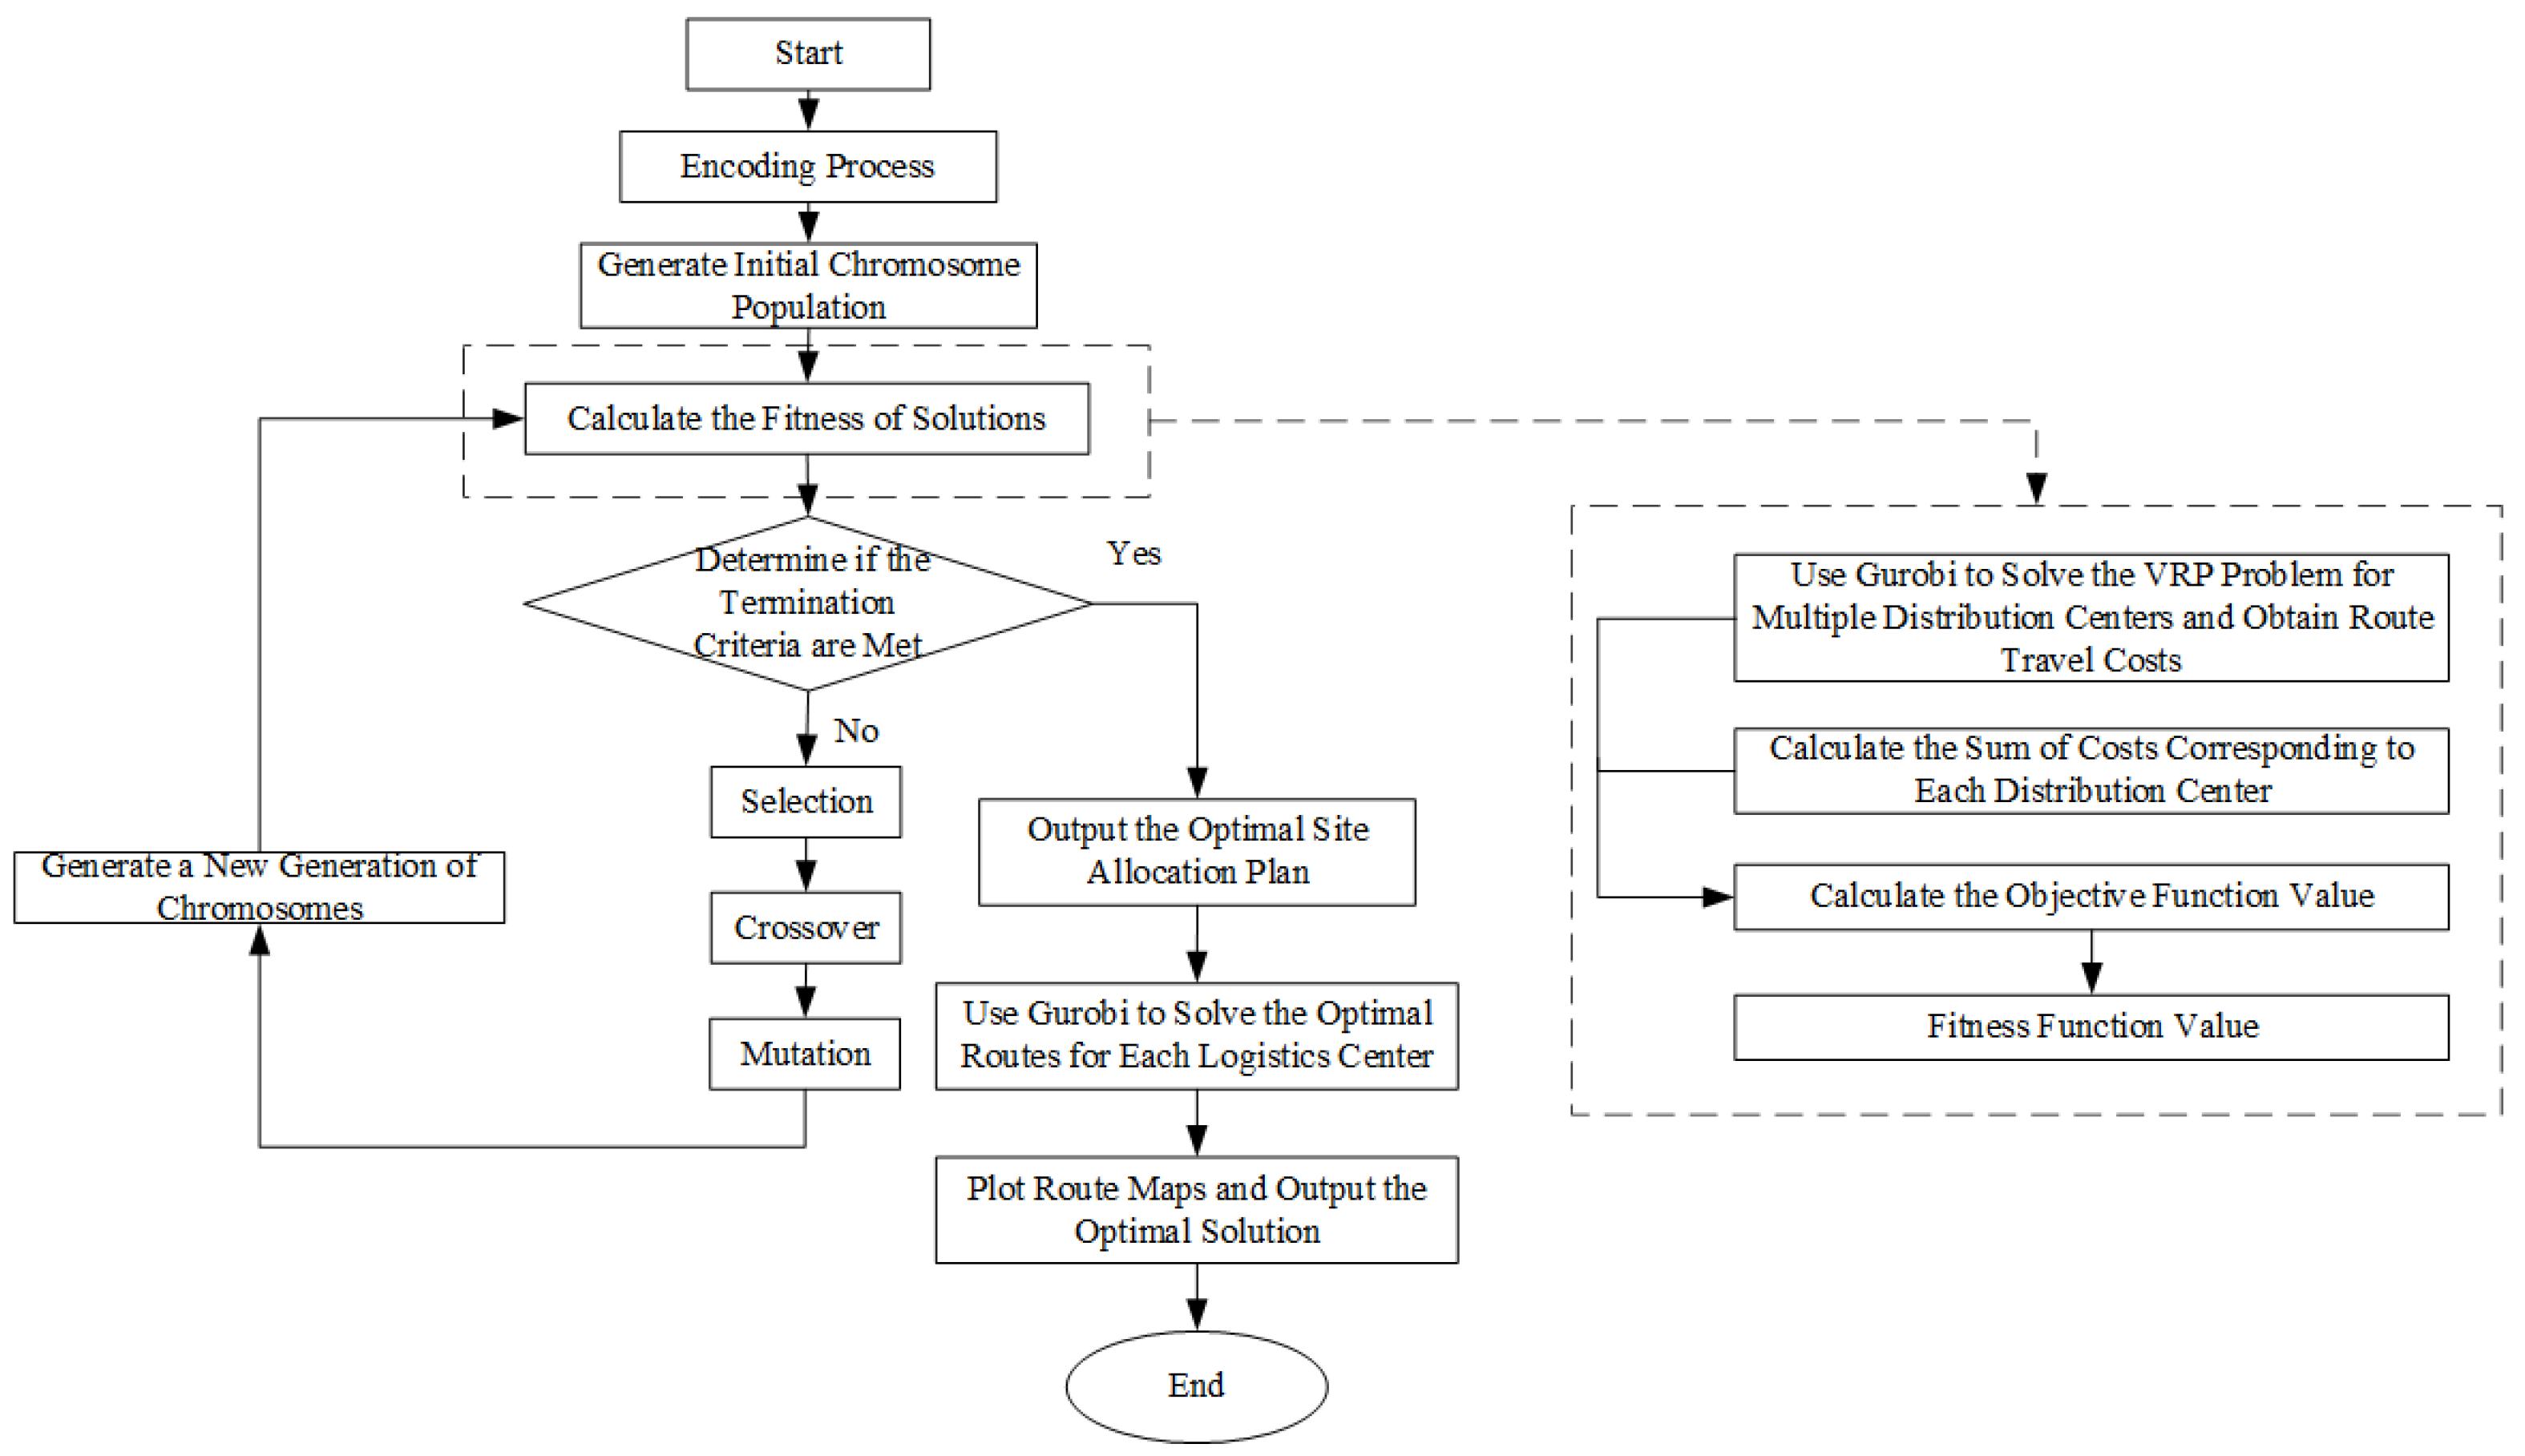
The location and route optimization model of cold chain logistics centers involved in this study is a typical NP-hard problem, characterized by high complexity and computational load. To address this, we propose an innovative hybrid optimization method that combines an improved genetic algorithm with the Gurobi solver, effectively seeking optimal objective function values. This method primarily uses a genetic algorithm to solve location allocation problems, while leveraging the Gurobi solver for route arrangement during the evaluation process of each generation of solutions. The algorithm flow chart is shown in Figure 1.
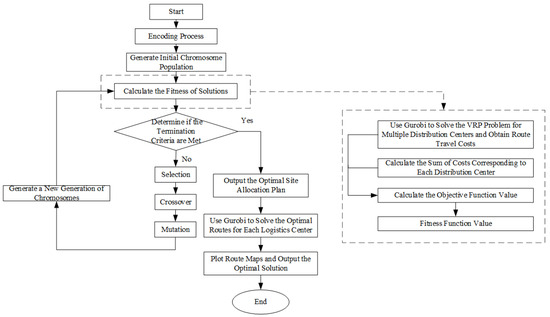
Figure 1.
Algorithm flow chart.
5.2. Improved Genetic Algorithm
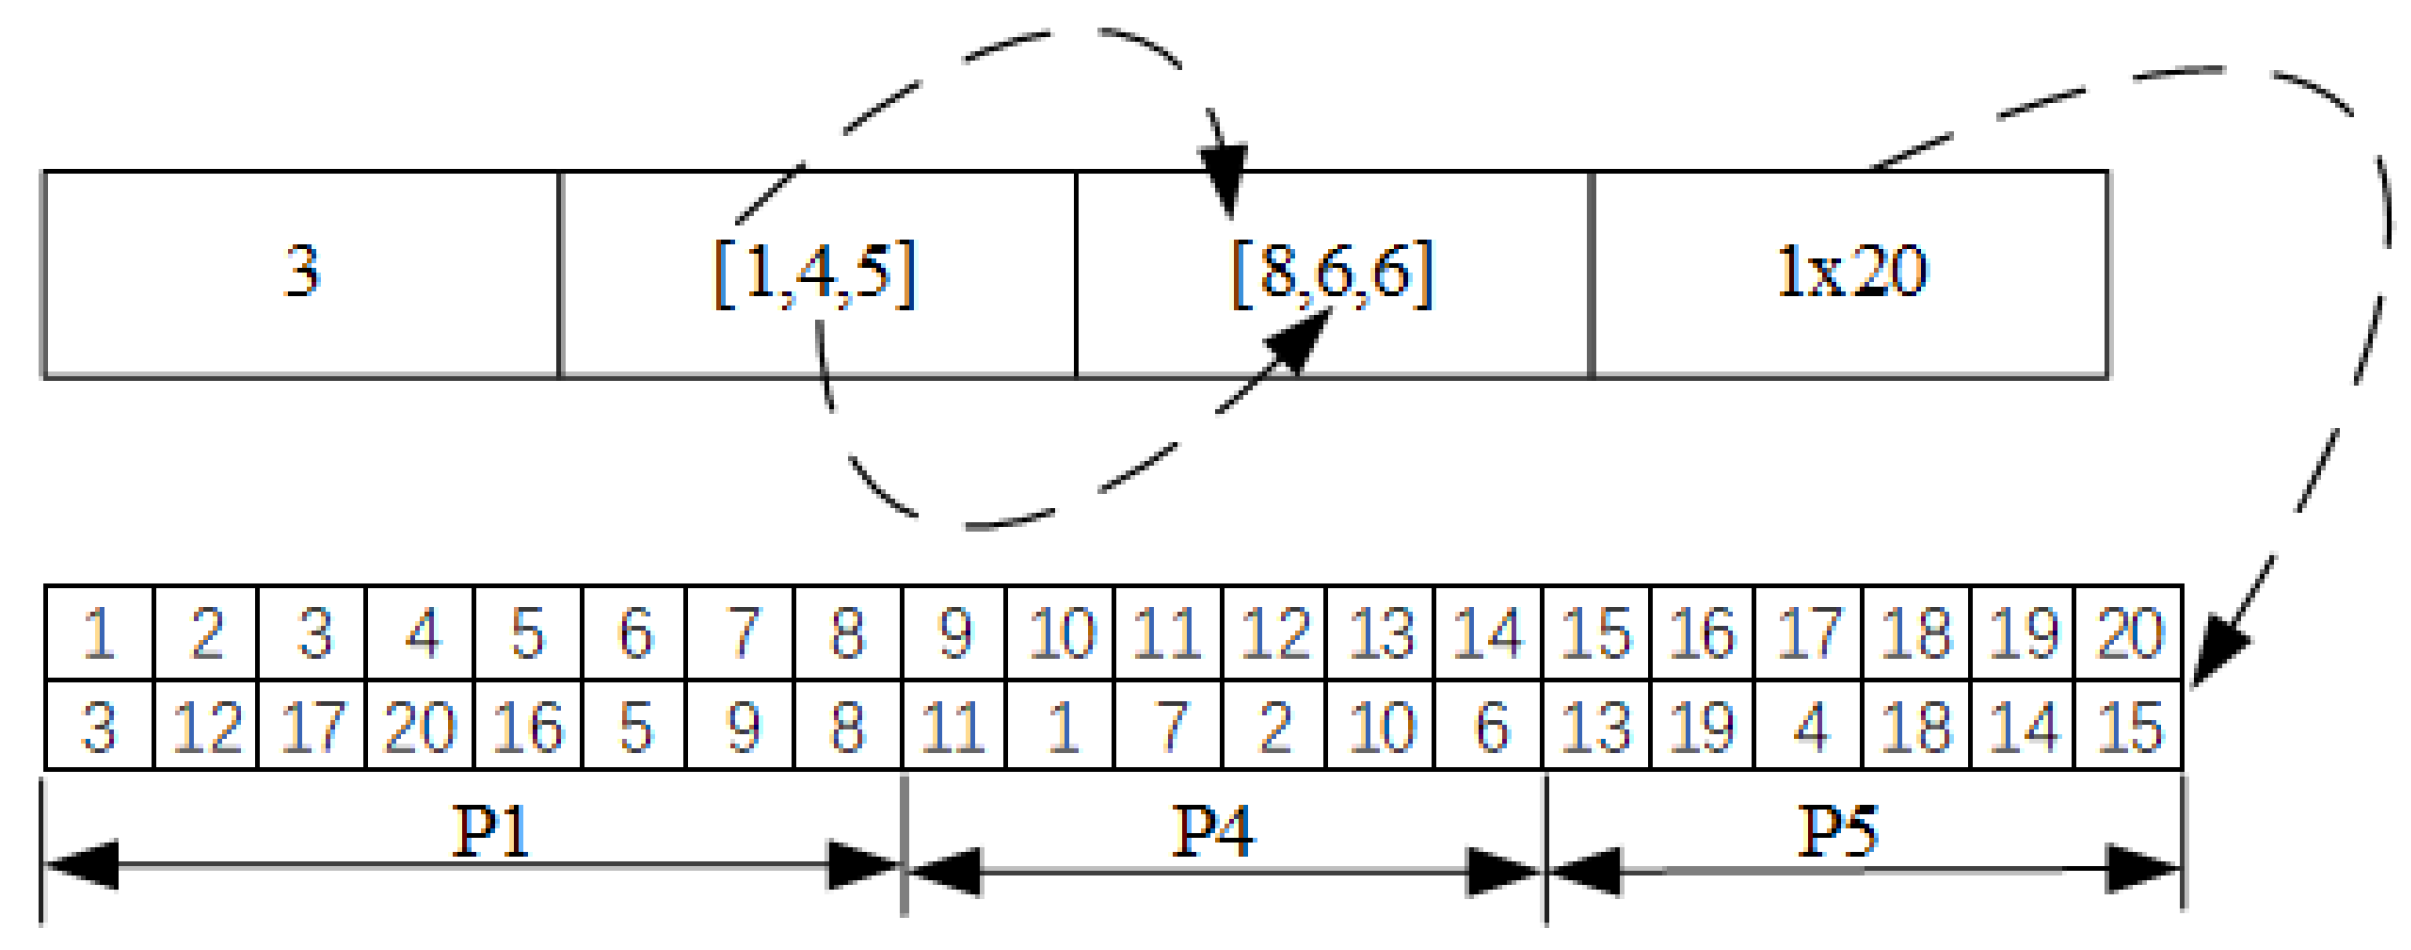
- Encoding and decoding:In this study, the improved genetic algorithm adopts real-number encoding, where each chromosome represents a possible solution, including arrays of potential centers and customer nodes. Chromosomes are divided into the following four parts: the number of selected distribution centers, distribution center identifiers, the number of customers served by each distribution center, and customer nodes. An example is shown in Figure 2.
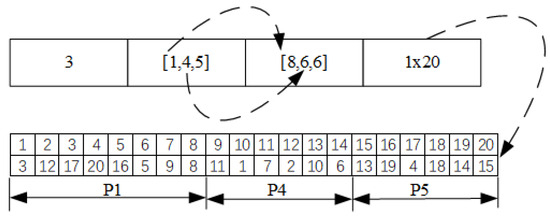 Figure 2. Encoding and decoding.Figure 2 shows 20 customers, where one set of solutions can be decoded as selecting three distribution centers, namely P1, P4, and P5. P1 serves eight customers, specifically customer nodes 3, 12, 17, 20, 16, 5, 9, and 8; P4 serves six customers, specifically customer nodes 11, 1, 7, 2, 10, and 6; and P5 serves six customers, specifically customer nodes 13, 19, 4, 18, 14, and 15.
 - Fitness function:The fitness value represents the quality of an individual, and through the fitness value, superior individuals can be selected for genetic transfer to the next generation. Therefore, the construction of the fitness function is crucial for the entire algorithm process. This paper calls on Gurobi to solve the cost value of each generation, and since the model’s objective function seeks the minimum non-negative value, the fitness function is used as shown in Equation (41).where is the value of the objective function determined by Gurobi based on the total cost of the respective routes solved for the initially selected distribution centers.
- Selection operator:For selection operations, this paper uses stochastic universal sampling (SUS), which selects individuals based on their fitness values to ensure that individuals with higher fitness have a greater probability of being chosen.
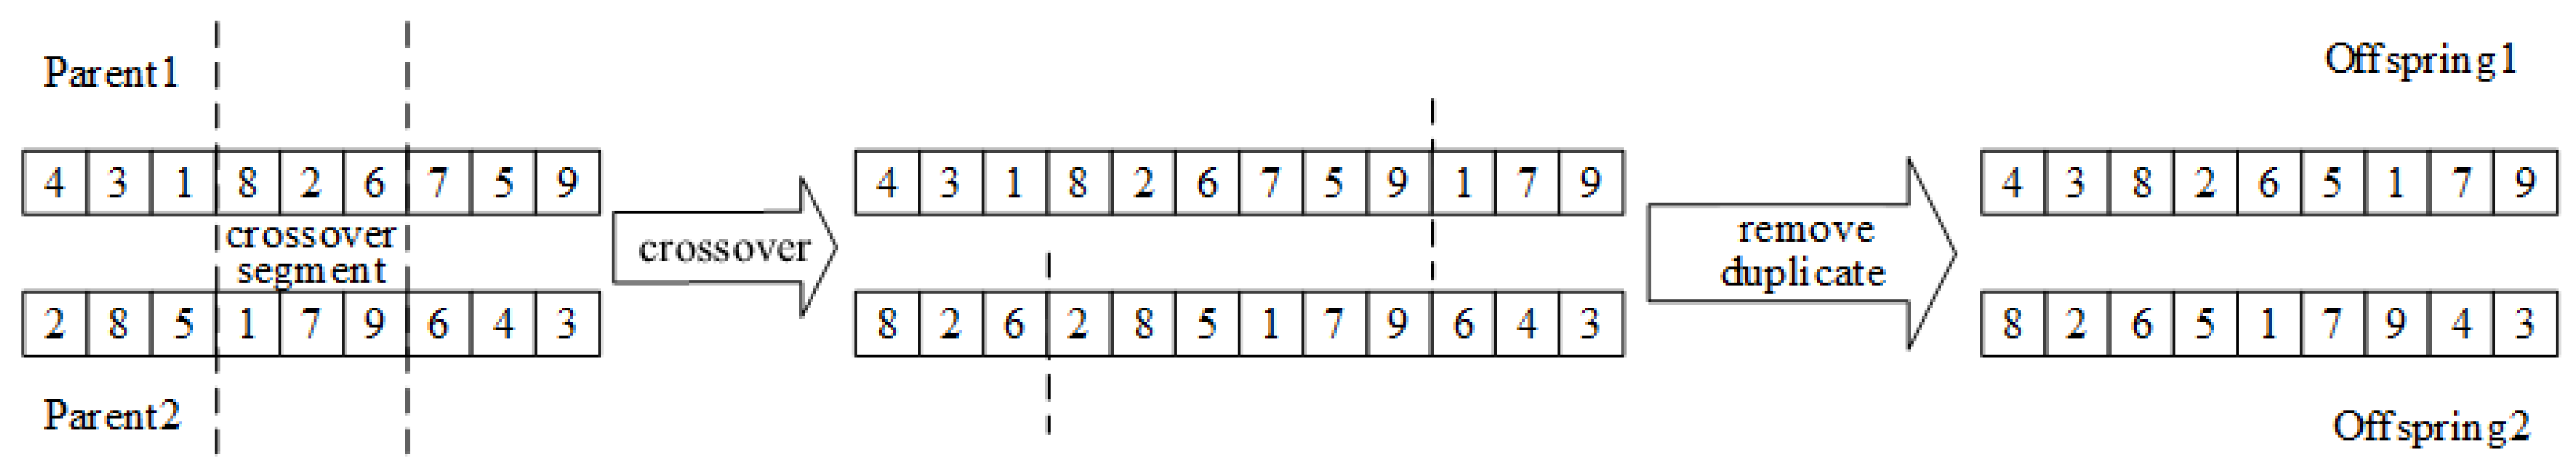
- Crossover operator:The crossover operator used in this study aims to generate superior individuals by merging genetic information from two different individuals. The crossover operation involves the number of distribution centers, the selected centers, and their served customer nodes. It is based on OX crossover and further improved [32], with specific operations, as shown in Figure 3.
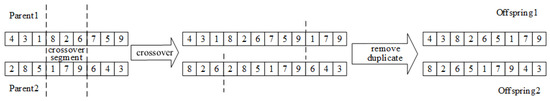 Figure 3. Crossover methods.
- Determine the parents for the crossover operation (Parent 1 and Parent 2), and choose crossover points;
- Copy the crossover segment of Parent 1 and place it at the front of Parent 2; copy the crossover segment of Parent 2 and place it at the end of Parent 1;
- Distributively delete genes in Parent 1 and Parent 2 that duplicate with the inserted crossover departments, resulting in two new offspring.
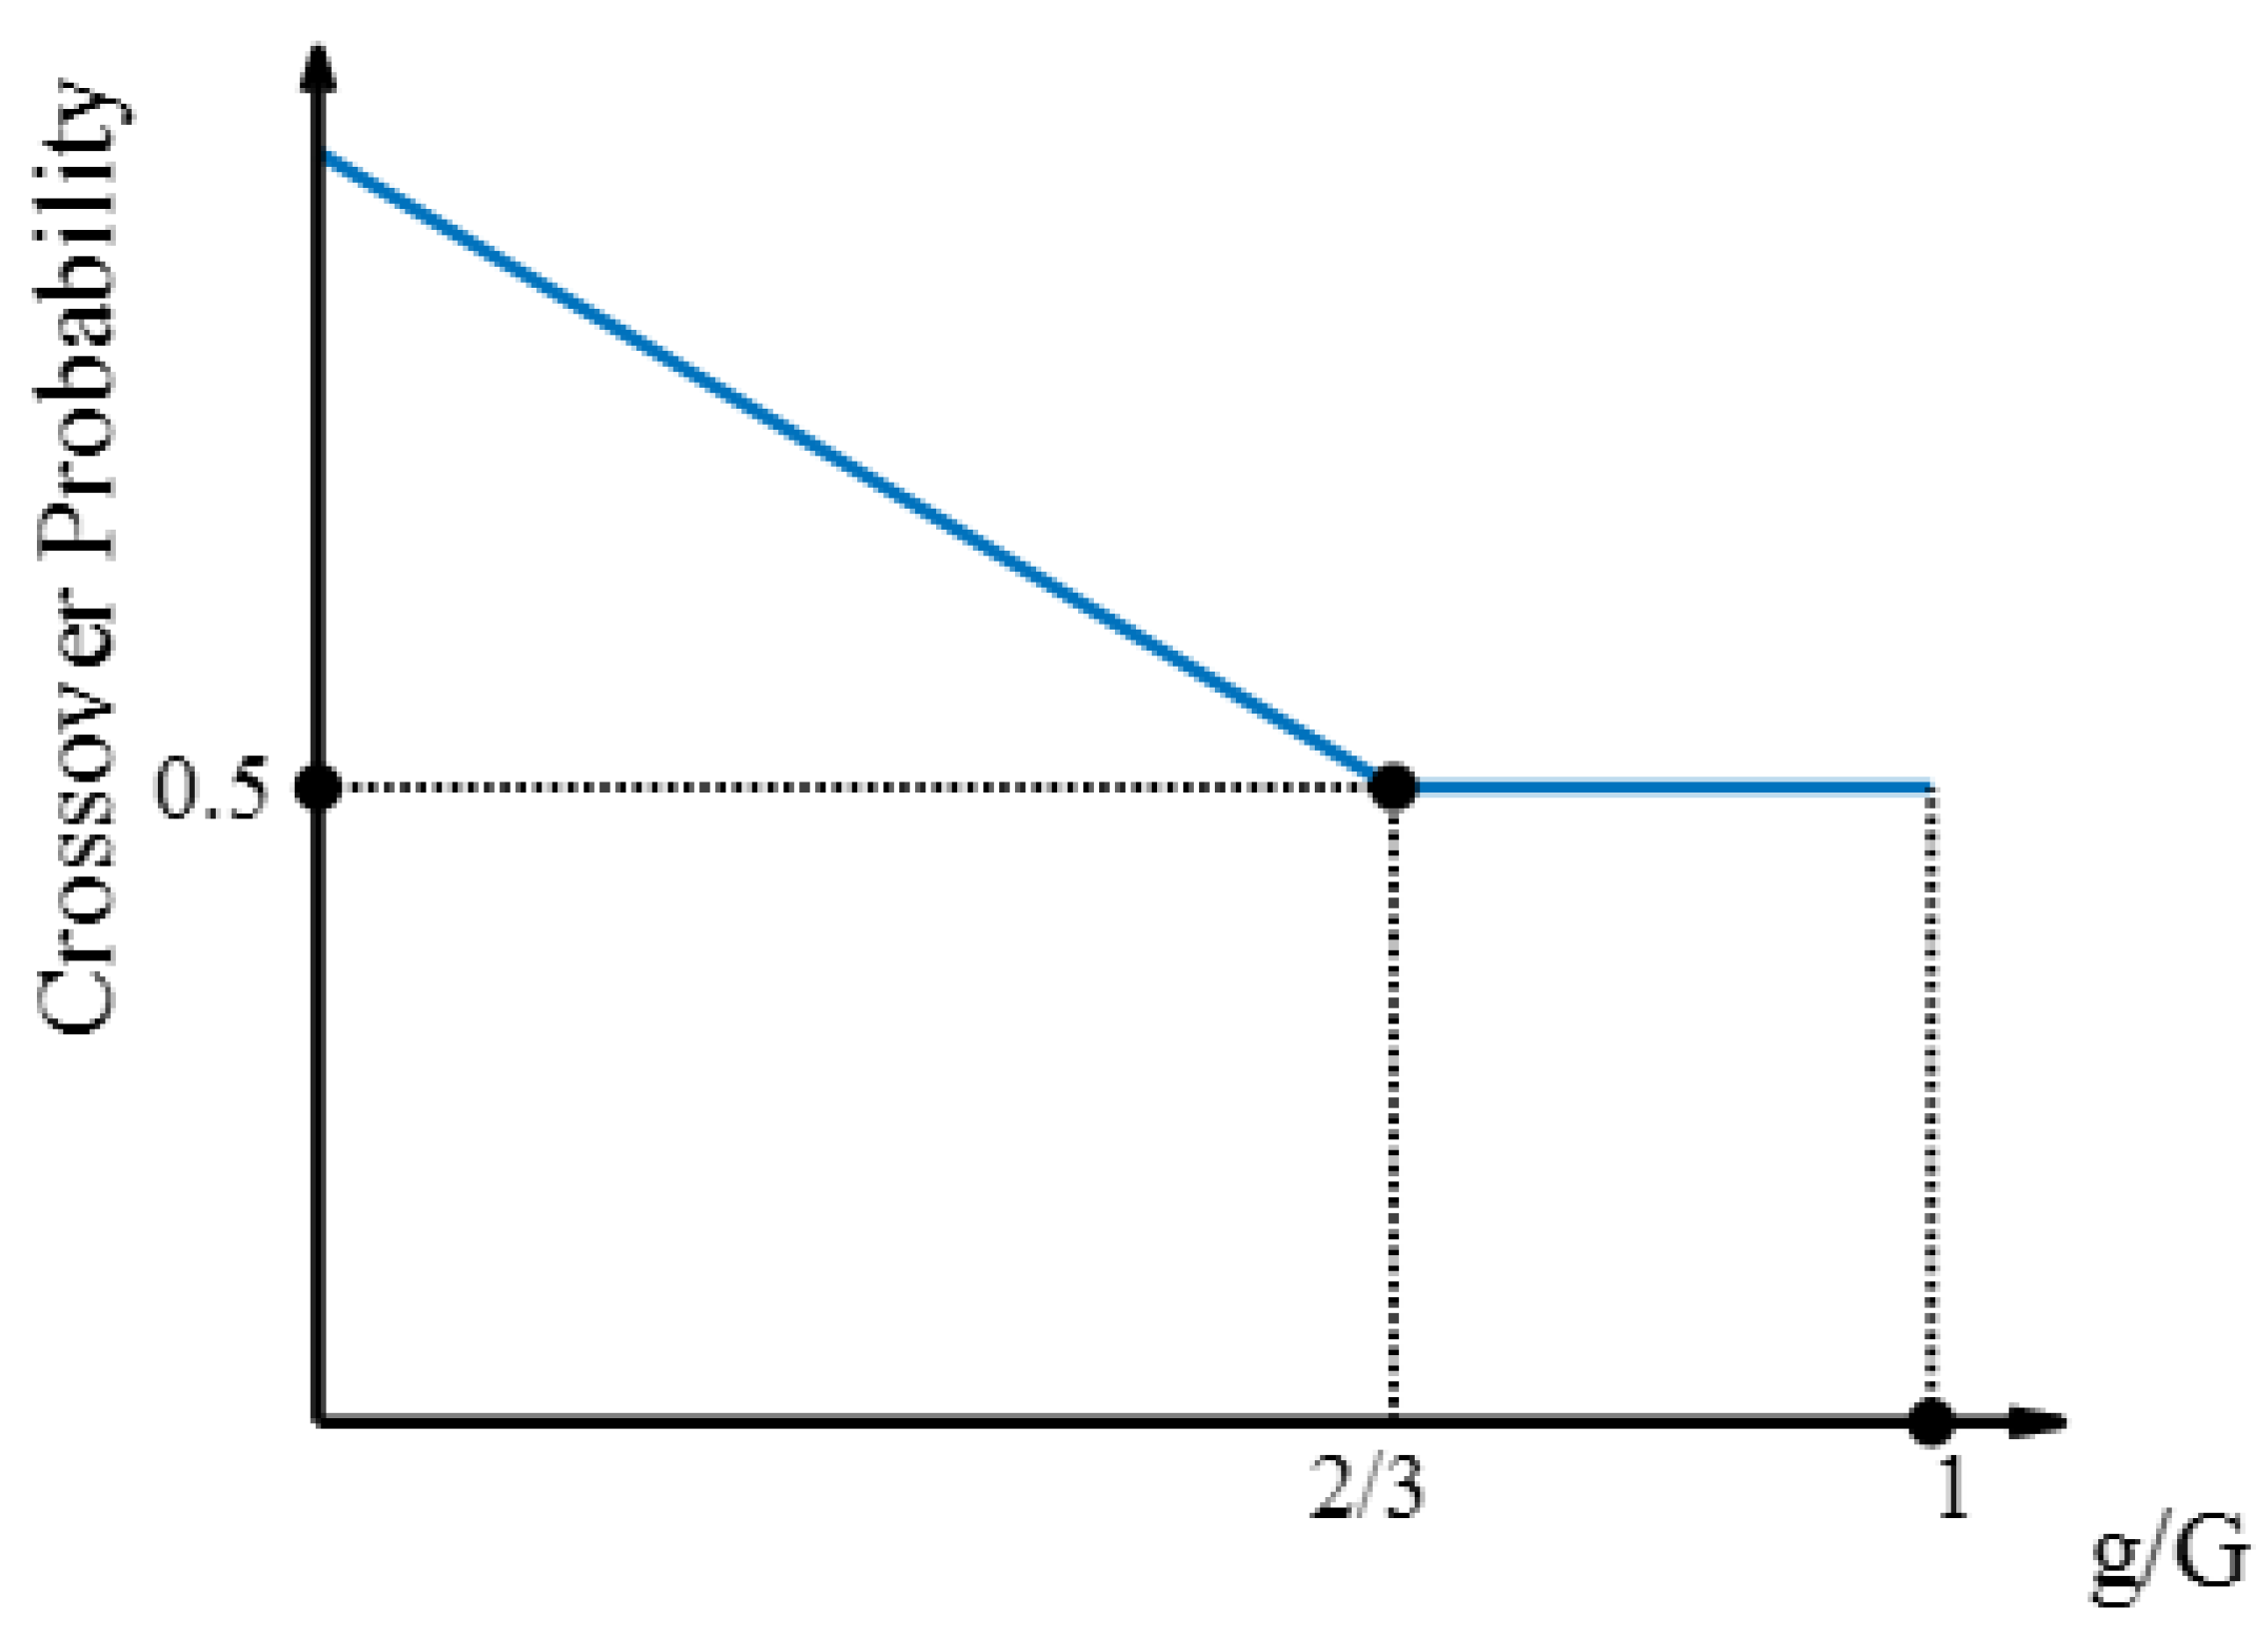
The crossover probability determines the frequency of crossover operations. A high probability may lead to the destruction of good genes, while a low probability may result in local optimization. This paper uses an adaptive crossover probability to balance genetic diversity and preserve good genes, as shown in Equation (42).where represents the crossover probability, is the maximum crossover probability (set to 1), is the minimum crossover probability (set to 0.5), g is the current iteration number, and G is the total number of iterations. The function graph is shown in Figure 4. Figure 4. Crossover probability.From the analysis of Figure 4, it is evident that the crossover probability is high at the beginning of the algorithm to prevent local optimization, and in the later stages of the algorithm, the crossover probability is reduced, decreasing the possibility of gene recombination and maintaining superior individuals.
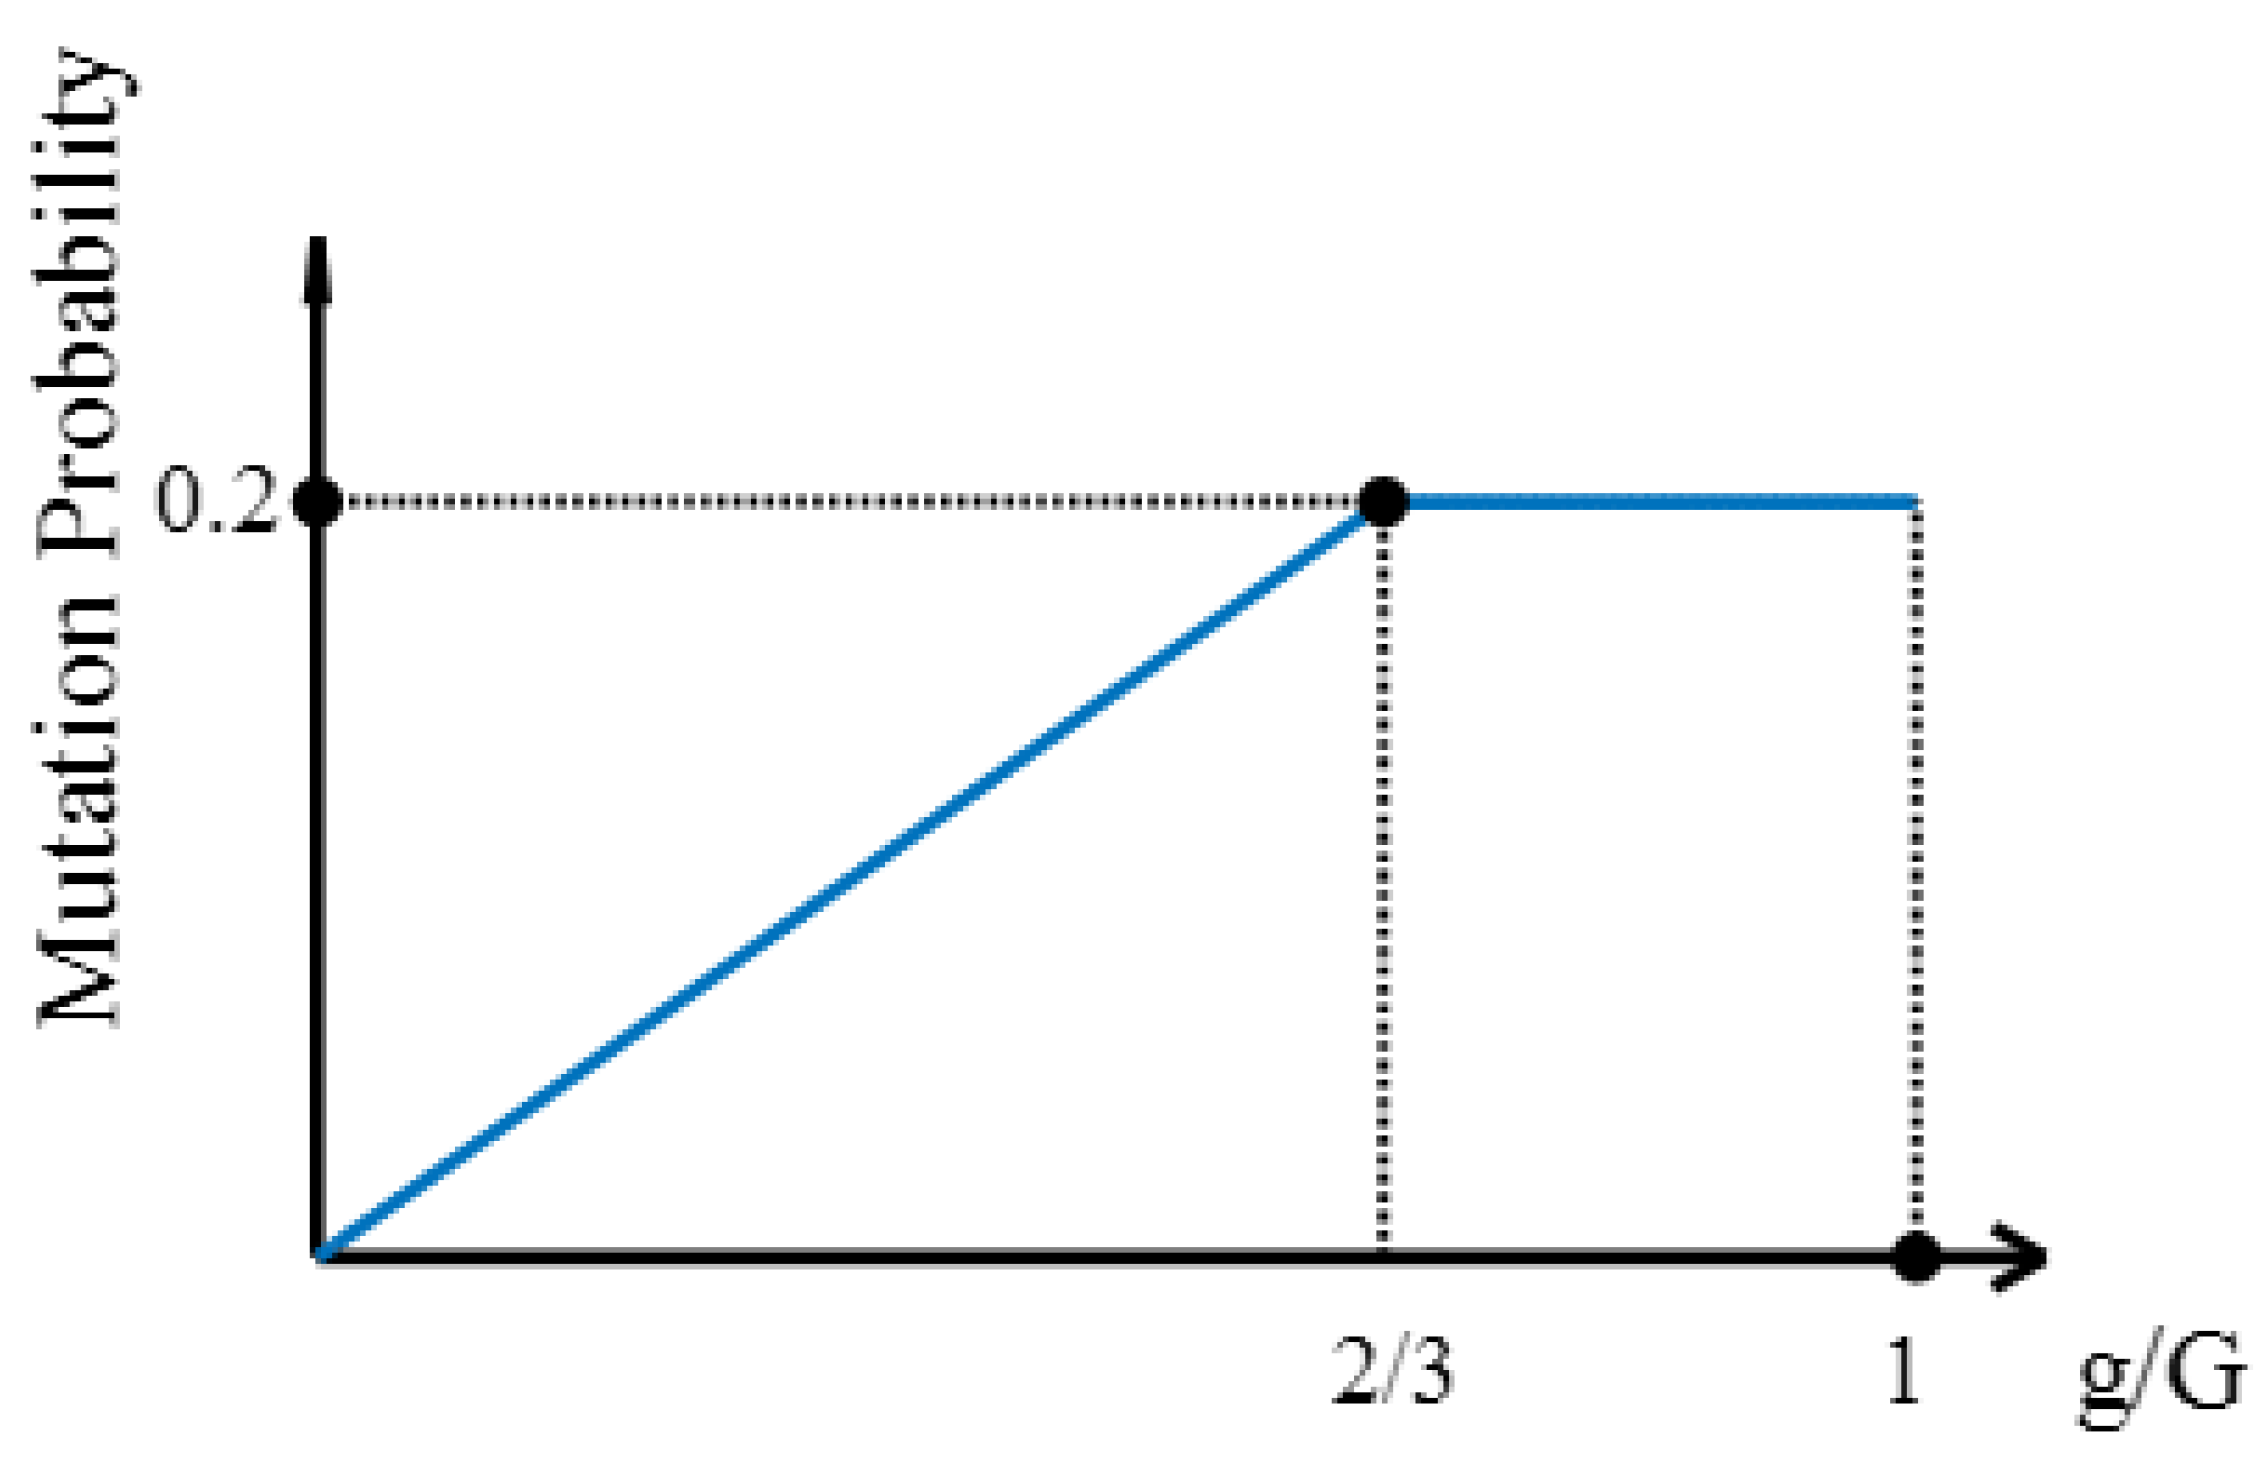
 - Mutation operator:In this study, the mutation operation introduces new genetic information by swapping the gene sequences of individuals, helping to prevent the algorithm from getting stuck in local optima. The mutation probability is adjusted according to an adaptive function, as shown in Equation (43):where represents the mutation probability, is the maximum crossover probability (set to 0.2), g is the current number of iterations, and G is the maximum number of iterations. The function graph is shown in Figure 5.
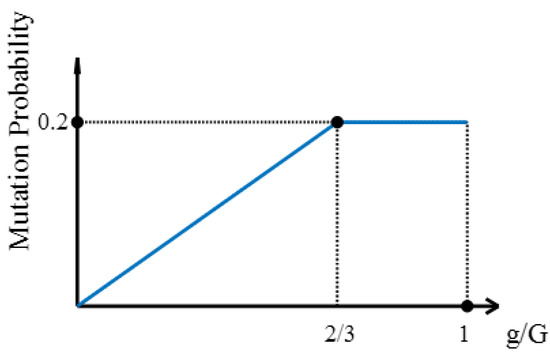 Figure 5. Mutation probability.Analysis of Figure 5 shows that the mutation probability is kept at a lower level initially to avoid excessive randomness and is appropriately increased in the later stages of evolution to explore a broader solution space and prevent premature convergence.
5.3. Gurobi Solver
The Gurobi solver is renowned for its excellent solving speed and efficient algorithms, capable of quickly and accurately handling large, complex optimization problems such as linear programming and integer programming. In this study, the Gurobi solver is used for route optimization, divided into two parts. First, Gurobi calculates the lowest cost of servicing all customers with selected logistics centers of each generation of genetic algorithms, and the reciprocal of this cost is used as the fitness function. Secondly, the solver optimizes the delivery routes for the final determined logistics centers and customer nodes to achieve cost minimization and route optimization for the entire process.
6. Experimental Design and Results Analysis
The experimental design of this study consists of two parts. First, we tested the proposed enhanced genetic algorithm combined with the Gurobi solver on facility location-routing problems using the Solomon dataset. Secondly, we further validated the model’s effectiveness in handling small- to medium-scale problems through the investigation of practical cases in sanatorium areas. The experiments were implemented using Matlab 2017 and Python 3.7, and all evaluations were conducted on a computer with identical performance specifications.
6.1. Algorithm Experiment
For randomly selected small-scale instances from the Solomon dataset, we compared the time and total distance costs required by genetic algorithms, Gurobi’s exact optimization, and ant colony algorithms in solving VRP sub-problems. The specific results are presented in Table 3.
Table 3.
Performance comparison of different algorithms in solving VRP.
Table 3 clearly demonstrates the advantages of the Gurobi solver in terms of solving speed and total distance costs across different scales compared to genetic algorithms and ant colony algorithms. These results notably highlight the efficiency and stability exhibited by Gurobi in handling small- to medium-scale problems.
In addition, this study selected a subset of data from the Solomon dataset and employed traditional genetic algorithms, immune genetic algorithms, and an enhanced genetic algorithm combined with the Gurobi solver to validate and compare the effectiveness of these algorithms in small- to medium-scale instances. Following the algorithm parameter settings in reference [33], the initial population size was set to 50, with 2000 iterations, a crossover probability of 0.8, and a mutation probability of 0.2. To ensure fair comparison of algorithm performance, considering the absence of carbon emission costs in the test dataset, carbon emission costs were uniformly set to 0. Table 4 presents an experimental comparison of the results, where time (T) reflects the computational time required for algorithm completion.
Table 4.
Performance comparison of different algorithms in solving LRP.
The results of small- to medium-scale experiments demonstrate the significant effectiveness of the genetic algorithm combined with the Gurobi solver in solving facility location-routing problems. Across varying numbers of distribution centers and customer configurations, the GA+Gurobi method consistently achieves lower optimal routing costs and faster solution times compared to traditional genetic algorithms (GAs) and hybrid genetic algorithms (HGAs).
6.2. Case Study Analysis
This research focuses on a specific health resort area, aiming to deeply analyze its cold chain logistics needs in terms of pharmaceuticals, medical devices, and fresh products. After detailed investigation, it was found that the area has successfully implemented an integrated service system from supply to logistics and has established a stable customer network. This network covers 7 medical institutions and 23 elderly care areas, demonstrating the breadth of its business scope. To further reduce overall logistics costs and improve operational efficiency, several logistics centers need to be established at key locations. In this study, for simplicity, the types of goods are generalized, and the 30 studied healthcare institutions are numbered for more effective data management and strategy formulation.
6.2.1. Data Information
The area has one main dispatch point, using 5-ton large refrigerated trucks for logistics transportation, with a vehicle power of 120 kilowatts, full-load fuel consumption of 1.3 L/km, and empty-load fuel consumption of 0.9 L/km. The refrigeration cost during transportation is CNY 15 per hour and CNY 34 per hour during loading and unloading. The vehicle departs at five o’clock in the morning, traveling at a speed of 80 km/h to transport goods from the dispatch point (coordinates 58, 57) to various logistics centers.
Vehicles used by the alternative distribution centers travel to customer nodes at eight o’clock in the morning, with an average driving speed of 50 km/h. The refrigeration unit is a freezer unit (h = 1), and the power of the freezer unit (p) is 40 kilowatts. Detailed information is provided in Table 5.
Table 5.
Distribution center information.
The geographical location of the customer nodes and the demand in previous years are shown in Table 6, where the most conservative estimate, the most likely value, and the most optimistic value of the uncertain parameter demand are estimated based on the minimum value, mode, and maximum value in historical data, respectively. is set to 0.5 to calculate the size of the demand, with specific information listed in Table 6.
Table 6.
Customer information.
6.2.2. Model Parameter Settings
The parameter settings based on the model obtained through online survey are listed in Table 7.
Table 7.
Model parameter values.
6.2.3. Algorithm Parameter Settings
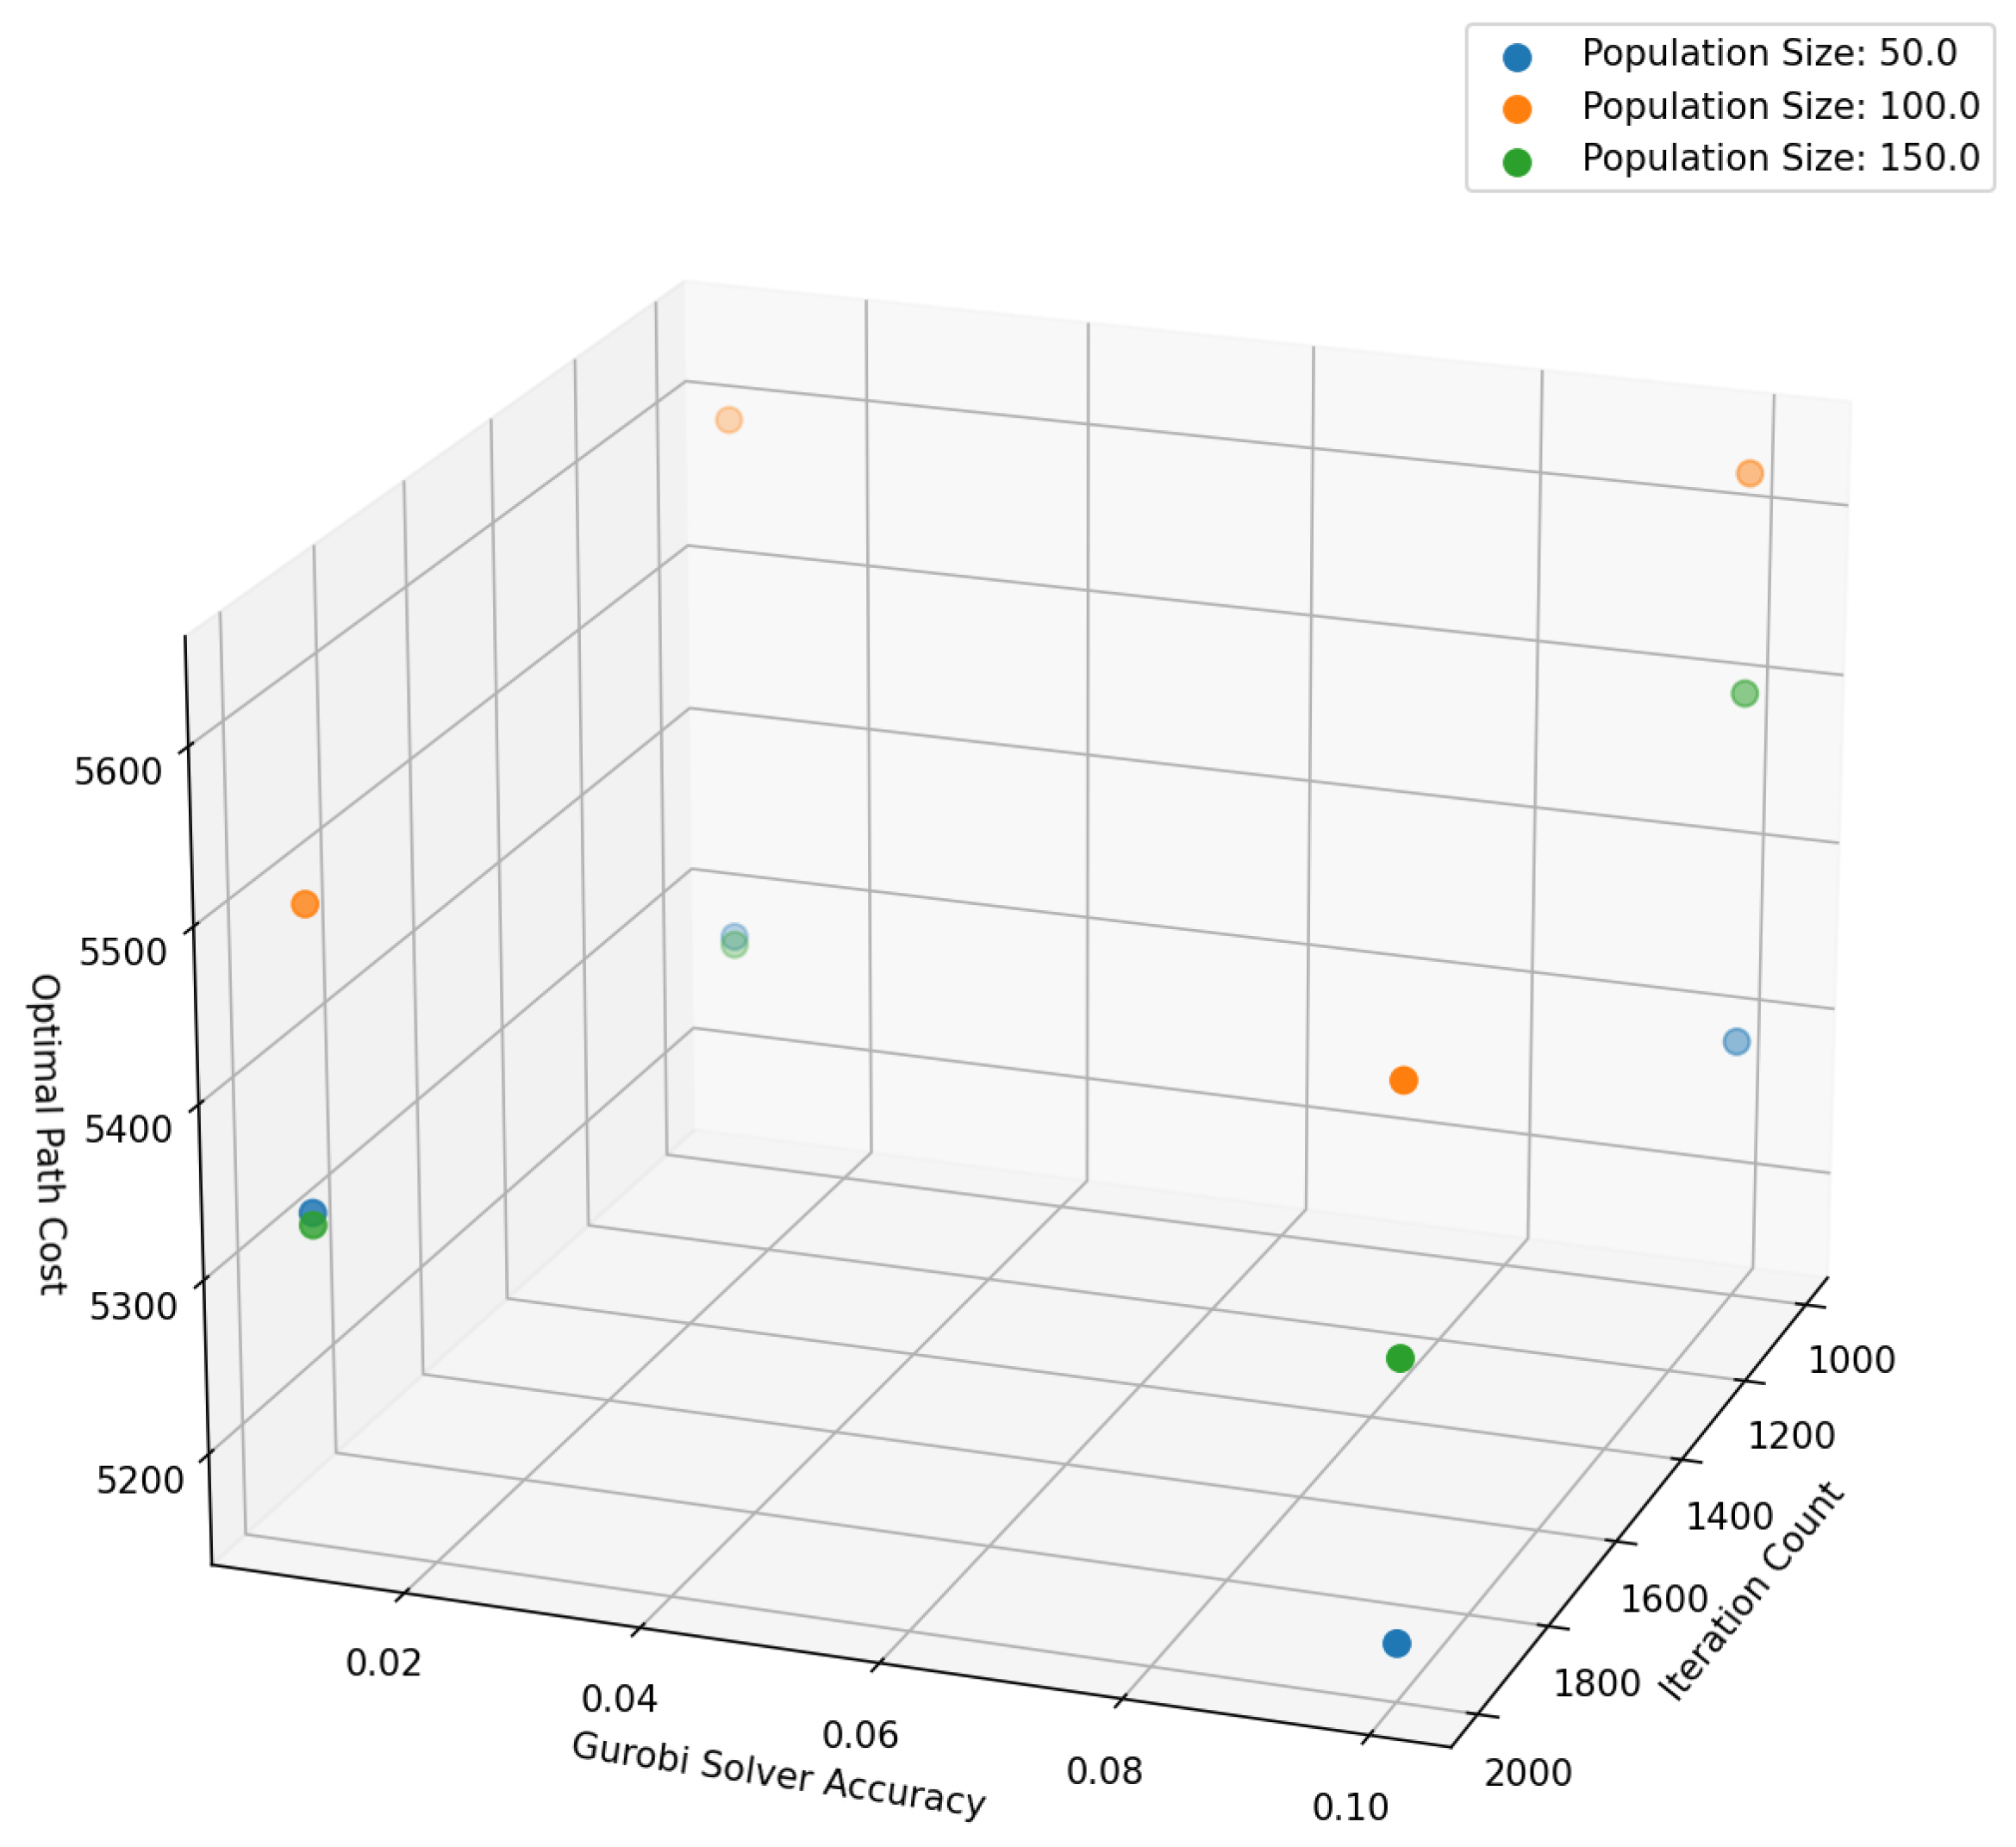
To comprehensively compare the effects of different genetic algorithm parameter settings and Gurobi solver accuracies on optimal routing costs, we varied the population size (50, 100, and 150) and iteration counts (1000 and 2000) and considered Gurobi solver accuracies of 0.01 and 0.1. To effectively avoid algorithm convergence to local optima, dynamic crossover and mutation probabilities were uniformly applied in parameter adjustments. Figure 6 clearly illustrates the significant impact of these parameter settings on total costs. In the figure, to emphasize hierarchy, circles were intentionally designed with lighter colors toward the inner edge and darker colors toward the outer edge.

Figure 6.
Comparison of the impact of parameter settings on total cost.
According to the results shown in Figure 6, in the small- to medium-scale case studies investigated in this paper, the lowest costs were achieved when the population size was 50, the iteration count was 2000, and Gurobi solver accuracy was 0.1. Therefore, these parameter settings were chosen as the optimal solution for the study.
6.3. Results Analysis
In this study, several of the seven alternative distribution centers were selected, and transportation and distribution routes were planned for them to minimize overall distribution costs. The model was solved using Matlab2017a and Python3.7 software, applying both the standard genetic algorithm and the improved genetic algorithm combined with Gurobi.
6.3.1. Comparison of Standard Genetic Algorithm and Hybrid Genetic Algorithm
Based on the analysis of algorithm parameter settings, the parameters for traditional genetic algorithms and enhanced genetic algorithms combined with Gurobi are summarized in Table 8.
Table 8.
Algorithm parameter values.
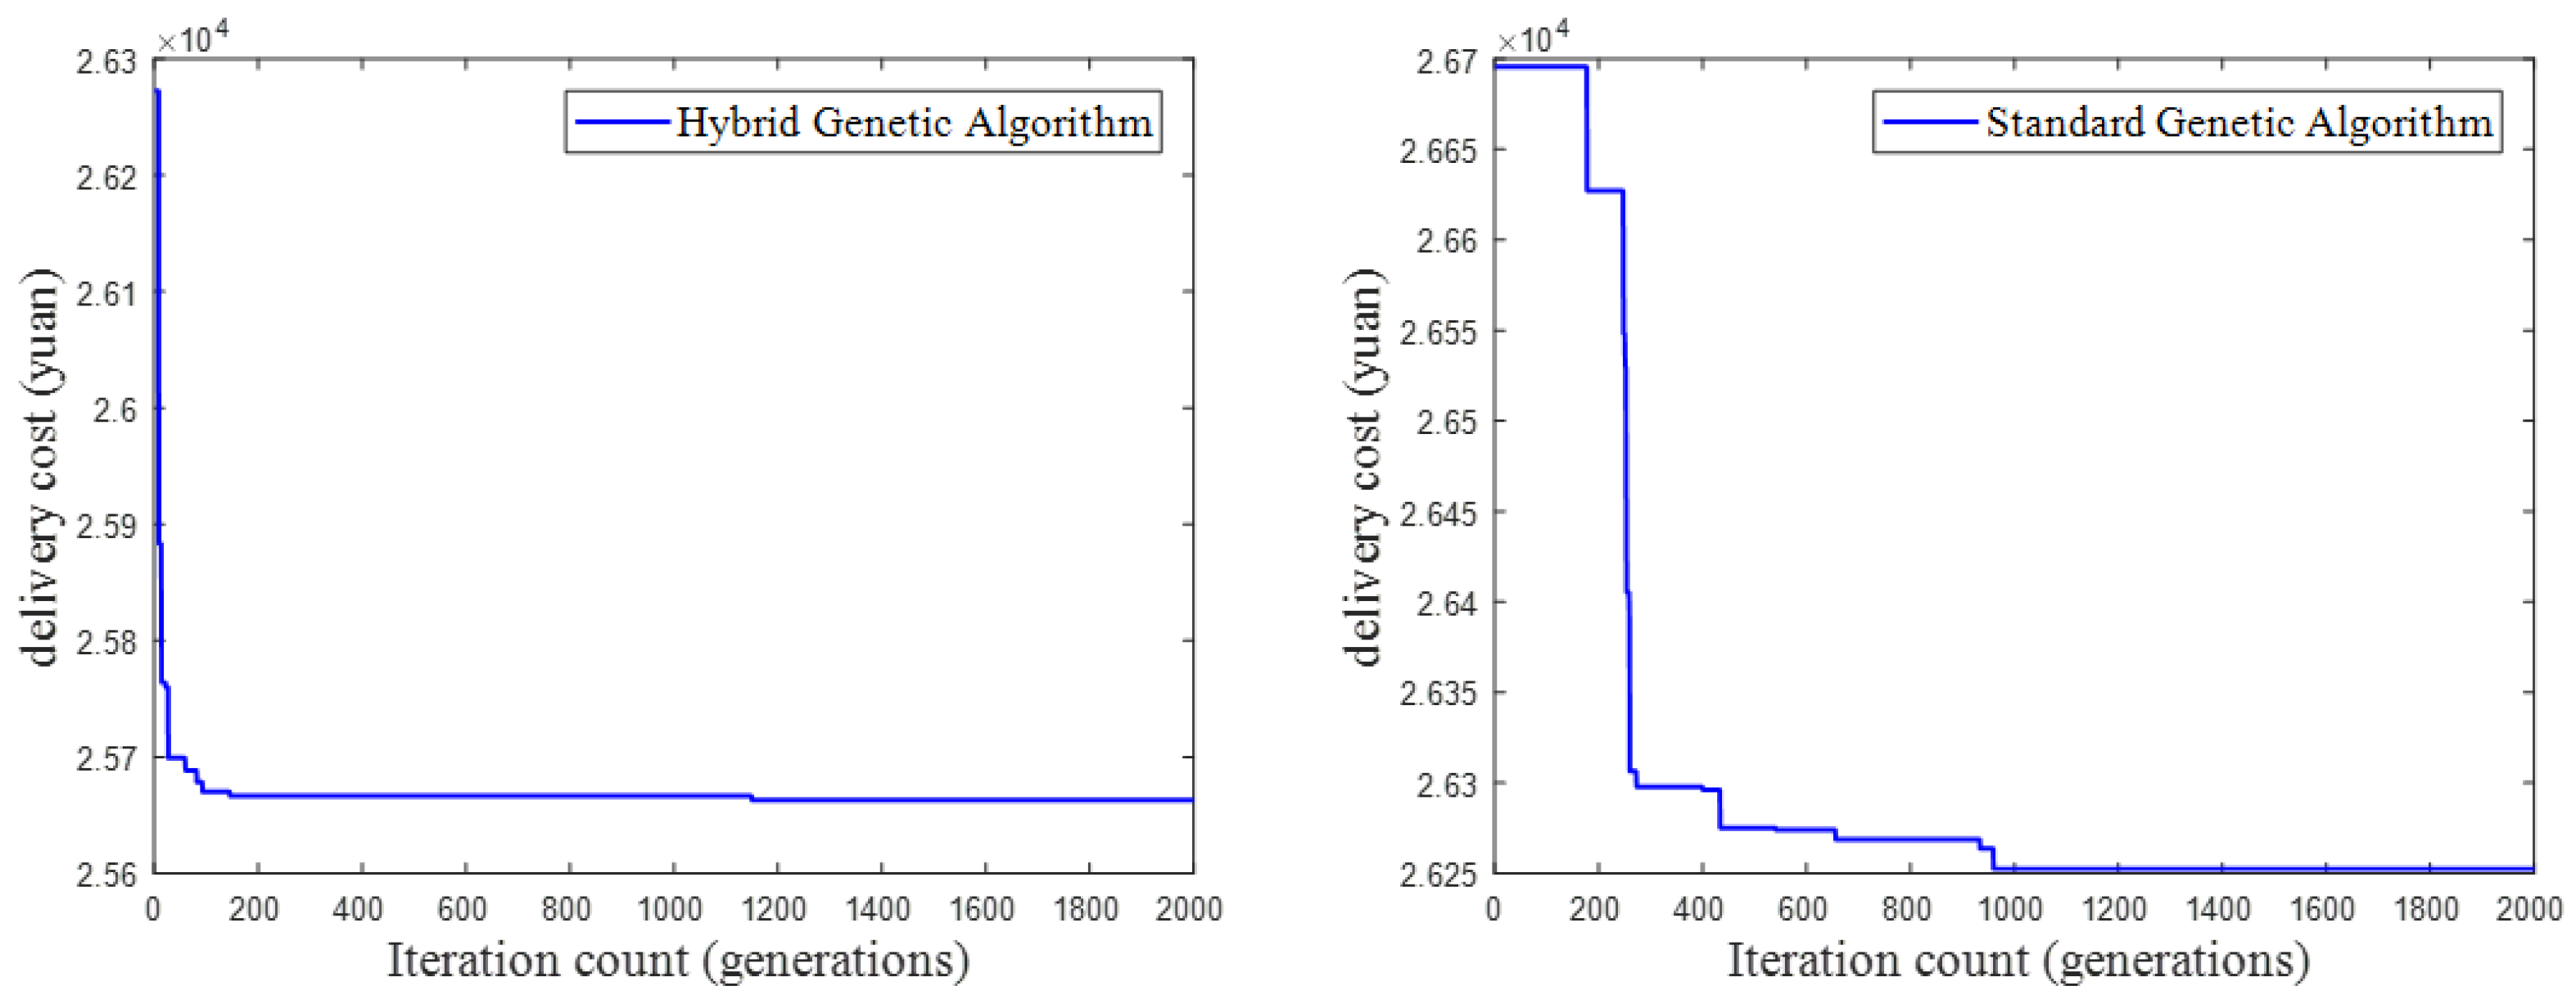
Comparisons of the optimal values of the objective function and the convergence curves for the standard genetic algorithm and the improved genetic algorithm are shown in Figure 7.
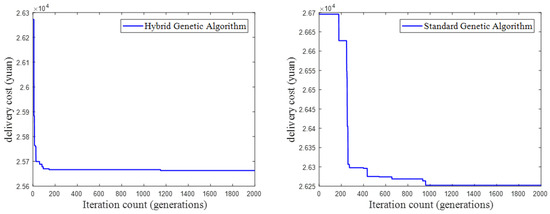
Figure 7.
Algorithm comparison.
From Figure 7, it is apparent that the improved genetic algorithm converges around generation 200, with the objective function value near 25,600, while the standard genetic algorithm converges around generation 1000, and its objective function value is greater than 25,600. Therefore, the improved genetic algorithm performs better.
6.3.2. Site Selection and Route Analysis
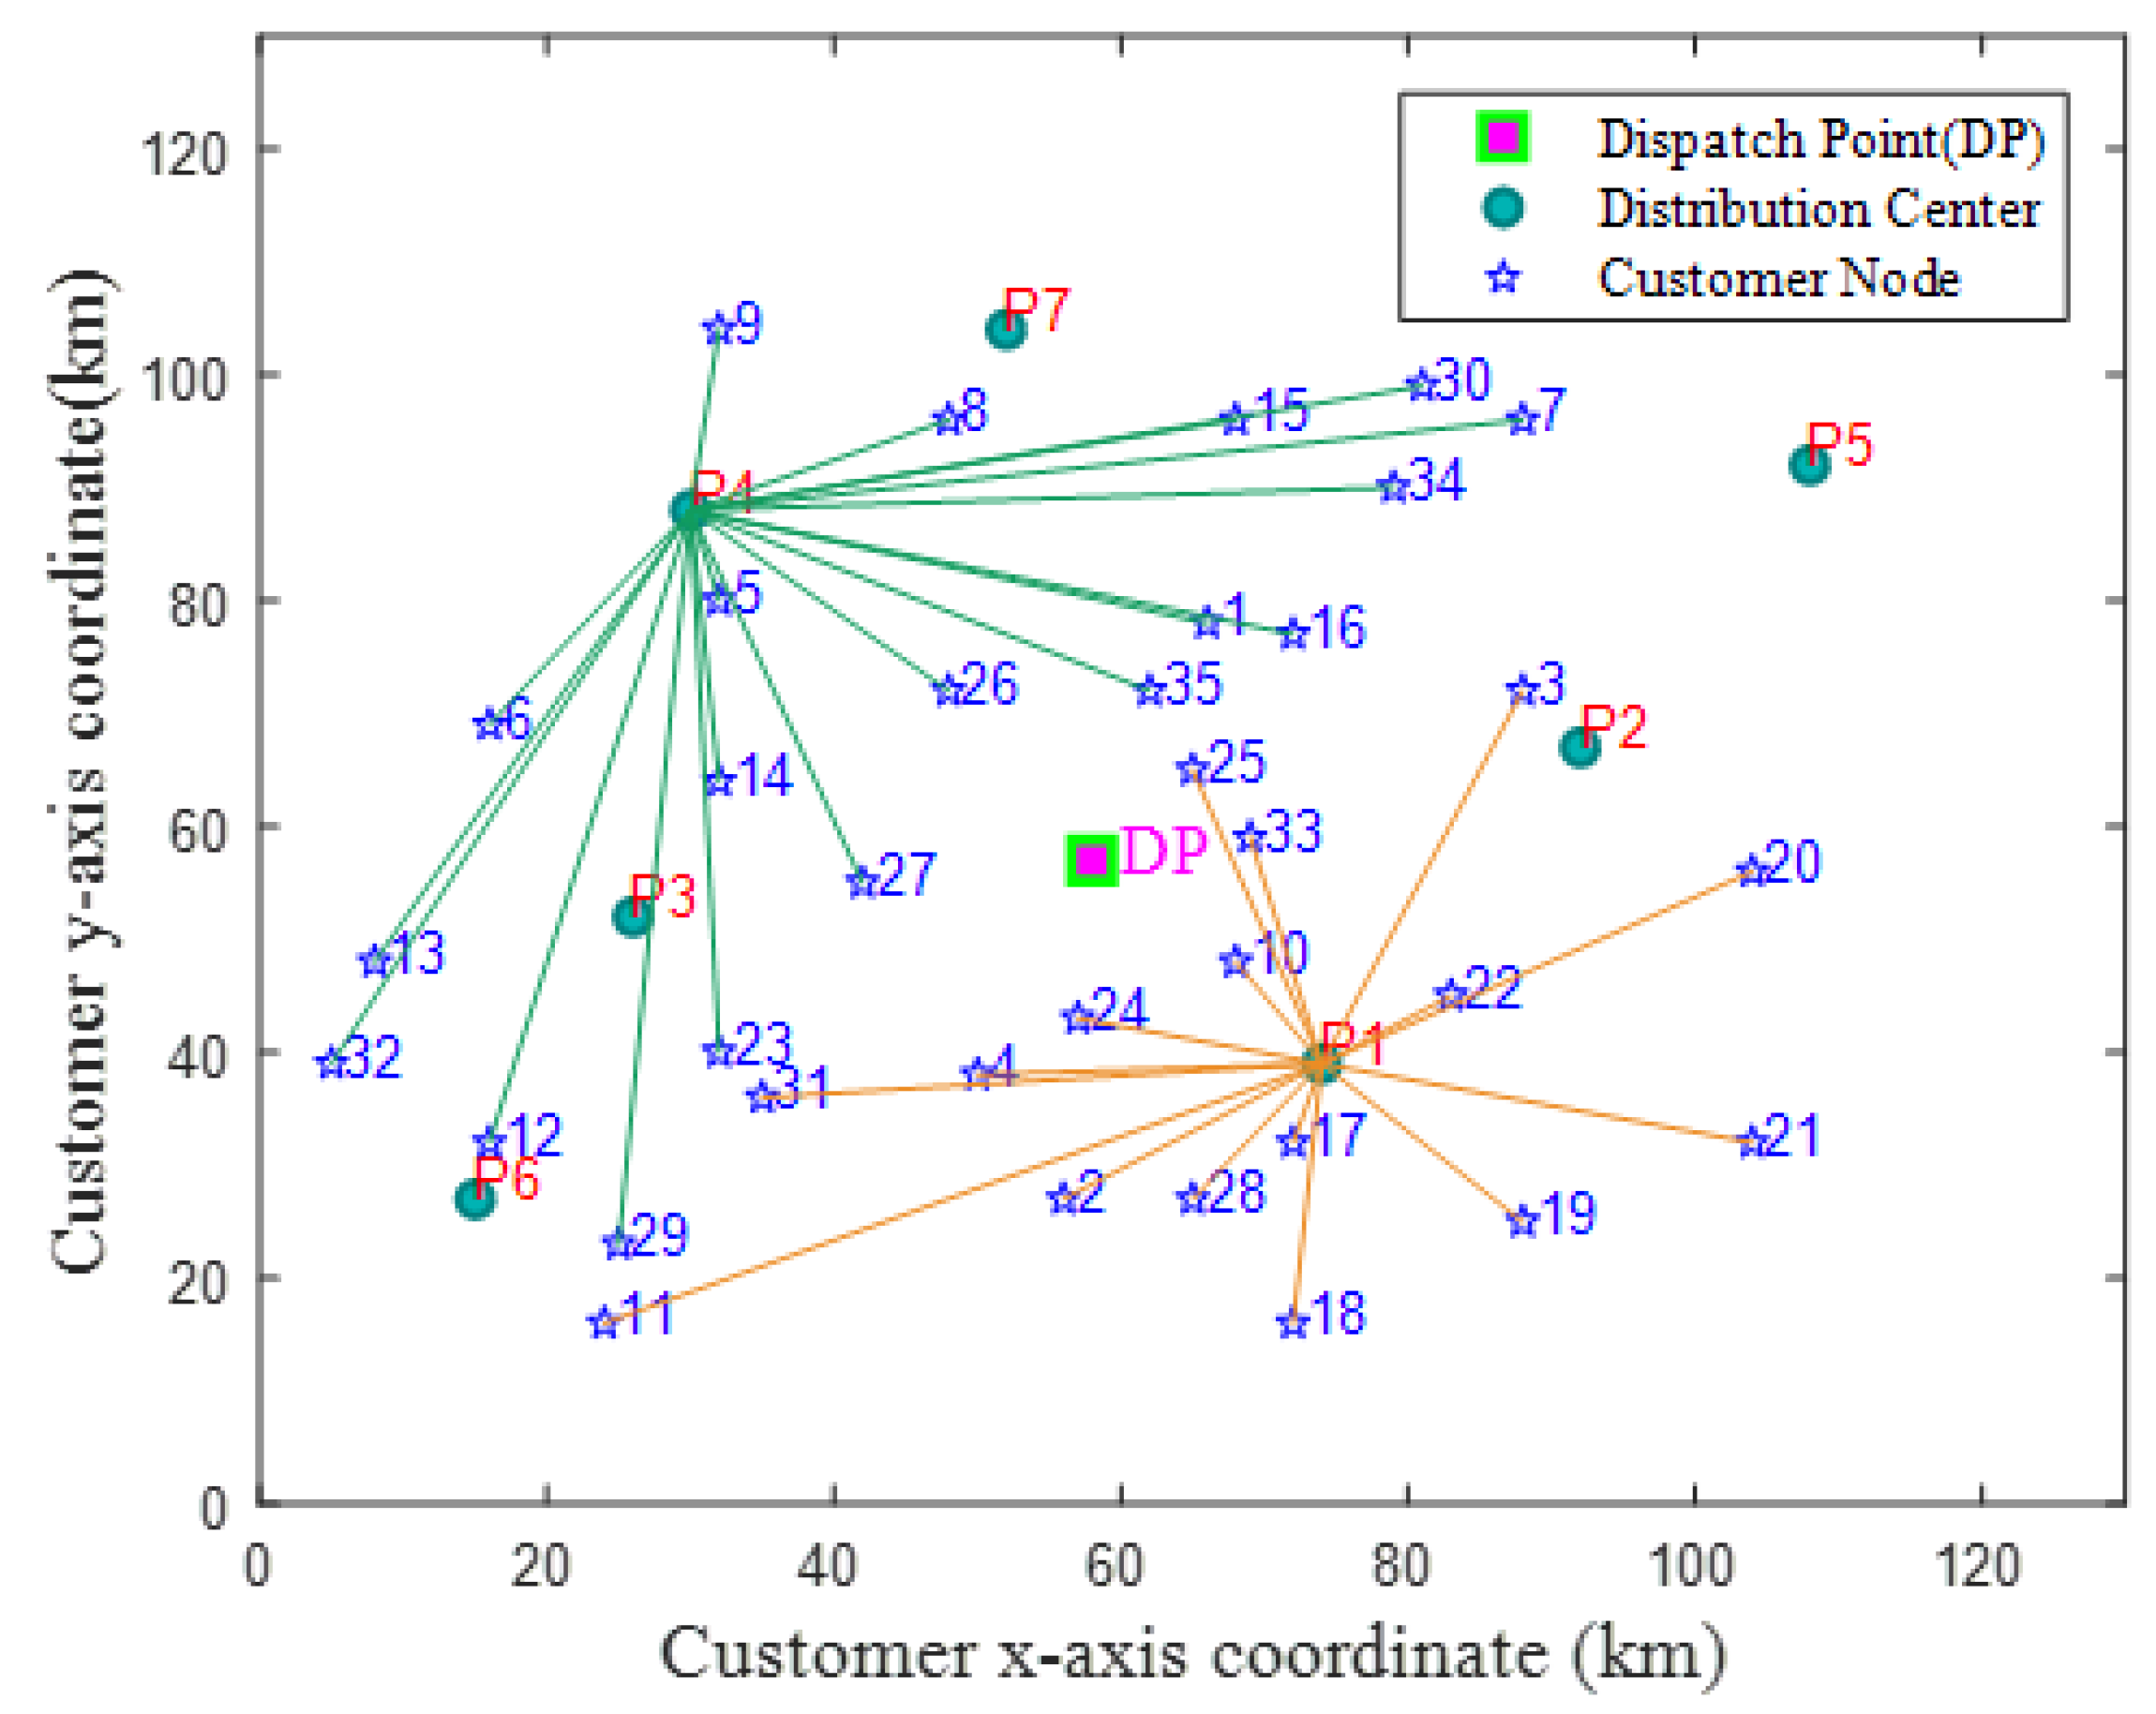
In this section, we use Matlab and Gurobi to allocate and plan routes for the optimal distribution centers in the health resort area, resulting in Figure 8. The final location result is the dispatch point serving 35 terminal customers in the area through distribution centers 1 and 4.
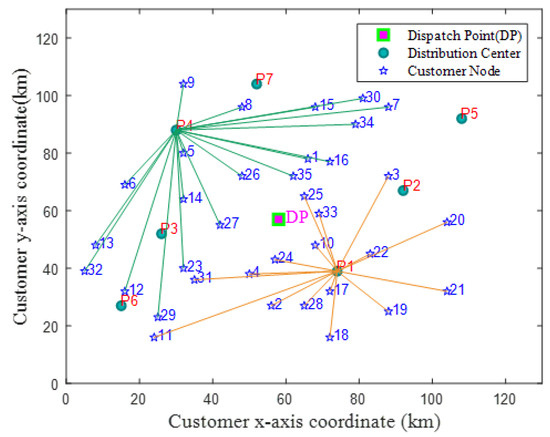
Figure 8.
Optimal site allocation map.
Further optimizing the routes with Gurobi, the optimal routes for distribution center 1 and distribution center 4 are obtained as shown in Figure 9.
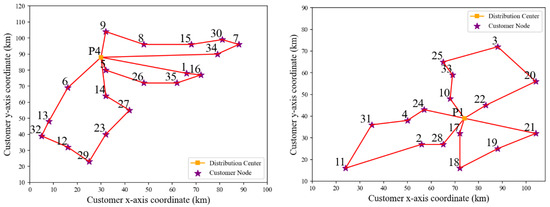
Figure 9.
Optimal route map.
According to the route result diagram, the final transportation routes are as shown in Table 9.
Table 9.
Distribution routes.
Under the above location decisions and delivery routes, the total daily cost is calculated to be 5169. Since the fixed investment cost of the distribution center is calculated annually, when apportioned to 300 working days, the combined daily fixed investment cost and storage cost for P1 is 168, and that for P4 is 169. The overall cost distribution is shown in Table 10.
Table 10.
Cost distribution.
Analysis of the above table shows that the cost of damaged goods is relatively small, indicating that the model effectively reduces damaged goods, proving the rationality of the selected delivery routes. This finding is extremely valuable for improving logistics efficiency and reducing operational costs. Additionally, carbon trading costs and refrigeration costs account for 49.52% of the total, indicating that in decision making, besides considering economic benefits, the environmental cost of carbon emissions and sustainable use of energy should also be comprehensively considered.
6.4. Sensitivity Analysis
Under the analysis conditions set as a maximum of two locations and a maximum driving time of 8 h for vehicles, this paper explores the impact of different cutting levels () on storage costs and total costs, as well as the impact of different carbon dioxide conversion coefficients () on carbon emissions and total costs.
With other parameters unchanged, the impact of different demand-cutting levels () on storage costs is shown in Figure 10. The results show that with the increase in , storage costs and total costs show a linear upward trend, reflecting a proportional relationship between costs and demand under fixed location selection.
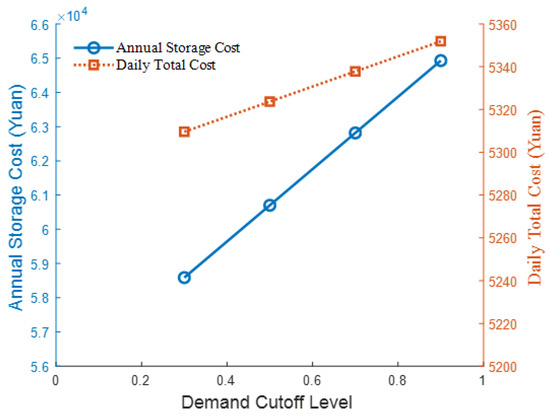
Figure 10.
Demand segmentation sensitivity analysis.
With other parameters unchanged, further analysis under different carbon emission coefficients is shown in Figure 11. It is found that carbon emissions and total costs increase with the increase in the carbon emission coefficient. Therefore, the use of energy-saving vehicles can effectively reduce carbon emissions and total costs.
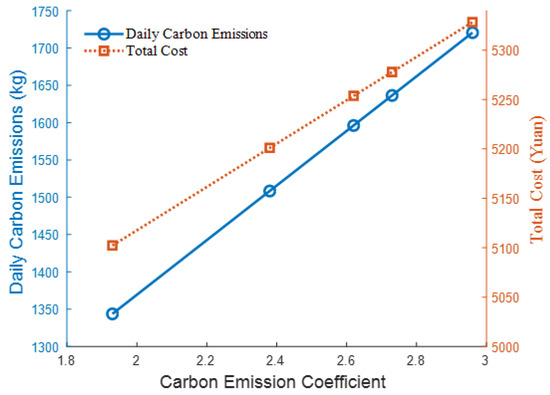
Figure 11.
Carbon emission coefficient sensitivity analysis.
7. Conclusions
This research delved deeply into the location-routing problem of cold chain logistics centers under carbon emission considerations, aiming to achieve the following two core objectives: significant reduction in total costs and effective control of carbon emissions. The primary step of the study was to construct an innovative nonlinear programming model that encompasses multiple factors including logistics costs and environmental impacts. Furthermore, by introducing a carbon trading strategy, we cleverly transformed the complex issue of carbon emissions into a more manageable model, aiming to minimize total costs. Additionally, to more accurately predict demand, this research utilized the triangular fuzzy number method, enhancing the model’s robustness in the face of market fluctuations.
In terms of solving strategy, this research employed an improved genetic algorithm combined with the Gurobi solver to conduct a comprehensive case study on the cold chain logistics issue in a health resort area. The results show that this innovative approach not only ensures the accuracy of the solution but also significantly improves the convergence speed of the algorithm, effectively reducing overall logistics costs. Moreover, through detailed sensitivity analysis, this research not only revealed the direct linear relationship between storage costs and demand levels but also delved into the impact of the carbon emission coefficient on total costs, providing targeted decision-making guidance for logistics managers to optimize logistics operations and cost efficiency.
These findings not only provide a new perspective for the cold chain logistics industry but also offer practical suggestions for environmentally friendly logistics management, making a significant contribution to the sustainable development of the field.
However, this article has certain limitations. The case-study phase of the article primarily focuses on addressing small- to medium-scale problems. There was no in-depth research conducted on large-scale instances. In our future work, we will present additional large-scale computational experiments and conduct detailed comparisons with other candidate metaheuristic methods from the literature. We will strive to develop more diversified and precise demand forecasting methods to enhance the model’s adaptability and accuracy in various economic and environmental contexts.
Author Contributions
Y.Z. initiated the study and drafted the original manuscript. Y.Z. and D.L. provided technical support. D.L. contributed optimization ideas and refined the article. All authors have read and agreed to the published version of the manuscript.
Funding
This work was supported by the Major Project of Philosophy and Social Science Research in Higher Education Institutions of Hubei Province, ‘Research on Promoting High-Quality Development of Hubei’s Manufacturing Industry Based on Industry Integration and Innovation’ (20ZD021).
Institutional Review Board Statement
Not applicable.
Informed Consent Statement
Not applicable.
Data Availability Statement
The data presented in this study are available from the corresponding author upon request.
Conflicts of Interest
The authors declare no conflicts of interest. The funders had no role in the design of the study; in the collection, analyses, or interpretation of data; in the writing of the manuscript; or in the decision to publish the results.
References
- Beard, J.R.; Officer, A.; Araujo, I. The World report on ageing and health: A policy framework for healthy ageing. Lancet 2016, 387, 2145–2154. [Google Scholar] [CrossRef] [PubMed]
- Li, X.; Zhou, K. Multi-objective cold chain logistic distribution center location based on carbon emission. Environ. Sci. Pollut. Res. 2021, 28, 32396–32404. [Google Scholar] [CrossRef] [PubMed]
- Yildiz, E.A.; KaraoĞLAN, İ.; Altparmak, F. An exact algorithm for Two-Echelon Location-Routing problem with simultaneous pickup and delivery. Expert Syst. Appl. 2023, 231, 120598. [Google Scholar] [CrossRef]
- Wu, S.; Yang, Q.; Yang, Z. Integrating express package delivery service with offline mobile sales: A new potential solution to sustainable last-mile logistics in rural China. Int. J. Logist. Res. Appl. 2022, 1–29. [Google Scholar] [CrossRef]
- Dharmika, N.A.; Maruti, S.C.; Sakti, S.; Sri Asih, A.M. Multi-Objective Location Routing Problem with Time Windows for Cost Minimization and Customer Service Level Maximization. In Proceedings of the 2020 6th International Conference on Science and Technology (ICST), Yogyakarta, Indonesia, September 2020; Volume 1, pp. 1–6. [Google Scholar]
- Hu, D.; Liu, C.; Hu, H.; Gao, Y.; Cai, R. The two-echelon open location routing problem based on low carbon perspective—Fuel vehicles vs. electric vehicles. Syst. Eng.-Theory Pract. 2020, 40, 3230–3242. [Google Scholar]
- Song, L.; Zhao, S.; Bian, Q.; Du, P.; Shen, P. Fresh Food Distribution Route Optimization of Mixed Fleets in Urban and Rural Areas Under Low Carbon Perspective. J. Transp. Syst. Eng. Inf. Technol. 2023, 23, 250–261. [Google Scholar]
- Li, K.; Li, D.; Wu, D. Carbon Transaction-Based Location-Routing-Inventory Optimization for Cold Chain Logistics. Alex. Eng. J. 2022, 61, 7979–7986. [Google Scholar] [CrossRef]
- Rodriguez, D.A.; Oteiza, P.P.; Brignole, N.B. An urban transportation problem solved by parallel programming with hyper-heuristics. Eng. Optim. 2019, 51, 1965–1979. [Google Scholar] [CrossRef]
- Domínguez-Martín, B.; Hernández-Pérez, H.; Riera-Ledesma, J.; Rodríguez-Martín, I. A branch-and-cut algorithm for the one-commodity pickup and delivery location routing problem. Comput. Oper. Res. 2024, 161, 106426. [Google Scholar] [CrossRef]
- Liu, Y. Routing battery-constrained delivery drones in a depot network: A business model and its optimization-simulation assessment. Transp. Res. Part C Emerg. Technol. 2023, 152, 104147. [Google Scholar] [CrossRef]
- Jiang, H.; Zhao, Y.; Zhang, J.; Leng, L. Minimizing the carbon emission for the open location-routing problem and algorithm. Xitong Gongcheng Lilun Yu Shijian/System Eng. Theory Pract. 2020, 40, 182–194. [Google Scholar]
- Colleter, T.L.; Dumez, D.; Lehuédé, F.; Péton, O. Small and large neighborhood search for the park-and-loop routing problem with parking selection. Eur. J. Oper. Res. 2023, 308, 1233–1248. [Google Scholar] [CrossRef]
- Kabadurmus, O.; Erdoğan, M.S. Karbon salınımını azaltan ve hizmet kalitesini arttıran iki amaçlı yeşil araç rotalama problemi. Gazi Üniv. Mühendis. Mimar. Fak. Derg. 2023, 38, 103–112. [Google Scholar] [CrossRef]
- Yang, L.; Hao, C.; Tang, R. Location models of charging and battery swapping facilities based on electric vehicles. Syst. Eng.-Theory Pract. 2019, 39, 1781–1795. [Google Scholar]
- Erdoğdu, K.; Karabulut, K. Bi-objective green vehicle routing problem. Int. Trans. Oper. Res. 2022, 29, 1602–1626. [Google Scholar] [CrossRef]
- Yang, J.; Feng, P.-X.; Sun, H.; Yang, C. Carbon Emission Reduction Cost-Sharing Model in Supply Chain Based on Improving the Demand for Low-Carbon Products. Chin. J. Manag. Sci. 2015, 23, 87–96. [Google Scholar]
- Esmaeilnejad, S.; Kattan, L.; Wirasinghe, S.C. Optimal charging station locations and durations for a transit route with battery-electric buses: A two-stage stochastic programming approach with consideration of weather conditions. Transp. Res. Part C Emerg. Technol. 2023, 156, 104327. [Google Scholar] [CrossRef]
- Dai, Z.; Zhang, Z.; Chen, M. The home health care location-routing problem with a mixed fleet and battery swapping stations using a competitive simulated annealing algorithm. Expert Syst. Appl. 2023, 228, 120374. [Google Scholar] [CrossRef]
- Zhou, Y.; Liu, C.; Xu, Q. Time-Dependent Green Location-Routing Problem under Carbon Cap-and-Trade Policy. Transp. Res. Rec. 2023, 2677, 1135–1150. [Google Scholar] [CrossRef]
- Dönmez, S.; Koç, Ç.; Altıparmak, F. The mixed fleet vehicle routing problem with partial recharging by multiple chargers: Mathematical model and adaptive large neighborhood search. Transp. Res. Part E Logist. Transp. Rev. 2022, 167, 102917. [Google Scholar] [CrossRef]
- Nguyen, Q.-T.; Patrix, J.; Oulmakki, O.; Ramirez-Rios, D.G.; Verny, J. Estimating costs and CO2 emissions for last mile delivery of groceries in Paris using alternative modes and routing strategies. Int. J. Logist. Res. Appl. 2023, 1–26. [Google Scholar] [CrossRef]
- Rossi, T.; Pozzi, R.; Pirovano, G.; Cigolini, R.; Pero, M. A new logistics model for increasing economic sustainability of perishable food supply chains through intermodal transportation. Int. J. Logist. Res. Appl. 2021, 24, 346–363. [Google Scholar] [CrossRef]
- Pu, X.; Lu, X.; Han, G. An improved optimization algorithm for a multi-depot vehicle routing problem considering carbon emissions. Environ. Sci. Pollut. Res. 2022, 29, 54940–54955. [Google Scholar] [CrossRef] [PubMed]
- He, X.; Wang, Q. A location-routing model for free-floating shared bike collection considering manual gathering and truck transportation. Socio-Econ. Plan. Sci. 2023, 88, 101667. [Google Scholar] [CrossRef]
- Li, Y.; Wang, X.; Lin, N.; Feng, X.; Ruan, J.; Hu, X. The location-routing optimization model and algorithm of multi-type precooling facilities for agricultural products. Syst. Eng.-Theory Pract. 2022, 42, 3016–3029. [Google Scholar]
- Caramia, M.; Pinto, D.M.; Pizzari, E.; Stecca, G. Clustering and routing in waste management: A two-stage optimisation approach. EURO J. Transp. Logist. 2023, 12, 100114. [Google Scholar] [CrossRef]
- Aloullal, A.; Saldanha-da-Gama, F.; Todosijević, R. Multi-period single-allocation hub location-routing: Models and heuristic solutions. Eur. J. Oper. Res. 2023, 310, 53–70. [Google Scholar] [CrossRef]
- Soto-Mendoza, V.; Ruiz-y-Ruiz, E.; García-Calvillo, I.; Nucamendi-Guillén, S.; Cardona-Valdés, Y. A location-routing problem for local supply chains. Comput. Ind. Eng. 2023, 183, 109528. [Google Scholar] [CrossRef]
- Phlips, P.; Ruona, W.; Megli, T.; Orpe, M. Unified Power-Based Vehicle Fuel Consumption Model Covering a Range of Conditions. SAE Int. J. Adv. Curr. Pract. Mobil. 2020, 2, 2320–2336. [Google Scholar] [CrossRef]
- Fazayeli, S.; Eydi, A.; Kamalabadi, I.N. Location-routing problem in multimodal transportation network with time windows and fuzzy demands: Presenting a two-part genetic algorithm. Comput. Ind. Eng. 2018, 119, 233–246. [Google Scholar] [CrossRef]
- Zhang, J.-L.; Li, C. Research on Dynamic Distribution Vehicle Route Optimization under the Influence of Carbon Emission. Chin. J. Manag. Sci. 2022, 30, 184–194. [Google Scholar]
- Liu, W.Y.; Lin, C.C.; Chiu, C.R.; Tsao, Y.S.; Wang, Q. Minimizing the Carbon Footprint for the Time-Dependent Heterogeneous-Fleet Vehicle Routing Problem with Alternative Paths. Sustainability 2014, 5, 4658–4684. [Google Scholar] [CrossRef]


Disclaimer/Publisher’s Note: The statements, opinions and data contained in all publications are solely those of the individual author(s) and contributor(s) and not of MDPI and/or the editor(s). MDPI and/or the editor(s) disclaim responsibility for any injury to people or property resulting from any ideas, methods, instructions or products referred to in the content. |
© 2024 by the authors. Licensee MDPI, Basel, Switzerland. This article is an open access article distributed under the terms and conditions of the Creative Commons Attribution (CC BY) license (https://creativecommons.org/licenses/by/4.0/).