Article

Spatial Differences, Dynamic Evolution, and Driving Factors of Carbon Emission Efficiency in National High-Tech Zones

1
School of Statistics and Data Science, Lanzhou University of Finance and Economics, Lanzhou 730020, China
2
Graduate School, Lanzhou University of Finance and Economics, Lanzhou 730020, China
*
Author to whom correspondence should be addressed.
Sustainability 2024, 16(15), 6380; https://doi.org/10.3390/su16156380
Submission received: 18 June 2024 / Revised: 17 July 2024 / Accepted: 22 July 2024 / Published: 25 July 2024

Abstract

:
Faced with substantial climatic problems, industrial parks are crucial to attaining sustainable development objectives and China’s carbon emission pledges. This study develops an output-oriented undesirable output Super-SBM model under non-incremental settings to evaluate the carbon emission efficiency of 169 national high-tech zones from 2008 to 2021. It utilizes the Dagum Gini coefficient and kernel density estimation approaches to analyze spatial variances and dynamic changes, as well as geographic detectors to assess the variables influencing the spatial development of carbon emission efficiency. This study uncovers a spatial distribution pattern of carbon emission efficiency within the eastern region of the national high-tech zone that is much superior to that in the western region. This tendency is mostly driven by inter-regional disparities. Carbon emission efficiency differences between various high-tech zones are progressively widening, displaying left-tail and polarization phenomena. Economic development gaps emerge as the main intrinsic factor contributing to spatial variations in carbon emission efficiency, with their interaction with land resource utilization being a key driving force. External factors, particularly differences in government interventions, dominate the spatiotemporal evolution of carbon emission efficiency, and their combined effect increases the evolution’s explanatory power. These research findings offer a solid foundation for crafting region-specific carbon reduction policies in national high-tech zones and provide valuable insights for enhancing carbon emission efficiency in a coordinated manner.

1. Introduction

Climate change is one of the most pressing global issues, and countries are actively exploring ways to achieve synergy between economic, social, and green low-carbon development. China’s carbon dioxide emissions account for about 30% of the global total, placing significant pressure and challenges on China in international climate change cooperation. At the 75th United Nations General Assembly, China took on the responsibility of addressing global climate change and solemnly committed to achieving peak carbon emissions by 2030 and carbon neutrality by 2060. Industry is a pillar of China’s economy and also a major source of carbon emissions. China has around 25,000 industrial parks, mainly including economic and technological development zones and high-tech industrial development zones. Due to rapid economic growth and industrial production demands, the carbon emissions of industrial parks have significantly increased. Therefore, reducing the reliance on fossil fuels in industrial parks and developing green, low-carbon industrial parks is crucial for China to achieve high-quality economic growth under resource and environmental constraints.
National-level science and technology industrial parks approved by the State Council and supervised by the Ministry of Science and Technology are referred to as national high-tech zones, also known as China High-Tech Industrial Development Zones. Beginning with the “Torch Program” in 1988, there were 169 recognized national high-tech zones by 2021. Over the years, these zones have shown impressive growth, with their gross domestic product (GDP) increasing by 2.8 times to 1.53 billion yuan by 2021 from just 5.4 trillion yuan in 2012, generating 13.4% of the national GDP with only 2.5% of the country’s construction land, making them pioneers of high-quality and sustainable economic growth. In alignment with global sustainable development goals and China’s carbon emission commitments, “Special Action for Green Development in National High-Tech Zones” was started in 2012 by China. This concept aims to turn high-tech zones into contemporary communities that value environmental civilization [1]. As of 2019, industrial businesses in the National High Tech Zone consumed less energy per ten thousand yuan of added value than the standard indicators of the National Ecological Industry Demonstration Park and the national average, with a value of 0.464 [2]. Nevertheless, because of variances in economic and social frameworks, resources, and environmental conditions among the areas, it is difficult to achieve a synchronized enhancement in collective carbon emission efficiency. Hence, precisely measuring and assessing the carbon emission performance of national high-tech zones enables both investigating regional distinctions and aiding in enforcing customized carbon reduction strategies for each zone [3], thereby advancing ecological civilization building and sustainable, eco-friendly growth. Enterprises within high-tech zones primarily focus on technological innovation and high value-added industries, exhibiting significant potential and advantages in energy efficiency and the application of green technologies. Compared to economic development zones, high-tech zones can more quickly adapt to and promote low-carbon development strategies. By introducing advanced technologies and innovative management models, these zones can gradually reduce carbon emissions and achieve green development. This not only helps the country reach its overall carbon peak target but also sets a demonstrative effect for other types of development zones.
National high-tech zones are widely distributed, and regions vary in terms of economic and social structures, resources, and environmental conditions, making it challenging to synchronously improve overall carbon emission efficiency. Therefore, accurately measuring and evaluating the carbon emission performance of national high-tech zones can better identify the carbon emission characteristics and regional differences of each zone. This also allows for the customization of carbon reduction strategies for each park, implementing targeted interventions to promote the overall improvement of green, low-carbon development in high-tech zones. This contributes to China’s environmental protection and sustainable development.
The remaining sections of this paper include: the second part reviews and summarizes the main viewpoints and findings of the existing literature; the third part provides a detailed introduction to the data materials and research methods used, including data sources, data processing methods, and analytical tools; the fourth part presents the empirical analysis, deriving research results through specific data and model analysis; the fifth part discusses the limitations of this research and suggests directions for future research; and the sixth part concludes by summarizing the main findings and contributions of this study.

2. Literature Review

As an important indicator for evaluating the development of a low-carbon economy, carbon emission efficiency has gained widespread attention in recent years. Despite extensive research in academia, its definition remains unclear. The study of carbon emissions can be traced back to the concept of carbon productivity [4], which was considered an important single-factor indicator [5,6,7] in the early stages of carbon emission development. Carbon productivity measures the amount of carbon emissions produced per unit of economic output. However, a single factor cannot encompass and estimate carbon emission efficiency. It involves multidimensional and complex interactions, requiring consideration of the relationship between inputs and outputs to measure accurately.
In terms of research methods, both domestic and international scholars most widely use parametric and non-parametric methods for measuring carbon emission efficiency. Among the parametric methods, the most prominent is the Stochastic Frontier Analysis (SFA). Herrala and Goel [8] conducted an in-depth analysis of carbon emission levels across 170 countries globally, covering the period from 1997 to 2007. Their study found that China and the United States, as two major carbon emitters, both saw significant improvements in carbon emission efficiency during this period. Filippini and Hunt [9] found that high energy intensity in 29 OECD countries does not imply high energy efficiency. Building on this, Jin and Kim [10] used panel stochastic frontier analysis to compare energy efficiency and carbon efficiency in emerging countries, finding that countries with high energy efficiency do not necessarily have high carbon efficiency. Among non-parametric methods, Data Envelopment Analysis (DEA) is widely used, evaluating the efficiency of decision-making units by constructing a production frontier. Park et al. [11] studied the environmental efficiency of the US transportation industry, Hailu and Veeman [12] researched the production efficiency of the Canadian paper industry and found that improving productivity can significantly improve environmental quality [13]. Zurano-Cervelló et al. [14] evaluated the electricity efficiency of EU member states and found that they can use renewable energy sources such as hydropower, wind energy, and solar energy to achieve carbon reduction in the electricity industry. Ikram et al. [15] found that improving distribution efficiency in Pakistan can effectively reduce greenhouse gas emissions. Honma et al. [16] compared the energy use efficiency at the industrial level in developed countries, finding that improving energy efficiency can alleviate Japan’s resource dilemma and reduce carbon dioxide emissions. Iqbal et al. [17] studied the energy, carbon emissions, and environmental efficiency of 20 industrialized countries, finding that most countries perform relatively well in reducing unit energy consumption but still have room for improvement in reducing unit carbon emissions. A study by Produção et al. [18], comparing the sustainability of BRICS and G7 economies in economic, social, and environmental aspects, found that the emerging BRICS countries exhibit better sustainability. It is evident that countries and industries with high energy consumption and high emissions are the main focus of scholars’ research. Analyzing these from different angles not only reveals carbon emission patterns but also provides a basis for policy-making and promotes the green transformation of industries.
Therefore, like in other countries, high-carbon emission industrial sectors are also a crucial part of China’s efforts to reduce carbon emissions. Gao et al. [19] conducted an in-depth study on the implicit and direct carbon emission efficiency of 28 industrial sectors in China, finding that industrial sectors play an important role in reducing carbon emissions. As major components of China’s industrial sectors, the restructuring and transformation of industrial parks are significant for the development of ecological cities. Studies show that transforming traditional industrial parks into eco-industrial parks can effectively reduce urban carbon intensity and promote low-carbon city construction [20,21]. Although some industrial parks still rely on non-renewable energy, Chinese scholars have found through studies on the Beijing Economic-Technological Development Area [22], Tianjin Economic-Technological Development Area [23], Ma’anshan Economic and Technological Development Zone [24], Suzhou Industrial Park, and Yunnan Anning Industrial Park [25] that building industrial parks into eco-industrial parks can significantly improve the carbon emission performance of the cities where these parks are located.
Factors influencing carbon emission efficiency are complex and diverse, including economic progress, energy allocation, the level of government intervention, the level of financial development, the level of openness, technological progress, industrial structure, population distribution, and labor quality. These factors have received widespread attention from scholars. The impact of economic growth on the environment aligns with the Environmental Kuznets Curve hypothesis [26]. When economic growth reaches a certain level, it can promote technological progress [27,28] and industrial structure optimization, thereby positively impacting the environment [29]. Reasonable energy efficiency [30] and environmental regulatory systems [31,32] can significantly reduce greenhouse gas emissions. Financial development [33,34] provides funding support for the research and application of low-carbon technologies, transferring funds to institutions with emission reduction tendencies. An increase in the level of openness [35] facilitates the introduction of advanced international carbon reduction technologies and management experiences. In the long run, urbanization levels [36] can improve the utilization efficiency of public facilities such as transportation, heating, and lighting, thereby reducing carbon emissions. The improvement of labor quality [37] influences the urban environment through the enhancement of personal skills, active waste sorting, resource recycling, and low-carbon living and travel. In summary, research on carbon emission efficiency requires multi-dimensional evaluation methods and comprehensive consideration of various influencing factors to fully understand and improve the carbon emission efficiency of different industries and regions. Through continuous research and policy initiatives, improving the carbon emission levels of China’s national high-tech zones will not only help these zones achieve higher levels of sustainable development but also make a significant contribution to the realization of global low-carbon goals.
The existing literature has extensively explored carbon emission efficiency. In comparison to earlier studies, this study makes the following contributions: (1) Current research tends to prioritize the national, regional, and industry levels, with particular attention being placed on the carbon emission efficiency in industrial parks. Most of these studies are centered around economic development zones, leaving a gap in research concerning the knowledge of national high-tech zones’ total carbon emission levels. (2) The Super-SBM model is commonly used in carbon emission efficiency studies, although it does not address input–output orientation issues. (3) Spatial analyses related to carbon emission efficiency are predominantly qualitative in nature, with a noticeable absence of quantitative research. (4) The literature on carbon emission efficiency in national high-tech zones lacks comprehensive coverage of spatial differences, dynamic evolution, and driving factors. Within national high-tech zones, this research examines the spatial differences, dynamic evolution, and underlying drivers of carbon emission efficiency. To begin with, this study utilizes an output-oriented, non-incremental undesirable Super-SBM model to assess the carbon emission efficiency of 169 high-tech zones across the years 2008 to 2021, comprehensively evaluating carbon emission efficiency from three levels: overall high-tech zones, comparisons among the four major regions, and park ratings. Second, it examines the spatial disparities, sources, and dynamic evolution of carbon emission efficiency using the Dagum Gini coefficient and decomposition approach, as well as the kernel density estimation method. Lastly, it investigates the driving force behind the temporal and geographical evolution of carbon emission efficiency, as well as the interaction impacts of exogenous and endogenous variables, with the use of geographic detectors. Additionally, it also suggests specific strategies aimed at synchronously enhancing carbon emission efficiency.

3. Materials and Methods

3.1. Research Methods

3.1.1. Carbon Emission Measurement

The Intergovernmental Panel on Climate Change (IPCC) has clarified relevant scientific issues regarding carbon emission assessment and proposed a globally recognized method for estimating carbon emissions. The precise formula is outlined as follows:
C = i = 1 n E i × N C V i × C E F i × C O F i
Equation (1) illustrates the carbon emission resulting from energy utilization, where n characterizes the energy variety, E i denotes the utilization of the i-th energy variety, N C V i signifies the typical reduced heating value of the i-th form of energy, C E F i indicates the carbon emission coefficient for each heat value unit of the i-th energy type, and C O F i displays the carbon oxidation coefficient for the i-th energy category. This paper uses internationally accepted carbon oxidation coefficients and carbon emission coefficients published by the IPCC. The carbon oxidation coefficients and carbon emission coefficients (unit: tc/tce) for different energy fuels are shown in Table 1.

3.1.2. Carbon Emission Efficiency Measurement

The carbon emission efficiency of national high-tech zones is going to be assessed using an output-oriented Super-SBM model with non-increasing rewards for undesirable outputs. The DEA model offers specific advantages in terms of comparing decision-making units and analyzing various inputs and outputs. In some cases, the analysis results may show that more than one decision-making unit is considered efficient. The “super-efficiency” approach was subsequently put forth by Tone [38]. The primary approach is to exclude the assessed decision-making unit from the reference set and calculate the efficiency value using the remaining decision-making units in the reference set. To further differentiate efficient units, it is noteworthy that an efficient unit’s super-efficiency value is usually larger than 1. When using an output-oriented assumption of non-increasing returns to scale, increasing inputs does not proportionally increase outputs, accurately reflecting the situation of diseconomies of scale, and corresponds more effectively with the criteria for assessing carbon emission efficiency. That is, merely increasing inputs will not suffice to accomplish the enhancement of carbon emission efficiency within high-tech zones. Under non-increasing returns to scale, the unwanted output Super-SBM model may be used for assessing the relative super-efficiency of units that make decisions in this situation, providing a more thorough assessment of efficiency. The model is expressed as follows:
ρ = min 1 w I 1 m i = 1 m s i / x i k 1 + w O 1 q 1 + q 2 r = 1 q 1 s r + / y r k + t = 1 q 2 s t b / b r k s . t . j = 1 , j k n x i j λ j s i x i k j = 1 , j k n y r j λ j + s i + y r k j = 1 , j k n b t j λ j + s t b b i k λ , s , s + 0 i = 1 , 2 , , m ; r = 1 , 2 , , q ; j = 1 , 2 , , n ; j k w I + w O > 0 , w I 0 , w O 0
A set of decision-making units with an efficiency value of ρ   ρ > 0 labeled as D M U j j = 1 , 2 , , n . Each D M U possesses m different inputs, denoted as x i i = 1 , 2 , , m ; k represents the number of a specific D M U among the units being analyzed; q 1 desirable outputs, known as y r r = 1 , 2 , q 1 ; and undesirable outputs, identified as b r r = 1 , 2 , , q 2 ; relaxation variable input is s i , expected outcome is s i + , and unexpected output is s t b . Parameters w I and w O are the two model parameters representing the weights for input-orientation and output-orientation, respectively, with at least one parameter not equal to zero. Let λ be the linear combination coefficient for the D M U . The specific D M U under evaluation is denoted as D M U k . Assuming output orientation with non-increasing returns to scale, w I = 1 , w O = ε .

3.1.3. Dagum Gini Coefficient and Decomposition Method

This study examines the disparities in carbon emission effectiveness among national high-tech zones utilizing the Dagum Gini coefficient and its decomposition approach. By employing sub-sample breakdown analysis, this study dissects the overall variances into components from within-region disparities, between-region disparities, and transvariation intensity [39]. The general formulation of the Gini coefficient can be seen in Equation (3). High-tech zones are graded based on the average values of emissions of carbon efficiency, leading to Equation (4). The Gini coefficient G j j and the within-region difference contribution G w for a specific region j is detailed in Equations (5) and (6). The Gini coefficient G j h along with the net difference contribution G n b between regions j and h are described in Equations (7) and (8). Equation (9) defines the transvariation intensity G t . The relationship among these components is given by: G = G w + G n b + G t . In this context, y j i y h r refers to emissions of carbon efficiency of the i r high-tech zone within area j h . The high-tech zone in area j ( h ) has an average carbon emission efficiency of y j ¯ ( y h ¯ ) . The total number of high-tech zones is n , while k indicates the amount of regions. The variable n j n h signifies the amount about high-tech zones in area j h .
G = j = 1 k h = 1 k i = 1 n j r = 1 n h y j i y h r 2 n 2 y ¯
y h ¯ y j ¯ y k ¯
G j j = 1 2 y j ¯ i = 1 n j r = 1 n j y j i y j r n j 2
G w = j = 1 k G j j p j s j
G j h = i = 1 n j r = 1 n j y j i y j r n j 2
G n b = j = 2 k h = 1 j 1 G j h p j s h + p h s j D j h
G t = j = 2 k h = 1 j 1 G j h p j s h + p h s j 1 D j h
s . t .       p j = n j y ¯     s j = n j y j ¯ n y ¯ j = 1 , 2 , , k

3.1.4. Kernel Density Estimation Method

Kernel density estimation is a non-parametric approach for investigating the geographical distribution shape of data. It generates the probability density function of the entire dataset by smoothing individual data points. Equation (10) calculates the probability density function f x of a variable that is selected at random X at a given position x . This paper employs the Gaussian function to assess the dynamic variations in emissions of carbon efficiency across national high-tech zones, as indicated in Equation (11). Here, N indicates the total number of sample observations, X i denotes the independently and identically distributed data; X ¯ is the mean value; and h is the bandwidth, indicating the degree of smoothness of the density function curve and the accuracy of the estimate. The kernel function K , acting as a weighting or smoothing function, must meet the conditions outlined in Equation (12).
f x = 1 N h i = 1 N K X i X ¯ h
K x = 1 2 π exp x 2 2
lim K x x = 0 x K x 0 , + K x d x = 1 sup K x < + , + K 2 x d x = 1

3.1.5. The Geographic Detector

The geographic detector is a method of statistics for determining geographical heterogeneity and its driving factors. The underlying premise is that if an independent variable has a substantial effect on a dependent variable, their geographic distributions should be comparable. This statistical relationship may reveal the reasons driving the geographic variety of the dependent variable [40,41]. The q value in Formula (13) is used to assess the influence of various factors on the spatiotemporal shift of carbon emission efficiency across high-tech zones.
A higher q value suggests that V has a better explanatory capacity for spatiotemporal development, and q varies between 0 and 1. When q = 0 , it means that variable V i cannot account for the spatial distribution of carbon emission efficiency; when q = 1 , it indicates a perfect match between the spatial distribution of variable V i and carbon emission efficiency. Here, h = 1 , 2 , , m , denotes the partitions of either the independent variable V or the dependent variable Y , n indicates the total number of samples in the research area, δ is the study area’s total variance. In partition h , the sample size is n h , and the dependent variable’s variance is δ h 2 .
q = 1 1 n δ 2 h = 1 m n h δ h 2
The interaction detector compares the q values of separate components to the aggregate q value acquired by spatial overlay to identify the degree and direction of the interaction. This evaluation aids in understanding whether the interaction affects the explanatory power of a single variable or affects the geographical heterogeneity of the dependent variable. If q V i V j < min q V i , q V j , the interaction between V i and V j is classified as non-linear weakening. If min q V i , q V j < q V i V j < max q V i , q V j , it is classified as single-factor non-linear weakening. If q V i V j > max q V i , q V j , it is considered dual-factor enhancement. If q V i V j = q V i + q V j , then variables are independent of one another. If q V i V j > q V i + q V j , the interaction has been characterized as non-linear enhancement.

3.2. Indicator Selection and Study Area

Table 2 demonstrates the nationwide implementation of a carbon emission efficiency indicator system for high-tech zones. Capital, labor, land, and energy comprise the input indicators. The total assets enumerated in the balance statements at the year’s end are the basis for determining capital input. The labor input is primarily determined by the number of employees in the zone at the end of the year, while the land input is determined by the area developed within the high-tech zone. Energy consumption is estimated by converting power consumption and gas supply (natural gas and liquefied petroleum gas) in high-tech areas into conventional coal units. The total value of industrial production in the high-tech zone represents the intended output, while the level of carbon dioxide emissions represents the undesired output.
Using the data at hand, this study selects data from 169 national high-tech industrial parks that are a component of the “Torch Program” and approved by the State Council until 2021. The timeframe studied spans from 2008 to 2021. According to the “China Torch Statistical Yearbook”, the country’s high-tech zones are categorized into four primary regions: Eastern, Northeastern, Central, and Western. The carbon emissions parameter data are derived from the “General Principles for Calculating Comprehensive Energy Consumption” and the “2006 IPCC Guidelines for National Greenhouse Gas Inventories”. Other statistics are derived from a variety of statistical yearbooks, including those on China’s Torch Program, cities, energy, and the environment, as well as reports on the economic and social progress and environmental state of different areas.

4. Results

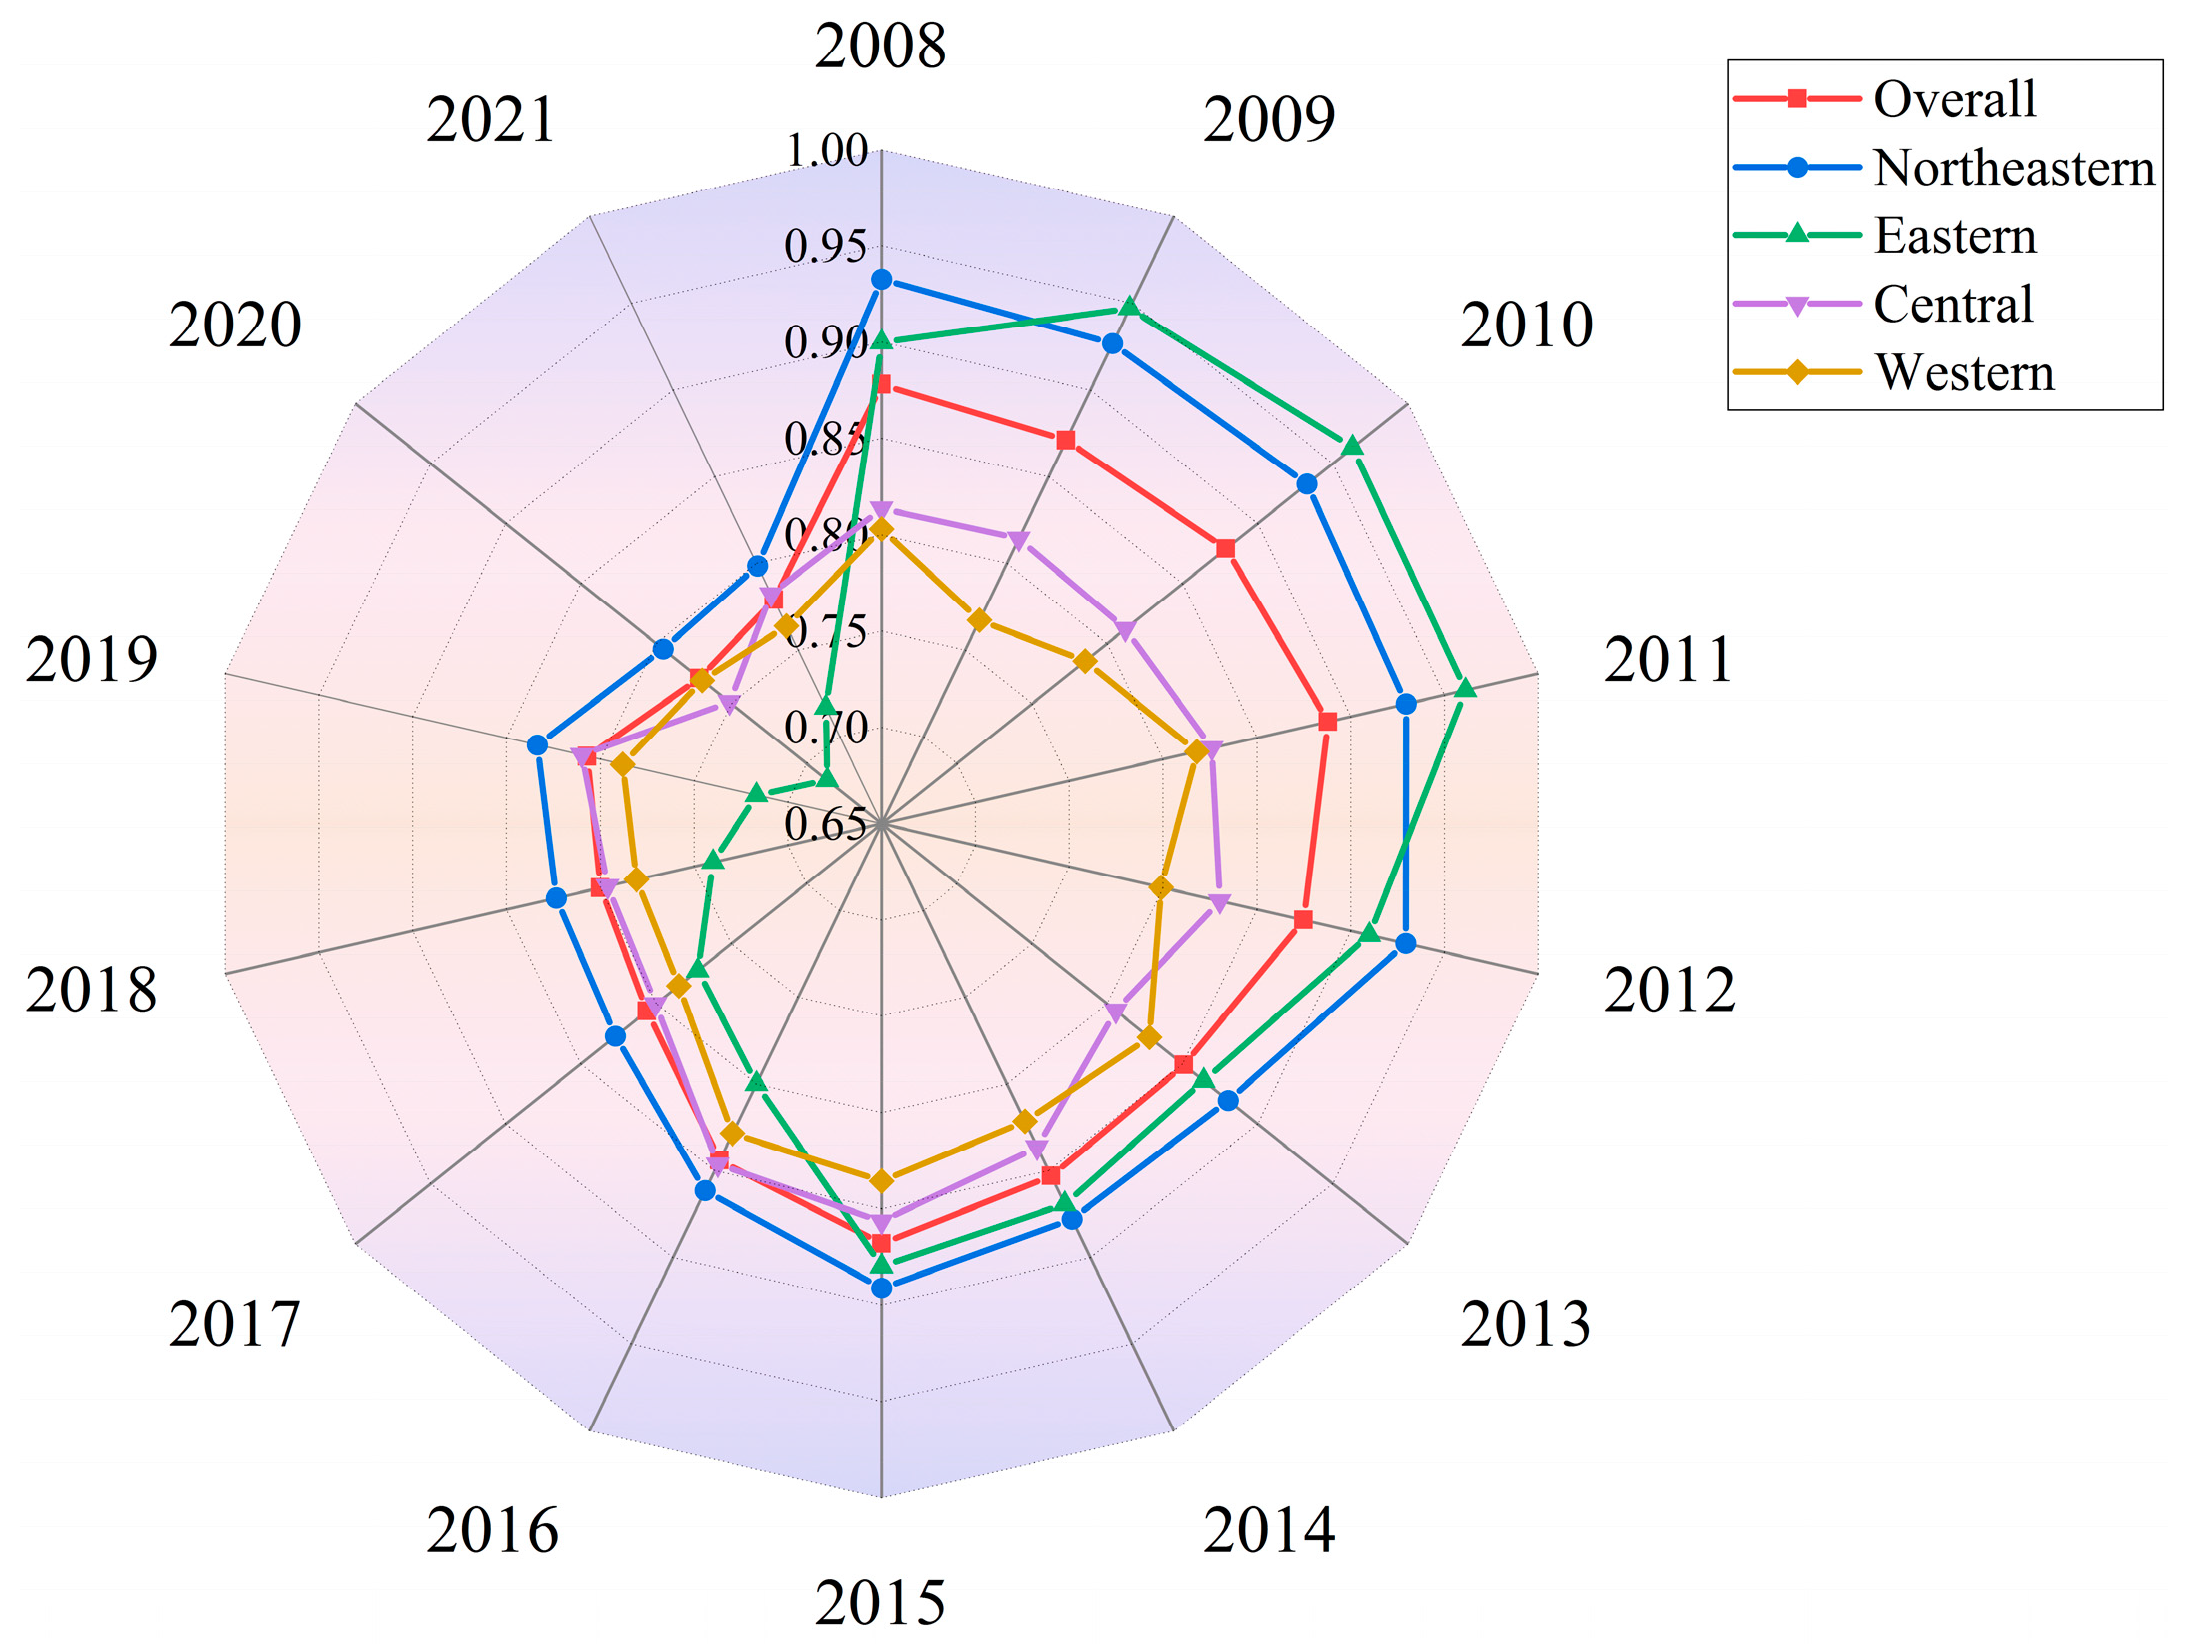
4.1. Measuring and Evaluating Carbon Emission Efficiency in National High-Tech Zones

Utilizing an output-oriented, non-incremental, undesirable Super-SBM model, this study assesses the carbon emission efficiency of 169 national high-tech zones between 2008 and 2021, evaluating their carbon emission levels comprehensively from the perspectives of regional comparison and park rating. Overall, as Figure 1 shows, there is a changing downward trend in the efficiency of carbon emissions in national high-tech zones. Notwithstanding the country’s growing emphasis on ecological civilization construction, high-tech zones have not achieved green and low-carbon development amid rapid economic growth, and efficiency in terms of carbon emissions has not changed much. Regarding evolution, the efficiency of carbon emissions experienced an initial decrease followed by an increase from 2008 to 2011, indicating that, in response to the global financial crisis, China adjusted its economic development and industrial framework models, strengthened the application of law and regulatory systems for the ecological environment, and progressively lowered carbon emissions in the high-tech zones. After 2011, there was an uneven decrease in carbon emission efficiency, with an average annual reduction rate of 11.28%, reflecting that prolonged rapid economic development has increased environmental pressure, exacerbating the conflict between resource exploitation and environmental protection and pushing low-carbon development into a critical stage. Regional comparisons indicate that national high-tech zones exhibit a spatial distribution pattern where the carbon emission efficiency in the eastern regions is significantly better than in the western regions. Specifically, the eastern region’s carbon emission efficiency ranges from 0.8 to 0.93, which is much greater than in other regions. The Northeastern and Central areas have almost comparable carbon emission efficiency, with the Northeast region slightly better than the Central region, but the Western region has the lowest carbon emission reduction efficiency. In regard to evolutionary tendency, the northeastern region had a fluctuating increase in carbon emission efficiency between 2008 and 2011, followed by a fluctuating fall. The trend in the western and central regions indicated an initial increase followed by a decrease, characterized by relatively minor fluctuations. This suggests spatial disparities in the economic growth of national high-tech zones, emphasizing uneven carbon emission levels across the four main regions. The primary issues confronting high-tech zones in Northeast China include extensive development techniques, severe petrochemical pollution, and growing carbon emission levels. Traditional industries across the central and western areas may confront obstacles as they undergo rapid transition and upgrading. Many high-tech zones in the central and western regions still house conventional businesses that cannot be changed and updated in a short time. These “three high” industries, which are distinguished by high pollution, high energy consumption, and high emissions, impede progress toward carbon emission efficiency.
To better represent the spatial distribution of carbon emission efficiency within national high-tech zones, this study ranked the efficiency of carbon emissions within all high-tech zones. The carbon emission efficiency is divided into four stages: if the average value is not less than 1, it is rated as “Excellent”; between 0.9 and 1, it is rated as “Good”; between 0.7 and 0.9, it is rated as “Moderate”; and for values below 0.7, as “Poor”. The geographical distribution and carbon emission efficiency ratings of national high-tech zones are shown in Figure 2. The average carbon emission efficiency score and carbon emission efficiency rating of national high-tech zones can be found in Appendix A.
The findings suggest that 38.57% of the 70 high-tech zones throughout the eastern regions have achieved excellent or good levels of carbon emission efficiency. These successful outcomes can be attributed to their solid natural economic foundation, green innovation technologies, and reasonable industrial structure. In the year 2021, Beijing Zhongguancun Science Park, Shenzhen High-Tech Zone, and Shanghai Zhangjiang High-Tech Park secured the top three positions among the leading 100 national high-tech zones. Of significance is the fact that 41% of these zones are categorized as “Moderate”, displaying an average carbon emission efficiency that falls below 0.8. The focal points for carbon emission management efforts should include Shandong, Hebei, and Guangdong provinces, where these zones are primarily located.
In the northeastern region, there are 16 national high-tech zones with notable variations in carbon emission efficiency. Throughout the study period, Changchun High-Tech Zone maintained a carbon emission efficiency above 1, ranking second nationwide. Established in 2016, Changchun High-Tech Zone successfully transformed traditional industries into a low-carbon benchmark. However, 43.75% of high-tech zones in the region are rated as “Moderate”, indicating significant carbon emission issues needing improvement. About 37.5% are rated as “Poor”, with 83% located in Liaoning Province, where the average carbon emission efficiency is below 0.66. Fuxin High-Tech Zone includes traditional industries like textiles, fur products, and packaging, while Liaoyang High-Tech Zone focuses on chemicals, chemical fibers, and aluminum profiles. These high-energy-consuming and high-polluting industries severely impact the ecological environment and hinder carbon emission improvements.
The central region of China is home to 44 national high-tech zones, with 27.27% rated as “Excellent” or “Good” in carbon emission efficiency, 47.73% rated as “Moderate”, and 25% rated as “Poor”, primarily located in Anhui, Hubei, and Hunan. Huainan High-Tech Zone, in its early stages, introduced a large number of high-carbon-emission traditional industries to achieve economic development goals, resulting in the lowest carbon emission efficiency. Huaihua High-Tech Zone, formerly the Huaihua Industrial Park in Hunan, has a majority of traditional industrial enterprises, and lowering their carbon emissions is critical to increasing carbon emission efficiency. In Hubei, Huangshi and Jingzhou High-Tech Zone are home to large-scale industries that consume significant energy, including those involved in textiles and paper production. These industries use chemicals like dyes and auxiliaries in their production processes, generating large amounts of toxic and hazardous wastewater and exhaust gases while consuming substantial amounts of energy and water resources, leading to lower emissions of carbon efficiency.
There are 39 national high-tech zones within the western region, with 15.38% rated as “Excellent”, 51.28% of its high-tech zones classified as “Moderate”, with 20.51% graded as “Poor”. Chengdu’s High-Tech Zone ranked third in the 2016 national ranking by the Torch Center of the Ministry of Science and Technology. Leveraging its strengths in the digital economy and innovative technology sectors, Chengdu High-Tech Zone successfully achieved both economic growth and low carbon emissions objectives. The regions classified as “Poor” are mainly situated in Ningxia, Gansu, and Qinghai, where the average emissions of carbon efficiency across all high-tech zones in these provinces are less than 0.7%. Despite the rich energy resources in Ningxia, Gansu, and Qinghai, extensive resource development and primary processing activities have not only damaged the ecological environment but also generated significant amounts of carbon dioxide. The core industries of Baiyin High-Tech Zone are non-ferrous metals and rare earth new materials. The extraction and processing of these materials produce wastewater and slag containing heavy metals, as well as exhaust gases and dust containing sulfur dioxide and nitrogen oxides, leading to vegetation destruction, land desertification, and ecological imbalance. Hence, understanding the variations in industrial configurations and levels of carbon emissions between different areas is crucial. To improve overall carbon emission efficiency in high-tech zones across the country, targeted development measures that are relevant to each region must be used.

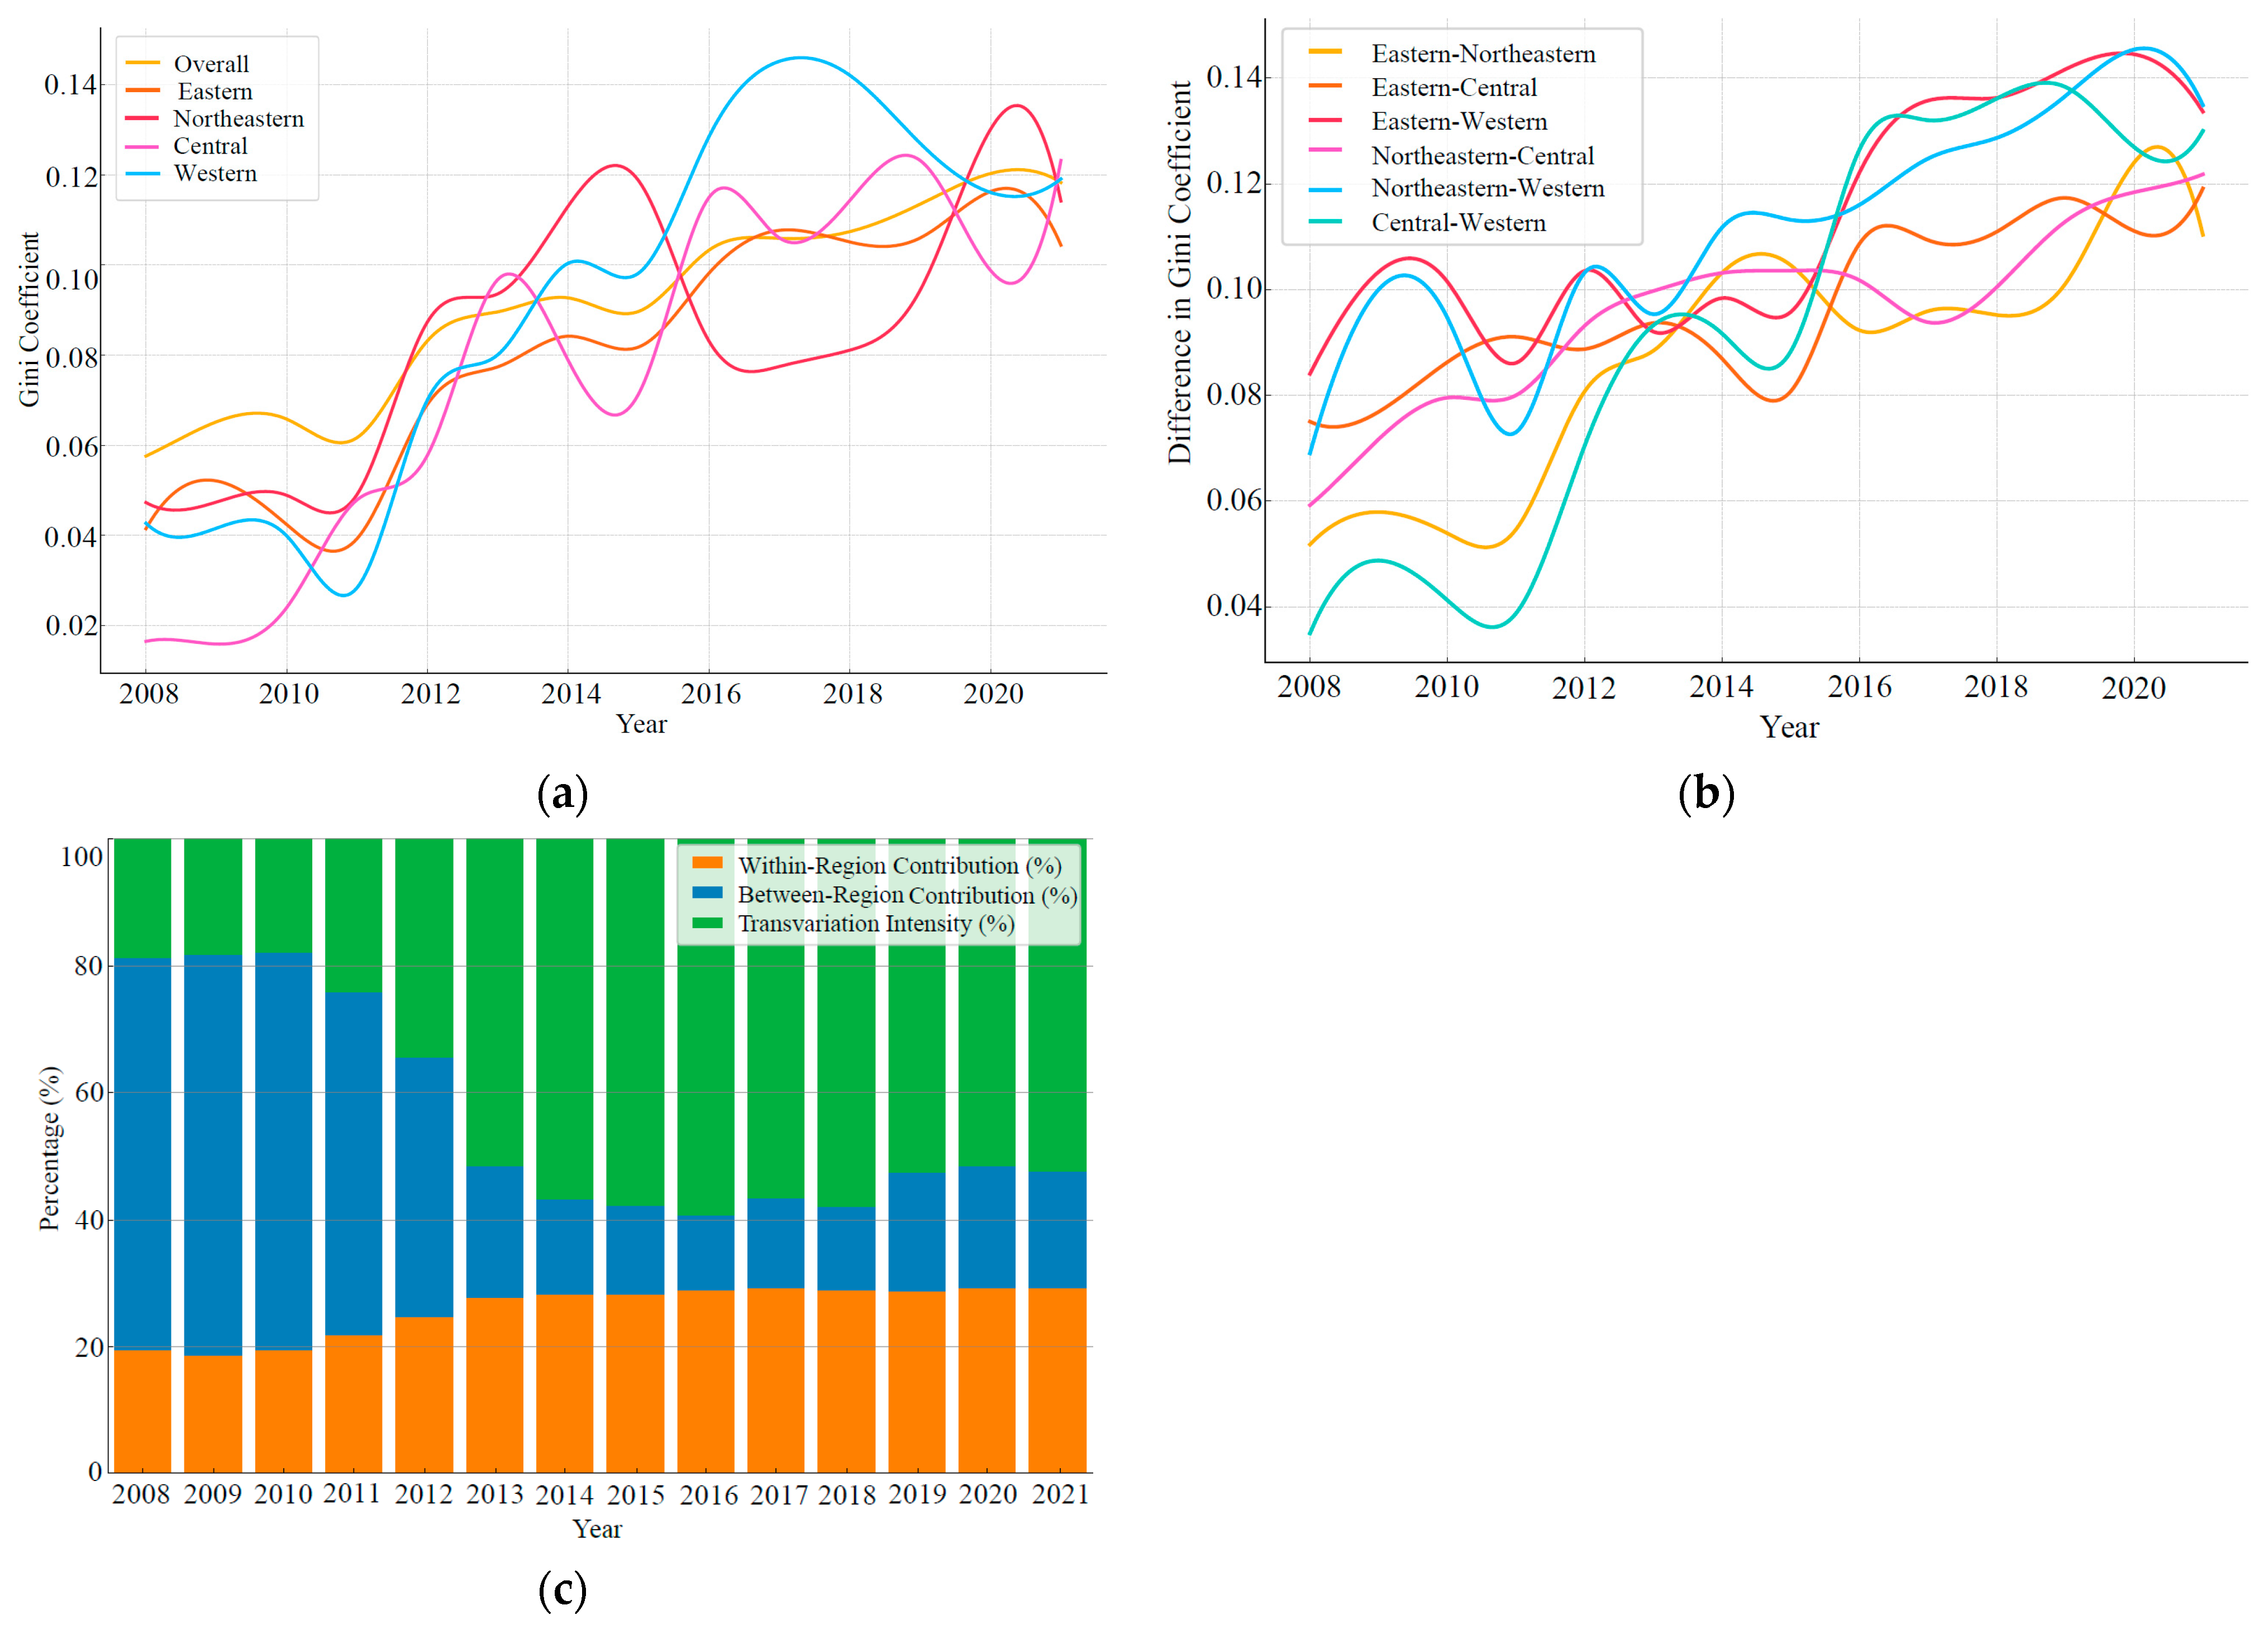
4.2. Space Variations and Sources for Carbon Emission Efficiency within National High-Tech Zones

This research uses the Dagum Gini coefficient and its decomposition technique to calculate overall differences, intra-regional differences, inter-regional differences, and contribution rates of carbon emission efficiency within national high-tech zones. The objective is to highlight the spatial variations and sources of carbon emission efficiency within these zones. Table 3 summarizes the measurement findings.
Figure 3a depicts how the overall and area Gini coefficients for carbon emission efficiency vary among national high-tech zones. The mean overall Gini coefficient registers at 0.91, signifying a considerable spatial disparity in carbon emission efficiency. Throughout the study period, the total Gini coefficient grew from 0.0576 to 0.1183, showing that the carbon emission efficiency gap between high-tech zones has increasingly broadened. Between 2008 and 2010, the overall Gini coefficient experienced a downward fluctuation before steadily increasing on a yearly basis. When the four primary areas are compared, it is clear that carbon emission efficiency varies across high-tech zones: the western region has the most internal disparities, with an average intra-regional Gini coefficient of 0.0914. This is followed by the northeastern, eastern, and central areas, which have average intra-regional Gini coefficients of 0.0847, 0.0804, and 0.0778. The Gini coefficient in the eastern region follows a trend similar to the overall Gini coefficient, first fluctuating downward and then steadily increasing. In the central region, the Gini coefficient exhibits more frequent fluctuations, displaying a W-shaped pattern with “fall-rise-fall-rise”. The northeastern region has an N-shaped pattern with “rise-fall-rise” in its Gini coefficient, while the western region demonstrates an inverted U-shaped trend of “rise-fall”.
Figure 3b depicts the evolution process of between-region differences in carbon emission efficiency among national high-tech zones. Notably, the disparities are more pronounced between the eastern and northeastern areas compared to the western region, with average Gini values of 0.1128 and 0.1105, respectively. The discrepancies among the eastern and central, northeastern and central, and central and western areas diminish successively, with average inter-regional Gini values of 0.0968, 0.0956, and 0.0926, respectively. The northeastern and eastern areas have the least regional variation, with an average Gini value of 0.0867. During the sample’s observation period, the inter-regional variances in carbon emissions across the four main areas fluctuated upward, often following a “rise-fall-rise” pattern. The Gini coefficient curves exhibit interlaced variations, with differences following a “divergence-convergence-divergence” trend.
As shown in Figure 3c, the contribution rates of each region are displayed. The average within-region contribution rate is 25.94%, the average between-region contribution rate is 30.60%, and the average transvariation intensity contribution rate is 43.47%. This indicates that regional variances are the primary factor influencing spatial discrepancies in carbon emission efficiency within national high-tech zones. Over the research period, contributions from within-region and transvariation intensity exhibited a general upward trajectory. Amid fluctuations, the between-region contribution rate experienced a substantial decline. In the evolution process, the distribution of the between-region contribution rate exhibited a “rise-fall-rise” pattern, whereas the transvariation intensity contribution rate changed in the opposite manner. The within-region contribution rate remained relatively stable, showing a steady growth trend.

4.3. The Dynamic Evolution of Carbon Emission Efficiency in National High-Tech Zones

This study improves the investigation of the absolute differences in the efficiency of carbon emissions across national high-tech zones by using the kernel density estimation approach. It determines the overall shape and dynamic development patterns, such as distribution location, primary peak shape, distribution spread, and peak amount, as shown in Figure 4 and Table 4.
Regarding distribution position, the kernel density curves show a leftward shift for both national high-tech zones and the four primary areas, suggesting a gradual decrease in carbon emission efficiency and escalating pressure to decrease emissions. The general distribution of carbon emission efficiency in high-tech zones displays a trend of “right-shift to left-shift”, with 2010 being a turning point. The evolution of the four key regions mirrors the overarching pattern.
In terms of the primary peak’s shape, the principal peak in the kernel density curve inside the high-tech zones at a national level grows in height while expanding in width. The alterations observed in the eastern and northeastern areas mirror the general pattern, indicating that more observations are concentrated within a lower range of carbon emission efficiency, while internal differences are gradually increasing. In contrast, in the central and western areas, the height of the major peak decreases as the width expands, indicating that carbon emission efficiency data are spread throughout a larger range. This indicates significant differences, an uneven efficiency level, and an internal presentation of diversity and dispersion.
Regarding distribution extensibility, both national high-tech zones and the four major regions show a right-skewed tail in their distribution curves. This implies that certain high-tech zones in each area are more efficient than the average in terms of carbon emissions. The kernel density curves for the overall and eastern regions have undergone an evolution process from “convergence to broadening”, suggesting that high-tech zones with higher carbon emission efficiency are closer to the average level. The kernel density curves for other regions exhibit poor convergence, indicating that the disparity between extreme values and the average value within the region has not decreased. Additionally, carbon emission efficiency has remained consistently low in certain high-tech zones.
Through analyzing the number of peaks, it becomes evident that both the overall national high-tech zones and the four major regions exhibit a bimodal phenomenon throughout the study period. This observation points to a polarization in carbon emission efficiency within these areas. The aggregate height of the side peaks in high-tech areas progressively exceeds that of the primary peak, suggesting a strong spatial polarization phenomenon. The consistent height difference between the main and side peaks in the northeastern, central, and western areas demonstrates a definite gradient impact on carbon emission efficiency levels. The carbon emission efficiency in the eastern area progressively polarizes, with the primary peak transitioning from a single to a dual peak.

4.4. Factors Influencing the Spatiotemporal Evolution of Carbon Emission Efficiency across National High-Tech Zones

Green, low-carbon, and sustainable development necessitates increasing economic production while decreasing resource use to attain environmental and economic harmony. The spatiotemporal development of carbon emission efficiency within high-tech zones is intimately tied to input–output variables. These factors interact in various ways, jointly determining the economic output and carbon emission efficiency levels of high-tech zones. Optimizing the management of these input–output parameters may significantly improve carbon emission efficiency. As a result, as endogenous driving forces, these variables play an important role in determining the spatiotemporal development of carbon emission efficiency. Furthermore, exogenous driving factors such as government intervention [31,32], the level of financial development [33,34], the degree of openness [35], scientific and technological levels [27,28], industrial structure, population structure [36], and worker quality [37] all have a significant impact on the spatiotemporal evolution of carbon emission efficiency.
Government intervention levels are evaluated using the percentage of fiscal spending, excluding investments in education, science, culture, and health, in relation to GDP. This indicates the government’s involvement in the green and low-carbon transition. The total deposits and loans to GDP ratio measures the degree of financial development. The fraction of total import and export commerce compared to GDP indicates the level of openness. The quantity of funding allocated for research and development within different sectors is indicative of the advancement in science and technology. The industrial structure is measured by the ratio of added value from secondary to tertiary industries. To calculate the urbanization indicator in the population structure, divide the urban population by the total population. The ratio of the number of technology professionals at the end of the year to the number of employees working in the high-tech zone measures worker quality.

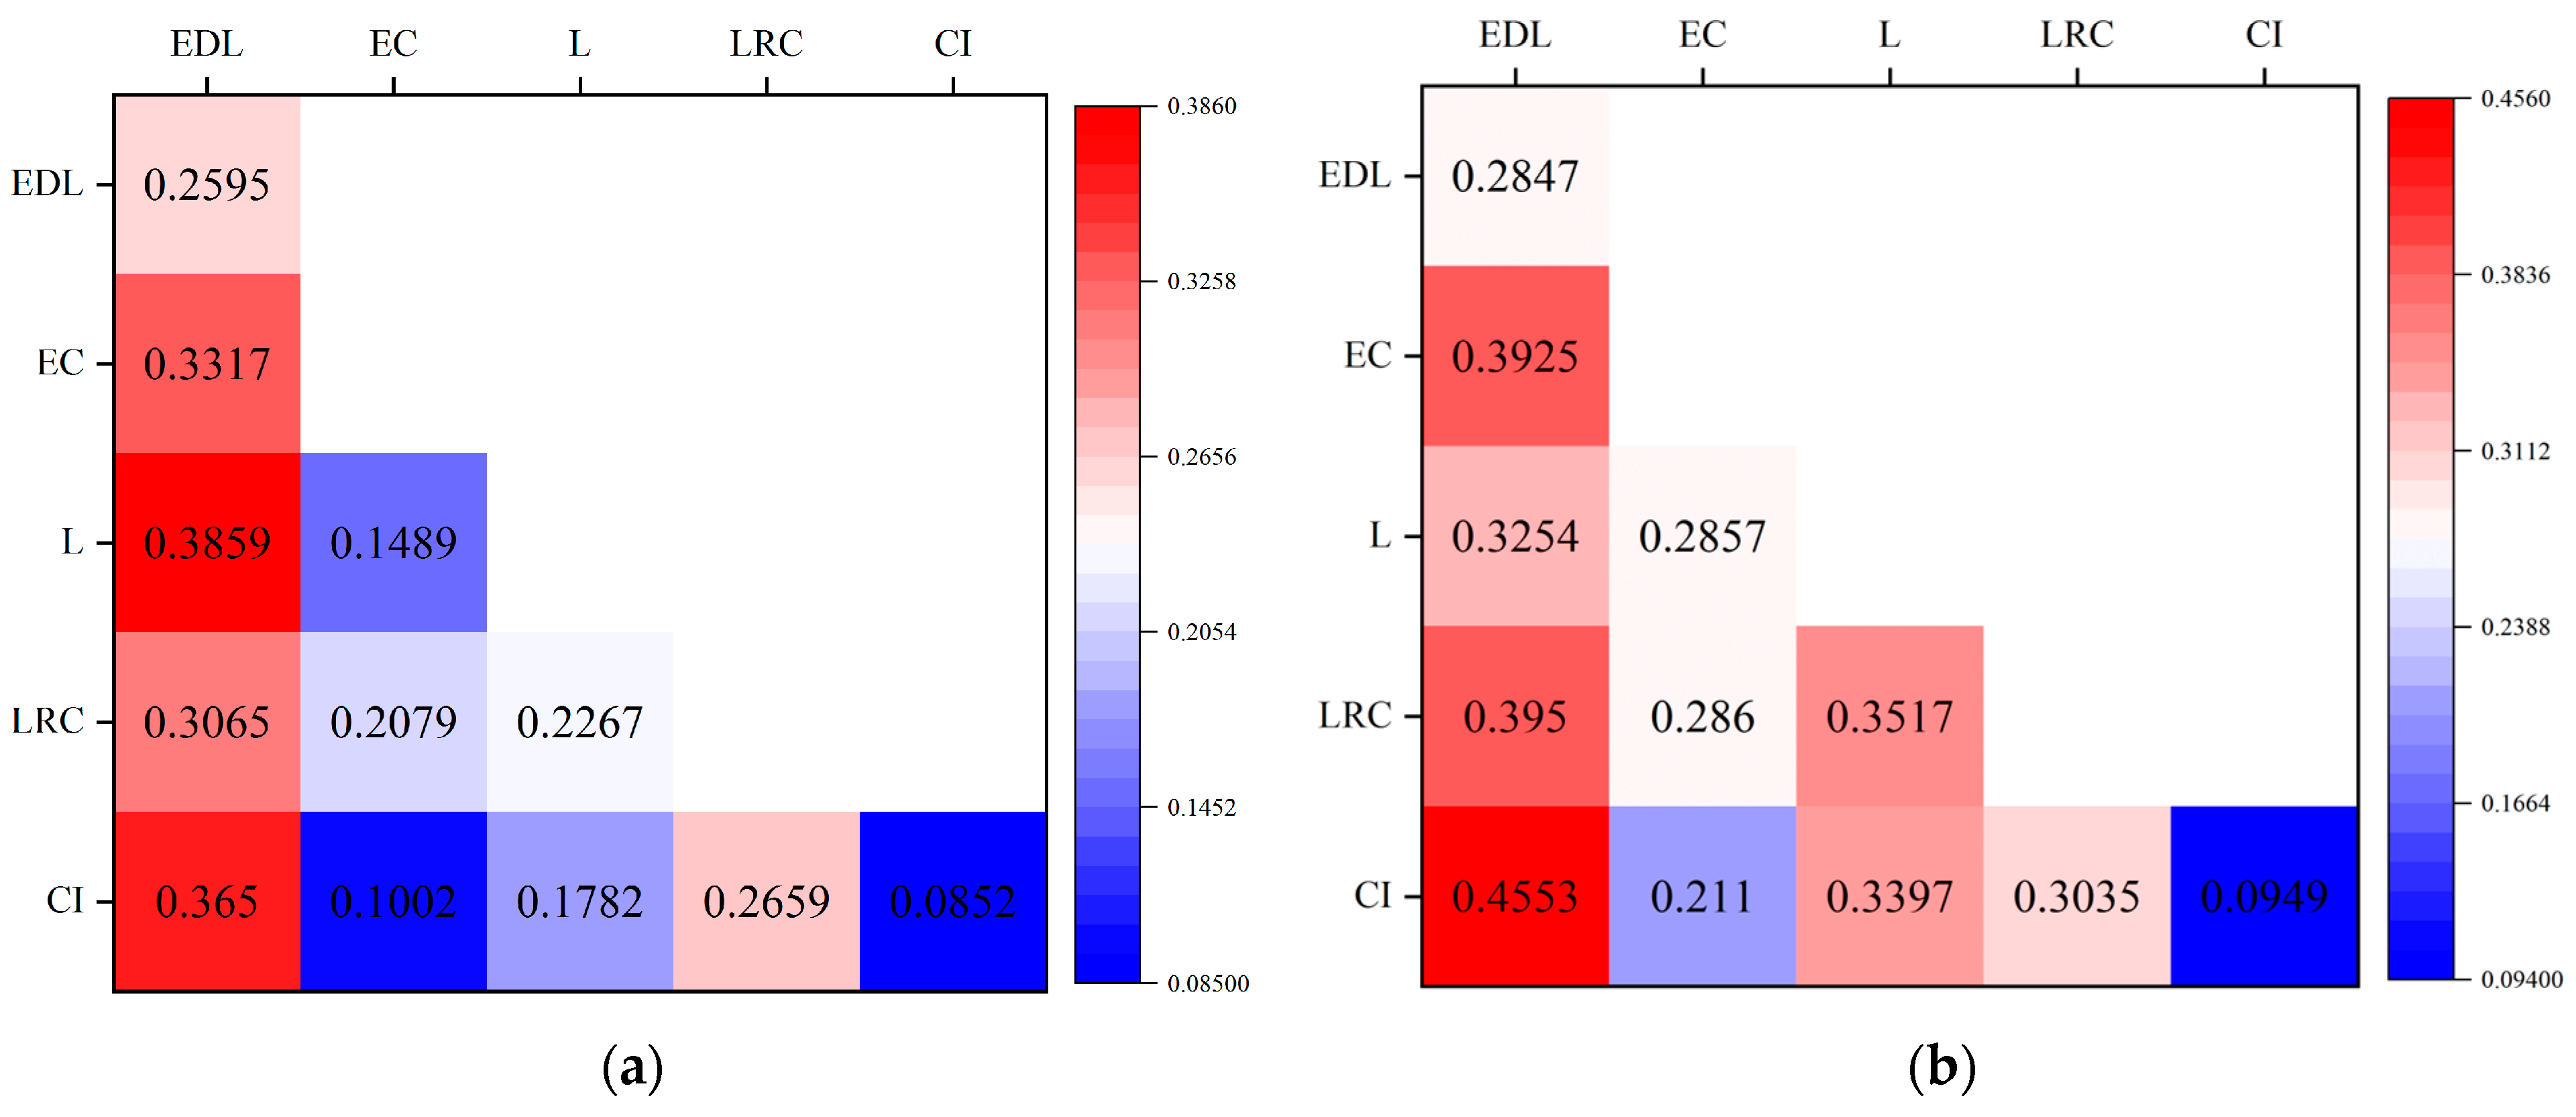
4.4.1. Endogenous Driving Factors of the Spatial-Temporal Evolution of Carbon Emission Efficiency in National High-Tech Zones

The determination q values and significance levels of each driving component obtained by the geographic detector (see Table 5) are utilized to thoroughly examine the endogenous variables influencing the spatiotemporal development of carbon emission efficiency. Figure 5a shows that industrial output value is the primary intrinsic factor influencing carbon emission efficiency, with its impact on high-tech zones and the four major regions significantly higher than other factors. On the one hand, a high industrial output value usually indicates higher production activity, which may entail greater resource consumption and environmental pressure. On the other hand, it may also reflect higher levels of technology and efficiency, thereby improving resource utilization and carbon emission efficiency. In high-tech zones as a whole, labor and capital inputs are secondary elements impacting carbon emission efficiency, but land resource utilization is also important. The situation in the eastern and western areas is comparable, although carbon emissions in the eastern region are more heavily influenced by land resource utilization. Labor is a minor driving component in the northeastern area, but capital input and energy consumption have a considerable impact on carbon emissions. The central region exhibits a multifactor endogenous constraint, where, aside from the level of economic development, the determinant power of other driving factors shows relatively small differences.
Figure 5b depicts the dynamic variations in the spatiotemporal change in carbon emission efficiency within high-tech zones caused by endogenous variables. Over the course of this study, geographical disparities in economic development levels had a much greater impact on the spatiotemporal progression of carbon emission efficiency than other variables. Differences in labor input and capital input followed, while differences in energy consumption had a relatively smaller impact. Land resource consumption was the weakest explanatory factor. From the evolution process, except for land resource consumption, the remaining five internal driving forces typically demonstrated a pattern of initial decline followed by a rise throughout the research timeframe.
The interaction detector is used in this study to statistically examine the combined impacts of endogenous driving factors, examine the impact of dual-factor interactions on the explanatory power of single factors, and identify the types of interactions. Figure 6 shows the detection findings. Any combination of two driving variables has more explanatory power than a single element, implying that the spatiotemporal development of carbon emission efficiency is influenced by inherent multi-factor interactions. All interactions are either non-linear enhancement or two-factor enhancement. Overall, high-tech zones have the highest interaction value between economic development level and other characteristics, indicating that improvements in economic development significantly promote other related factors. Although the impact of land resource consumption is relatively low, its interaction q-values with other factors are all above 0.2, suggesting that efficient land resource allocation and utilization help to accomplish low-carbon targets in the high-tech zone. In the northeastern region, the highest q-value for the interaction between economic development level and land resource consumption suggests that proper land resource allocation may boost the economy. Within the eastern and central regions, economic development and capital inflow are the most important interaction elements. The western region exhibits the greatest q-value for the interplay between land resource usage and labor, indicating that a reliance on traditional and resource-based industries requires increased efforts in industrial upgrading and economic structure adjustment.

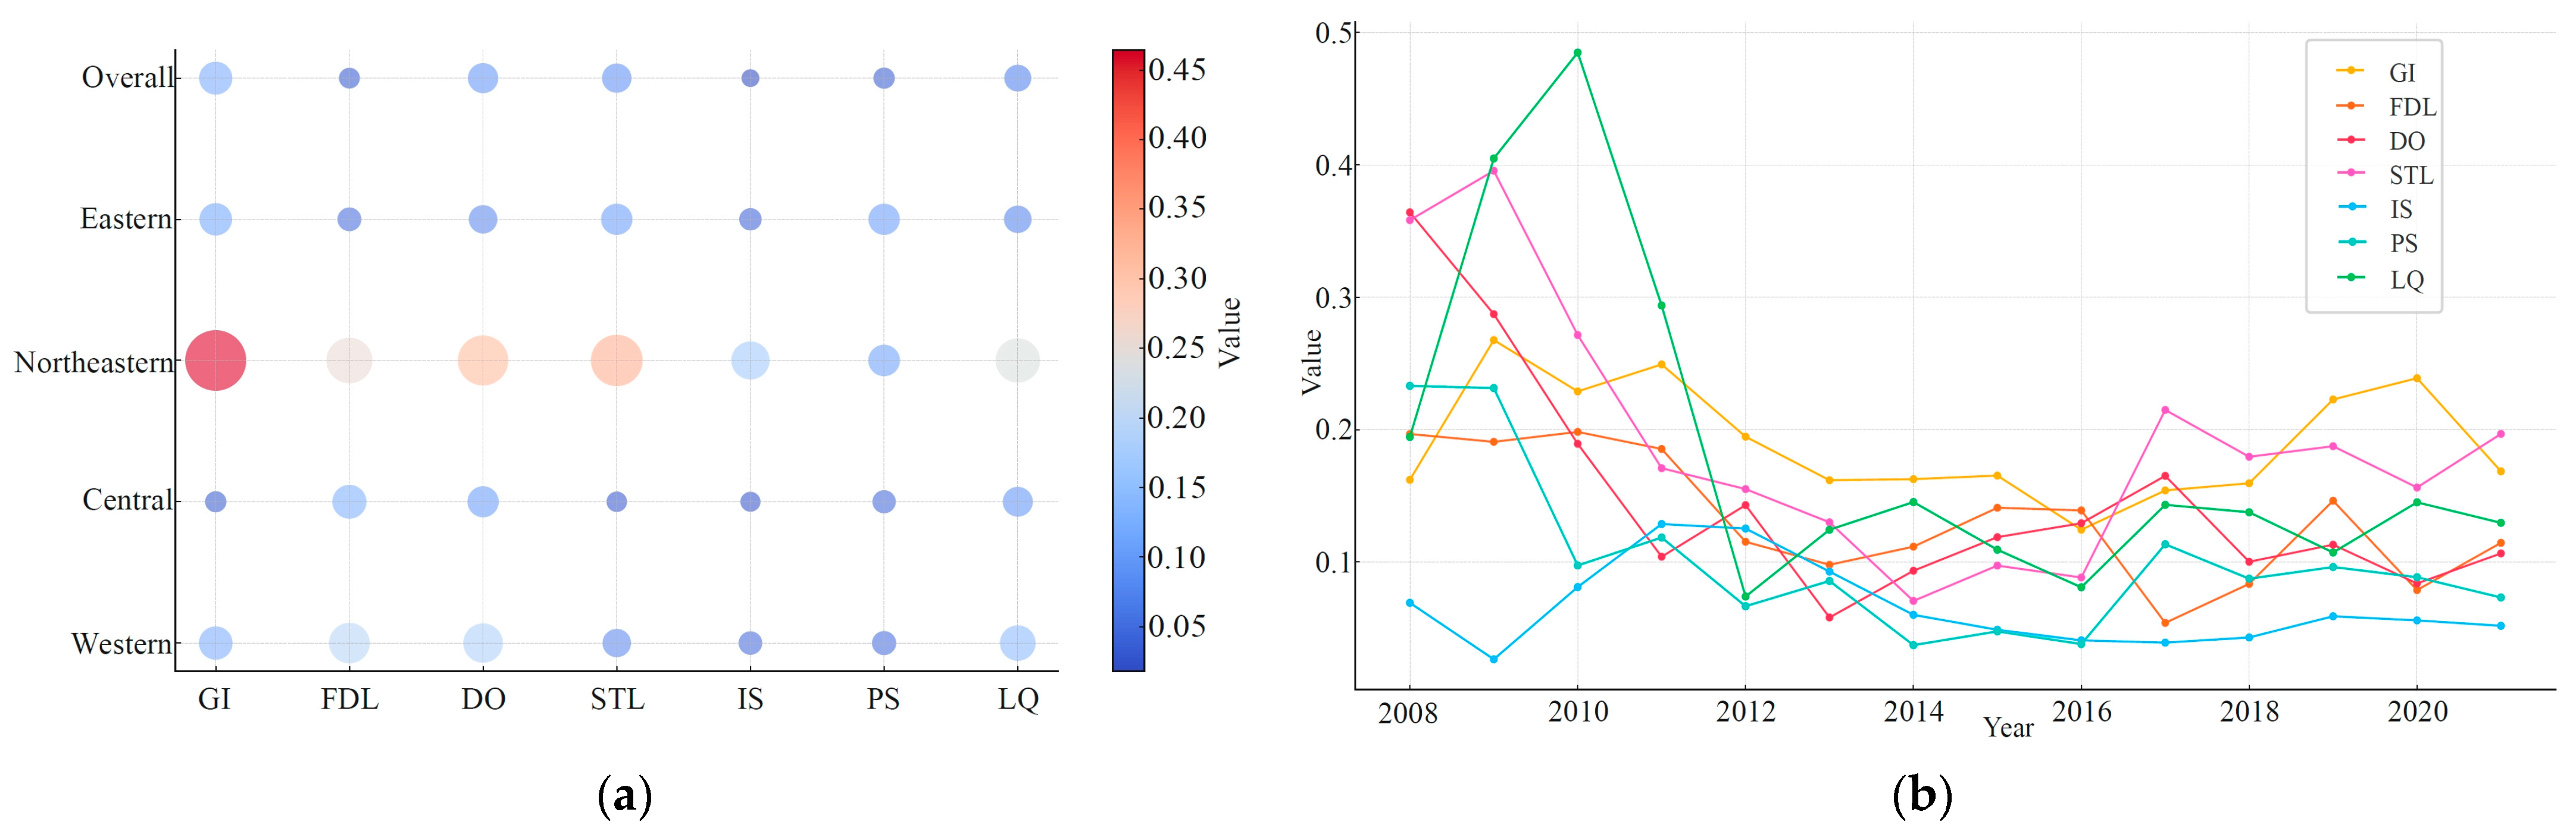
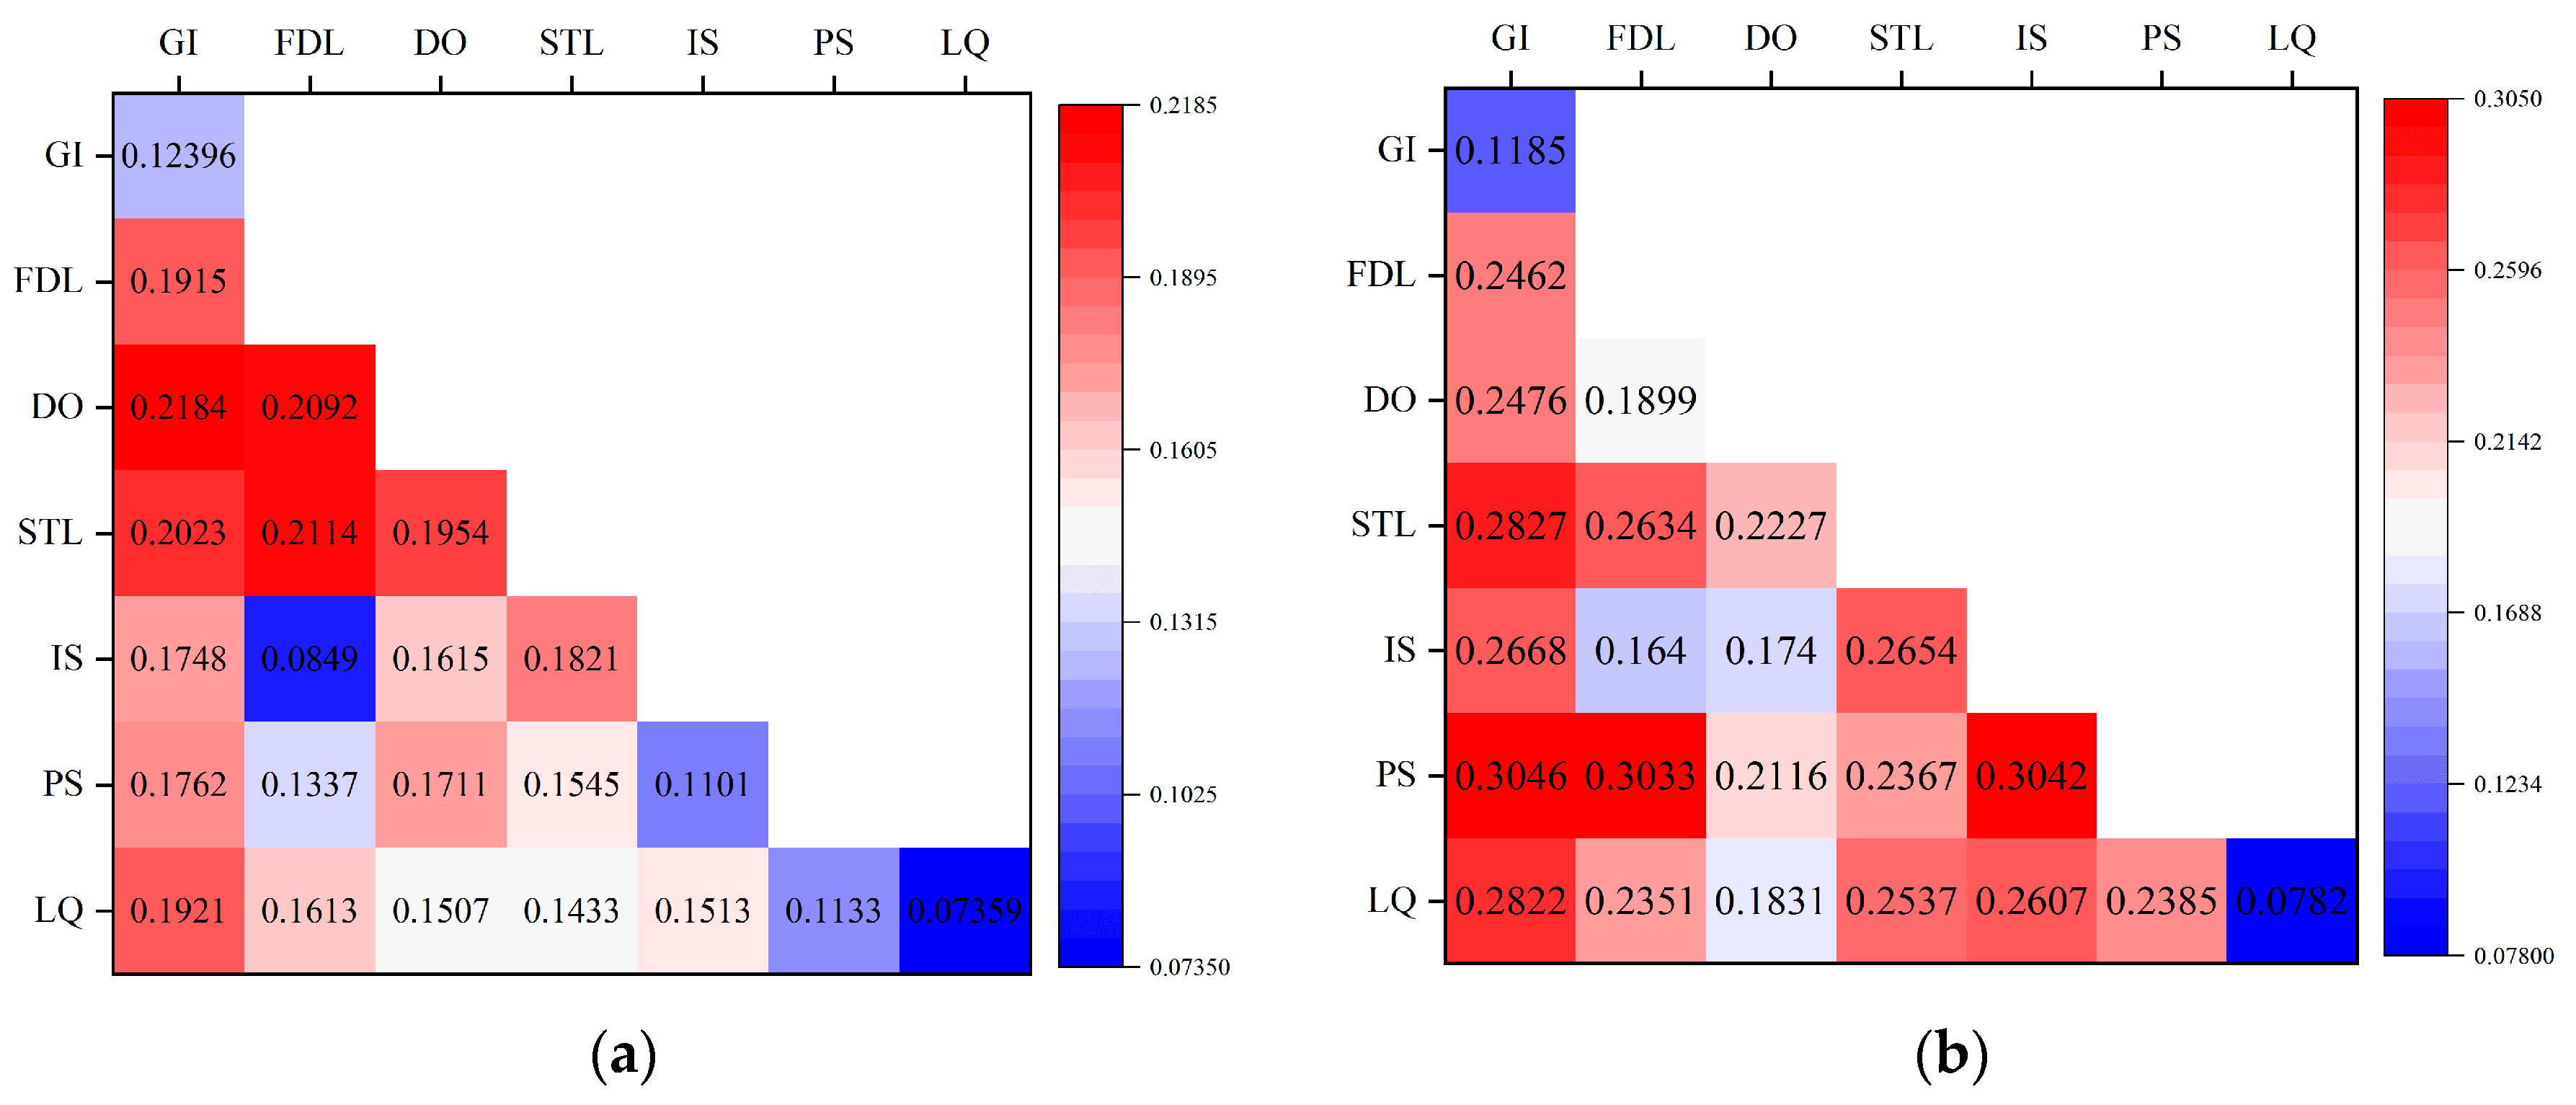
4.4.2. Exogenous Driving Factors of the Spatiotemporal Evolution of Carbon Emission Efficiency in National High-Tech Zones

The descriptive statistics of exogenous driving factors are shown in Table 6. Table 7 shows the determinant power, interaction strength, and significant levels of exogenous driving factors for national high-tech zones’ carbon emission efficiency. Except for a few indicators in the northeastern and western areas, the majority of exogenous driving factors have passed the 10% significance level test, suggesting that they have a considerable determining impact on the spatiotemporal development of carbon emission efficiency among high-technology zones.
Figure 7a shows that the key variables determining spatiotemporal variations of carbon emission efficiency within high-tech zones are fluctuations in government intervention and the level of openness. Secondary factors include the science and technology level and labor quality. Government intervention has the highest impact. The environmental performance of high-tech zones is significantly influenced by government interventions such as the implementation of environmental policies, energy efficiency standards, and emission limits. The government’s environmental rules, energy efficiency standards, and emission objectives all have a direct influence on the high-tech zone’s environmental performance. Furthermore, by giving R&D subsidies, tax breaks, and financial assistance, the government encourages businesses to innovate and adopt low-carbon technology, therefore increasing carbon emission efficiency. Regions that exhibit a significant level of openness tend to access and introduce advanced international environmental technologies and management experiences, which helps enterprises improve efficiency, optimize energy use, and reduce carbon intensity. Exogenous influences vary significantly throughout the four primary areas, with government involvement and technical level being the most important determinants among the eastern and northeastern sectors. The degree of openness and financial development are the most important characteristics among the central and western regions.
Figure 7b illustrates the evolving spatiotemporal dynamics of carbon emission efficiency in national high-tech zones under the influence of exogenous driving factors. Over time, the primary external driving factors have gradually shifted from labor quality and science and technology level to government intervention, while the determinant power of other exogenous factors has weakened to varying degrees. From 2009 to 2016, labor quality and science and technology level showed an alternating downward trend, and after 2017, government intervention replaced them as the primary external factors. The impact of financial development level and population structure is lower than that of the degree of openness, and the determinant power of industrial structure remains at a relatively low level with minor fluctuations.
Figure 8 depicts the interaction detection findings of exogenous driving factors for the national high-tech zones as a whole and for specific regions. The temporal development of carbon emission efficiency is the consequence of the combined impact of several external driving factors, since the interaction effect between any two driving variables is larger than that of a single factor. All interaction types include either non-linear or dual-factor amplification. For high-tech zones in general, the relationship between government intervention and the degree of openness has the greatest influence, followed by the interaction between financial development level and scientific and technological advancement. Population structure is key in propelling the eastern region, with the interaction q values exceeding 0.3 for government intervention, financial development level, and industrial structure. The interaction between government intervention and other driving variables in the northeastern area has a q value greater than 0.6, suggesting that government intervention is the dominant driving element for the spatiotemporal development of carbon emission efficiency. The interaction of financial development levels in the central and western regions with other influencing factors has a significant impact on the spatiotemporal progression of carbon emission efficiency within these regions, highlighting financial development’s central role in driving this process.

4.4.3. Robustness Test

The Quadratic Assignment Procedure (QAP) is a non-parametric technique that does not depend on assumptions about data distribution and is capable of effectively addressing endogeneity and multicollinearity in econometric models [42]. In practical research, there may be bidirectional causality between the dependent and independent variables, leading to endogeneity issues in the model. To address this problem, the QAP approach was used to carry out robustness assessments on the numerous parameters that influence the spatial development of carbon emission efficiency. QAP analysis evaluates the significance of network data by random permutation and comparing the original correlation coefficients with the random distribution, as shown in Table 8. With 1000 random permutations, there is less than a 0.05 chance that the correlation coefficients will be equal to or greater than those obtained from random permutations. This indicates the statistical significance of the actual correlation coefficients. Discrepancies in economic development levels are the main internal factor driving the spatiotemporal progression of carbon emission efficiency within national high-tech zones. The primary determining factors among the exogenous driving factors are variances in government intervention, followed by disparities in openness and advancements in scientific and technological progress. QAP analysis further corroborates the findings of this paper, indicating that the research conclusions are robust.

5. Discussion

Chinese industrial parks are categorized into Economic and Technological Development Zones and High-Tech Zones. Scholarly research on carbon emissions within these industrial parks predominantly focuses on either Economic and Technological Development Zones or specific case studies of National High-Tech Zones. Examining National High-Tech Zones across various locations, both collectively and individually by area, enables a thorough assessment of spatial variances and evolving trends in carbon emission levels. Past investigations into the efficiency of carbon emissions have predominantly employed the non-radial Super-SBM model featuring undesired outputs, paying little attention to input–output orientation issues. Given that the carbon emission levels of National High-Tech Zones are already better than the national average, this paper adopts an unexpected output Super-SBM model under output-oriented and non-increasing situations. This method reflects the reality that increasing inputs does not proportionally increase outputs, which is more in line with the characteristics of carbon emissions in High-Tech Zones, that is, improving carbon emission efficiency cannot solely be achieved by increasing inputs.
This study has the following limitations, which we hope to address in future research. First, although this study utilized various data sources and methods, it is constrained by data availability, which only extends to 2021. Future updates and supplementary data could enhance and refine the research findings. Second, when calculating the carbon emission efficiency of national high-tech zones, this study assumed that the emissions were primarily from the use of non-renewable energy sources, without accounting for carbon emissions from land use and the carbon sequestration effects of land cover [43]. There are numerous factors influencing carbon emission efficiency, and while this study analyzed several macro-level factors based on previous research, it did not include some potential micro-level factors. For instance, the carbon reduction effects of using green shared transportation within the parks [44] were not considered. These omissions could affect the accuracy of the results. Lastly, this study focused on dividing China’s national high-tech zones into four regions to examine carbon emission efficiency but did not delve into the dominant industries within each region or how the heterogeneity of these leading industries might affect the carbon emission efficiency of the respective zones. This could impact the accuracy and effectiveness of the policy recommendations.

6. Conclusions

Based on the output-oriented, non-increasing returns to scale undesirable Super-SBM model, this research assesses the carbon emissions efficiency of national high-tech zones between 2008 and 2021. This research uses the Dagum Gini coefficient and kernel density estimation methodologies to investigate geographical disparities and dynamic patterns in development that affect carbon emission efficiency within national high-tech zones. As per the study’s findings, carbon emission efficiency levels in national high-tech zones as a whole and throughout the four main regions are trending downward, with a geographical distribution tendency that clearly favors eastern regions over western ones. The emissions of carbon efficiency evaluation findings show that over 40% of high-tech zones throughout the eastern region have achieved excellent status. In contrast, carbon emission efficiency levels within the central and western regions vary greatly, with more than 70% of high-tech zones classified as “moderate” or “poor”. The northeastern region has a larger percentage of “poor” ratings, suggesting significant space for improvement in carbon emission effectiveness. Additionally, there are notable regional variations in the efficiency of carbon emissions among national high-tech zones, with increasing internal variations within the four major regions. The discrepancies within the northeastern region are significantly greater compared to other regions. While regional differences are reducing, they remain the principal drivers of geographical discrepancies in carbon emission efficiency, most notably between the eastern, northeastern, and western regions. Furthermore, there is a noticeable gradient effect in carbon emission efficiency between national high-tech zones and all four major regions, with rising absolute discrepancies. The high-tech zone as a whole, as well as the four primary areas, exhibit a pattern of left-skewed distributions and polarization tendencies. When considering endogenous factors, economic development level, labor input, and capital input emerge as dominant factors influencing the spatial evolution of carbon emission efficiency. The joint impact of economic development and land resource usage is the most major interaction-driven factor. Throughout the sample period, differences in economic development level had a notably stronger impact compared to other intrinsic factors, with the determinant power of capital input and labor input also showing significant increases. On the other hand, from the perspective of exogenous factors, differences in government intervention are the primary driving factors among exogenous factors. The interaction between factors such as openness and technological level enhances the explaining ability of a single component. The correlation between variations in external variables and the regional distribution of carbon emission efficiency in the central area is modest. Its primary external driving factors gradually shifted from the levels of science and technology and labor quality to government intervention, while the influence of other external factors weakened to different extents.

Author Contributions

Conceptualization, C.L. and J.H.; methodology, C.L.; validation, J.H.; investigation, C.L.; resources, C.L.; data curation, C.L.; writing—original draft preparation, C.L.; writing—review and editing, C.L.; supervision, J.H. All authors have read and agreed to the published version of the manuscript.

Funding

This study was supported by the National Social Science Foundation of China (22BTJ001) and the Doctoral Research Innovation Project of Lanzhou University of Finance and Economics (Grant No. 2021 D15).

Institutional Review Board Statement

Not applicable.

Informed Consent Statement

Not applicable.

Data Availability Statement

The raw data supporting the conclusions of this article will be made available by the authors on request.

Conflicts of Interest

The authors declare no conflicts of interest.

Appendix A

Table A1. The average carbon emission efficiency scores and carbon emission efficiency ratings of national high-tech zones.
Name of the National High-Tech ZoneRegionProvinceAverage
Carbon
Emission
Efficiency
Score
Carbon
Emission
Efficiency Rating
Shanghai Zhangjiang National High-Tech ZonesEasternShanghai1.1926Excellent
Guangzhou National High-Tech ZonesEasternGuangzhou1.0835Excellent
Xiaoshan Linjiang National High-Tech ZonesEasternZhejiang1.0796Excellent
Zhongguancun Science Park National High-Tech ZonesEasternBeijing1.0457Excellent
Suzhou National High-Tech ZonesEasternJiangsu1.0314Excellent
Linyi National High-Tech ZonesEasternShandong1.0297Excellent
Putian National High-Tech ZonesEasternFujian1.0286Excellent
Shenzhen National High-Tech ZonesEasternGuangdong1.0237Excellent
Maoming National High-Tech ZonesEasternGuangdong1.0155Excellent
Qingdao National High-Tech ZonesEasternShandong1.0145Excellent
Nanjing National High-Tech ZonesEasternJiangsu1.0048Excellent
Suzhou Industrial Park National High-Tech ZonesEasternJiangsu1.0032Excellent
Foshan National High-Tech ZonesEasternGuangdong1.0005Excellent
Weihai Torch National High-Tech ZonesEasternShandong0.9923Good
Kunshan National High-Tech ZonesEasternJiangsu0.9887Good
Changshu National High-Tech ZonesEasternJiangsu0.9824Good
Dongguan Songshan Lake National High-Tech ZonesEasternGuangdong0.9804Good
Sanming National High-Tech ZonesEasternFujian0.9803Good
Wuxi National High-Tech ZonesEasternJiangsu0.9730Good
Quanzhou National High-Tech ZonesEasternFujian0.9542Good
Jiangyin National High-Tech ZonesEasternJiangsu0.9535Good
Xuzhou National High-Tech ZonesEasternJiangsu0.9527Good
Nantong National High-Tech ZonesEasternJiangsu0.9357Good
Tianjin Binhai National High-Tech ZonesEasternTianjin0.9304Good
Taizhou Medical National High-Tech ZonesEasternJiangsu0.9282Good
Yellow River Delta Agricultural National High-Tech ZonesEasternShandong0.9281Good
Zhanjiang National High-Tech ZonesEasternGuangdong0.9268Good
Yangzhou National High-Tech ZonesEasternJiangsu0.8868Moderate
Fuzhou National High-Tech ZonesEasternFujian0.8842Moderate
Yancheng National High-Tech ZonesEasternJiangsu0.8762Moderate
Jining National High-Tech ZonesEasternShandong0.8735Moderate
Ningbo National High-Tech ZonesEasternZhejiang0.8716Moderate
Yantai National High-Tech ZonesEasternShandong0.8687Moderate
Hangzhou National High-Tech ZonesEasternZhejiang0.8681Moderate
Zhangzhou National High-Tech ZonesEasternFujian0.8641Moderate
Wenzhou National High-Tech ZonesEasternZhejiang0.8640Moderate
Zhongshan Torch National High-Tech ZonesEasternGuangdong0.8504Moderate
Jinan National High-Tech ZonesEasternShandong0.8457Moderate
Weifang National High-Tech ZonesEasternShandong0.8404Moderate
Xiamen National High-Tech ZonesEasternFujian0.8243Moderate
Huizhou Zhongkai National High-Tech ZonesEasternGuangdong0.8214Moderate
Laiwu National High-Tech ZonesEasternShandong0.8101Moderate
Zibo National High-Tech ZonesEasternShandong0.7705Moderate
Huai’an National High-Tech ZonesEasternJiangsu0.7568Moderate
Baoding National High-Tech ZonesEasternHebei0.7560Moderate
Zhaoqing National High-Tech ZonesEasternGuangdong0.7558Moderate
Changzhou National High-Tech ZonesEasternJiangsu0.7513Moderate
Shaoxing National High-Tech ZonesEasternZhejiang0.7452Moderate
Longyan National High-Tech ZonesEasternFujian0.7402Moderate
Tai’an National High-Tech ZonesEasternShandong0.7304Moderate
Zhenjiang National High-Tech ZonesEasternJiangsu0.7267Moderate
Shijiazhuang National High-Tech ZonesEasternInner Mongolia0.7192Moderate
Tangshan National High-Tech ZonesEasternInner Mongolia0.7135Moderate
Yuancheng National High-Tech ZonesEasternInner Mongolia0.7133Moderate
Wujin National High-Tech ZonesEasternJiangsu0.7010Moderate
Suqian National High-Tech ZonesEasternJiangsu0.6975Poor
Jiangmen National High-Tech ZonesEasternGuangdong0.6956Poor
Dezhou National High-Tech ZonesEasternShandong0.6955Poor
Lianyungang National High-Tech ZonesEasternJiangsu0.6950Poor
Yanjiao National High-Tech ZonesEasternHebei0.6938Poor
Zhuhai National High-Tech ZonesEasternGuangdong0.6737Poor
Jiaxing Xiuzhou National High-Tech ZonesEasternZhejiang0.6718Poor
Zaozhuang National High-Tech ZonesEasternShandong0.6698Poor
Huzhou Mogan MountainEasternZhejiang0.6277Poor
Shantou National High-Tech ZonesEasternGuangdong0.6076Poor
Shanghai Zizhu National High-Tech ZonesEasternShanghai0.6062Poor
Chengde National High-Tech ZonesEasternHebei0.6029Poor
Quzhou National High-Tech ZonesEasternZhejiang0.5868Poor
Haikou National High-Tech ZonesEasternHainan0.5797Poor
Qingyuan National High-Tech ZonesEasternGuangdong0.5528Poor
Changchun National High-Tech ZonesNortheasternJilin1.1072Excellent
Harbin National High-Tech ZonesNortheasternHeilongjiang0.9792Good
Daqing National High-Tech ZonesNortheasternHeilongjiang0.9247Good
Dalian National High-Tech ZonesNortheasternLiaoning0.8725Moderate
Shenyang National High-Tech ZonesNortheasternLiaoning0.8705Moderate
Changchun Jingyue National High-Tech ZonesNortheasternJilin0.8543Moderate
Anshan National High-Tech ZonesNortheasternLiaoning0.7992Moderate
Tonghua Medical National High-Tech ZonesNortheasternJilin0.7425Moderate
Jilin National High-Tech ZonesNortheasternJilin0.7331Moderate
Yanji National High-Tech ZonesNortheasternJilin0.7070Moderate
Yingkou National High-Tech ZonesNortheasternLiaoning0.6583Poor
Qiqihar National High-Tech ZonesNortheasternHeilongjiang0.6456Poor
Liaoyang National High-Tech ZonesNortheasternLiaoning0.6290Poor
Jinzhou National High-Tech ZonesNortheasternLiaoning0.5920Poor
Benxi National High-Tech ZonesNortheasternLiaoning0.5567Poor
Fuxin National High-Tech ZonesNortheasternLiaoning0.5396Poor
Yichun Fengcheng National High-Tech ZonesCentralJiangxi1.0192Excellent
Xiaogan National High-Tech ZonesCentralHubei1.0158Excellent
Changsha National High-Tech ZonesCentralHunan1.0102Excellent
Yiyang National High-Tech ZonesCentralHunan0.9938Good
Yingtan National High-Tech ZonesCentralJiangxi0.9821Good
Xiangyang National High-Tech ZonesCentralHubei0.9632Good
Changde National High-Tech ZonesCentralHunan0.9597Good
Ji’an National High-Tech ZonesCentralJiangxi0.9563Good
Zhengzhou National High-Tech ZonesCentralHenan0.9404Good
Hefei National High-Tech ZonesCentralAnhui0.9292Good
Jingdezhen National High-Tech ZonesCentralJiangxi0.9287Good
Wuhan National High-Tech ZonesCentralHubei0.9106Good
Huainan National High-Tech ZonesCentralAnhui0.5434Poor
Changzhi National High-Tech ZonesCentralShanxi0.5822Poor
Huaihua National High-Tech ZonesCentralHunan0.6386Poor
Huangshi Daye Lake National High-Tech ZonesCentralHubei0.6445Poor
Ma’anshan Cihu National High-Tech ZonesCentralAnhui0.6505Poor
Benbu National High-Tech ZonesCentralAnhui0.6524Poor
Jingzhou National High-Tech ZonesCentralHubei0.6548Poor
Xinyu National High-Tech ZonesCentralJiangxi0.6576Poor
Anyang National High-Tech ZonesCentralHenan0.6596Poor
Xiangtan National High-Tech ZonesCentralHunan0.6722Poor
Pingdingshan National High-Tech ZonesCentralHenan0.6736Poor
Taiyuan National High-Tech ZonesCentralShanxi0.7040Moderate
Wuhu National High-Tech ZonesCentralAnhui0.7367Moderate
Chenzhou National High-Tech ZonesCentralHunan0.7591Moderate
Fuzhou National High-Tech ZonesCentralJiangxi0.7611Moderate
Hengyang National High-Tech ZonesCentralHunan0.7679Moderate
Huanggang National High-Tech ZonesCentralHubei0.7686Moderate
Zhuzhou National High-Tech ZonesCentralHunan0.7732Moderate
Luoyang National High-Tech ZonesCentralHenan0.7758Moderate
Yichang National High-Tech ZonesCentralHubei0.7791Moderate
Jingmen National High-Tech ZonesCentralHubei0.7814Moderate
Suizhou National High-Tech ZonesCentralHubei0.7975Moderate
Nanyang National High-Tech ZonesCentralHenan0.7995Moderate
Xianning National High-Tech ZonesCentralHubei0.8033Moderate
Qianjiang National High-Tech ZonesCentralHubei0.8071Moderate
Tongling Shizishan National High-Tech ZonesCentralAnhui0.8196Moderate
Xiantao National High-Tech ZonesCentralHubei0.8220Moderate
Jiaozuo National High-Tech ZonesCentralHenan0.8224Moderate
Xinxiang National High-Tech ZonesCentralHenan0.8444Moderate
Jiujiang GongqingchengCentralJiangxi0.8526Moderate
Nanchang National High-Tech ZonesCentralJiangxi0.8561Moderate
Ganzhou National High-Tech ZonesCentralJiangxi0.8753Moderate
Beihai National High-Tech ZonesWesternGuangxi1.0532Excellent
Bishan National High-Tech ZonesWesternChongqing1.0475Excellent
Yuxi National High-Tech ZonesWesternYunnan1.0473Excellent
Chengdu National High-Tech ZonesWesternSichuan1.0216Excellent
Chuxiong National High-Tech ZonesWesternYunnan1.0143Excellent
Yongchuan National High-Tech ZonesWesternChongqing1.0038Excellent
Kunming National High-Tech ZonesWesternYunnan0.9821Good
Chongqing National High-Tech ZonesWesternChongqing0.9702Good
Baotou National High-Tech ZonesWesternInner Mongolia0.9505Good
Neijiang National High-Tech ZonesWesternSichuan0.9165Good
Xinjiang Production and Construction Corps Shihezi National High-Tech ZonesWesternXinjiang0.9072Good
Yangling Agricultural National High-Tech ZonesWesternShanxi0.7071Moderate
Nanning National High-Tech ZonesWesternGuangxi0.7073Moderate
Ürümqi National High-Tech ZonesWesternXinjiang0.7242Moderate
Mianyang National High-Tech ZonesWesternSichuan0.7263Moderate
Guiyang National High-Tech ZonesWesternGuizhou0.7309Moderate
Zigong National High-Tech ZonesWesternSichuan0.7363Moderate
Yulin National High-Tech ZonesWesternShanxi0.7525Moderate
Ankang National High-Tech ZonesWesternShanxi0.7526Moderate
Liuzhou National High-Tech ZonesWesternGuangxi0.7670Moderate
Baoji National High-Tech ZonesWesternShanxi0.7805Moderate
Panzhihua Vanadium & TitaniumWesternSichuan0.7917Moderate
Changji National High-Tech ZonesWesternXinjiang0.8015Moderate
Guilin National High-Tech ZonesWesternGuangxi0.8019Moderate
Weinan National High-Tech ZonesWesternShanxi0.8134Moderate
Rongchang National High-Tech ZonesWesternChongqing0.8167Moderate
Deyang National High-Tech ZonesWesternSichuan0.8562Moderate
Xianyang National High-Tech ZonesWesternShanxi0.8565Moderate
Ordos National High-Tech ZonesWesternInner Mongolia0.8782Moderate
Hohhot Jinshan National High-Tech ZonesWesternInner Mongolia0.8824Moderate
Xi’an National High-Tech ZonesWesternShanxi0.8963Moderate
Yinchuan National High-Tech ZonesWesternNingxia0.6811Poor
Qinghai National High-Tech ZonesWesternQinghai0.6674Poor
Luzhou National High-Tech ZonesWesternSichuan0.6524Poor
Leshan National High-Tech ZonesWesternSichuan0.6018Poor
Anshun National High-Tech ZonesWesternGuizhou0.5833Poor
Lanzhou National High-Tech ZonesWesternGansu0.5638Poor
Shizuishan National High-Tech ZonesWesternNingxia0.5472Poor
Baiyin National High-Tech ZonesWesternGansu0.5018Poor

References

  1. Zhou, L. Research on Green Development of National High-Tech Zones under the “Dual Carbon” Goal. China Environ. Manag. 2021, 13, 7–12. [Google Scholar] [CrossRef]
  2. Ma, J. Opinions of the State Council on Promoting High-Quality Development of National High-Tech Industrial Development Zones. Science and Technology, China Government Network. Available online: https://www.gov.cn/zhengce/content/2020-07/17/content_5527765.htm (accessed on 21 April 2024).
  3. Ma, J. Opinions of the General Office of the State Council on Promoting the Reform and Innovative Development of Development Zones. Macroeconomics, China Government Network. Available online: https://www.gov.cn/zhengce/content/2017-02/06/content_5165788.htm (accessed on 21 April 2024).
  4. Kaya, Y.; Yokobori, K. Environment, Energy and Economy: Strategies for Sustainability; Aspen Institute: Washington, DC, USA; Brookings Institution: Washington, DC, USA, 1998; pp. 52–58. [Google Scholar]
  5. Kuntsi-Reunanen, E. The Decrease of CO2 Emission Intensity Is Decarbonization at National and Global Levels. Energy Policy 2005, 33, 975–978. [Google Scholar] [CrossRef]
  6. Mielnik, O.; Goldemberg, J. Communication The Evolution of the “Carbonization Index” in Developing Countries. Energy Policy 1999, 27, 307–308. [Google Scholar] [CrossRef]
  7. Ang, B. Is the Energy Intensity a Less Useful Indicator than the Carbon Factor in the Study of Climate Change? Energy Policy 1999, 27, 943–946. [Google Scholar] [CrossRef]
  8. Herrala, R.; Goel, R.K. Global CO2 Efficiency: Country-Wise Estimates Using a Stochastic Cost Frontier. Energy Policy 2012, 45, 762–770. [Google Scholar] [CrossRef]
  9. Jin, T.; Kim, J. A Comparative Study of Energy and Carbon Efficiency for Emerging Countries Using Panel Stochastic Frontier Analysis. Sci. Rep. 2019, 9, 6647. [Google Scholar] [CrossRef] [PubMed]
  10. Filippini, M.; Hunt, L.C. Energy Demand and Energy Efficiency in the OECD Countries: A Stochastic Demand Frontier Ap proach. Energy J. 2011, 32, 59–80. [Google Scholar] [CrossRef]
  11. Park, Y.S.; Lim, S.H.; Egilmez, G.; Szmerekovsky, J. Environmental Efficiency Assessment of U.S. Transport Sector: A Slack-Based Data Envelopment Analysis Approach. Transp. Res. Part D Transp. Environ. 2018, 61, 152–164. [Google Scholar] [CrossRef]
  12. Hailu, A.; Veeman, T.S. Non-parametric Productivity Analysis with Undesirable Outputs: An Application to the Canadian Pulp and Paper Industry. Am. J. Agri. Econ. 2001, 83, 605–616. [Google Scholar] [CrossRef]
  13. Hailu, A.; Veeman, T.S. Environmentally Sensitive Productivity Analysis of the Canadian Pulp and Paper Industry, 1959-1994: An Input Distance Function Approach. J. Environ. Econ. Manag. 2000, 40, 251–274. [Google Scholar] [CrossRef]
  14. Zurano-Cervelló, P.; Pozo, C.; Mateo-Sanz, J.M.; Jiménez, L.; Guillén-Gosálbez, G. Sustainability Efficiency Assessment of the Electricity Mix of the 28 EU Member Countries Combining Data Envelopment Analysis and Optimized Projections. Energy Policy 2019, 134, 110921. [Google Scholar] [CrossRef]
  15. Ikram, M.; Rafique, M.Z.; Mohammed, K.S.; Waheed, R.; Ferraz, D. Efficient Resource Utilization of the Electricity Distribution Sector Using Nonparametric Data Envelopment Analysis and Influential Factors. Util. Policy 2023, 82, 101571. [Google Scholar] [CrossRef]
  16. Honma, S.; Hu, J.-L. Industry-Level Total-Factor Energy Efficiency in Developed Countries: A Japan-Centered Analysis. Appl. Energy 2014, 119, 67–78. [Google Scholar] [CrossRef]
  17. Iqbal, W.; Altalbe, A.; Fatima, A.; Ali, A.; Hou, Y. A DEA Approach for Assessing the Energy, Environmental and Economic Performance of Top 20 Industrial Countries. Processes 2019, 7, 902. [Google Scholar] [CrossRef]
  18. Produção, G.; Camioto, F.d.C.; Pulita, A. Efficiency Evaluation of Sustainable Development in BRICS and G7 Countries: A Data Envelopment Analysis Approach. Gestão Produção 2022, 29, e022. [Google Scholar] [CrossRef]
  19. Gao, P.; Yue, S.; Chen, H. Carbon Emission Efficiency of China’s Industry Sectors: From the Perspective of Embodied Carbon Emissions. J. Clean. Prod. 2021, 283, 124655. [Google Scholar] [CrossRef]
  20. Khallaf, S.M.; Shehata, M.; Qutp, S.M.; Rashed, H.M. Policies of Sustainable Economic Zones under the Fourth Industrial Rev olution (4IR): A Case Study on Suez Canal Area Using Fuzzy Geographic Information System (Fuzzy GIS). EREM 2022, 78, 97–120. [Google Scholar] [CrossRef]
  21. Haarstad, H.; Oseland, S.E. Historicizing Urban Sustainability: The Shifting Ideals Behind Forus Industrial Park, Norway. Int. J. Urban Reg. Res. 2017, 41, 838–854. [Google Scholar] [CrossRef]
  22. Liu, W.; Tian, J.; Chen, L. Greenhouse Gas Emissions in China’s Eco-Industrial Parks: A Case Study of the Beijing Economic Technological Development Area. J. Clean. Prod. 2014, 66, 384–391. [Google Scholar] [CrossRef]
  23. Shi, H.; Chertow, M.; Song, Y. Developing Country Experience with Eco-Industrial Parks: A Case Study of the Tianjin Eco nomic-Technological Development Area in China. J. Clean. Prod. 2010, 18, 191–199. [Google Scholar] [CrossRef]
  24. Zhang, J.; Liu, J.; Dong, L.; Qiao, Q. CO2 Emissions Inventory and Its Uncertainty Analysis of China’s Industrial Parks: A Case Study of the Maanshan Economic and Technological Development Area. Int. J. Environ. Res. Public Health 2022, 19, 11684. [Google Scholar] [CrossRef]
  25. Yu, X. An Assessment of the Green Development Efficiency of Industrial Parks in China: Based on Non-Desired Output and Non-Radial DEA Model. Struct. Chang. Econ. Dyn. 2023, 66, 81–88. [Google Scholar] [CrossRef]
  26. Ozturk, I.; Acaravci, A. The Long-Run and Causal Analysis of Energy, Growth, Openness and Financial Development on Carbon Emissions in Turkey. Energy Econ. 2013, 36, 262–267. [Google Scholar] [CrossRef]
  27. Khan, S.A.R.; Sajid, M.J.; Zhang, Y. Nexuses Between Technological Innovations, Macro-Environmental and Economic Factors. In Emerging Green Theories to Achieve Sustainable Development Goals; Industrial Ecology; Springer Nature Singapore: Singapore, 2023; pp. 87–98. ISBN 978-981-9963-83-6. [Google Scholar]
  28. Kumar, D. The Effects of Technological Innovation and Economic Growth on Greenhouse Gas Emission in BRICs. 2023. Available online: https://www.researchgate.net/publication/377625499_The_Effects_of_Technological_Innovation_and_Economic_Growth_on_Greenhouse_Gas_Emission_in_BRICs (accessed on 4 July 2024).
  29. Singh, G.; Singh, P.; Lal, P. Dynamic Approach to Study Relationship among Carbon Dioxide Emissions, Urbanization, and Economic Growth in BRICS Countries. J. Knowl. Econ. 2024, 1–18. [Google Scholar] [CrossRef]
  30. Chien, F.; Huang, L.; Zhao, W. The Influence of Sustainable Energy Demands on Energy Efficiency: Evidence from China. J. Innov. Knowl. 2023, 8, 100298. [Google Scholar] [CrossRef]
  31. Abbas, Q.; HongXing, Y.; Ramzan, M.; Fatima, S. BRICS and the Climate Challenge: Navigating the Role of Factor Productivity and Institutional Quality in CO2 Emissions. Environ. Sci. Pollut. Res. 2023, 31, 4348–4364. [Google Scholar] [CrossRef] [PubMed]
  32. While, A.; Jonas, A.E.G.; Gibbs, D. From Sustainable Development to Carbon Control: Eco-State Restructuring and the Politics of Urban and Regional Development. Trans. Inst. Br. Geogr. 2010, 35, 76–93. [Google Scholar] [CrossRef]
  33. Udeagha, M.; Muchapondwa, E. Green Finance, Fintech, and Environmental Sustainability: Fresh Policy Insights from the BRICS Nations. Int. J. Sustain. Dev. World Ecol. 2023, 30, 633–649. [Google Scholar] [CrossRef]
  34. Adebayo, T.; Akadiri, S.; Haouas, I.; Rjoub, H. A Time-Varying Analysis between Financial Development and Carbon Emis sions: Evidence from the MINT Countries. Energy Environ. 2022, 34, 1207–1227. [Google Scholar] [CrossRef]
  35. Jamel, L.; Maktouf, S. The Nexus between Economic Growth, Financial Development, Trade Openness, and CO2 Emissions in European Countries. Cogent Econ. Financ. 2017, 5, 1341456. [Google Scholar] [CrossRef]
  36. Kongkuah, M.; Yao, H.; Yilanci, V. The Relationship between Energy Consumption, Economic Growth, and CO2 Emissions in China: The Role of Urbanisation and International Trade. Environ. Dev. Sustain. 2022, 24, 4684–4708. [Google Scholar] [CrossRef]
  37. Camioto, F.d.C.; Mariano, E.; Moralles, H.; Rebelatto, D. Energy Efficiency Analysis of G7 and BRICS Considering Total-Factor Structure. J. Clean. Prod. 2016, 122, 67–77. [Google Scholar] [CrossRef]
  38. Tone, K. A Slacks-Based Measure of Efficiency in Data Envelopment Analysis. Eur. J. Oper. Res. 2001, 130, 498–509. [Google Scholar] [CrossRef]
  39. Dagum, C. A New Approach to the Decomposition of the Gini Income Inequality Ratio. Empir. Econ. 1998, 22, 515–531. [Google Scholar] [CrossRef]
  40. Wang, J.; Hu, Y. Environmental Health Risk Detection with GeogDetector. Environ. Model. Softw. 2012, 33, 114–115. [Google Scholar] [CrossRef]
  41. Wang, J.; Li, X.; Christakos, G.; Liao, Y.; Zhang, T.; Gu, X.; Zheng, X. Geographical Detectors-Based Health Risk Assessment and Its Application in the Neural Tube Defects Study of the Heshun Region, China. Int. J. Geogr. Inf. Sci. 2010, 24, 107–127. [Google Scholar] [CrossRef]
  42. The Quadratic Assignment Procedure (QAP). Available online: https://www.researchgate.net/publication/4921666_The_Quadratic_Assignment_Procedure_QAP (accessed on 25 May 2024).
  43. Ou, Y.; Bao, Z.; Ng, S.T.; Song, W.; Chen, K. Land-Use Carbon Emissions and Built Environment Characteristics: A City-Level Quantitative Analysis in Emerging Economies. Land Use Policy 2024, 137, 107019. [Google Scholar] [CrossRef]
  44. Ou, Y.; Bao, Z.; Thomas Ng, S.; Song, W. Estimating the Effect of Air Quality on Bike-Sharing Usage in Shanghai, China: An Instrumental Variable Approach. Travel Behav. Soc. 2023, 33, 100626. [Google Scholar] [CrossRef]
Figure 1. National high-tech zones’ average carbon emission efficiency: overall and in four major regions.
Sustainability 16 06380 g001
Figure 2. Geographical distribution and carbon emission efficiency ratings of national high-tech zones.
Sustainability 16 06380 g002
Figure 3. (a) Overall and within-region Gini coefficients, (b) between-region Gini coefficients, and (c) spatial variations and contribution rates of carbon emission efficiency in national high-tech zones.
Sustainability 16 06380 g003
Figure 4. Dynamic evolution of carbon emission efficiency within national high-tech zones: (a) overall, (b) eastern, (c) northeastern, (d) central, and (e) western.
Sustainability 16 06380 g004aSustainability 16 06380 g004b
Figure 5. Determinant power of endogenous driving factors on the spatiotemporal evolution of carbon emission efficiency in national high-tech zones: (a) overall national high-tech zones and four major regions and (b) annual evolution process.
Sustainability 16 06380 g005
Figure 6. Interaction detection results of endogenous driving factors: (a) overall, (b) eastern, (c) northeastern, (d) central, and (e) western.
Sustainability 16 06380 g006aSustainability 16 06380 g006b
Figure 7. Determinant power of exogenous driving factors on the spatiotemporal evolution of carbon emission efficiency in national high-tech zones: (a) overall national high-tech zones and four major regions and (b) annual evolution process.
Sustainability 16 06380 g007
Figure 8. Interaction detection results of exogenous driving factors: (a) overall, (b) eastern, (c) northeastern, (d) central, and (e) western.
Sustainability 16 06380 g008aSustainability 16 06380 g008b
Table 1. Carbon oxidation coefficients and carbon emission coefficients for various types of energy fuels.
Raw CoalCokeCrude OilGasolineKeroseneDieselFuel OilNatural GasElectricity
Carbon oxidation coefficient0.710.971.431.471.471.461.4313.31.23
Carbon emission coefficient0.750.110.590.550.340.590.620.452.21
Table 2. Carbon emission efficiency within national high-tech zones using an input output indication system.
MeasureCategoryPrimary IndicatorsSecondary IndicatorsMeanStd DevMinimumMaximum
Carbon
efficiency
InputsCapital consumptionTotal Assets at the End of the Year/Thousand Yuan265,597,125.99866,991,405.101,059,968.0015,657,382,607.00
Labor consumptionEnd-of-Year Employee Count/Person128,491.36221,321.31573.002,900,099.00
Land consumptionPark Area/Square Kilometer136.11146.072.551079.00
Energy consumptionTotal Energy Consumption/Ton1624,095.182,271,379.361435.0321,354,673.60
OutputsDesirable outputsTotal Industrial Output Value/Thousand Yuan13,180,447.2116,034,295.9814,090.40135,568,838.60
Undesirable outputsCarbon Dioxide Emissions/Ton1633.191590.002.1013,040.22
Table 3. Gini coefficients of carbon emission efficiency in national high-tech zones.
YearOverall Gini CoefficientWithin-Region Gini CoefficientWithin-Region ContributionWithin-Region Contribution (%)Between-Region Contribution (%)Transvariation Intensity (%)
EasternNortheasternCentralWesternEastern-NortheasternEastern-CentralEastern-WesternNortheastern-CentralNortheastern-WesternCentral-Western
20080.05760.04150.04730.01650.04270.05180.07500.08400.05920.06900.035019.512961.878918.6082
20090.06520.05210.04740.01590.04160.05790.07690.10330.07170.10000.048718.728363.087718.1840
20100.06580.04240.04890.02400.03990.05390.08630.10150.07950.09470.041219.492362.732817.7748
20110.06170.03930.04910.04790.02840.05460.09100.08610.08000.07300.038721.811254.105524.0833
20120.08320.06910.08740.05780.07010.08070.08870.10350.09320.10320.070524.786240.825234.3887
20130.08960.07740.09360.09680.08010.08840.09370.09200.09970.09530.093227.715720.802251.4821
20140.09270.08420.11310.07880.10040.10320.08690.09840.10310.11170.091728.347914.934756.7173
20150.08970.08180.11870.07140.09820.10460.08070.09570.10360.11320.088328.216914.147257.6359
20160.10330.09820.08310.11500.12850.09230.10870.12210.10180.11600.126528.992511.852759.1548
20170.10590.10770.07750.10600.14520.09590.10930.13570.09380.12480.132029.228314.218956.5527
20180.10740.10510.08110.11430.14210.09520.11090.13630.10050.12870.136128.996213.204657.7992
20190.11350.10600.09440.12320.12700.10110.11730.14170.11290.13660.138328.771818.835052.3932
20200.12030.11630.13010.09880.11610.12400.11110.14450.11840.14540.126929.233819.256651.5097
20210.11830.10440.11420.12320.11910.11030.11910.13360.12180.13490.130029.306818.461352.2319
Mean0.09100.08040.08470.07780.09140.08670.09680.11280.09560.11050.092625.938630.596043.4654
Table 4. Overall evolution characteristics of the distribution of carbon emission efficiency in national high-tech zones.
RegionDistribution PositionMain Peak Distribution ShapeDistribution ExtensionNumber of Peaks
OverallShifted leftPeak value increased, width increasedRight skew, extended, and widenedBimodal
EasternSlightly shifted leftPeak value increased, width increasedRight skew, extended, and widenedSingle or bimodal
NortheasternShifted leftPeak value increased, width increasedRight skew, extended, and widenedSingle or bimodal
CentralShifted leftPeak value decreased, width increasedRight skew, extended, and widenedSingle or bimodal
WesternShifted leftPeak value decreased, width increasedRight skew, extended, and widenedSingle or bimodal
Table 5. Determinant power of endogenous driving factors on the spatiotemporal evolution of carbon emission efficiency in national high-tech zones.
RegionDeterminant Power/Significance LevelEDLECLLRCCI
Overallq Statistic0.25950.10660.16690.02160.0852
p-value0.00000.00000.00000.00000.0001
Easternq Statistic0.28470.14960.22650.09410.0949
p-value0.00000.01490.00000.08330.0000
Northeasternq Statistic0.66760.37030.62770.18970.4026
p-value0.00000.00000.00000.00000.0000
Centralq Statistic0.21630.04080.18980.13820.1158
p-value0.03420.00000.00170.00000.0000
Westernq Statistic0.25950.10660.16690.02160.0852
p-value0.00000.00000.03740.03590.0991
EDL, EC, L, LRC, and CI represent economic development level, energy consumption, labor, land resource consumption, and capital input, respectively.
Table 6. Descriptive statistics of exogenous driving factors.
MeanStd DevMinimumMaximum
Government intervention0.15070.05660.04390.5003
Financial development level2.86691.43250.157812.5690
Degree of openness0.02260.02130.00000.2287
Science and technology level0.02620.02100.00070.1627
Industrial structure1.08490.49870.18697.2076
Population structure65.343113.446533.4700100.0000
Labor quality0.14140.07370.00740.6721
Table 7. Determinant power of exogenous driving factors on the spatiotemporal evolution of carbon emission efficiency in national high-tech zones.
RegionDeterminant Power/Significance LevelGIFDLDOSTLISPSLQ
Overallq Statistic0.12400.03440.09960.09260.01800.03690.0736
p-value0.00000.00000.00000.00000.00010.00060.0012
Easternq Statistic0.11850.05260.08580.10840.04370.10840.0782
p-value0.00000.00000.00000.00010.00960.00000.0001
Northeasternq Statistic0.46450.25520.31200.32990.17140.11120.2398
p-value0.00000.00000.00000.00000.00010.27070.0000
Centralq Statistic0.03660.13140.10720.03230.02960.04890.0968
p-value0.04660.00990.39230.04550.47960.93140.0000
Westernq Statistic0.12720.19680.18450.08510.05100.05460.1466
p-value0.01020.00000.12550.00000.92980.32720.0618
GI, FDL, DO, STL, IS, PS, and LQ represent government intervention, financial development level, degree of openness, science and technology level, industrial structure, population structure, and labor quality, respectively.
Table 8. Robustness test results.
EDLECLLRCCIGIFDLDOSTLISPSLQ
p(f(perm) ≥ f(d))0000.002000.011000.02300
p(f(perm) ≤ f(d))1110.998110.989110.97711
Test value (f(d))0.10500.02770.08320.00550.04210.02810.00440.03680.03630.00300.03490.0131
Disclaimer/Publisher’s Note: The statements, opinions and data contained in all publications are solely those of the individual author(s) and contributor(s) and not of MDPI and/or the editor(s). MDPI and/or the editor(s) disclaim responsibility for any injury to people or property resulting from any ideas, methods, instructions or products referred to in the content.

