Article

The Mitigating Efficacy of Multi-Functional Storage Spaces in Alleviating Urban Floods across Diverse Rainfall Scenarios

1
Department of Water Resources Strategy, Institute of Mineral Resources, Chinese Academy of Geological Sciences, Beijing 100037, China
2
China Institute of Water Resources and Hydropower Research, Beijing 100038, China
3
School of Civil Engineering and Transportation, South China University of Technology, Guangzhou 510641, China
4
Guangdong Engineering Technology Research Center of Smart and Ecological River, Shenzhen 518020, China
*
Author to whom correspondence should be addressed.
Sustainability 2024, 16(15), 6417; https://doi.org/10.3390/su16156417
Submission received: 15 May 2024 / Revised: 21 July 2024 / Accepted: 25 July 2024 / Published: 26 July 2024
(This article belongs to the Special Issue Flood Resilience in Urban and Rural Communities)

Abstract

:
With accelerated urbanization and escalating severity and frequency of extreme precipitation events, urban flooding has become increasingly prevalent, posing significant threats to human life and economic well-being. Given the scarcity of land resources, the integration of flood mitigation measures into public spaces, particularly in the form of multi-functional storage spaces (MFSs), emerges as an effective strategy for rainwater retention. To assess the efficacy of MFS, a coupled modeling framework, comprising the Storm Water Management Model (SWMM) and the LISFLOOD-FP hydrodynamic model, was employed in the study. Under rainstorms of varying design characterized by diverse return periods and peak rainfall intensity locations, the study simulated and compared the performance of low-impact-development (LID) strategies, MFS, and a combined approach utilizing both LID and MFS (ALL). The findings indicate that the performance of these strategies significantly varies under diverse rainfall intensity and peak coefficients. Specifically, as the return period increases, the reduction rates of the three projects gradually diminish. For lower return periods (P ≤ 10), the order of reduction effectiveness was LID < MFS < ALL; whereas, for higher return periods (P ≥ 20), the order was LID < ALL < MFS. LID exhibited superior performance under low return periods with an early-peak-rainfall position, and under high return periods with a mid-peak position. MFS and the ALL approach achieved the most significant reduction effects under early-peak-rainfall positions. LID may introduce uncertainties into the performance of MFS during rainfall events with higher return periods and peak coefficients. The outcomes of this research offer valuable technical insights that can inform urban planning strategies and enhance the design of flood mitigation measures in urban environments.

1. Introduction

The escalating pace of global urbanization, coupled with the intensification of extreme precipitation events, has led to a heightened frequency of rainstorm-induced inundation, resulting in substantial casualties and profound socio-economic implications [1,2]. Floods stand as the largest cause of human displacement, responsible for nearly half of all disaster-induced displacements, affecting an estimated 288 million people [3]. Reports suggest a substantial escalation in the relative global flood displacement risk at the end of the 21st century, marking an approximate 350% increase [4]. Urban areas, with a high proportion of impervious surfaces and dense population concentrations, face heightened susceptibility to flooding events compared to other regions, which cause substantial economic losses and even human suffering [5,6,7,8]. This risk is even rising as the global climate changes and the population is gradually concentrated in cities [9,10,11].
Urban flooding, a prevalent yet devastating natural hazard, poses a ubiquitous challenge on a global scale. Traditional approaches have mainly focused on expanding existing drainage networks and constructing deep tunnel drainage systems. These methods aim to enhance urban drainage capacity and flood resilience through infrastructure such as barriers and floodgates [12,13,14]. However, large-scale construction and maintenance of these centralized mechanical storage-based facilities are often costly. Moreover, their environmental sustainability remains controversial. These methods can lead to results such as the loss of natural floodplains, modification of sediment loads, and disconnection of ecosystems from rivers, which do not fully address flooding issues in highly developed urban areas [15]. To achieve environmentally and socially sustainable development, numerous countries have proposed water management strategies, such as water-sensitive urban design (WSUD) [16], best stormwater management practices (BMP) [17], low-impact development (LID) [18], and sustainable drainage systems (SUDs) [19]. These strategies tend to place green infrastructure (GI) in a distributed manner within urban areas, involving the biological means of stormwater treatment to enhance storage and infiltration in landscapes, restoring natural drainage patterns [20,21,22]. As a typical case of small-scale space utilization, LID is confirmed to be effective in controlling surface runoff and flood peak flow [23,24,25], but its reductive effect is obviously insufficient when encountering extreme rainfall conditions [26,27,28,29]. Although suggestions have been made to integrate micro- and meso-scale sustainable urban drainage systems (SUDs) into a broader green infrastructure framework [30,31], the feasibility of promoting flood-prevention-focused measures in densely populated and highly urbanized areas remains uncertain due to zoning restrictions and high cost of land use.
In recent years, flood resilience has gradually become a value aspect in urban flooding prevention [32,33]. Transforming densely populated and highly urbanized areas into resilient cities precents a significant challenge due to the limited availability of flood retention space. Integrating flood mitigation functions into the design of public spaces is considered an effective measure to address this challenge, given the widespread and dispersed distribution of public spaces in urban areas [34,35]. In Japan, rainwater infiltration and detention techniques are being implemented at the regional level, in combination with river channel improvement as integrated measures to prevent flood hazards [36,37]. Water squares in cities such as Rotterdam, Mexico City, and Berlin, serve as typical examples of multi-functional storage spaces, demonstrating their capacity to enhance rainwater utilization in cities [38,39,40]. Projects like the Yangpu Waterfront Rainwater Garden in China, the Kibera Public Space Project in Nairobi, and the Historic Fourth Ward Park in USA have proved the effectiveness and feasibility of the multiple function of public space, including water storage, recreation activities, and landscaping [41,42,43]. These practices of integrating stormwater management facilities into public spaces show the potential for public spaces to improve the flood resilience of cities.
To enhance this integration, recent efforts have emphasized considering the storage capacity of urban public spaces in the urban planning process and have proposed various design concepts and principles. Wang et al. [44,45] investigated the utilization of rainwater resources in urban public spaces from the perspectives of landscape architecture and urban planning. Based on data observation and a literature review, Aliya found that public spaces can prevent and reduce flooding [46]. Liao et al. [47] suggested that urban design should enable cities to anticipate and accommodate flooding, with urban open space playing a key role in simplifying flood accommodation. Jiang et al. [48], using Changsha City as an example, analyzed the impact of flood retention spaces at various levels on the severity of flood disasters. Matos Silva and Costa [34] proposed a conceptual framework that organizes various flood adaptation measures relevant to the design of public spaces, and further developed an urban flood adaptation plan to transform public space using Lisbon as an example. Yang et al. [49] evaluated the strategy of using public space to build flood retention facilities, integrating risk and benefit–cost analysis. Despite the presentation of various urban design concepts and principles for using public spaces to accommodate flooding, limited research has been on the effectiveness of such strategies in flood prevention. Furthermore, little attention has been paid to the role of different elements and projects in the rainwater systems.
Generally, the existing research of adopting public space to build flood retention facilities (multi-functional storage spaces, MFSs) for urban flood risk mitigation have mainly focused on urban-scale planning. However, there are limited quantitative empirical studies at the community scale. Additionally, the response characteristics of different climates to public space have not been considered, and the potential synergistic effects of MFS and LID measures remain unclear.
Therefore, in this study, 60 rainfall scenarios with different rainfall intensities and rainfall peak coefficients were considered and a comprehensive assessment of the reduction effect of LID and MFS was conducted in various rainfall scenarios (i.e., 1—current scenario; 2—only LID practice; 3—only MFS practice; 4—both LID and MFS practices) using a coupled hydrodynamic model, including following four stages: (1) SWMM/LISFLOOD-FP model construction and validation; (2) a qualitative and quantitative evaluation of the changes in the flood characteristics before and after the implementation of LID and MFS; (3) the exploration of synergistic effects of LID and MFS in reducing urban flooding; and (4) the investigation of the control capabilities of LID and MFS under different complex scenarios. The results of this study can enhance our understanding of the integrated use of LID and MFS in urban flood risk management, and can provide some technical support for urban planning strategies.

2. Materials and Methods

2.1. Study Area and Data

The study area, encompassing a total area of 1.5 km2, is situated in the northern vicinity of Tianhe District, which approximates the epicenter of Guangzhou City, located in southeastern China (Figure 1). Tianhe District is a densely populated urban region, with a population of 1.79 million, and is located in a typical region of the East Asian monsoon with mean annual rainfall exceeding 1800 mm, over 80% of which falls from April to September. The rapid development within this area has facilitated significant urban expansion with, unfortunately, a comparatively meager regard for comprehensive flood management strategies. Moreover, extreme rainfall associated with climate change frequently occurs, thus resulting in Tianhe District facing serious flooding risk. Water in the study area is mainly discharged by the drainage network and the central channel, while the surface runoff from a heavy rainstorm may exceed the drainage capacity though it has been upgraded in recent years. Due to the low-lying terrain around the study area, flooding can easily occur in the study area.
Data for modeling included detailed land-use types, a digital elevation model (DEM), and the drainage network, sourced from the local Land and Resources Bureau and Water Supplies Bureau (Figure 1). The land-use data categorized different surface types, including forest, water, building road, and green spaces. Considering the water blocking of the building to the ground, we heightened the elevation of the corresponding position of the building in the model, as shown in Figure 1.

2.2. SWMM/LISFLOOD-FP Coupled Model

The US EPA Storm Water Management Model (SWMM) was chosen for one-dimensional simulation of the study area. SWMM is a dynamic rainfall-runoff simulation model, and is used for single event or long-term simulation of runoff quantity and quality from primarily urban areas [50]. First developed in 1971, SWMM now includes a LID control module for defining low-impact-development measures to store, infiltrate, and evaporate sub-catchment runoff, simulating LID hydrological performance. The model is widely used throughout the world for planning, analysis, and design related to storm water runoff, combined sewers, sanitary sewers, and other drainage systems in urban areas [51,52,53]. The SWMM model is able to simulate one-dimensional urban pipe networks, while it is unable to provide the submergence range, depth, and process. Thus, this research constructed a coupled hydrodynamic model using node overflow results from SWMM and LISFLOOD-FP.
LISFLOOD-FP is a raster digital elevation model of resolution, and has been proved as a useful numerical modeling tool in flood inundation simulation. For the one-dimensional hydraulic routing procedure for channel flow, the simplified one-dimensional St. Venant equation is used in the LISFLOOD-FP model, and can be described by continuity and momentum equations as follows:
Q x + A t + q = 0
S 0 = S f
where Q is the discharge, x is the distance between cross-sections, A is the flow cross-sectional area, t is the time, q is a lateral inflow term, here set to zero for all reported simulations, S0 is the channel bed slope, and Sf is the friction slope, here approximated as the water surface slope.
For some distributed means of routing water two-dimensionally over the floodplain, the model is based on the DEM of the floodplain areas, using the continuity and momentum equations, considering the water balance between adjacent floodplain areas.
d V d t = Q u p + Q d o w n + Q l e f t + Q r i g h t
Q i j = A i j R i j S i j 1 / 2 n
where V is the cell volume, t is the time, and Qup, Qdown, Qleft, and Qright are the flowrates from the upstream, downstream, left, and right adjacent cells, respectively; Qij is the flux between cells i and j, Aij is the cross-sectional area at the interface of the two cells, Rij is the hydraulic radius at the interface of the two cells, Sij is the water surface slope between the two cells, and n is the Manning friction coefficient.
The main steps of coupling SWMM and LISFLOOD-FP to enable simulation of urban flooding depths and inundation extent are as follows:
Step 1: construct the SWMM model for simulation of runoff quantity from primarily urban areas, and further assess the hydrologic performance of typical LID controls and public spaces with water storage capacity;
Step 2: extract the node overflow process from the SWMM output files, and save as the input file format required by LISFLOOD-FP;
Step 3: generate the input files of LISFLOOD-FP, link DEM and overflow files, and simulate the evolution process of surface ponding;
Step 4: export the two-dimensional simulation result files, and use ArcGIS for post-processing. Thus, the SWMM/LISFLOOD-FP two-dimension coupled model is constructed successfully.

2.3. Evaluation of Model Accuracy

The Nash Sutcliffe efficiency coefficient (NSE) was used as a goodness-of-fit measure to select the optimal parameter values, and NSE ≥ 0.5 was taken as the minimum requirement for the model calibration effect [54,55]. The NSE calculation method is as follows:
N S E = 1 i = 1 N Z O i Z m i 2 i = 1 N Z O i Z ¯ O 2
where Z O i and Z m i are the measured and simulated water levels at time step i, Z O is the average of the measured water level, and N is the total number of time steps.

2.4. Multi-Functional Storage Space

Multi-functional storage space (MFS) refers to the utilization of space complexity, emphasizing public spaces that detain rainwater. To identify suitable areas for multi-functional storage spaces (MFSs) in urban settings, we established the following principles:
(a) MFSs should incorporate facilities relevant to daily life, functioning as open spaces with urban landscape features, leisure, and transportation options.
(b) During extreme rainfall events when the urban drainage system overflows, the space serves as a reservoir to store excess rainwater from the surrounding environment.
(c) After the rainstorm subsides and the urban drainage system returns to normal operation, the stored rainwater in the storage space can infiltrate into the ground or be discharged into nearby natural water bodies or underground pipelines.
(d) For sanitation and health considerations, the storage of rainwater in the storage space should not exceed 48 h.
Screened public spaces, such as a park or parking lot, with ample open space, account for a large proportion of water storage capacity. A zone with a small open space can only have a small proportion of water storage capacity. Accordingly, the flood retention volume (VFR) (m3) of each public space can be expressed by the following formula:
V F R = A P S R F R d F R
where APS indicates the area of public space (m2), RFR is the area ratio for flood retention facility (%), and dFR denotes the flood retention depth (m). The area proportional to the area of the public space MFS can be modeled by setting a storage cell in a sub-catchment of the 1D model.

2.5. Setting of Scenarios

2.5.1. Setting of Rainfall Scenarios

According to the previous research, unimodal rainfall in Guangzhou comprises more than 70%, while the bimodal and uniform rainstorms comprise a small proportion [56,57]. Due to the high frequency of unimodal rainstorms and their greater propensity to flooding, the unimodal rainstorm was mainly considered in this study.
To comprehensively investigate the effects of MFS and LID on urban flooding, the Chicago rainfall pattern was adopted for the design storms, and the precipitation events were designed according to the relationship of rainfall intensity–duration–frequency in Guangzhou:
q = 2424.17 ( 1 + 0.533 l g P ) / t + 11.0 0.668
where q is rainfall intensity (mm/s), P is return period (year), and t is rainfall duration (h).
The variable r (0 < r < 1) is defined as the ratio of the time before the peak intensity to the total rainfall duration, which describes the location of peak rainfall intensity. The larger r, the closer the peak intensity to the rainfall ending time. According to the typical rainfall pattern in Guangzhou, rainfalls with different time-to-peak ratio r (r = 0.2, 0.48, 0.8) were divided into three groups [58]. In each group, the precipitation events have different return periods (1-, 5-, 10-, 20-, 50-year), and the corresponding total rainfall amounts range from 67 mm to 128 mm. They have the same rainfall duration of 2 h. The designed storm time series are described in Figure 2.

2.5.2. Setting of Project Scenarios

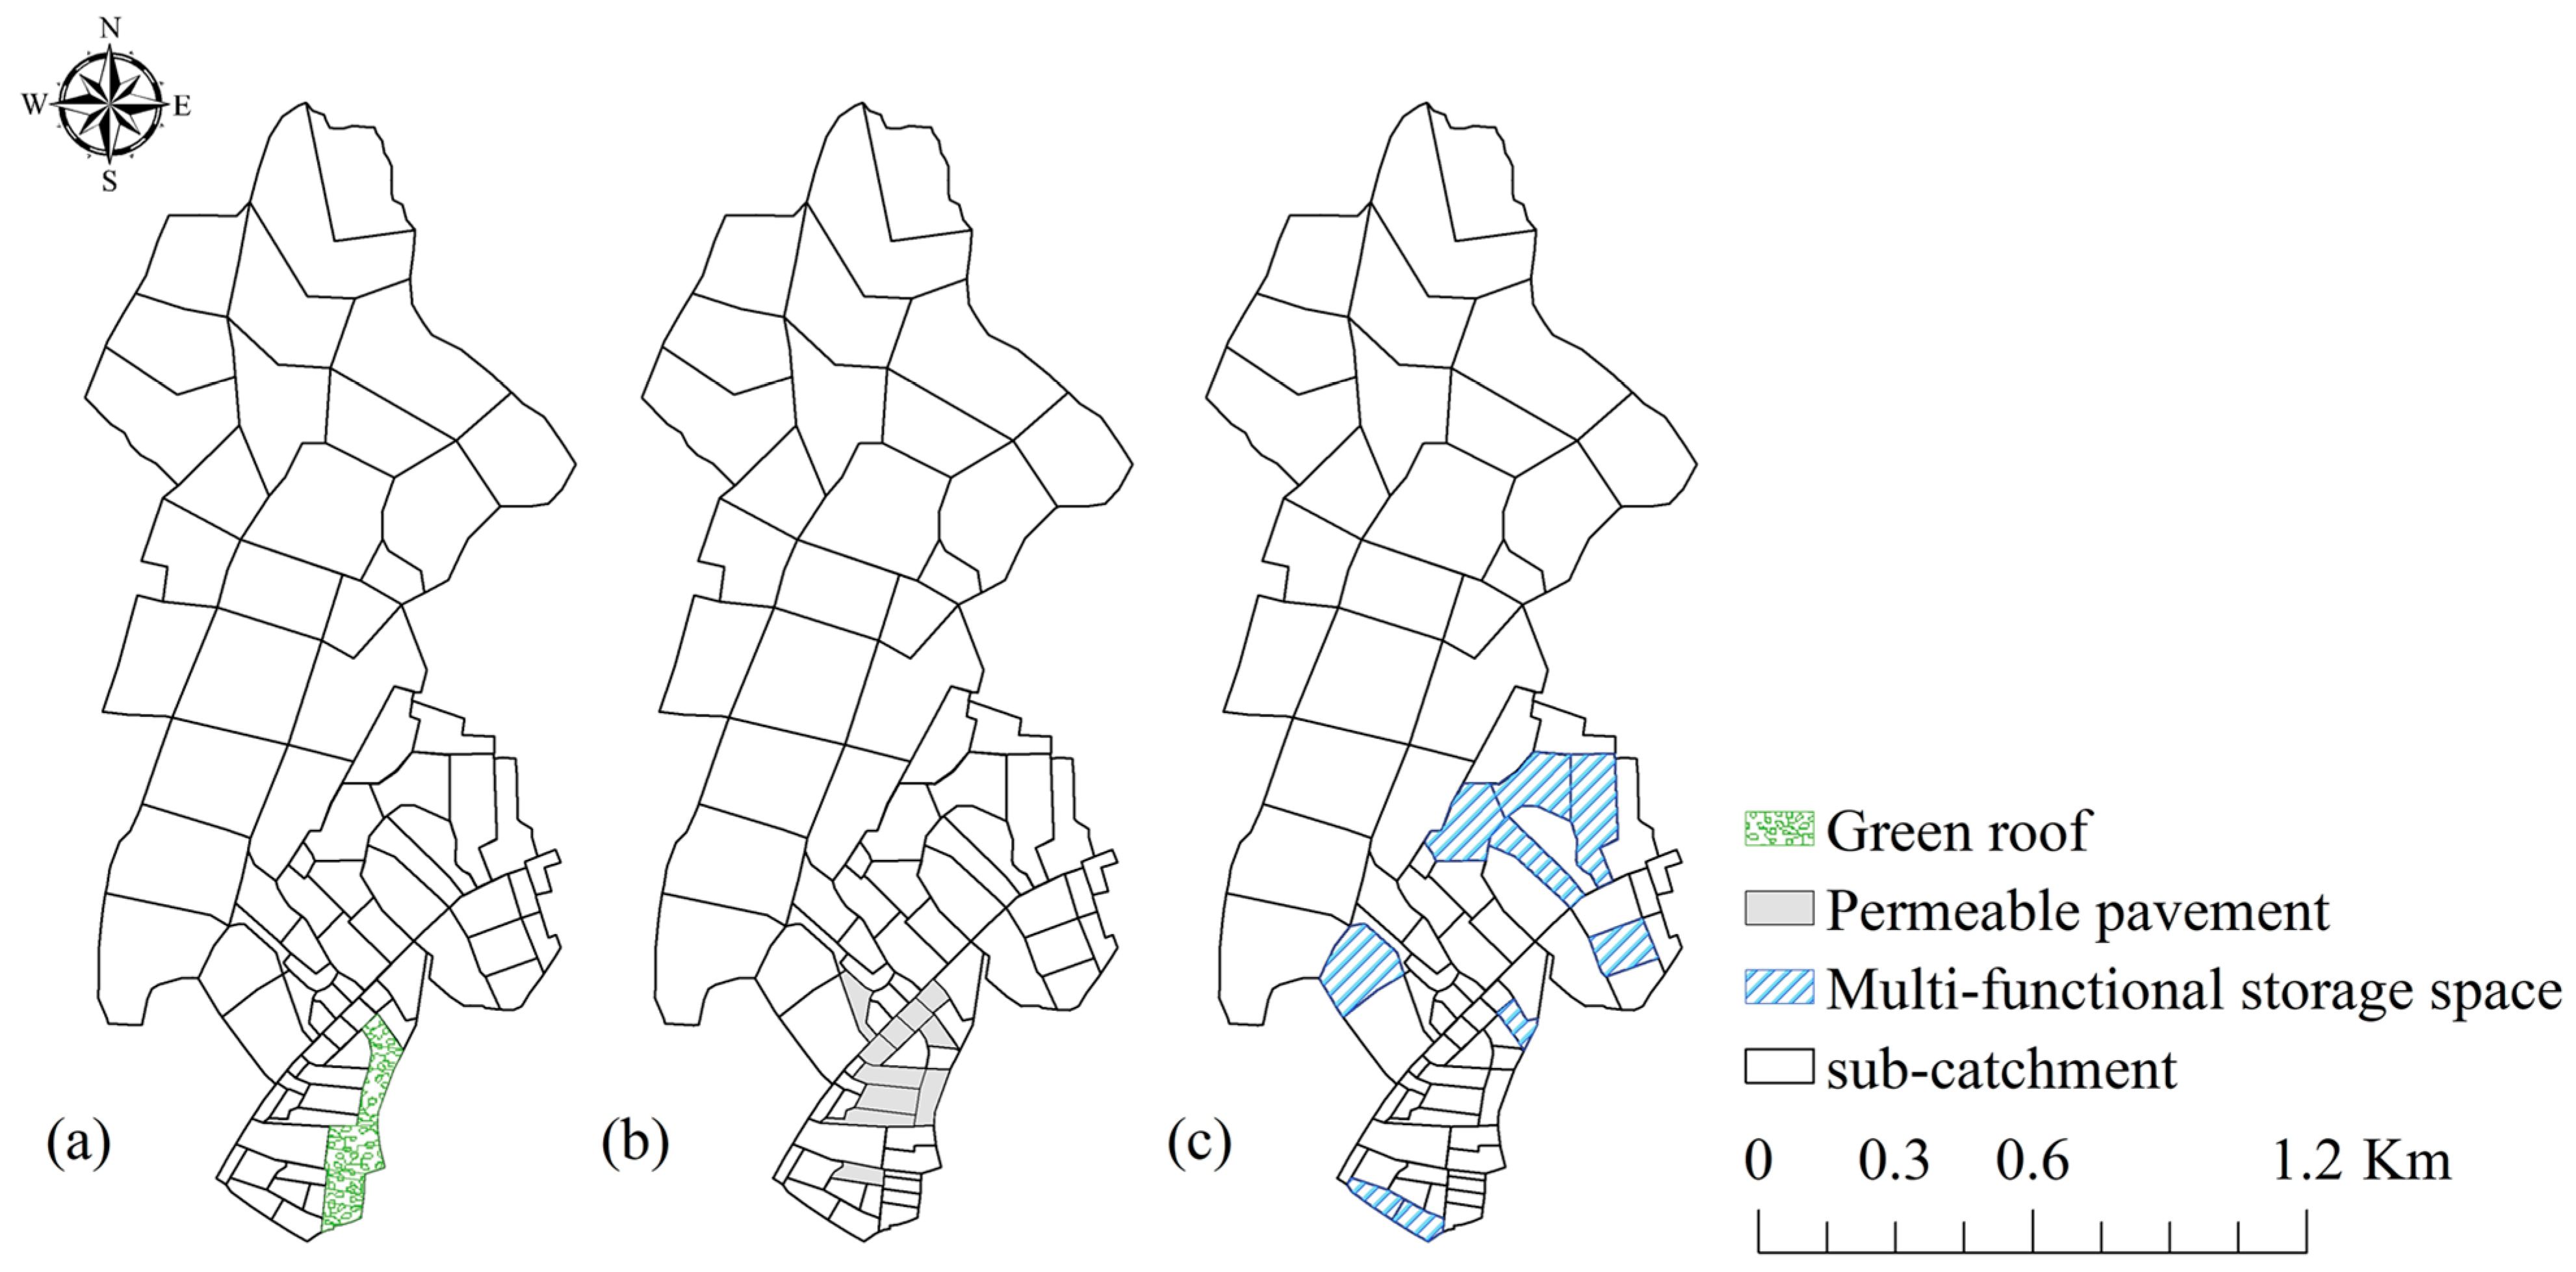
Four design scenarios were proposed according to the local drainage system and the land utilization of the study area (Figure 3): current scenario (Base), typical LID control scenario (LID), MFS scenario and combined control scenario (ALL). The land uses of each design are shown in Table 1, and these scenarios are described as follows.
In the current scenario, existing drainage infrastructure and land-use patterns within the study area remain unchanged. This scenario serves as the baseline against which the effectiveness of proposed interventions was compared. Existing urban surfaces, such as conventional roofs and impermeable pavements, continue to contribute to stormwater runoff without any additional mitigation measures in place.
In the LID scenario, both green roofs and permeable pavements were constructed in the study area. Green roofs need to be laid out on building roofs, and are an effective way to detain and retain stormwater compared to conventional roofs. According to the application conditions of green roofs, green roofs were applied to buildings whose roof slope is less than 15° within the study area [59]. Permeable pavements were used for sidewalks, parking lots, and squares, considering that schools, offices, and traffic roads occupy most of the study area. Based on the on-the-spot investigation and the application conditions of green roofs and the permeable pavements, the typical LID controls (green roofs and permeable pavements) account for about 2% of the whole study area.
In the MFS scenario, only multi-functional storage spaces were constructed in the model. A multi-functional storage space usually consists of a storage layer with a drain underneath, which detains and retains stormwater runoff from impervious surfaces before surface flow enters the drainage systems. Based on the on-the-spot investigation, satellite map, and land-use data, and the identification principle of multi-functional storage spaces proposed in Section 2.4, 9 open spaces were chosen for multi-functional storage space installation. The total area of multi-functional storage space was 43,850 m2, accounting for 2.81% of the study area.
In the combined control scenario, green roofs, permeable pavements, and multi-functional storage spaces were laid out in the study area. The locations of typical LID measures and the multi-functional storage space are the same as in the respective LID and MFS scenarios. By retaining the existing permeable area and converting some impervious areas where typical LID or multi-functional storage spaces were applied, these areas were regarded as permeable areas. In this scenario, the impervious rate of the study area decreased from 49.63% to 44.94%.
The parameter values of typical LID and multi-functional storage space designs were set according to SWMM User’s Manual and other studies, and the values of some important parameters are shown in Table 2.

3. Results

3.1. Calibration and Verification of Model Parameters

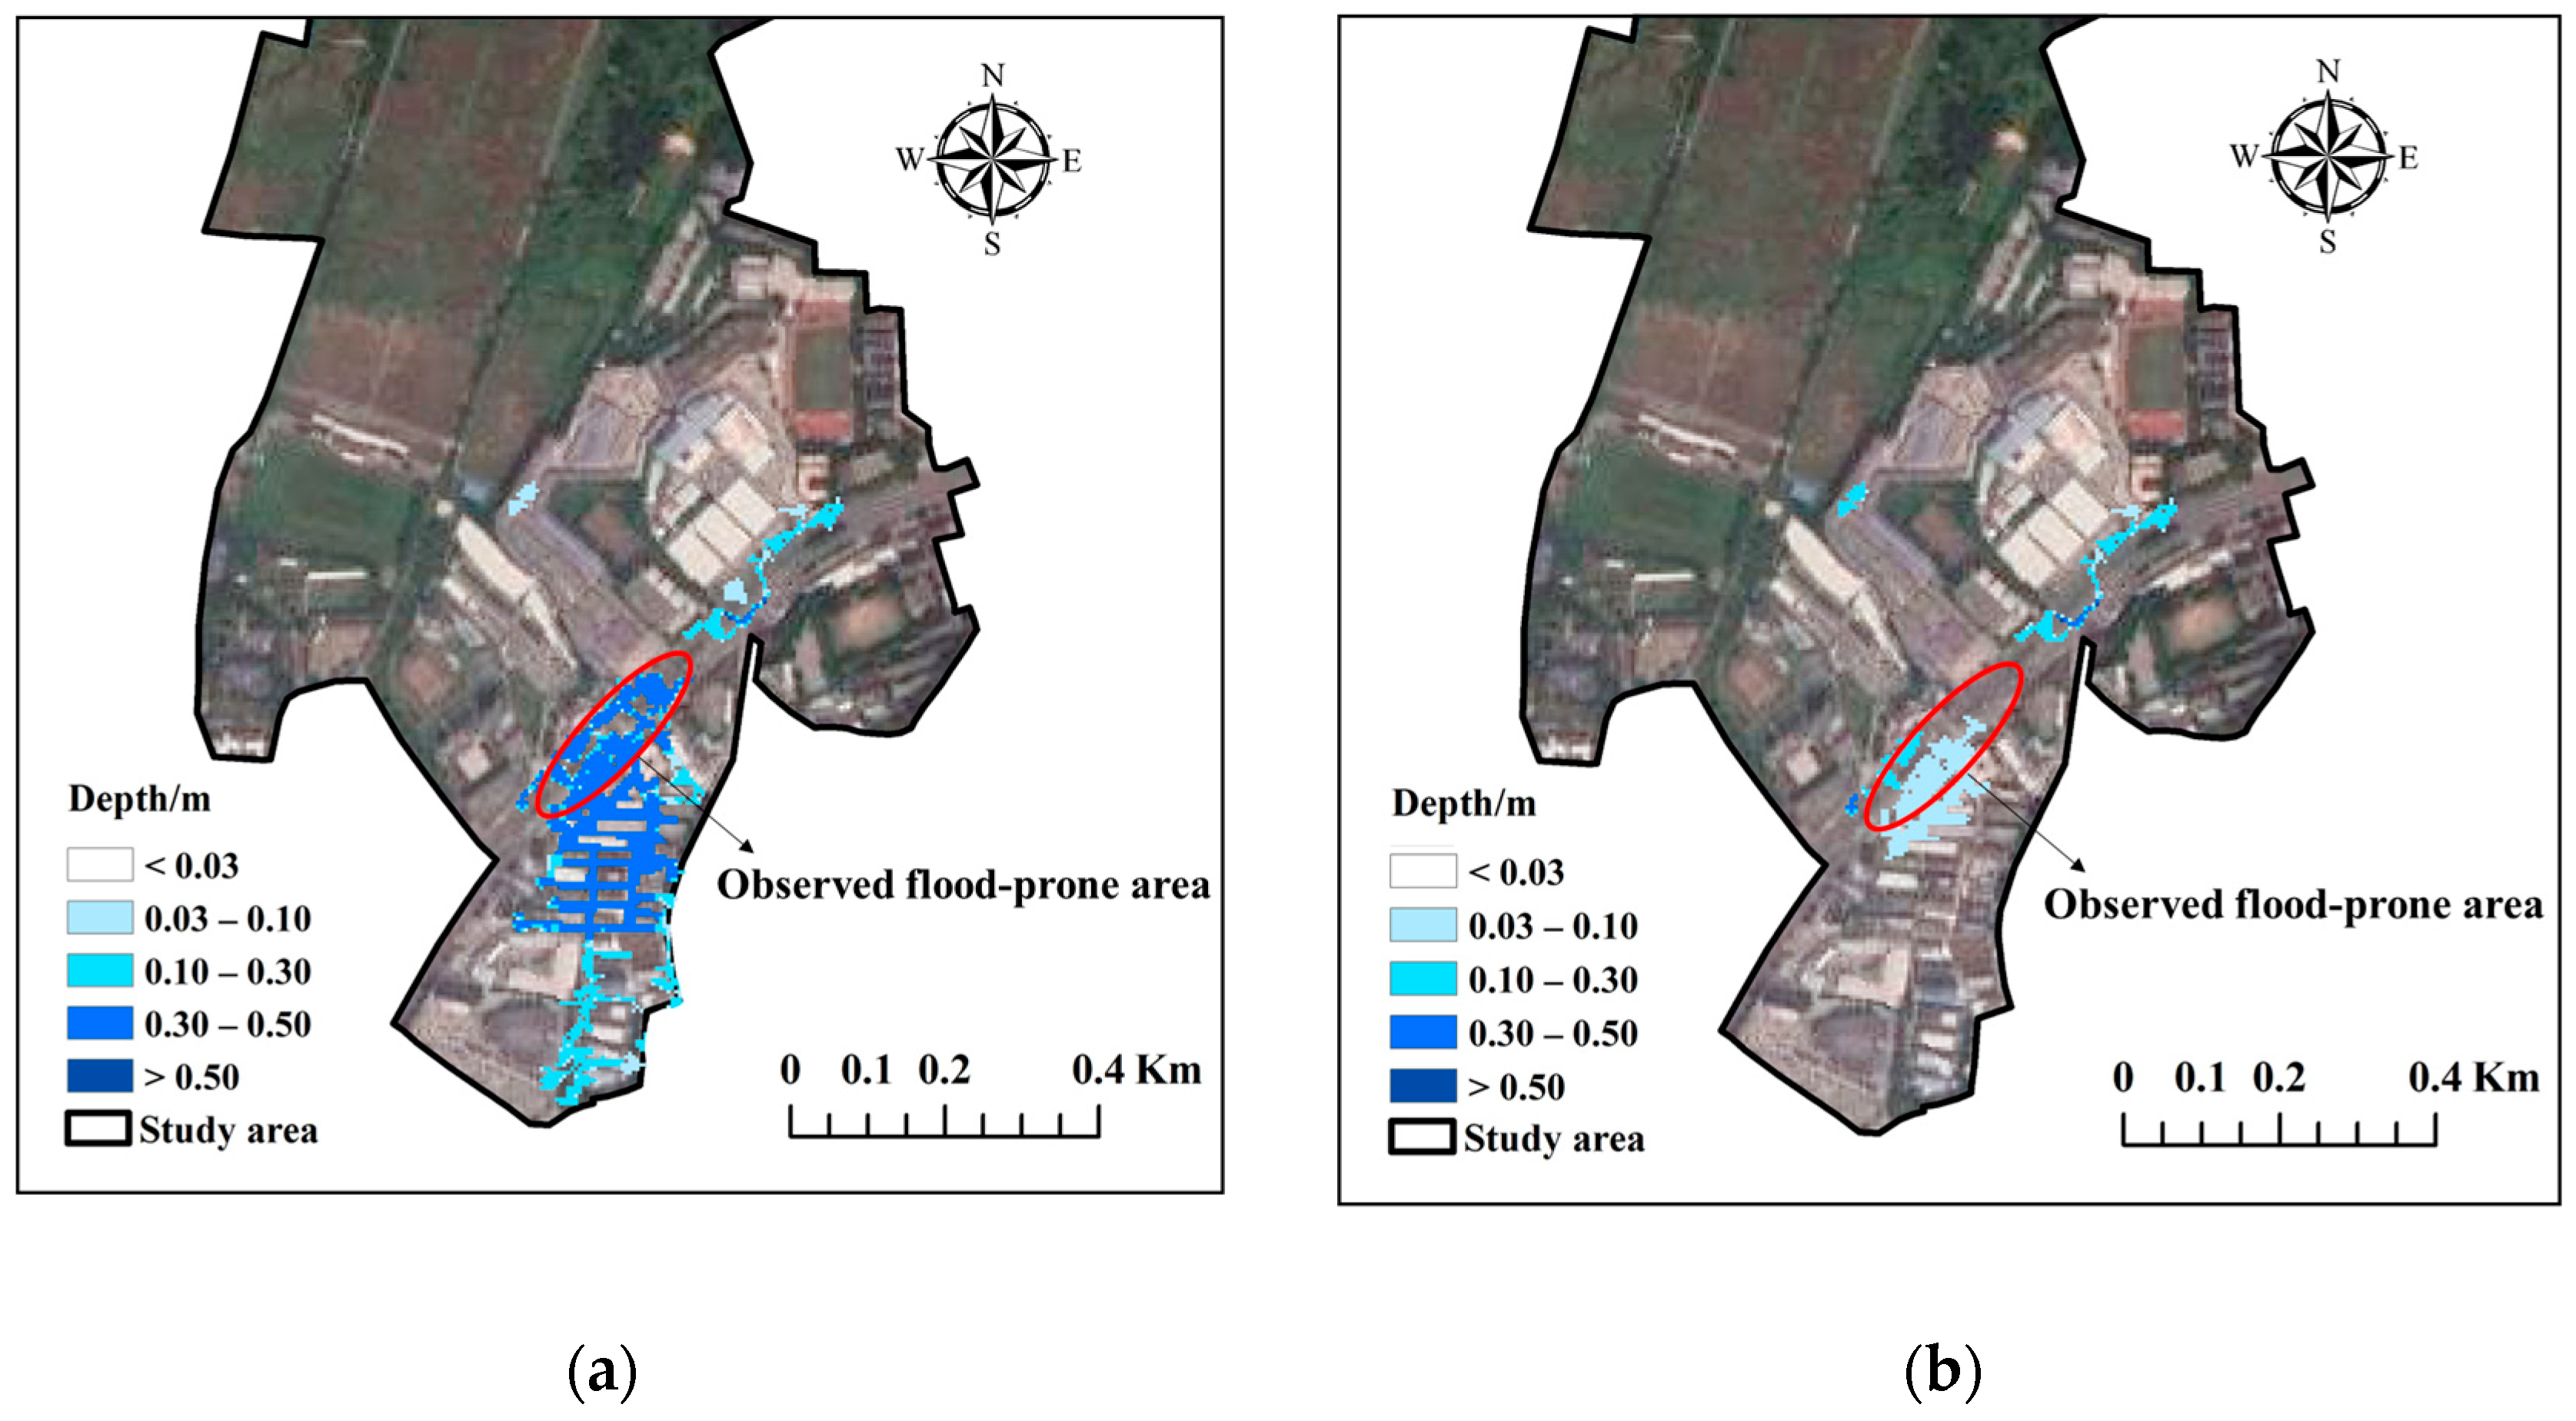
The model was calibrated and validated against two rainfall events. The Nash Sutcliffe Efficiency (NSE) was 0.75 for the June 7 event and 0.86 for the August 28 event (Figure 4). These results indicate that the SWMM model effectively represents the storm runoff processes within the study area. In this study, areas with a submerged depth exceeding 0.03 m were considered submerged. The simulation results, as shown in Figure 4, reveal that during the June 7 event, the inundated area of the study area was 46,675 m2, with a maximum inundation depth of 0.569 m. Under the August 28 event, the inundated area was 17,000 m2, with a maximum inundation depth of 0.545 m. The flooding areas of both rainfall events were mainly concentrated around Changban subway station (Figure 5), consistent with the actual observations, further confirming its effectiveness in representing the storm runoff processes in the study area [60].

3.2. Analysis of the Existing Situation of the Drainage System

Based on the coupled model (SWMM + LISFLOOD-FP), flooding situations in the study area were simulated and analyzed under 60 scenarios. Three indicators, namely maximum inundation area (MIA), total accumulated water volume over 3 h (3 h-TAWV), and maximum inundation depth (MID), were set to assess the effects of different practices under rainfall events with different return periods and different locations of the rainfall peak. MIA represents the maximum area within the study area experiencing inundation depths exceeding 0.03 m during the simulation. A larger MIA indicates a wider area affected and potential losses. The 3 h-TAWV refers to the cumulative volume of water accumulated within the study area, excluding depths less than 0.03 m, over a period of 3 h from the onset of rainfall. MID signifies the maximum water depth observed across the entire study area during the simulation process.
As shown in Table 3, the current drainage system fails to satisfy the designed standard, resulting in inundation even under the one-year rainfall scenario. With the increase in intensity and the location coefficient of the rainfall peak, all three indicators show an upward trend, which means the severity of flooding is positively correlated with rainfall intensity and the location of the rainfall peak.

3.3. Influence of Rainfall Intensity on LID and MFS Practices

In order to comprehensively assess the reduction effects of LID and MFS on urban flooding inundation, their characteristics under complex scenarios were evaluated based on three calculated indicators (MIA, 3 h-TAWV, MID) from various rainfall scenarios, considering the three aspects of inundation area, water volume, and inundation depth. The definitions of these indicators are presented in Section 3.2, and the layouts of these practices are shown in Figure 3.

3.3.1. Impact of Rainfall Intensity on LID and MFS Practices

Taking the simulated flooding inundation results under Group II as example, we explored the impact of rainfall intensity on the reduction effect of LID and MFS practices. Under the rainfalls with different return periods, the values of the indicators (MIA, 3 h-TAWV, MID) in different scenarios are shown in Figure 6a, b, and c, respectively.
In the LID scenarios, compared with the current inundation situation, all three indicators exhibit varying degrees of reduction under different rainfall return periods. Among the three indicators, MIA and 3 h-TAWV show relatively higher degrees of decrease, although their reduction magnitude remains small, and is particularly insufficient during the high return periods. The average reduction rates of MIA and 3 h-TAWV are 6.25% and 6.20%, respectively. The impact of LID on MID reduction is not significant, with the reduction rates ranging from 0.22% to 4.32%, with an average of 1.13%. With the increase in rainfall intensity, the reduction effects of all three indicators show a decreasing trend.
In the MFS scenario, the reduction rates of all three indicators are significantly larger than those of the LID scenario under different rainfall intensities. Compared to the current inundation situation, the percentage reduction in all the three indicators is notable, with the values of the reduction rate of MIA, 3 h-TAWV, and MID ranging from 13.60% to 64.15%, 8.91% to 95.80%, and 48.55% to 75.82%, respectively. The average reduction rates are 25.97%, 37.37%, and 55.30%, respectively, which indicates that inundation can be effectively alleviated by MFS. Among the three indicators, MID can be effectively reduced by MFS, with reduction rates exceeding 47% under different rainfall return periods. It is worth noting that while the reduction rate of 3 h-TAWV decreases with the rainfall return period, the minimum reduction rates of MIA and MID both occurred in the 10-year return period scenario.
In the ALL scenario, the reduction rates of MIA, 3 h-TAWV, and MID ranged from 14.41% to 86.79%, 7.90% to 100.00%, and 50.41 to 79.27%, respectively. Under low-return-period rainfall events (1-, 5-, 10-year), the reduction rates of MIA and 3 h-TAWV in the ALL scenario are higher than those in the MFS, while this trend reverses under higher-return-period rainfall events (20-, 50-year). Regarding MID, the values of reduction rates under the ALL scenario are the highest among the three practices under different rainfall return periods. With the increase in return period, the difference between the reduction rate of MID in the MFS and ALL scenarios becomes smaller.
Overall, rainfall intensity has a significant impact on all three practices. Under low rainfall return periods (P ≤ 10), all three practices can effectively mitigate flood inundation, but the reduction effects gradually weaken with the increase in the rainfall return period. LID can effectively reduce the volume of accumulated water and the inundation area, but it is less effective in reducing the inundation depth. On the other hand, MFS has superior reduction effects in all aspects (water volume, water inundation, and water depth), particularly in reducing water depth. Under the low rainfall return periods (P ≤ 10), combining LID and MFS proves to be an effective strategy for reducing flood inundation, with the reduction effect ranking as LID < MFS < ALL. However, during the high rainfall return periods (P ≥ 20), the difference between MFS and ALL becomes small. Combining LID and MFS appears less inappropriate under these rainfall conditions, with the reduction effect showing as LID < ALL < MFS.

3.3.2. Impact of Rainfall Peak Coefficient on LID and MFS Practices

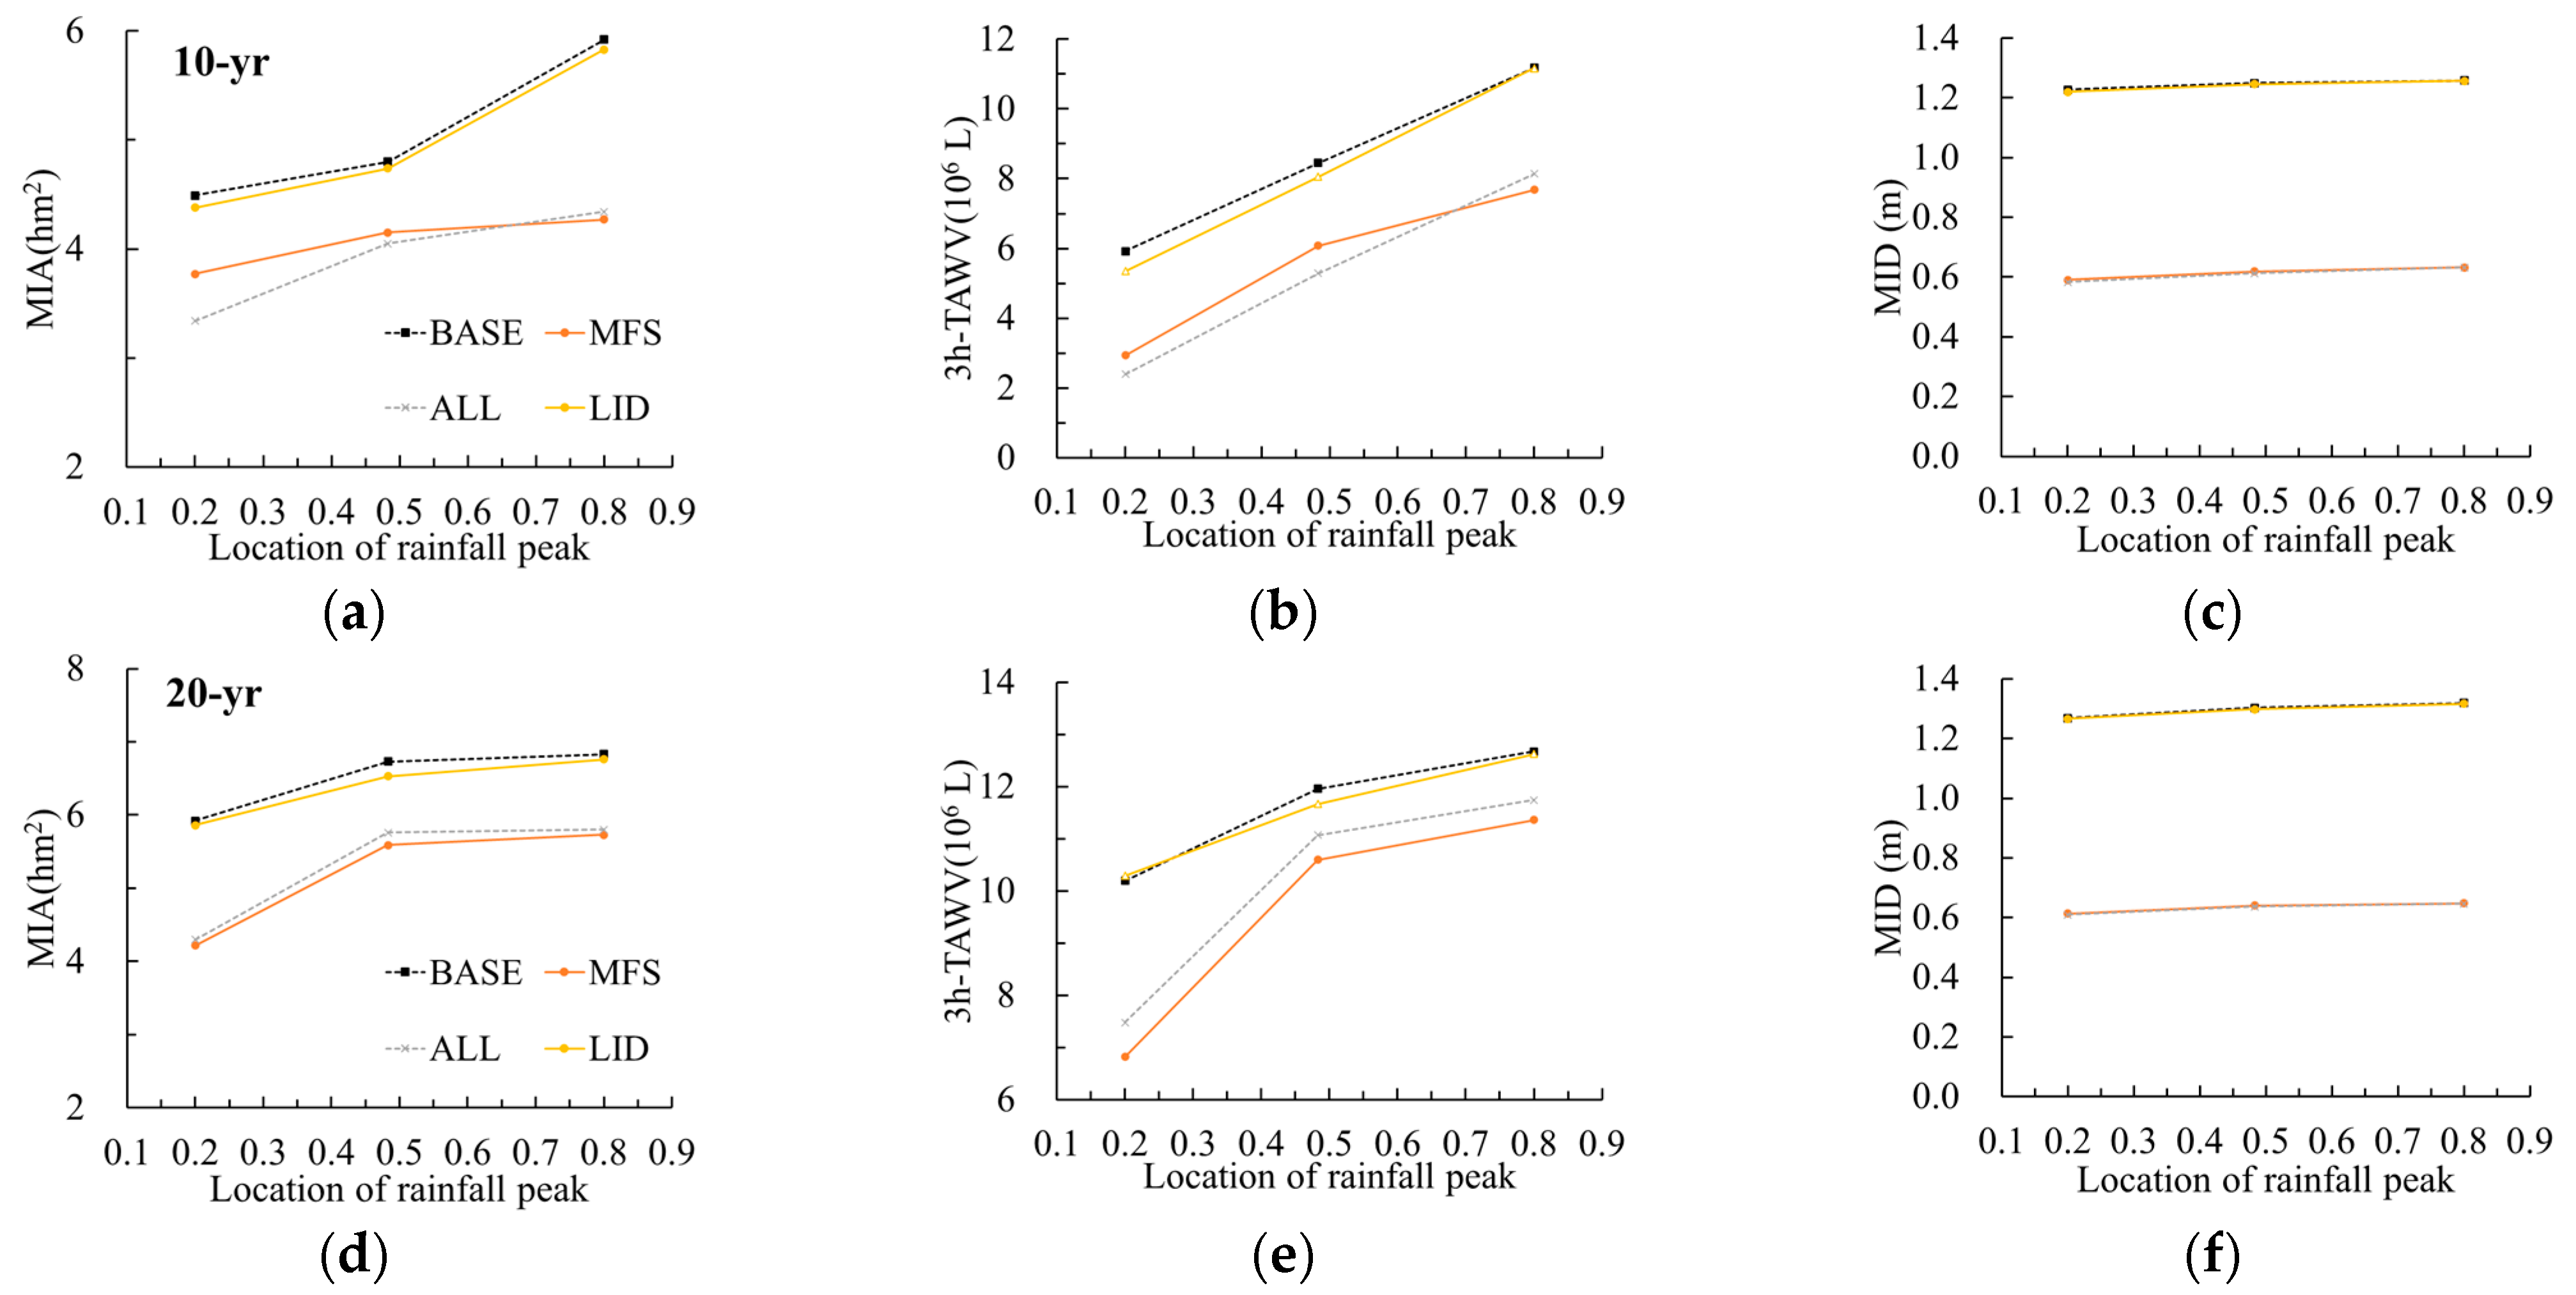
The reduction effects of the three practices and the rainfall peak coefficient exhibit different relationships under the low return period (P ≤ 10) and the high return period (P ≥ 20) of rainfall. Taking the scenarios of 10-year (Figure 7a–c) and 20-year (Figure 7d–f) return periods as examples, the impacts of different practices on the three indicators in the study area are statistically analyzed under different rainfall peak coefficients. It should be noted that the response shown by the majority of indicators would be prioritized when indicators exhibit different responses. If the responses of the three indicators are different, the response of MIA would be considered first.
As shown in Figure 7a–c, the rainfall peak coefficient has a significant impact on all three practices. In the LID scenarios, compared to the current inundation situation, all three indicators exhibited varying degrees of reduction under different rainfall peak coefficients. LID performs best at a rainfall peak coefficient of 0.2, with reduction rates of MIA, 3 h-TAWV, and MID at 2.45%, 9.63%, and 0.57%, respectively. In the MFS scenarios, MFS performs significantly better than LID under different rainfall peak coefficients, with its best performance also observed at a rainfall peak coefficient of 0.2. The reduction rates of the three indicators are 16.04%, 50.34%, and 51.83%, respectively. A similar pattern was found in the ALL scenario, with the best performance under a rainfall peak coefficient of 0.2, with the reduction rates of the three indicators being 26.69%, 59.46%, and 52.49%, respectively. However, the ranking of the reduction effect varied under different rainfall peak coefficients. Under the rainfall peak coefficients of 0.2 and 0.48, the reduction relationships are as follows: LID < MFS < ALL; under the rainfall peak coefficient of 0.8, the reduction relationship is as follows: LID < ALL < MFS.
Regarding Figure 7d–f, under the LID scenarios, the reduction rates of the three indicators first rise and then decrease with the coefficient rising. LID performs best at a rainfall peak coefficient of 0.48, with reduction rates of MIA, 3 h-TAWV, and MID at 2.97%, 2.42%, and 0.38%, respectively. In the MFS scenarios, MFS performs better than LID under different rainfall peak coefficients, while its reduction rates decrease as the rainfall peak coefficients increase. The best performance of MFS was observed at a rainfall peak coefficient of 0.2, with reduction rates of the three indicators being 28.72%, 33.07%, and 51.62%, respectively. Similar to LID, the reduction rates under ALL also exhibit an increasing-then-decreasing trend with the increase in the rainfall peak coefficient. The highest reduction rates of the three indicators are found under the rainfall peak coefficient of 0.2, with values of 27.36%, 26.59%, and 51.93%, respectively. Under the 20-year rainfall events, the reduction relationship under all rainfall peak coefficients is shown as LID < ALL < MFS.

3.3.3. Changes in LID and MFS Characteristics under Different Rainfall Scenarios

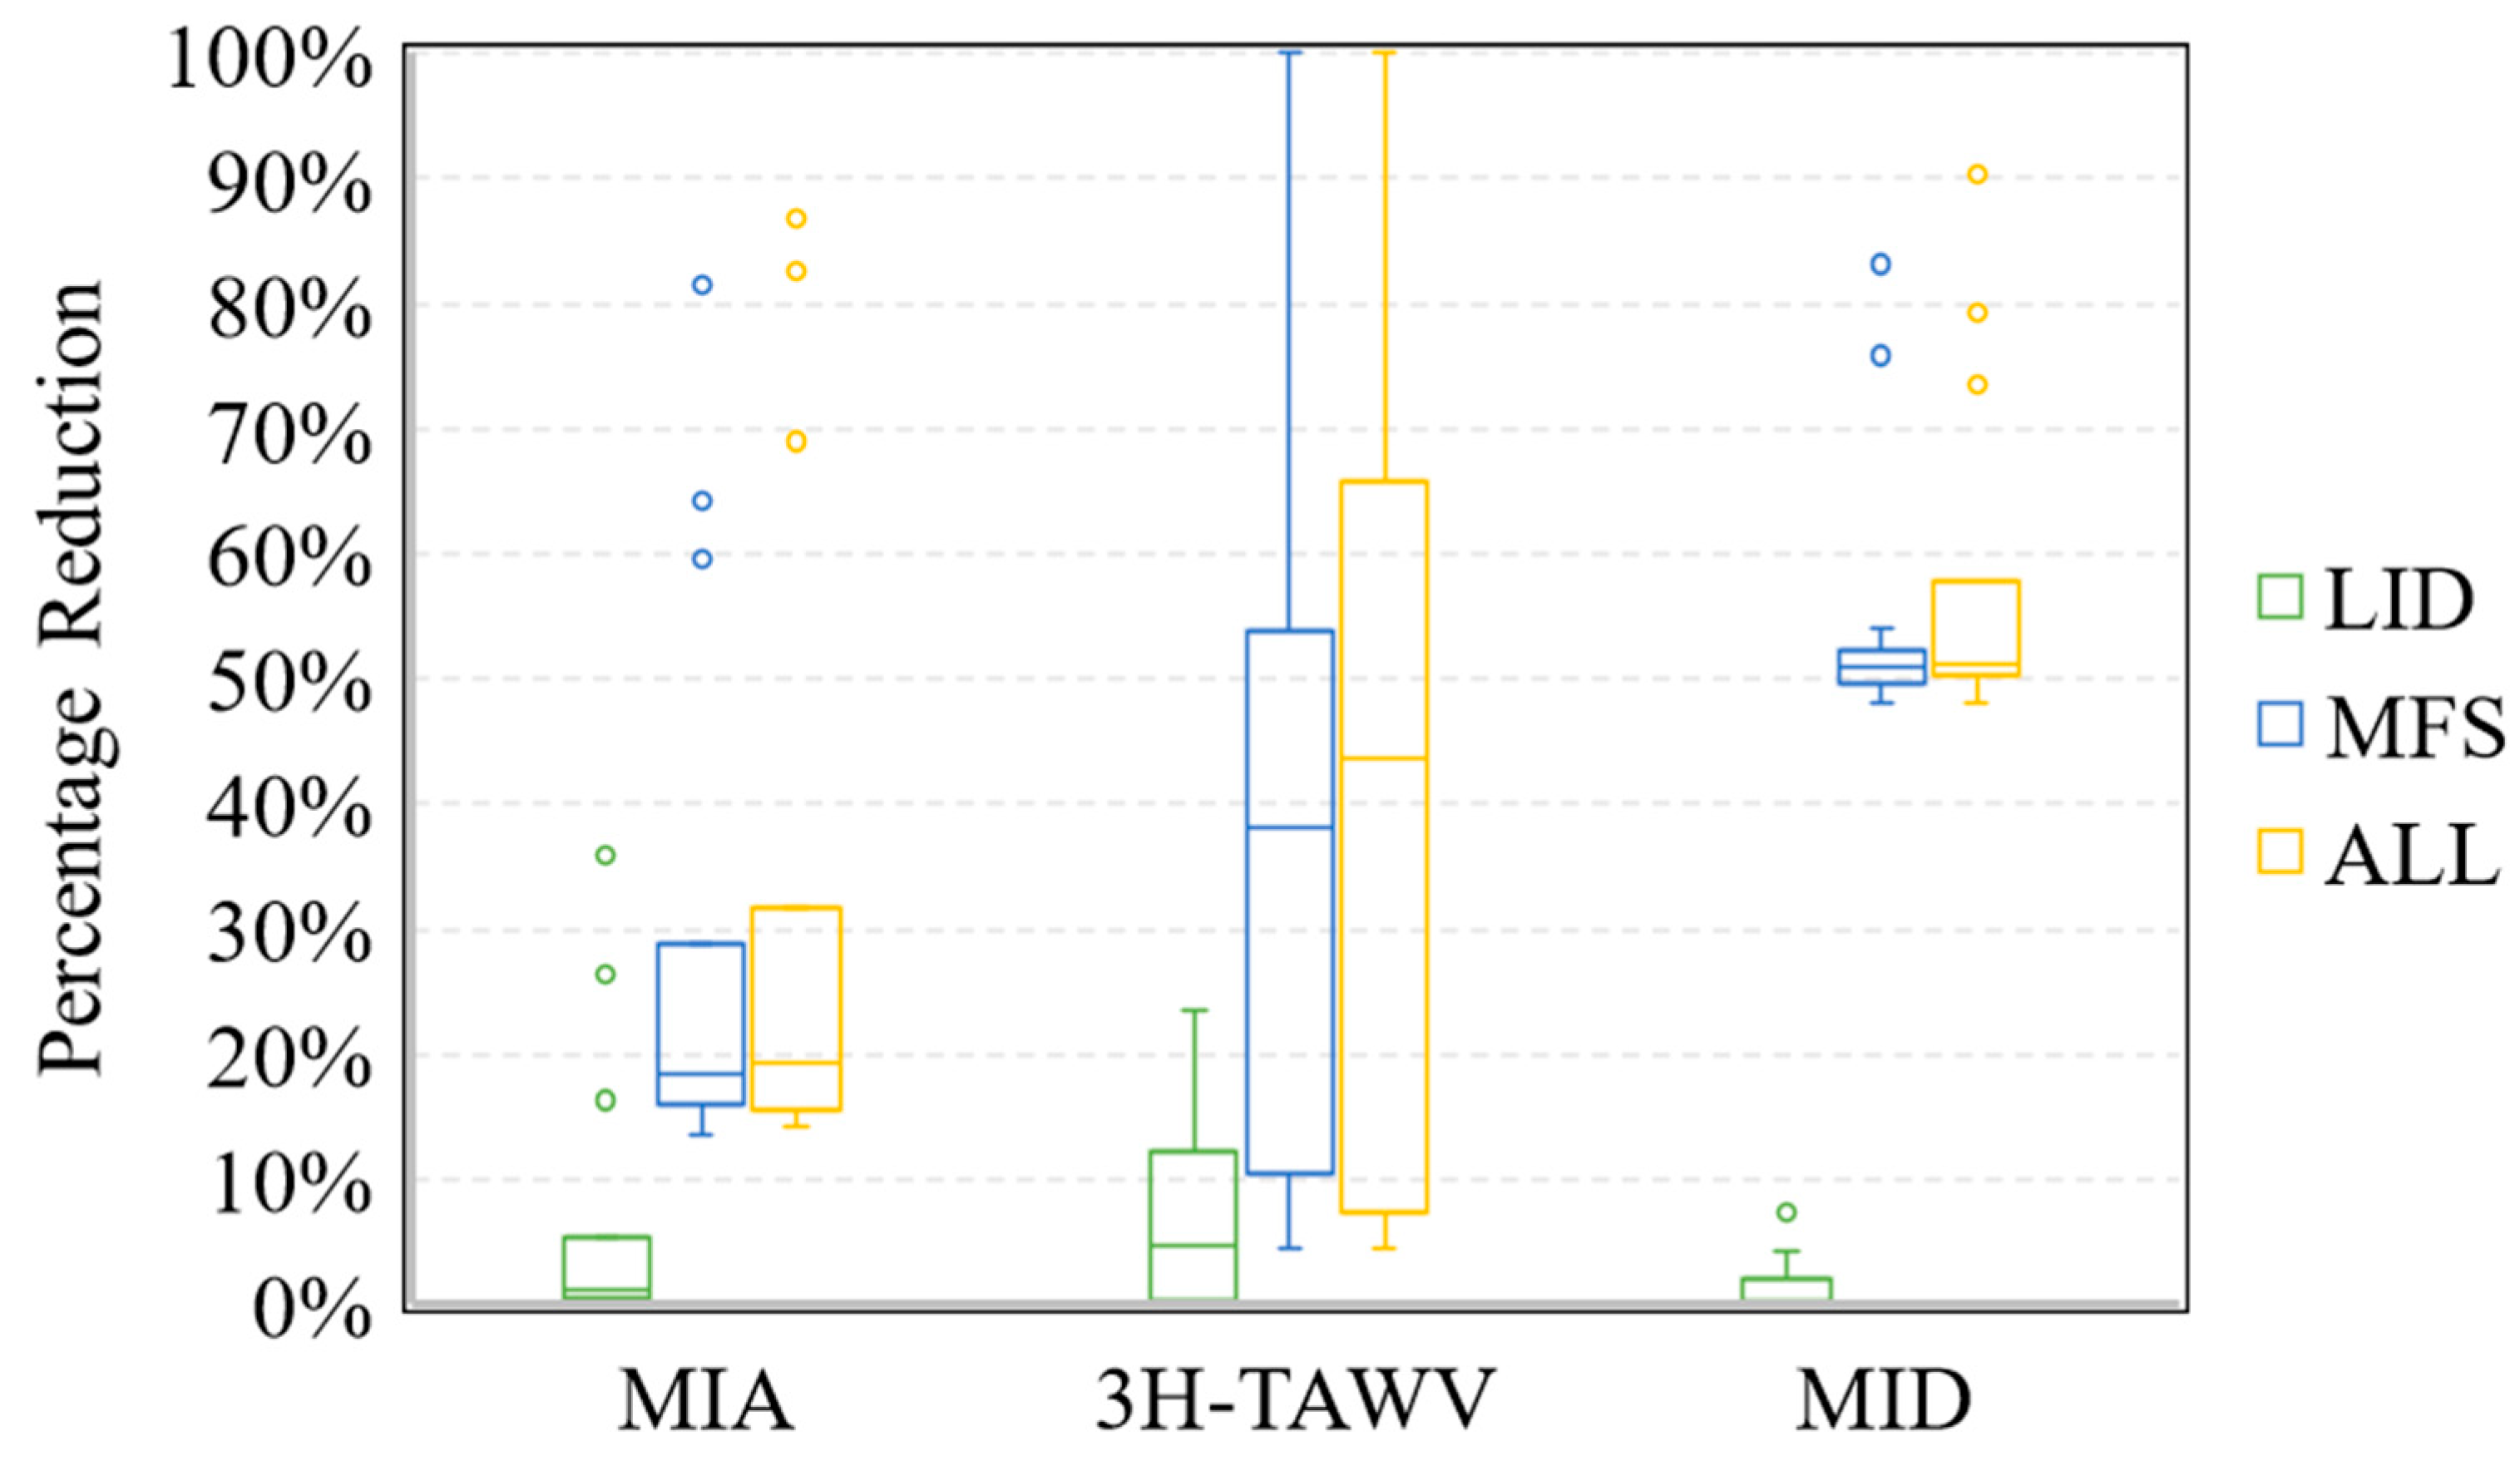
The three indicators under different practices scenarios were calculated and are shown in Figure 8, and the statistical results of these indicators are summarized in Table 4. It is clear that LID exhibits the lowest capacity in mitigating urban flooding, whereas MFS and ALL show relatively higher and closer performances.
As shown in Figure 8, the reduction effects of different practices in mitigating the inundation area appear to be the least effective among all three aspects. Although the inundation area can be largely diminished in certain rainfall events, especially in 1-year rainfall events, the reduction effect in the maximum inundation area remains the lowest across most rainfall events, with average reduction rates below 20%.
Regarding the reduction in total accumulated water volume over 3 h (3 h-TAWV), the efficiency of the three practices shows the most significant impact among the three indicators. Although LID consistently performs worst, it has a relatively greater capacity in reducing total water volume, rather than inundation area and depth. Particularly noteworthy is the remarkable capacity of MFS in reducing water volume, particularly in 1-year rainfall events with a rainfall peak coefficient of 0.2, where its reduction rate in 3 h-TAWV is 100%. However, this effectiveness diminishes significantly under 50-year rainfall events, with reduction rates in 3 h-TAWV dropping to below 10%, marking the lowest reduction rate among the three indicators. Additionally, LID exhibits a positive impact on enhancing the reduction capacity of MFS in lowering water volume, as evidenced by ALL achieving a greater reduction rate than MFS. Nonetheless, LID also introduces uncertainties in MFS performance under rainfall events with higher return periods and rainfall peak coefficients.
In terms of the reduction in maximum inundation depth (MID), LID consistently demonstrates the poorest performance, with all reduction rates remaining below 10%. Compared to LID, MFS shows a more robust and consistent capacity in reducing the maximum inundation depth. Particularly under 1-year rainfall events, MFS showcases exceptional effectiveness in reducing maximum inundation depth, with reduction rates exceeding 50% across the majority of rainfall events. Although combining LID and MFS can enhance the stormwater capacity of the study area, it does not significantly impact the average reduction capacity of MFS-alone in reducing maximum inundation depth.

4. Discussion

Urban flooding is a complex and pressing challenge faced by cities worldwide, exacerbated by factors such as rapid urbanization, climate change, and aging infrastructure. In recent years, the application of deep learning methods to flooding analysis has further highlighted the importance of adopting sustainable and nature-based solutions to mitigate flood risks [61,62,63]. Among these solutions, urban public spaces and LID practices have emerged as promising approaches due to their potential to enhance stormwater management while providing additional benefits such as improved urban aesthetics, biodiversity promotion, and recreational opportunities. In this study, we aimed to explore the scientific significance of urban public spaces and LID practices for flood control, particularly in highly urbanized areas, and to understand how different rainfall characteristics influence their performance. By focusing on these aspects, we sought to contribute valuable insights into effective flood mitigation strategies for urban environments.
In this study, comprehensive principles were developed for selecting MFS, a key component of our study, based on previous researches. Given the high density of buildings in the study area and its status as a built-up region, we excluded the option of MFS areas larger than 0.5 hectares in our criteria. Instead, we concentrated on identifying and utilizing the remaining open spaces within the city. These principles considered factors such as storage capacity, location suitability, and integration with existing urban infrastructure. After identifying optimal sites for MFS implementation, we constructed a hydrodynamic coupled model to simulate urban flooding under various designed rainfall and practice scenarios. Our results revealed a clear correlation between rainfall intensity, rainfall peak coefficient, and the severity of flooding. As rainfall intensity and peak coefficient increased, flooding became more pronounced, and the effectiveness of LID practices diminished, which has been demonstrated in other research [64,65,66]. However, we noticed that the excessive construction of LID in this area may not necessarily lead to better results. In fact, it could exacerbate the instability of flood inundation situations, especially during high rainfall intensity. These LID options, such as green roofs and permeable pavement in our study, have limited water storage capacity, which means they may reach their storage capacity during the initial stages of precipitation, leading to overflow during peak rainfall events. Consequently, water may accumulate on the pavement or building surfaces, exacerbating flooding conditions. On the other hand, a lack of consideration for the interactions between LID components may also be a cause of this problem. Due to space constraints and existing infrastructure in old urban areas, LID implementation, primarily relying on existing architecture, may overlook the intricate interplay between different LID components. Consequently, retrofitting old urban areas with simplistic LID measures may encounter the risk of exacerbating flooding issues rather than alleviating them.
Moreover, this study not only highlighted the superior performance of MFS over traditional LID practices in densely urbanized areas, but also quantified the reduction effect of MFS on urban flooding. One possible key reason for the superior performance of MFS is supposed to be its larger storage capacity compared to LID. This increased capacity allows MFS units to capture and retain larger volumes of stormwater, particularly during high rainfall intensity. Additionally, MFS units are typically situated at lower relative elevations compared to surrounding infrastructure, facilitating the direct storage of stormwater runoff. Thus, MFS effectively reduces the pressure on drainage systems, thereby mitigating flooding in the study area.
Furthermore, two-dimensional (2D) modeling has significantly enhanced our understanding of how these measures respond to rainfall patterns. While one-dimensional (1D) models allow us to track and observe overall overflow volumes and critical pipeline points in the entire study area, the introduction of 2D modeling enables a more detailed analysis of localized flooding dynamics. In particular, certain grid areas with relatively low elevations may be susceptible to water from adjacent areas, leading to significant pooling and inundation, which cannot be observed in the simulation results of 1D models. Previous studies have investigated the driving factors in shaping urban flooding dynamics, highlighting how topography plays a pivotal role in flood formation within urban areas [67,68,69]. Thus, relying solely on 1D simulations may result in a misunderstanding of the effectiveness of flood mitigation measures under specific rainfall conditions, as the patterns observed in 1D and 2D simulations may not always align.
Finally, it is imperative to outline the aspects not addressed in this study. One limitation is our exclusive focus on the flood mitigation effectiveness of each measure, without considering their cost-effectiveness. For instance, while low-impact-development (LID) strategies may offer substantial flood reduction benefits, they may also incur significant costs, placing a considerable financial burden on local governments [59,70]. Additionally, we did not account for the potential impacts of future climate change and urban development on these measures. As climate patterns evolve and cities undergo expansion and densification, the efficacy of flood mitigation strategies may be influenced, warranting further investigation into their long-term viability and adaptability to changing environmental conditions and urban landscapes.

5. Conclusions

A high proportion of impervious surfaces and dense population make urban areas highly susceptibility to urban flooding. Integrating public spaces into flood control systems is considered to be an effective measure to enhance urban flood management. This study, based on a coupled model (SWMM/LISFLOOD-FP), taking the Changban area of Tianhe District, Guangzhou City as a typical research area, compared and analyzed the urban flooding reduction effects of multi-functional storage spaces (MFSs), LID, and a situation with both LID and MFS (ALL) under various rainfall conditions (different return periods and rainfall peak coefficients). The following conclusions are drawn:
(1) A hydrodynamic coupled model was constructed based on SWMM and LISFLOOD-FP. The coupled model was calibrated and validated based on actual outlet water levels and inundation conditions. The Nash efficiency coefficients were all greater than 0.7, and simulated inundation positions matched actual locations, indicating good model accuracy.
(2) Under different return periods, the reduction effects of LID, MFS, and ALL decreased with increasing rainfall intensity. LID performed poorest in reducing maximum inundation depth, while MFS and ALL have superior capacity, with reduction rates over 47%. LID may introduce uncertainties in MFS performance under rainfall events with higher return periods and rainfall peak coefficients. Under low return periods (P ≤ 10), the reduction effect relationship was LID < MFS < ALL; under high return periods (P ≥ 20), the reduction effect relationship was LID < ALL < MFS.
(3) The reduction effects of the three practices and the rainfall peak coefficient exhibit different relationships under low return periods (P ≤ 10) and high return periods (P ≥ 20) of rainfall. LID performed better under low return period with an early rainfall peak position, and under high return periods with a middle rainfall peak position. MFS and ALL had the best reduction effects under early rainfall peak positions. Under a low return period with an earlier peak position (r < 0.5), the reduction relationships are as follows: LID < MFS < ALL; under a high return period or a late peak position, the reduction relationships are as follows: LID < ALL < MFS.
The flood mitigation effectiveness results of this study can be further evaluated for cost-effectiveness. Additionally, incorporating global climate change scenarios and urban development trends is essential. As climate patterns shift and cities grow, the long-term viability and adaptability of flood mitigation strategies need further investigation.

Author Contributions

Conceptualization, H.Y. and C.L.; methodology, Y.F. and S.H.; software, Y.F.; validation, Y.F., X.J. and X.L.; formal analysis, Y.F.; investigation, Y.F.; resources, H.Y.; data curation, Y.F.; writing—original draft preparation, Y.F. and S.H.; writing—review and editing, H.Y. and C.L.; visualization, Y.F.; supervision, H.Y.; project administration, C.L.; funding acquisition, H.Y. and C.L. All authors have read and agreed to the published version of the manuscript.

Funding

This research was funded by the National Key Research and Development Program of China (2023YFC3010704), the Natural Science Foundation of Guangdong Province (2023B1515020087), the Fund of Science and Technology Program of Guangzhou (2024A04J6294).

Institutional Review Board Statement

Not applicable.

Informed Consent Statement

Not applicable.

Data Availability Statement

The original contributions presented in the study are included in the article, further inquiries can be directed to the corresponding author.

Conflicts of Interest

The authors declare no conflicts of interest.

References

  1. Tellman, B.; Sullivan, J.A.; Kuhn, C.; Kettner, A.J.; Doyle, C.S.; Brakenridge, G.R.; Erickson, T.A.; Slayback, D.A. Satellite Imaging Reveals Increased Proportion of Population Exposed to Floods. Nature 2021, 596, 80–86. [Google Scholar] [CrossRef]
  2. Rentschler, J.; Avner, P.; Marconcini, M.; Su, R.; Strano, E.; Vousdoukas, M.; Hallegatte, S. Global Evidence of Rapid Urban Growth in Flood Zones since 1985. Nature 2023, 622, 87–92. [Google Scholar] [CrossRef]
  3. Arnell, N.W.; Gosling, S.N. The impacts of climate change on river flood risk at the global scale. Clim. Chang. 2016, 134, 387–401. [Google Scholar] [CrossRef]
  4. Kam, P.M.; Aznar-Siguan, G.; Schewe, J.; Milano, L.; Ginnetti, J.; Willner, S.; McCaughey, J.W.; Bresch, D.N. Global Warming and Population Change Both Heighten Future Risk of Human Displacement Due to River Floods. Environ. Res. Lett. 2021, 16, 044026. [Google Scholar] [CrossRef]
  5. Sampson, C.C.; Smith, A.M.; Bates, P.B.; Neal, J.C.; Alfieri, L.; Freer, J.E. A high-resolution global flood hazard model. Water Resour. Res. 2015, 51, 7358–7381. [Google Scholar] [CrossRef]
  6. Lyu, H.M.; Sun, W.J.; Shen, S.L.; Arulrajah, A. Flood risk assessment in metro systems of mega-cities using a GIS-based modeling approach. Sci. Total Environ. 2018, 626, 1012–1025. [Google Scholar] [CrossRef]
  7. Li, S.; Wang, Z.; Wu, X.; Zeng, Z.; Shen, P.; Lai, C. A novel spatial optimization approach for the cost-effectiveness improvement of LID practices based on SWMM-FTC. J. Environ. Manag. 2022, 307, 114574. [Google Scholar] [CrossRef]
  8. Jiang, Y.; Zevenbergen, C.; Ma, Y.C. Urban pluvial flooding and stormwater management: A contemporary review of China’s challenges and “sponge cities” strategy. Environ. Sci. Policy 2017, 80, 132–143. [Google Scholar] [CrossRef]
  9. Lai, C.; Chen, X.; Wang, Z.; Yu, H.; Bai, X. Flood Risk Assessment and Regionalization from Past and Future Perspectives at Basin Scale. Risk Anal. 2020, 40, 1399–1417. [Google Scholar] [CrossRef]
  10. Lai, C.; Sun, H.; Wu, X.; Li, J.; Wang, Z.; Tong, H.; Feng, J. Water Availability May Not Constrain Vegetation Growth in Northern Hemisphere. Agric. Water Manag. 2024, 291, 108649. [Google Scholar] [CrossRef]
  11. Güneralp, B.; Güneralp, I.; Liu, Y. Changing global patterns of urban exposure to flood and drought hazards. Glob. Envron. Chang. 2015, 31, 217–225. [Google Scholar] [CrossRef]
  12. Scalise, C.; Fitzpatrick, K. Chicago deep tunnel design and construction. In Structures Congress 2012; American Society of Civil Engineers: San Francisco, CA, USA, 2012; pp. 1485–1495. [Google Scholar]
  13. Butler, D.; Digman, C.J.; Makropoulos, C.; Davies, J.W. Urban Drainage, 4th ed.; CRC Press: Boca Raton, MA, USA, 2018; ISBN 978-1-351-17430-5. [Google Scholar]
  14. Sohn, W.; Brody, S.D.; Kim, J.-H.; Li, M.-H. How Effective Are Drainage Systems in Mitigating Flood Losses? Cities 2020, 107, 102917. [Google Scholar] [CrossRef]
  15. Junk, W.J.; An, S.; Finlayson, C.M.; Gopal, B.; Květ, J.; Mitchell, S.A.; Mitsch, W.J.; Robarts, R.D. Current State of Knowledge Regarding the World’s Wetlands and Their Future under Global Climate Change: A Synthesis. Aquat. Sci. 2013, 75, 151–167. [Google Scholar] [CrossRef]
  16. Ashley, R.; Lundy, L.; Ward, S.; Shaffer, P.; Walker, L.; Morgan, C.; Saul, A.; Wong, T.; Moore, S. Water-Sensitive Urban Design: Opportunities for the UK. Proc. Inst. Civ. Eng.-Munic. Eng. 2013, 166, 65–76. [Google Scholar] [CrossRef]
  17. Ice, G. History of Innovative Best Management Practice Development and Its Role in Addressing Water Quality Limited Waterbodies. J. Environ. Eng. 2004, 130, 684–689. [Google Scholar] [CrossRef]
  18. Dietz, M.E. Low Impact Development Practices: A Review of Current Research and Recommendations for Future Directions. Water Air Soil Pollut. 2007, 186, 351–363. [Google Scholar] [CrossRef]
  19. Scholes, L.; Revitt, D.M.; Ellis, J.B. A Systematic Approach for the Comparative Assessment of Stormwater Pollutant Removal Potentials. J. Environ. Manag. 2008, 88, 467–478. [Google Scholar] [CrossRef]
  20. Fletcher, T.D.; Shuster, W.; Hunt, W.F.; Ashley, R.; Butler, D.; Arthur, S.; Trowsdale, S.; Barraud, S.; Semadeni-Davies, A.; Bertrand-Krajewski, J.-L.; et al. SUDS, LID, BMPs, WSUD and More—The Evolution and Application of Terminology Surrounding Urban Drainage. Urban Water J. 2015, 12, 525–542. [Google Scholar] [CrossRef]
  21. Hernes, R.R.; Gragne, A.S.; Abdalla, E.M.H.; Braskerud, B.C.; Alfredsen, K.; Muthanna, T.M. Assessing the Effects of Four SUDS Scenarios on Combined Sewer Overflows in Oslo, Norway: Evaluating the Low-Impact Development Module of the Mike Urban Model. Hydrol. Res. 2020, 51, 1437–1454. [Google Scholar] [CrossRef]
  22. Muttil, N.; Nasrin, T.; Sharma, A.K. Impacts of Extreme Rainfalls on Sewer Overflows and WSUD-Based Mitigation Strategies: A Review. Water 2023, 15, 429. [Google Scholar] [CrossRef]
  23. Eckart, K.; McPhee, Z.; Bolisetti, T. Performance and Implementation of Low Impact Development—A Review. Sci. Total Environ. 2017, 607–608, 413–432. [Google Scholar] [CrossRef]
  24. Sui, X.; van de Ven, F.H.M. The Influence of Low Impact Development (LID) on Basin Runoff in a Half-Urbanized Catchment: A Case Study in San Antonio, Texas. J. Hydrol. 2023, 616, 128793. [Google Scholar] [CrossRef]
  25. Cao, Q.; Cao, J.; Xu, R. Optimizing Low Impact Development for Stormwater Runoff Treatment: A Case Study in Yixing, China. Water 2023, 15, 989. [Google Scholar] [CrossRef]
  26. Carter, T.L.; Rasmussen, T.C. Hydrologic Behavior of Vegetated Roofs1. JAWRA J. Am. Water Resour. Assoc. 2006, 42, 1261–1274. [Google Scholar] [CrossRef]
  27. Shuangcheng, T.; Wan, L.U.O.; Zhonghua, J.I.A.; Shan, L.I.; Yan, W.U.; Meng, Z. Effect of rain gardens on storm runoff reduction. Adv. Water Sci. 2015, 26, 787–794. [Google Scholar] [CrossRef]
  28. Vineyard, D.; Ingwersen, W.W.; Hawkins, T.R.; Xue, X.; Demeke, B.; Shuster, W. Comparing Green and Grey Infrastructure Using Life Cycle Cost and Environmental Impact: A Rain Garden Case Study in Cincinnati, OH. JAWRA J. Am. Water Resour. Assoc. 2015, 51, 1342–1360. [Google Scholar] [CrossRef]
  29. Hettiarachchi, S.; Wasko, C.; Sharma, A. Rethinking Urban Storm Water Management through Resilience—The Case for Using Green Infrastructure in Our Warming World. Cities 2022, 128, 103789. [Google Scholar] [CrossRef]
  30. Mulligan, J.; Bukachi, V.; Clause, J.C.; Jewell, R.; Kirimi, F.; Odbert, C. Hybrid Infrastructures, Hybrid Governance: New Evidence from Nairobi (Kenya) on Green-Blue-Grey Infrastructure in Informal Settlements. Anthropocene 2020, 29, 100227. [Google Scholar] [CrossRef]
  31. Alves, A.; Gersonius, B.; Kapelan, Z.; Vojinovic, Z.; Sanchez, A. Assessing the Co-Benefits of Green-Blue-Grey Infrastructure for Sustainable Urban Flood Risk Management. J. Environ. Manag. 2019, 239, 244–254. [Google Scholar] [CrossRef]
  32. Bertilsson, L.; Wiklund, K.; de Moura Tebaldi, I.; Rezende, O.M.; Veról, A.P.; Miguez, M.G. Urban Flood Resilience—A Multi-Criteria Index to Integrate Flood Resilience into Urban Planning. J. Hydrol. 2019, 573, 970–982. [Google Scholar] [CrossRef]
  33. McClymont, K.; Morrison, D.; Beevers, L.; Carmen, E. Flood Resilience: A Systematic Review. J. Environ. Plan. Manag. 2020, 63, 1151–1176. [Google Scholar] [CrossRef]
  34. Matos Silva, M.; Costa, J. Flood Adaptation Measures Applicable in the Design of Urban Public Spaces: Proposal for a Conceptual Framework. Water 2016, 8, 284. [Google Scholar] [CrossRef]
  35. Silva, M.M.; Costa, J.P. Urban Floods and Climate Change Adaptation: The Potential of Public Space Design When Accommodating Natural Processes. Water 2018, 10, 180. [Google Scholar] [CrossRef]
  36. Che, W.; Zhang, Y.; Li, J.Q.; Liu, H.; He, J.P.; Meng, G.H.; Wang, H.L. Multi-Functional Storage of Rainwater in Urban Area. Water Wastewater Eng. 2005, 31, 25–29. (In Chinese) [Google Scholar]
  37. Nie, R. A Study on Effects of Urban Space on Flood Mitigation—The Case of Tokyo. Urban Plan. Forum 2012, 6, 79–85. (In Chinese) [Google Scholar]
  38. Allen, J. Ambient Power: Berlin’s Potsdamer Platz and the Seductive Logic of Public Spaces. Urban Stud. 2006, 43, 441–455. [Google Scholar] [CrossRef]
  39. Urbanisten, D. Water Square Benthemplein in Rotterdam, the Netherlands. Landsc. Archit. Front. 2013, 1, 136–143. [Google Scholar]
  40. Ilgen, S.; Sengers, F.; Wardekker, A. City-To-City Learning for Urban Resilience: The Case of Water Squares in Rotterdam and Mexico City. Water 2019, 11, 983. [Google Scholar] [CrossRef]
  41. Wu, Y.; Liu, Y. Transforming Industrial Waterfronts into Inclusive Landscapes: A Project Method and Investigation of Landscape as a Medium for Sustainable Revitalization. Sustainability 2023, 15, 5060. [Google Scholar] [CrossRef]
  42. Xiaodan, L.; Yamaguchi, K. Kawasaki Issues and Strategies for Designing Flood Resilient Public Space to Achieve a Balance between Public Amenity and Stormwater Management Infrastructure. Urban Reg. Plan. Rev. 2023, 10, 197–223. [Google Scholar] [CrossRef]
  43. Galvin, M.; Maassen, A. In Nairobi, Residents Redesign Public Spaces to Build Flood Resilience. 2021. Available online: https://www.wri.org/nairobi-public-spaces-build-flood-resilience?utm_source=feedburner&utm_medium=feed&utm_campaign=Feed%3A+wri_news_and_views+%28WRI+Insights+Blog%2C+News%2C+and+Publications+%7C+World+Resources+Institute%29 (accessed on 25 October 2023).
  44. Wang, S.; Wang, X. Study on Landscape Ways of Rainwater Resource Utilization in Urban Public Space. Chin. Landsc. Archit. 2014, 30, 5–9. (In Chinese) [Google Scholar]
  45. Wang, Z.; Li, X.; Huang, R.; Tang, J. Strategy of Potential Rainwater Storage Space Exploration under the Background of Sponge City. Mod. Urban Res. 2016, 7, 23–28. (In Chinese) [Google Scholar]
  46. Jauhari Hildayanti, A. The Role of Public Spaces for Flood Management on the Mahakam Riverbank. 2021. Available online: https://dspace.uii.ac.id/handle/123456789/43587 (accessed on 21 March 2024).
  47. Liao, K.-H.; Le, T.A.; Nguyen, K.V. Urban Design Principles for Flood Resilience: Learning from the Ecological Wisdom of Living with Floods in the Vietnamese Mekong Delta. Landsc. Urban Plan. 2016, 155, 69–78. [Google Scholar] [CrossRef]
  48. Jiang, Q.; Zheng, B. Study on the Influence of Urban Stormwater Detention and Retention Space on Flood Disaster—Case Study of Flood Disaster in Changsha, 2017. J. Nat. Disasters 2018, 27, 29–38. (In Chinese) [Google Scholar]
  49. Yang, S.-Y.; Chen, W.-T.; Lin, C.-H.; Chang, L.-F.; Fang, W.-T.; Jhong, B.-C. Adaptation Strategy with Public Space for Pluvial Flood Risk Mitigation in a Densely Populated City: A Case Study in Huwei, Taiwan. J. Hydrol. Reg. Stud. 2023, 48, 101452. [Google Scholar] [CrossRef]
  50. Niazi, M.; Nietch, C.; Maghrebi, M.; Jackson, N.; Bennett, B.R.; Tryby, M.; Massoudieh, A. Storm Water Management Model: Performance Review and Gap Analysis. J. Sustain. Water Built Environ. 2017, 3, 04017002. [Google Scholar] [CrossRef] [PubMed]
  51. Arjenaki, M.O.; Sanayei, H.R.Z.; Heidarzadeh, H.; Mahabadi, N.A. Modeling and Investigating the Effect of the LID Methods on Collection Network of Urban Runoff Using the SWMM Model (Case Study: Shahrekord City). Model. Earth Syst. Environ. 2021, 7, 1–16. [Google Scholar] [CrossRef]
  52. Dell, T.; Razzaghmanesh, M.; Sharvelle, S.; Arabi, M. Development and Application of a SWMM-Based Simulation Model for Municipal Scale Hydrologic Assessments. Water 2021, 13, 1644. [Google Scholar] [CrossRef]
  53. Ma, B.; Wu, Z.; Hu, C.; Wang, H.; Xu, H.; Yan, D.; Soomro, S. Process-Oriented SWMM Real-Time Correction and Urban Flood Dynamic Simulation. J. Hydrol. 2022, 605, 127269. [Google Scholar] [CrossRef]
  54. Pushpalatha, R.; Perrin, C.; Moine, N.L.; Andréassian, V. A Review of Efficiency Criteria Suitable for Evaluating Low-Flow Simulations. J. Hydrol. 2012, 420–421, 171–182. [Google Scholar] [CrossRef]
  55. Yang, L.; Smith, J.A.; Baeck, M.L.; Zhang, Y. Flash Flooding in Small Urban Watersheds: Storm Event Hydrologic Response. Water Resour. Res. 2016, 52, 4571–4589. [Google Scholar] [CrossRef]
  56. Chen, Z.; Yin, L.; Chen, X.; Wei, S.; Zhu, Z. Research on the Characteristics of Urban Rainstorm Pattern in the Humid Area of Southern China: A Case Study of Guangzhou City. Int. J. Climatol. 2015, 35, 4370–4386. [Google Scholar] [CrossRef]
  57. He, S.; Wang, Z.; Wang, D.; Liao, W.; Wu, X.; Lai, C. Spatiotemporal Variability of Event-Based Rainstorm: The Perspective of Rainfall Pattern and Concentration. Int. J. Climatol. 2022, 42, 6258–6276. [Google Scholar] [CrossRef]
  58. Chen, P.; Wang, Z.; Zeng, Z.; Chen, X. Assessing influence of future urbanization on hydrological process in typical river basin. J. Hydroelectr. Eng. 2020, 39, 67–77. (In Chinese) [Google Scholar]
  59. Wang, Z.; Li, S.; Wu, X.; Lin, G.; Lai, C. Impact of Spatial Discretization Resolution on the Hydrological Performance of Layout Optimization of LID Practices. J. Hydrol. 2022, 612, 128113. [Google Scholar] [CrossRef]
  60. Hou, J.; Guo, K.; Wang, Z.; Jing, H.; Li, D. Numerical Simulation of Design Storm Pattern Effects on Urban Flood Inundation. Adv. Water Sci. 2017, 28, 820–828. (In Chinese) [Google Scholar]
  61. Liao, Y.; Wang, Z.; Chen, X.; Lai, C. Fast Simulation and Prediction of Urban Pluvial Floods Using a Deep Convolutional Neural Network Model. J. Hydrol. 2023, 624, 129945. [Google Scholar] [CrossRef]
  62. Wu, L.; Ma, D.; Wang, Z.; Zhang, J.; Zhang, B.; Li, J.; Liao, J.; Tong, J. A Deep CNN-Based Constitutive Model for Describing of Statics Characteristics of Rock Materials. Eng. Fract. Mech. 2023, 279, 109054. [Google Scholar] [CrossRef]
  63. Wu, L.; Tong, J.; Wang, Z.; Li, J.; Li, M.; Li, H.; Feng, Y. Post-Flood Disaster Damaged Houses Classification Based on Dual-View Image Fusion and Concentration-Based Attention Module. Sustain. Cities Soc. 2024, 103, 105234. [Google Scholar] [CrossRef]
  64. Qin, H.; Li, Z.; Fu, G. The Effects of Low Impact Development on Urban Flooding under Different Rainfall Characteristics. J. Environ. Manag. 2013, 129, 577–585. [Google Scholar] [CrossRef]
  65. Hu, M.; Zhang, X.; Li, Y.; Yang, H.; Tanaka, K. Flood Mitigation Performance of Low Impact Development Technologies under Different Storms for Retrofitting an Urbanized Area. J. Clean. Prod. 2019, 222, 373–380. [Google Scholar] [CrossRef]
  66. Xie, K.; He, Y.; Kim, J.-S.; Yoon, S.-K.; Liu, J.; Chen, H.; Lee, J.H.; Zhang, X.; Xu, C.-Y. Assessment of the Joint Impact of Rainfall Characteristics on Urban Flooding and Resilience Using the Copula Method. Water Resour. Manag. 2023, 37, 1765–1784. [Google Scholar] [CrossRef]
  67. Zhang, Q.; Wu, Z.; Zhang, H.; Dalla Fontana, G.; Tarolli, P. Identifying Dominant Factors of Waterlogging Events in Metropolitan Coastal Cities: The Case Study of Guangzhou, China. J. Environ. Manag. 2020, 271, 110951. [Google Scholar] [CrossRef] [PubMed]
  68. Qi, M.; Huang, H.; Liu, L.; Chen, X. Spatial Heterogeneity of Controlling Factors’ Impact on Urban Pluvial Flooding in Cincinnati, US. Appl. Geogr. 2020, 125, 102362. [Google Scholar] [CrossRef]
  69. Wang, Y.; Li, C.; Liu, M.; Cui, Q.; Wang, H.; Lv, J.; Li, B.; Xiong, Z.; Hu, Y. Spatial Characteristics and Driving Factors of Urban Flooding in Chinese Megacities. J. Hydrol. 2022, 613, 128464. [Google Scholar] [CrossRef]
  70. Zeng, Z.; Wang, Z.; Lai, C. Simulation Performance Evaluation and Uncertainty Analysis on a Coupled Inundation Model Combining SWMM and WCA2D. Int. J. Disaster Risk Sci. 2022, 13, 448–464. [Google Scholar] [CrossRef]
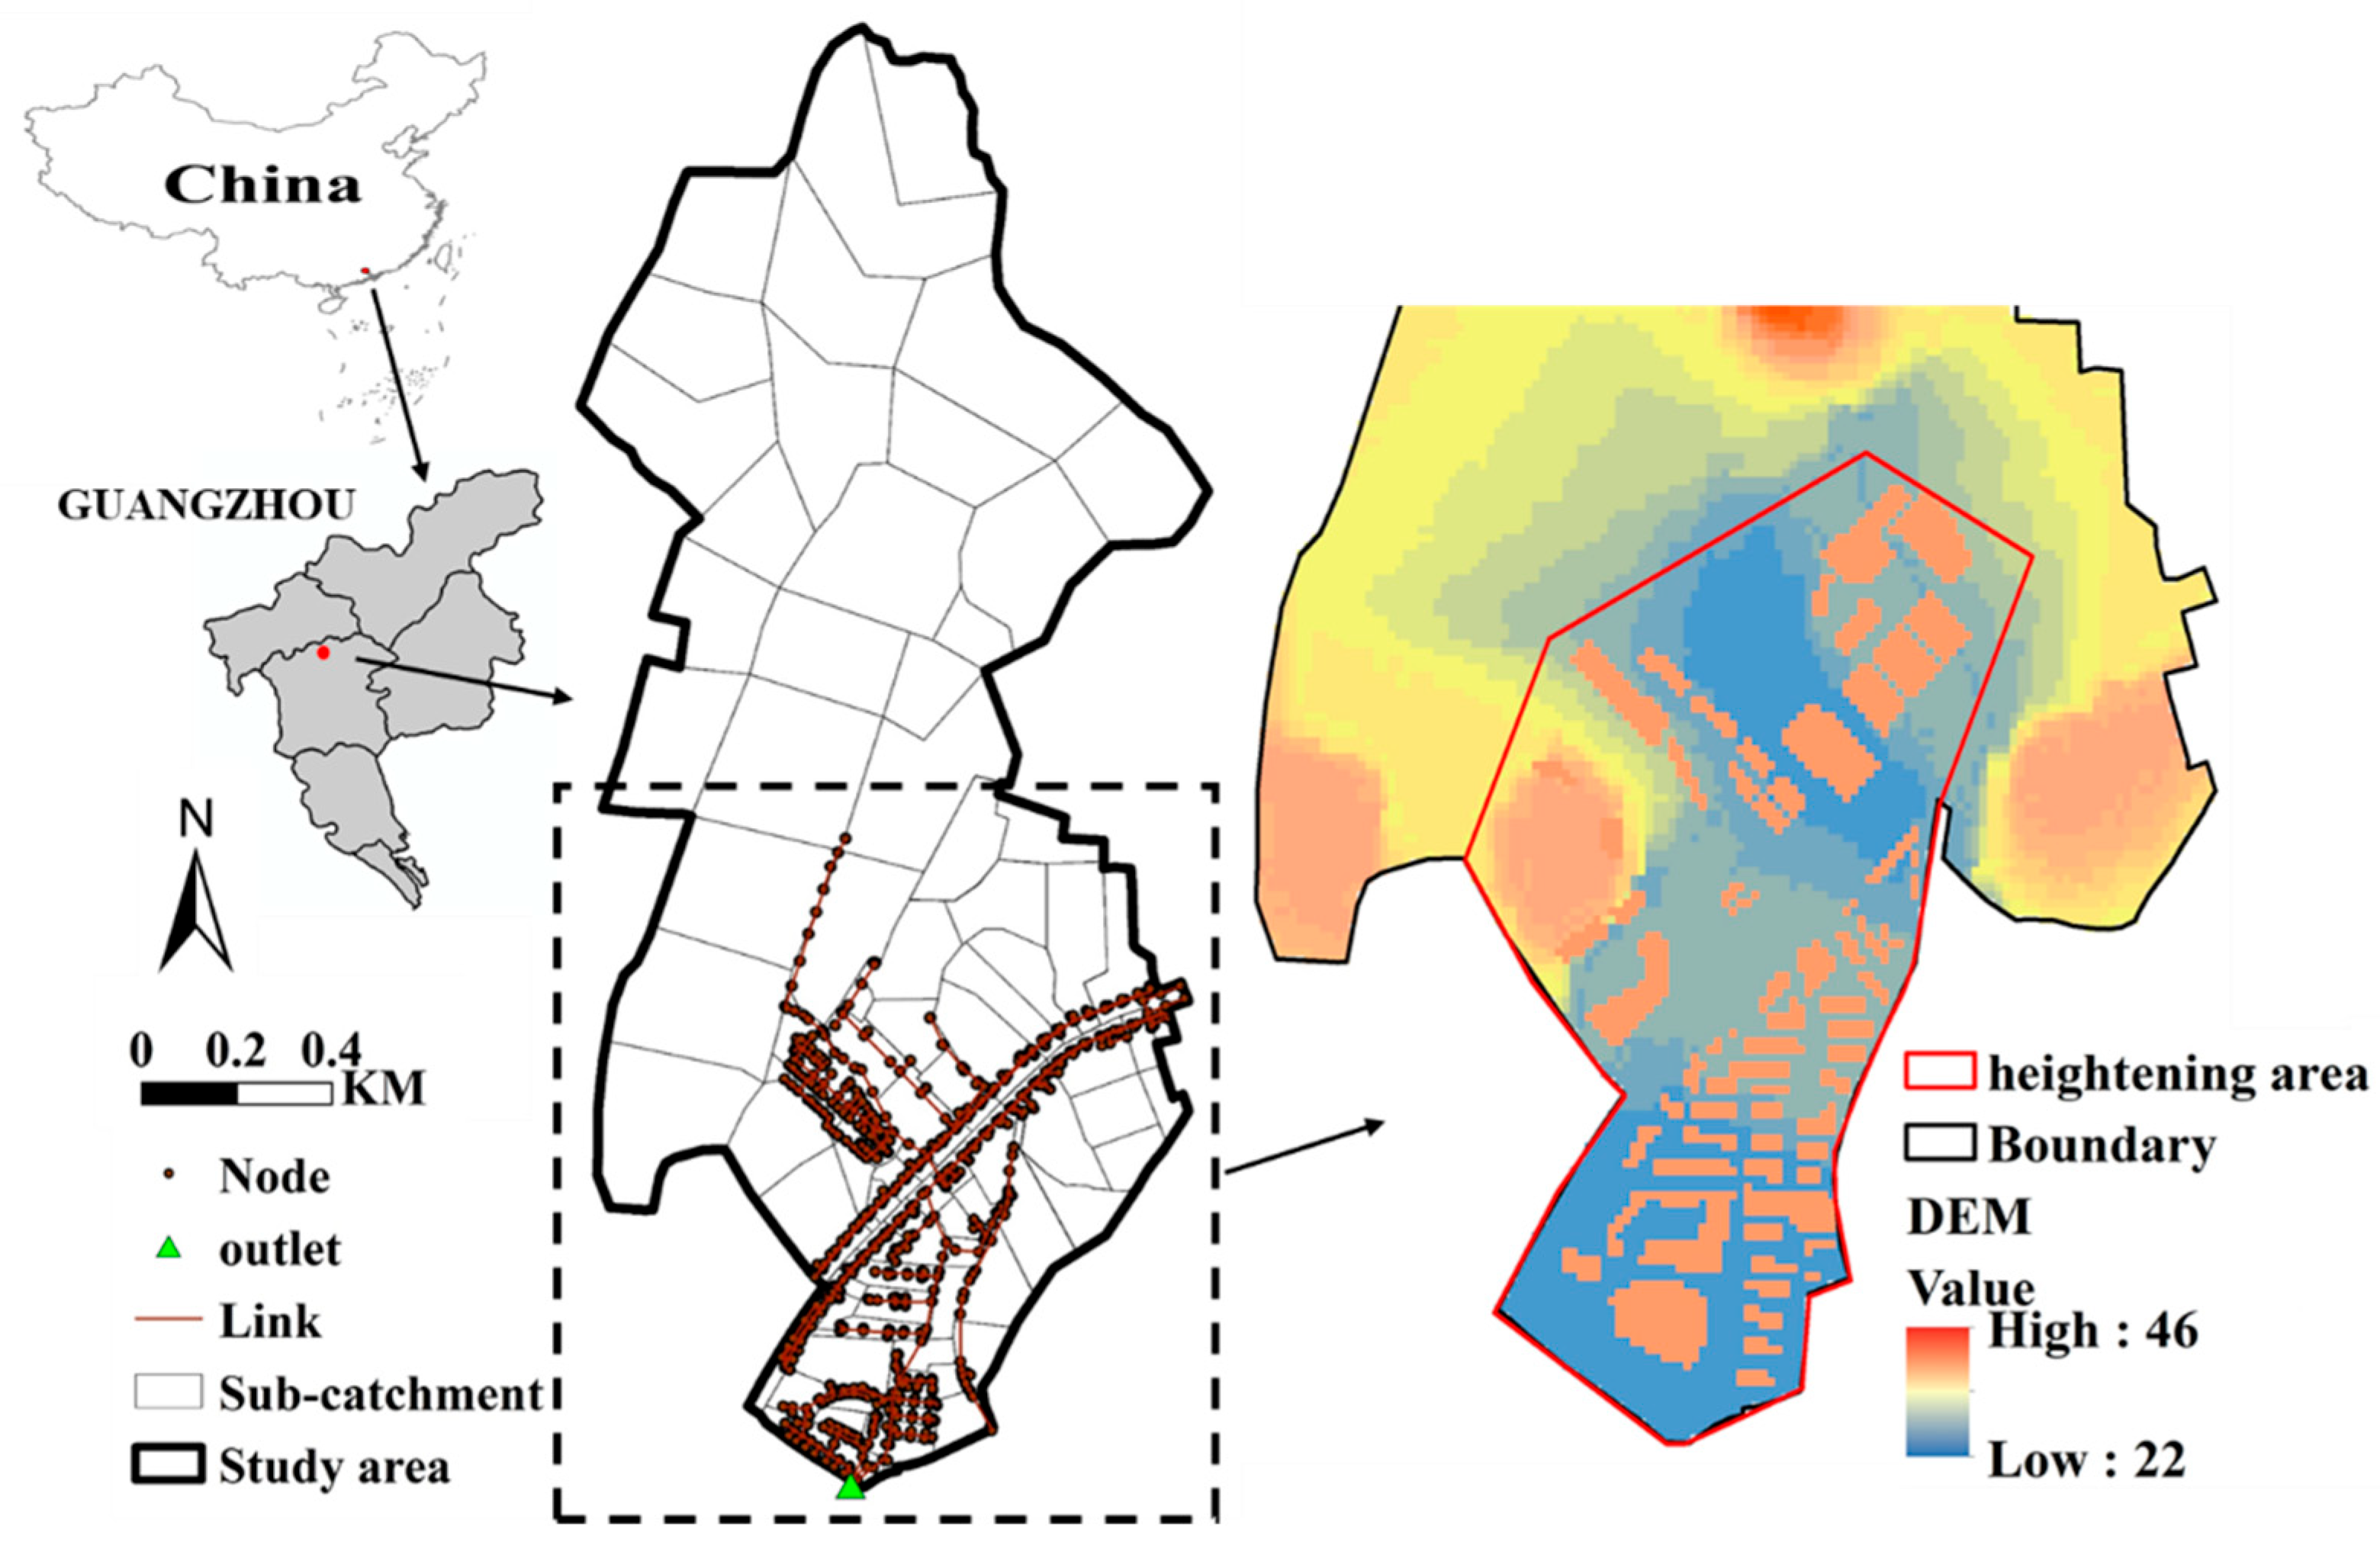
Figure 1. Location and elevation of the study area.
Sustainability 16 06417 g001
Figure 2. Designed storm time series. (a) Group I, r = 0.2; (b) Group II, r = 0.48; (c) Group III, r = 0.8.
Sustainability 16 06417 g002
Figure 3. Locations of infrastructure: (a) green roof; (b) permeable pavement; (c) multi-functional storage space.
Sustainability 16 06417 g003
Figure 4. Comparison between measured and calculated data: (a) rainfall of “7 June 2018”; (b) rainfall of “28 August 2018”.
Sustainability 16 06417 g004
Figure 5. Simulated inundation results: (a) simulated result of “7 June 2018”; (b) simulated result of “28 August 2018”.
Sustainability 16 06417 g005
Figure 6. Impact of changes in rainfall intensity on flooding, LID, and MFS practices: (a) changes in maximum inundation area; (b) changes in total accumulated water volume over 3 h; (c) changes in maximum inundation depth.
Sustainability 16 06417 g006
Figure 7. Impact of changes in rainfall peak coefficient on flooding, LID, and MFS practices: (a,d) changes in maximum inundation area; (b,e) changes in total accumulated water volume over 3 h; (c,f) changes in maximum inundation depth; ((ac) show 10-year results and (df) show 20-year results).
Sustainability 16 06417 g007
Figure 8. Reduction rates of diverse practices under different rainfall scenarios.
Sustainability 16 06417 g008
Table 1. Land uses of different practice designs in the study area.
Land-Use TypeTraffic PavementBuildingOpen SpaceStudy Area
Area/hm27.7523.1218.87155.83
ScenariosPermeable pavementGreen roofMFSALL
Layout area of facilities/hm22.350.594.397.32
Facility layout ratio/%30.262.5323.2414.71
Table 2. Parameter values of practice designs.
LayerParameterUnitTraditional LIDMulti-Functional Storage Space
Green RoofPermeable Pavement
SurfaceBerm heightmm505500
Vegetative volume fraction 0.1500
Surface roughness 0.240.150.15
Surface slope 110
SoilThicknessmm150--
Porosity 0.5--
Field capacity 0.1--
Wilting Point 0.05--
Conductivitymm/h30--
Conductivity slope 5--
Suction headmm60--
PavementThicknessmm-100-
Void ratio -0.15-
Permeabilitymm/h-150-
StorageThicknessmm-3003000
Void ratio -0.70.75
Seepage ratemm/h-88
Storage DrainDrain coefficient -0.330.56
Drain exponent -0.50.5
Drain offset heightmm-1010
Drainage MatThicknessmm50--
Void fraction 0.5--
Roughness 0.1--
Table 3. Simulation results of the current scenario (Base) under different rainfall scenarios.
Return PeriodMaximum Inundation Area/hm2Total Accumulated Water Volume over 3 h/106 LMaximum Inundation Depth/m
r = 0.2r = 0.48r = 0.8r = 0.2r = 0.48r = 0.8r = 0.2r = 0.48r = 0.8
1-year
(67.43 mm)
0.921.591.900.510.821.000.5320.5790.612
5-year
(92.55 mm)
4.024.354.453.515.176.970.7451.2001.203
10-year
(103.37 mm)
4.494.805.925.928.4511.181.2271.2501.258
20-year
(114.19 mm)
5.926.736.8310.1911.9612.681.2691.3031.319
50-year
(128.49 mm)
7.327.827.9712.1313.4114.491.3221.3491.380
Table 4. Summary of simulation results under diverse scenarios.
Return PeriodScenarioMaximum Inundation Area/hm2Total Accumulated Water Volume over 3 h/106 LMaximum Inundation Depth/m
r = 0.2r = 0.48r = 0.8r = 0.2r = 0.48r = 0.8r = 0.2r = 0.48r = 0.8
1-yearBase0.921.591.900.510.821.000.5320.5790.612
MFS0.170.570.770.000.030.110.0900.1400.282
ALL0.160.210.590.000.000.070.0520.1200.162
LID0.591.171.590.390.670.840.4930.5540.594
5-yearBase4.024.354.453.515.176.970.7451.2001.203
MFS3.213.623.771.622.994.310.5510.5910.609
ALL2.753.513.741.202.633.930.5310.5860.606
LID3.804.354.453.084.936.620.7291.1951.203
10-yearBase4.494.805.925.928.4511.181.2271.2501.258
MFS3.774.154.272.946.087.680.5910.6190.633
ALL3.344.054.342.405.298.140.5830.6130.633
LID4.384.745.835.358.0611.171.2201.2461.257
20-yearBase5.926.736.8310.1911.9612.681.2691.3031.319
MFS4.225.595.736.8210.6011.360.6140.6400.648
ALL4.305.765.807.4811.0711.740.6100.6370.647
LID5.866.536.7610.3011.6712.631.2661.2981.317
50-yearBase7.327.827.9712.1313.4114.491.3221.3491.380
MFS5.926.386.8210.9512.2113.840.6450.6940.718
ALL6.166.426.8311.3512.3513.850.6370.6690.718
LID7.297.787.9512.1313.3314.391.3171.3461.378
Disclaimer/Publisher’s Note: The statements, opinions and data contained in all publications are solely those of the individual author(s) and contributor(s) and not of MDPI and/or the editor(s). MDPI and/or the editor(s) disclaim responsibility for any injury to people or property resulting from any ideas, methods, instructions or products referred to in the content.