Enhancing Forest Site Classification in Northwest Portugal: A Geostatistical Approach Employing Cokriging
Abstract
1. Introduction
2. Materials and Methods
2.1. Study Site
2.2. Inventory Data Collection
2.3. Aerial Data Collection and Variable Selection
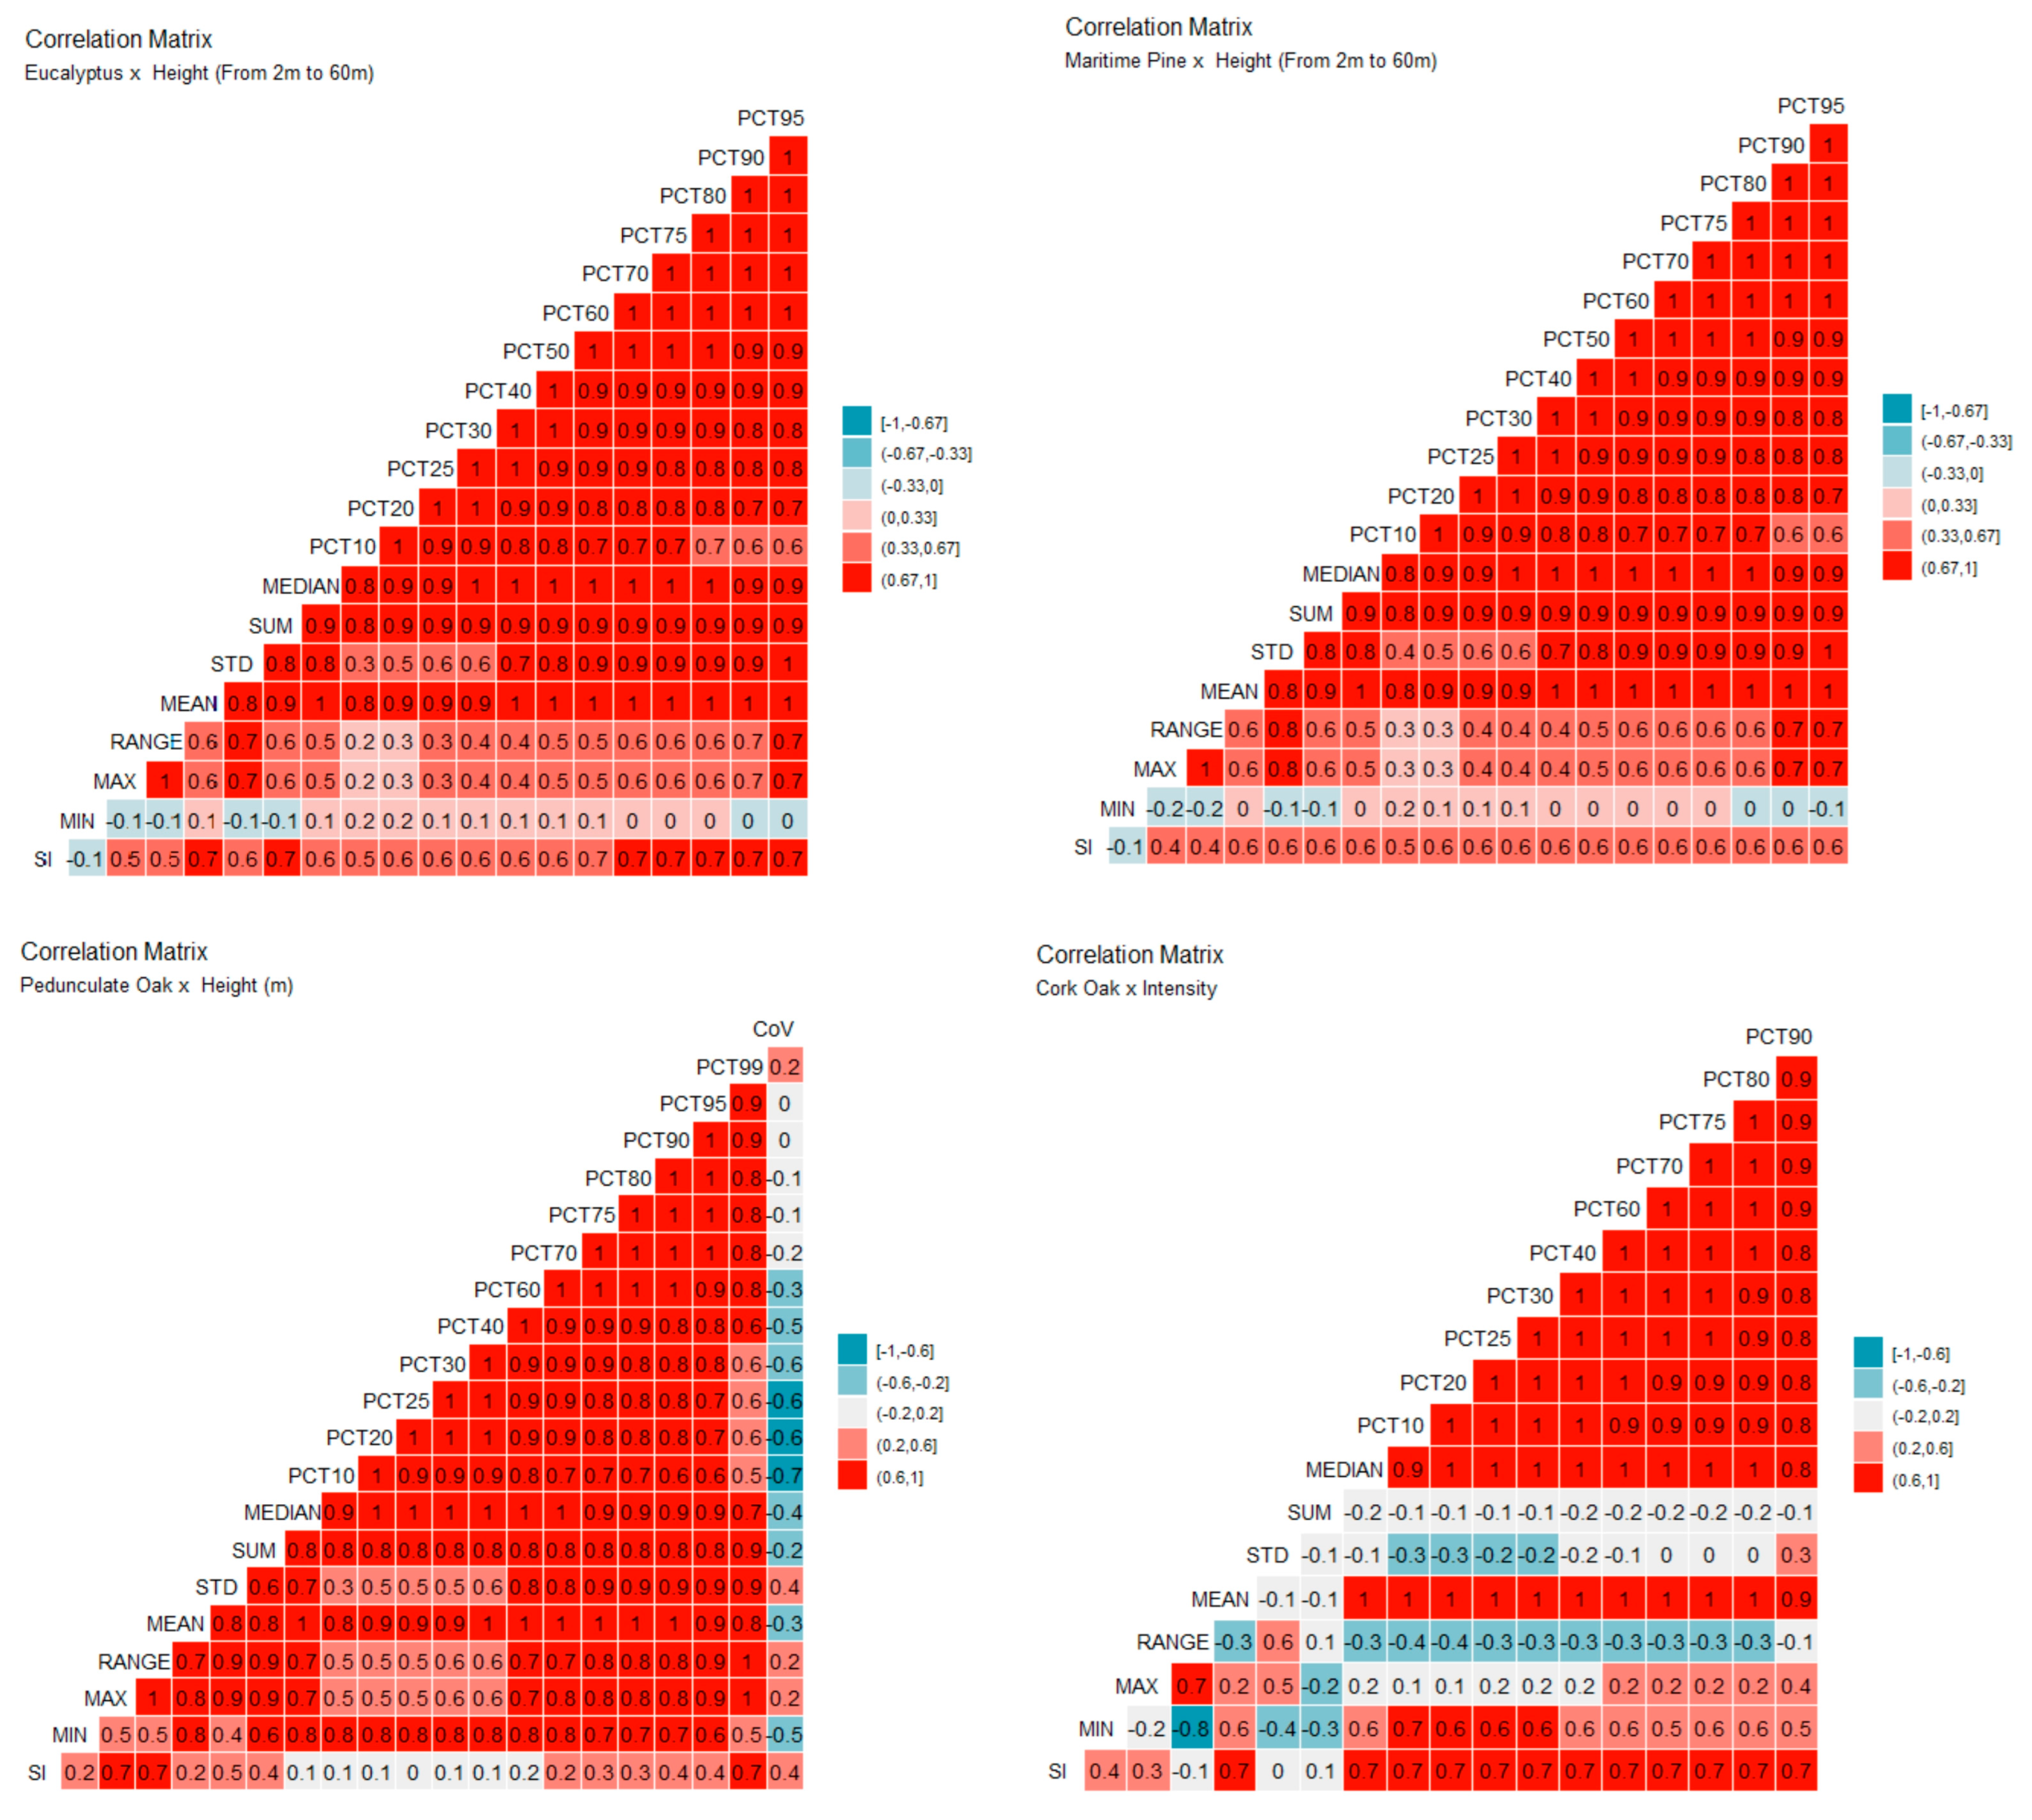
2.4. Inventory and LiDAR Exploratory Data Analysis
2.5. Cokriging Predictor
3. Results and Analysis
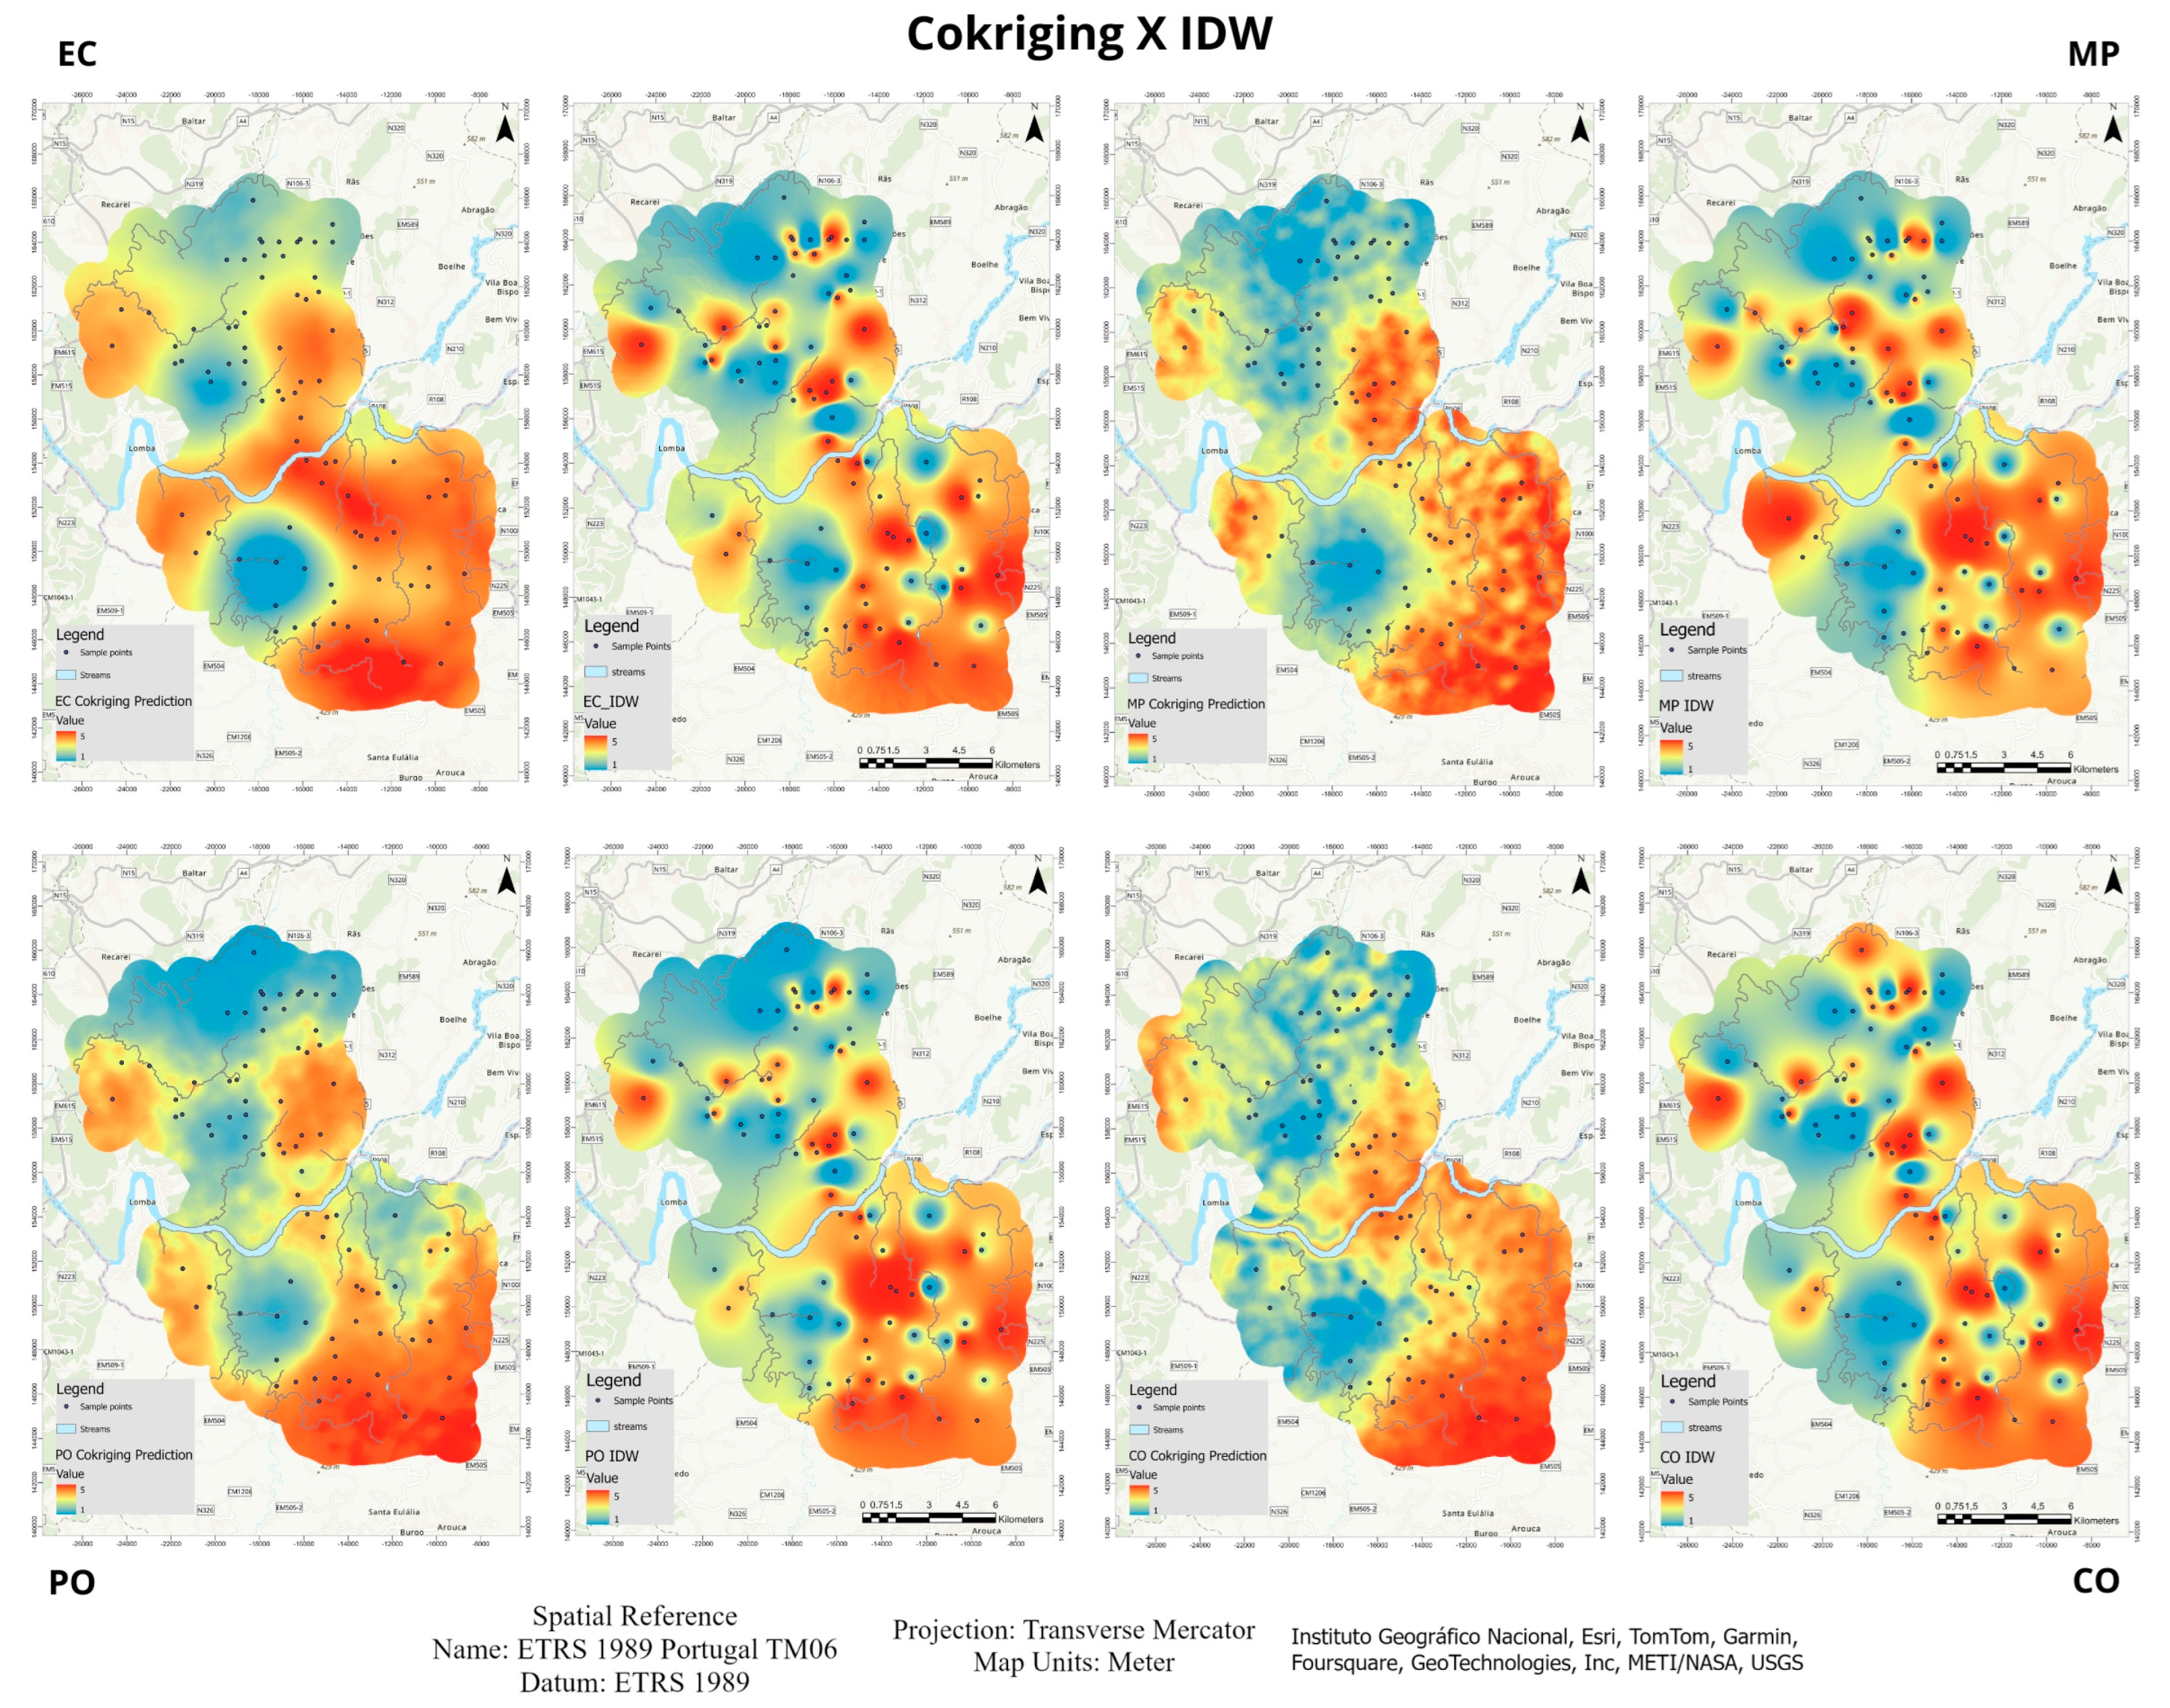
Cokriging Results
4. Conclusions
Author Contributions
Funding
Institutional Review Board Statement
Informed Consent Statement
Data Availability Statement
Conflicts of Interest
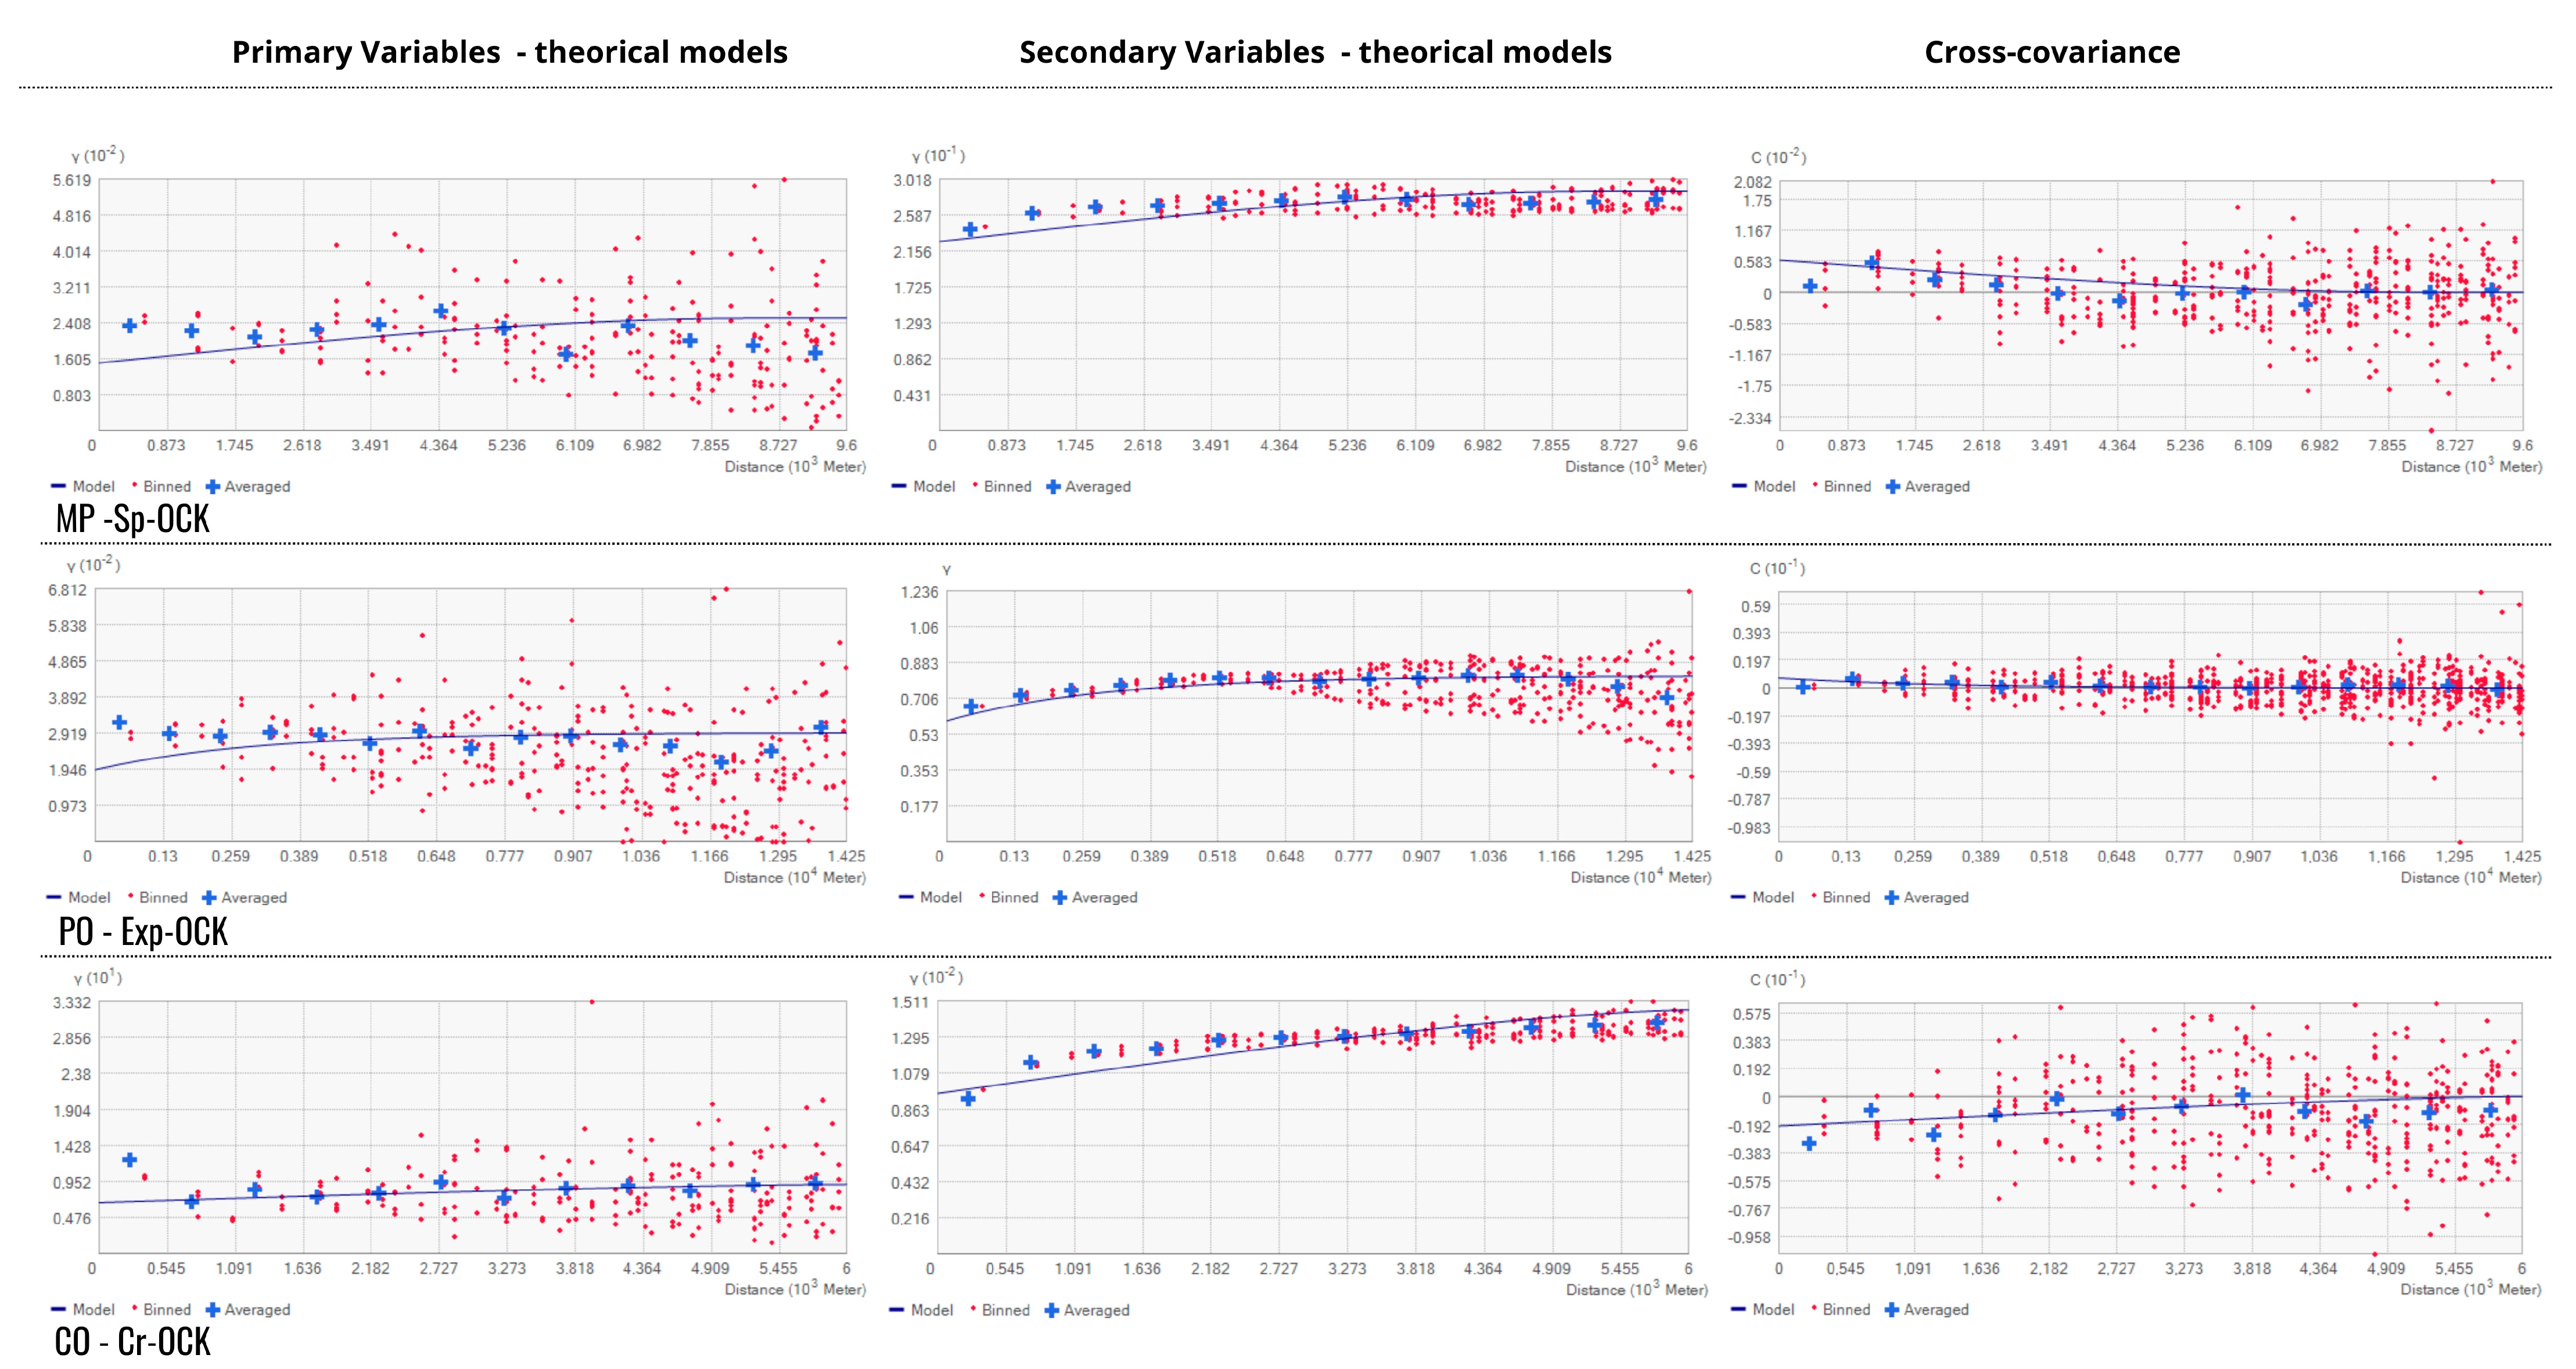
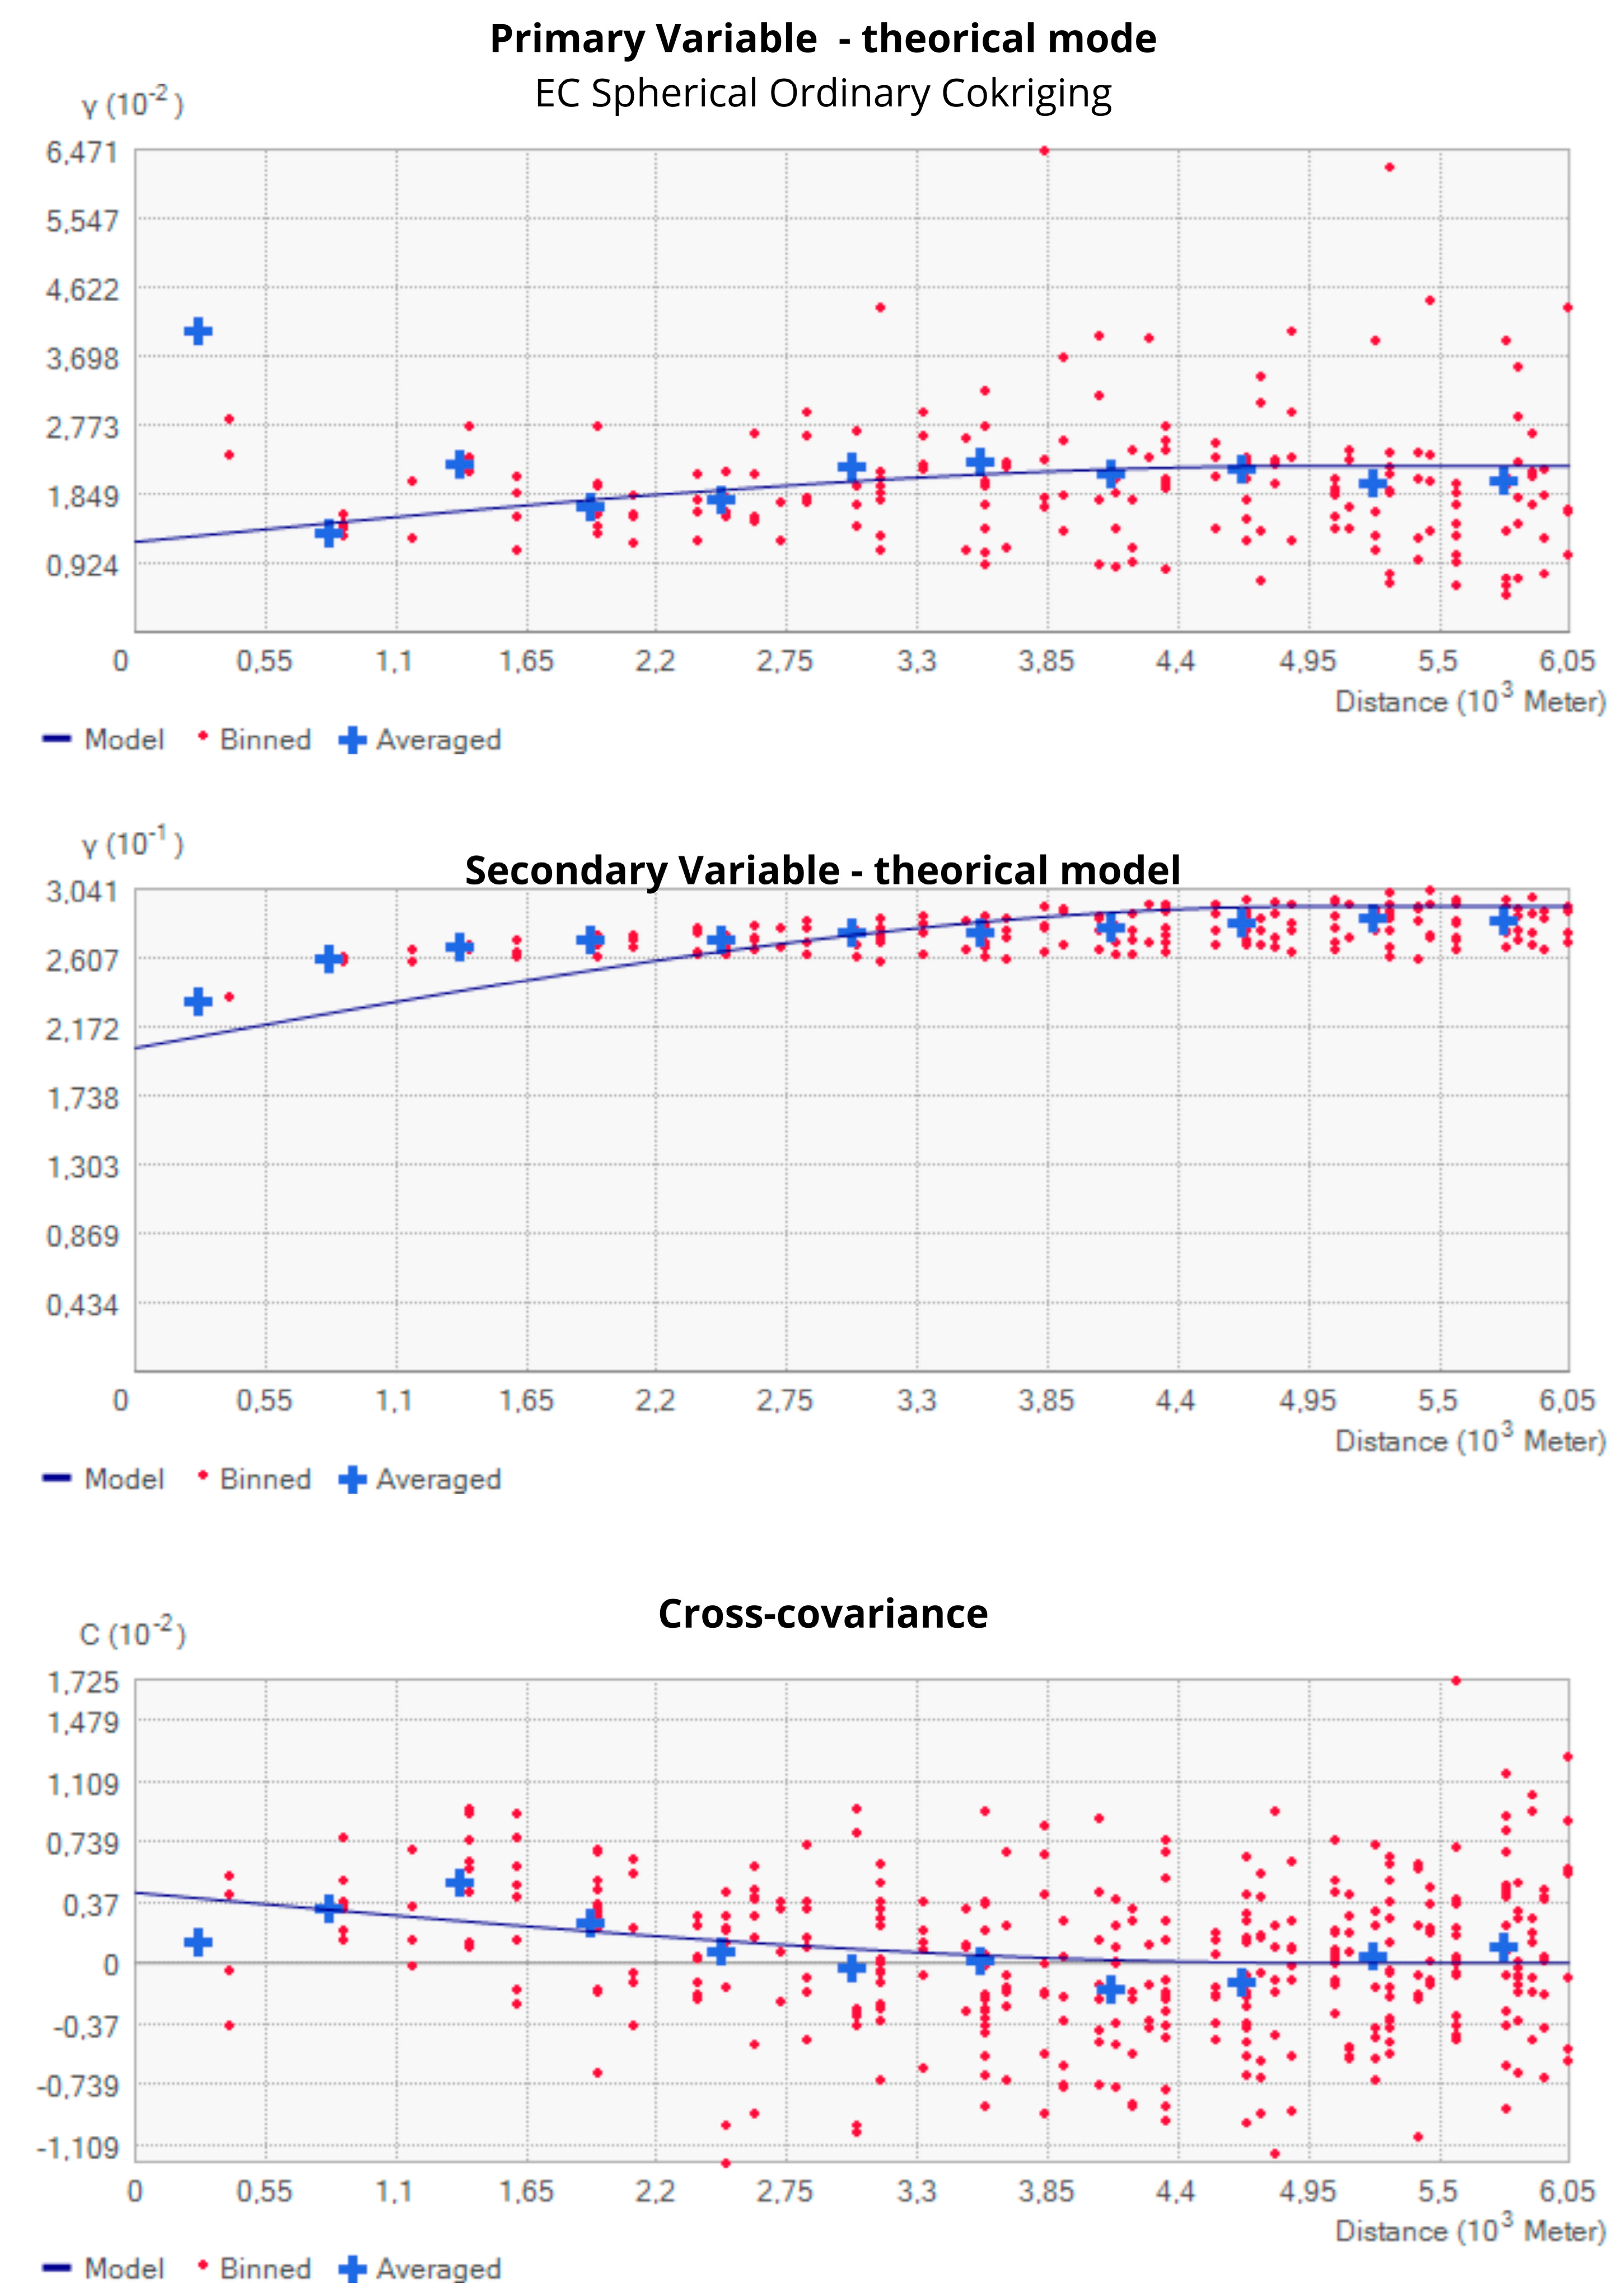
Appendix A. Cokriging Theorical Models and Cross-Covariance

References
- Carmean, W.H. Forest Site Quality Evaluation in The United States. Adv. Agron. 1975, 27, 209–269. [Google Scholar] [CrossRef]
- Cunha Neto, E.M.D.; Veras, H.F.P.; Moura, M.M.; Berti, A.L.; Sanquetta, C.R.; Pelissari, A.L.; Corte, A.P.D. Combining ALS and UAV to Derive the Height of Araucaria angustifolia. Acad. Bras. Cienc. 2023, 95, e20201503. [Google Scholar] [CrossRef] [PubMed]
- Teodoro, A.; Amaral, A. A Statistical and Spatial Analysis of Portuguese Forest Fires in Summer 2016 Considering Landsat 8 and Sentinel 2A Data. Environments 2019, 6, 36. [Google Scholar] [CrossRef]
- Corte, A.P.D.; Souza, D.V.; Rex, F.E.; Sanquetta, C.R.; Mohan, M.; Silva, C.A.; Zambrano, A.M.A.; Prata, G.; Alves de Almeida, D.R.; Trautenmüller, J.W.; et al. Forest Inventory with High-Density UAV-Lidar: Machine Learning Approaches for Predicting Individual Tree Attributes. Comput. Electron. Agric. 2020, 179, 105815. [Google Scholar] [CrossRef]
- Coops, N.C.; Tompalski, P.; Goodbody, T.R.H.; Queinnec, M.; Luther, J.E.; Bolton, D.K.; White, J.C.; Wulder, M.A.; van Lier, O.R.; Hermosilla, T. Modelling Lidar-Derived Estimates of Forest Attributes over Space and Time: A Review of Approaches and Future Trends. Remote Sens. Environ. 2021, 260, 112477. [Google Scholar] [CrossRef]
- 6Toivonen, J.; Kangas, A.; Maltamo, M.; Kukkonen, M.; Packalen, P. Assessing Biodiversity Using Forest Structure Indicators Based on Airborne Laser Scanning Data. Ecol. Manag. 2023, 546, 121376. [Google Scholar] [CrossRef]
- Xie, Y.; Hirabayashi, S.; Hashimoto, S.; Shibata, S.; Kang, J. Exploring the Spatial Pattern of Urban Forest Ecosystem Services Based on I-Tree Eco and Spatial Interpolation: A Case Study of Kyoto City, Japan. Environ. Manag. 2023, 72, 991–1005. [Google Scholar] [CrossRef] [PubMed]
- Kalivas, D.P.; Kollias, V.J.; Apostolidis, E.H. Evaluation of Three Spatial Interpolation Methods to Estimate Forest Volume in the Municipal Forest of the Greek Island Skyros. Geo-Spat. Inf. Sci. 2013, 16, 100–112. [Google Scholar] [CrossRef]
- Shukla, K.; Kumar, P.; Mann, G.S.; Khare, M. Mapping Spatial Distribution of Particulate Matter Using Kriging and Inverse Distance Weighting at Supersites of Megacity Delhi. Sustain. Cities Soc. 2020, 54, 101997. [Google Scholar] [CrossRef]
- Yamamoto, J.K. Estatística, Análise e Interpolação de Dados Geoespaciais, 1st ed.; Gráfica Paulos: São Paulo, Brazil, 2020; ISBN 978-65-990727-2-7. [Google Scholar]
- Li, W.; Niu, Z.; Liang, X.; Li, Z.; Huang, N.; Gao, S.; Wang, C.; Muhammad, S. Geostatistical Modeling Using LiDAR-Derived Prior Knowledge with SPOT-6 Data to Estimate Temperate Forest Canopy Cover and above-Ground Biomass via Stratified Random Sampling. Int. J. Appl. Earth Obs. Geoinf. 2015, 41, 88–98. [Google Scholar] [CrossRef]
- Soma, M.; Pimont, F.; Allard, D.; Fournier, R.; Dupuy, J.L. Mitigating Occlusion Effects in Leaf Area Density Estimates from Terrestrial LiDAR through a Specific Kriging Method. Remote Sens. Environ. 2020, 245, 111836. [Google Scholar] [CrossRef]
- Filho, A.M.; Netto, S.P.; Machado, S.A.; Corte, A.P.D.; Behling, A. Site Classification for Eucalyptus Sp. in a Tropical Region of Brazil. Acad. Bras. Cienc. 2023, 95. [Google Scholar] [CrossRef]
- Adeli, A.; Dowd, P.; Emery, X.; Xu, C. Using Cokriging to Predict Metal Recovery Accounting for Non-Additivity and Preferential Sampling Designs. Min. Eng. 2021, 170, 106923. [Google Scholar] [CrossRef]
- Goovaerts, P. Geostatistical Approaches for Incorporating Elevation into the Spatial Interpolation of Rainfall. J. Hydrol. 2000, 228, 113–129. [Google Scholar] [CrossRef]
- Goovaerts, P. Ordinary Cokriging Revisited. Math. Geol. 1998, 30, 21–42. [Google Scholar] [CrossRef]
- Payares-Garcia, D.; Osei, F.; Mateu, J.; Stein, A. A Poisson Cokriging Method for Bivariate Count Data. Spat. Stat. 2023, 57, 100769. [Google Scholar] [CrossRef]
- Instituto da Conservação da Natureza e das Florestas. IFN6—Anexo Técnico; Instituto da Conservação da Natureza e das Florestas: Lisboa, Portugal, 2019. [Google Scholar]
- Marques, M.; Juerges, N.; Borges, J.G. Appraisal Framework for Actor Interest and Power Analysis in Forest Management—Insights from Northern Portugal. Policy Econ. 2020, 111, 102049. [Google Scholar] [CrossRef]
- EUR-Lex. DIRECTIVA 92/43/CEE DO CONSELHO Relativa à Preservação Dos Habitats Naturais e Da Fauna e Da Flora Selvagens; Comunidade Económica Europeia: Bruxelas, Belgium, 1992; Available online: https://eur-lex.europa.eu/legal-content/PT/TXT/?uri=celex%3A31992L0043 (accessed on 5 March 2024).
- Florestas. ICNF-8o RELATÓRIO PROVISÓRIO DE INCÊNDIOS RURAIS—Direção Nac. De Gestão Do Programa De Fogos Rurais. 2023. Available online: https://icnf.pt/florestas/flestudosdocumentosestatisticasindicadores (accessed on 18 January 2024).
- Marques, M.; Reynolds, K.M.; Marto, M.; Lakicevic, M.; Caldas, C.; Murphy, P.J.; Borges, J.G. Multicriteria Decision Analysis and Group Decision-Making to Select Stand-Level Forest Management Models and Support Landscape-Level Collaborative Planning. Forests 2021, 12, 399. [Google Scholar] [CrossRef]
- Pavani-Biju, B.; Borges, J.G.; Marques, S.; Teodoro, A.C. Fire Risk Analysis Based on a Neural Network Framework and Remote Sensing Data; Manuscript in Preparation; Faculty of Science: Porto, Portugal, 2024. [Google Scholar]
- Marques, S. Guia de Campo—Inventário Florestal; Unpublished Work; Forest Research Centre and Associate Laboratory Terra, School of Agriculture, University of Lisbon: Lisboa, Portugal, 2022. [Google Scholar]
- FIRE-RES—Innovative Solutions for Fire Resilient Territories in Europe—FIRE RES. Available online: https://fire-res.eu/ (accessed on 5 June 2024).
- Sánchez-González, M.; Tomé, M.; Montero, G. Modelling Height, and Diameter Growth of Dominant Cork Oak Trees in Spain. Ann. Sci. 2005, 62, 633–643. [Google Scholar] [CrossRef]
- Barrio Anta, M.; Diéguez-Aranda, U. Site Quality of Pedunculate Oak (Quercus robur L.) Stands in Galicia (Northwest Spain). Eur. J. Res. 2005, 124, 19–28. [Google Scholar] [CrossRef]
- Chen, Y.; Zhu, X. Site Quality Assessment of a Pinus Radiata Plantation in Victoria, Australia, Using LiDAR Technology. South. For. J. For. Sci. 2012, 74, 217–227. [Google Scholar] [CrossRef]
- RStudio Team. RStudio: Integrated Development for R; RStudio, PBC: Boston, MA, USA, 2020; Available online: http://www.rstudio.com/ (accessed on 10 January 2024).
- Woods, M.; Lim, K.; Treitz, P. Predicting Forest Stand Variables from LiDAR Data in the Great Lakes—St. Lawrence Forest of Ontario. For. Chron. 2008, 84, 827–839. [Google Scholar] [CrossRef]
- Wackernagel, H. Cokriging versus Kriging in Regionalized Multivariate Data Analysis. Geoderma 1994, 62, 83–92. [Google Scholar] [CrossRef]
- Packalen, P.; Strunk, J.; Packalen, T.; Maltamo, M.; Mehtätalo, L. Resolution Dependence in an Area-Based Approach to Forest Inventory with Airborne Laser Scanning. Remote Sens. Environ. 2019, 224, 192–201. [Google Scholar] [CrossRef]
- Stein, A.; Corsten, L.C.A. Universal Kriging and Cokriging as a Regression Procedure. Biometrics 1991, 47, 575. [Google Scholar] [CrossRef]
- Camargo, E.; Druck, S.; Câmara, G. Análise de Superfícies Por Geoestatística Linear. In Análise Espacial de Dados Geográficos; Druck, S., Carvalho, M., Câmara, G., Monteiro, A.M.V., Eds.; EMBRAPA: Brasília, Brazil, 2004; ISBN 85-7383-260-6. [Google Scholar]
- Webster, R.; Oliver, M.A. Geostatistics for Environmental Scientists; Wiley: Hoboken, NJ, USA, 2007; ISBN 9780470028582. [Google Scholar]
- McKinley, J.M.; Atkinson, P.M. A Special Issue on the Importance of Geostatistics in the Era of Data Science. Math. Geosci. 2020, 52, 311–315. [Google Scholar] [CrossRef]
- Helterbrand, J.D.; Cressie, N. Universal Cokriging under Intrinsic Coregionalization. Math. Geol. 1994, 26, 205–226. [Google Scholar] [CrossRef]
- Stein, A. Spatial Interpolation of Soil Moisture Data with Universal Cokriging. In Geostatistics Tróia ’92; Soares, A., Ed.; Quantitative Geology and Geostatistics; Springer: Dordrecht, The Netherlands, 1993; Volume 5, pp. 841–852. ISBN 978-94-011-1739-5. [Google Scholar]
- Johnston, K.; Ver Hoef, J.M.; Krivoruchko, K.; Lucas, N. ArcGIS ® 9 Using ArcGIS ® Geostatistical Analyst; Environmental Systems Research Institute, Ed.; ESRI Press: Redlands, CA, USA, 2001; ISBN 978-1589481060. [Google Scholar]
- Felgueiras, C.; Celso, E.; Felgueiras, C.A.; Ortiz, J.O.; Camargo, E.C.G. Application of Geostatistical Conflation Techniques to Improve the Accuracy of Digital Elevation Models. GeoInfo 2014, 2014, 149–155. [Google Scholar]
- Gorgens, E.B.; Silva, A.G.P.; Rodriguez, L.C.E. LiDAR: Aplicações Florestais, 1st ed.; CRV: Curitiba, Brazil, 2014; ISBN 978-85-4440-105-7. [Google Scholar]
- Guedes, L.P.C.; Bach, R.T.; Uribe-Opazo, M.A. Nugget Effect Influence on Spatial Variability of Agricultural Data. Eng. Agric. 2020, 40, 96–104. [Google Scholar] [CrossRef]
- Amaral, L.R.; Justina, D.D.D. Spatial Dependence Degree and Sampling Neighborhood Influence on Interpolation Process for Fertilizer Prescription Maps. Eng. Agric. 2019, 39, 85–95. [Google Scholar] [CrossRef]
- Paz-Ferreiro, J.; Vázquez, E.V.; Vieira, S.R. Geostatistical Analysis of a Geochemical Dataset. Bragantia 2010, 69, 121–129. [Google Scholar] [CrossRef]
- Alegria, C.; Roque, N.; Albuquerque, T.; Gerassis, S.; Fernandez, P.; Ribeiro, M.M. Species Ecological Envelopes under Climate Change Scenarios: A Case Study for the Main Two Wood-Production Forest Species in Portugal. Forests 2020, 11, 880. [Google Scholar] [CrossRef]
- Vaz da Rocha, P.; José Gomes de Araújo, E.; Augusto Morais, V.; Antonio Monte, M.; Henrique dos Santos Ataíde, D.; Candido Silva, L. Site index in eucalyptus stands applying ordinary kriging: An approach with different models and methods of classification. Floresta 2021, 51, 1000–1009. [Google Scholar] [CrossRef]
- Raimundo, M.R.; Scolforo, H.F.; de Mello, J.M.; Scolforo, J.R.S.; McTague, J.P.; dos Reis, A.A. Geostatistics Applied to Growth Estimates in Continuous Forest Inventories. For. Sci. 2017, 63, 29–38. [Google Scholar] [CrossRef]


| SI Class | Eucalyptus (EC) (m) | Maritime Pine (MP) (m) | Pedunculate Oak (PO) (m) | Cork Oak (CO) (m) |
|---|---|---|---|---|
| 1 | <13 | <14 | <7 | <6 |
| 2 | 16 | 18 | 12 | 8 |
| 3 | 19 | 22 | 17 | 10 |
| 4 | 21 | 24 | 22 | 12 |
| 5 | 23 | 26 | 27 | 14 |
| LiDAR Parameter | Metrics | Description |
|---|---|---|
| Height | Zmin, Zmax, Zmean, Zmedian, Zmode, Zsd, Zcv, Zskew, Zkurt, Z10, Z20, Z25, Z30, Z40, Z50, Z60, Z70, Z75, Z80, Z90, Z95 | Minimum height, maximum height, average height, median height, mode height, standard deviation height, kurtosis height, 10 to 95th percentile height |
| Intensity of returns | Imin, Imax, Imean, Imedian, Imode, Isd, Zcv, Iskew, Ikurt, I10, I20, I25, I30, I40, I50, I60, I70, I75, I80, I90, I95 | Minimum intensity, maximum intensity, average intensity, median intensity, mode intensity, standard deviation intensity, kurtosis intensity, 10 to 99th percentile intensity |
| Density | Zpcum (x = 1…9) (%) | Cumulative percentage of return in the xth layer, according to Woods et al. [30] |
| CC | Canopy density (%) | |
| OverAllD (x = 1...9) (%) Height (2 to 60 m) | Overall relative density, the fraction of points in each height stratum compared to the total number of points in each cell | |
| NormRD (x = 1…9) (%) Height (2 to 60 m) | The normalized relative density is the number of points in each stratum divided by the total number of points within and below the stratum of interest |
| Variables | Min | Max | Q25 | Q75 | Mean | Median | Var | Sd |
|---|---|---|---|---|---|---|---|---|
| EC (m) | 8.28 | 30.04 | 12.74 | 20.22 | 16.7 | 15.29 | 26.51 | 5.14 |
| MP (m) | 5.75 | 23 | 8.62 | 12.34 | 11.48 | 10.8 | 20.26 | 4.50 |
| PO (m) | 3 | 18.16 | 7 | 11.6 | 9.25 | 7.85 | 23.30 | 4.83 |
| CO (m) | 2 | 18.15 | 4.62 | 9.08 | 7.29 | 6.38 | 17.96 | 4.24 |
| EC-PCT80 | 5.19 | 25.14 | 8.29 | 14.65 | 11.48 | 10.25 | 25.12 | 5.01 |
| MP-PCT90 | 5.79 | 27.60 | 9 | 16.10 | 12.82 | 11.53 | 28.41 | 5.33 |
| PO-PCT99 | 6.96 | 35.73 | 13.74 | 23.28 | 18.90 | 19.32 | 36.94 | 6.09 |
| CO-Imean | 32,634.12 | 44,824.87 | 34,627.96 | 36,930.62 | 35,944.82 | 35,664.23 | 3,934,070 | 1984 |
| Species | Metric | Correlation Coefficient (CC) |
|---|---|---|
| Eucalyptus | Percentile 90 (PCT90) (m) | CC 0.64 (p < 0.05; 95%; Confidence Interval 0.33 to 0.82) |
| Maritime Pine | Percentile 80 (PCT80) (m) | CC 0.69 (p < 0.05; 95%; Confidence Interval 0.40 to 0.85) |
| Pedunculate Oak | Percentile 99 (PCT99) (m) | CC 0.66 (p < 0.05; 95%; Confidence Interval 0.01 to 0.92) |
| Cork Oak | MEAN (Imean) | CC 0.69 (p < 0.05; 95%; Confidence Interval 0.26 to 0.89) |
| Geostatistic Layer | Rank | Cokriging Method | RMSE | ME | ME STD | RMSE STD | ASE |
|---|---|---|---|---|---|---|---|
| Eucalyptus | 1 | Ordinary Kriging–Spherical | 2.75 m | 0.02 m | −0.01 | 1.01 | 2.75 m |
| 2 | Ordinary Kriging–Exponential | 2.78 m | 0.10 m | 0.02 | 1.00 | 2.80 m | |
| 3 | Ordinary Kriging–Circular | 2.75 m | 0.00 m | −0.02 | 1.05 | 2.66 m | |
| 4 | Simple Kriging–Exponential | 2.70 m | 0.06 m | 0.03 | 1.07 | 2.57 m | |
| 5 | Ordinary Kriging–Gaussian | 2.77 m | −0.03 m | −0.03 | 1.08 | 2.61 m | |
| 6 | Simple Kriging–Circular | 2.75 m | 0.07 m | 0.05 | 1.18 | 2.45 m | |
| 7 | Simple Kriging–Gaussian | 2.70 m | −0.01 m | 0.02 | 1.17 | 2.37 m | |
| 8 | Simple Kriging–Spherical | 2.72 m | 0.06 m | 0.05 | 1.19 | 2.37 m | |
| Maritime Pine | 1 | Ordinary Kriging–Spherical | 2.83 m | 0.02 m | 0.00 | 1.01 | 2.83 m |
| 2 | Ordinary Kriging–Exponential | 2.91 m | 0.13 m | 0.03 | 1.01 | 2.92 m | |
| 3 | Ordinary Kriging–Gaussian | 2.80 m | −0.06 m | −0.03 | 1.03 | 2.77 m | |
| 4 | Simple Kriging–Spherical | 2.71 m | 0.05 m | 0.03 | 1.02 | 2.66 m | |
| 5 | Ordinary Kriging–Exponential | 2.79 m | 0.01 m | 0.00 | 1.08 | 2.61 m | |
| 6 | Simple Kriging–Circular | 2.78 m | 0.05 m | 0.05 | 1.13 | 2.50 m | |
| 7 | Simple Kriging–Gaussian | 2.79 m | 0.04 m | 0.05 | 1.18 | 2.39 m | |
| 8 | Simple Kriging–Exponential | 2.84 m | 0.13 m | 0.10 | 1.22 | 2.42 m | |
| Pedunculate Oak | 1 | Ordinary Kriging–Exponential | 3.13 m | 0.04 m | 0.00 | 1.00 | 3.13 m |
| 2 | Ordinary Kriging–Spherical | 3.14 m | 0.01 m | −0.01 | 1.00 | 3.16 m | |
| 3 | Ordinary Kriging–Gaussian | 3.12 m | −0.03 m | −0.02 | 0.99 | 3.17 m | |
| 4 | Simple Kriging–Gaussian | 3.10 m | −0.07 m | −0.01 | 1.03 | 3.03 m | |
| 5 | Simple Kriging–Exponential | 3.08 m | 0.01 m | 0.01 | 1.04 | 2.98 m | |
| 6 | Simple Kriging–Spherical | 3.08 m | −0.02 m | 0.00 | 1.04 | 2.99 m | |
| 7 | Ordinary Kriging–Circular | 3.14 m | 0.02 m | −0.01 | 0.98 | 3.20 m | |
| 8 | Simple Kriging–Circular | 3.09 m | −0.02 m | 0.00 | 1.05 | 2.96 m | |
| Cork Oak | 1 | Ordinary Kriging–Circular | 2.87 m | 0.00 m | 0.00 | 1.01 | 2.86 m |
| 2 | Simple Kriging–Circular | 2.89 m | 0.09 m | 0.02 | 1.00 | 2.93 m | |
| 3 | Simple Kriging–Spherical | 2.90 m | 0.10 m | 0.02 | 1.00 | 2.94 m | |
| 4 | Simple Kriging–Gaussian | 2.91 m | 0.05 m | 0.01 | 1.01 | 2.92 m | |
| 5 | Simple Kriging–Exponential | 2.96 m | 0.15 m | 0.03 | 1.00 | 3.01 m | |
| 6 | Ordinary Kriging–Gaussian | 3.79 m | −0.02 m | −0.01 | 1.05 | 3.61 m | |
| 7 | Ordinary Kriging–Spherical | 3.83 m | −0.15 m | −0.04 | 1.08 | 3.56 m | |
| 8 | Ordinary Kriging–Exponential | 3.85 m | −0.18 m | −0.05 | 1.07 | 3.60 m |
| Species | Model | Variable | Sill | Partial Sill | Nugget Effect | Range (m) |
|---|---|---|---|---|---|---|
| EC | Sp-OCK | Variable 1 | 0.022 | 0.01 | 0.012 | 5500 |
| Covariance | - | 0.004 | - | |||
| Variable 2 | 0.29 | 0.09 | 0.2 | |||
| MP | Sp-OCK | Variable 1 | 0.026 | 0.01 | 0.016 | 9300 |
| Covariance | - | 0.01 | - | |||
| Variable 2 | 0.29 | 0.23 | 0.06 | |||
| PO | Exp-OCK | Variable 1 | 0.03 | 0.01 | 0.02 | 9000 |
| Covariance | - | 0.07 | - | |||
| Variable 2 | 0.81 | 0.22 | 0.59 | |||
| CO | Cir-OCK | Variable 1 | 9.15 | 2.4 | 6.75 | 6000 |
| Covariance | - | −0.02 | - | |||
| Variable 2 | 0.014 | 0.004 | 0.01 |
| Species | Interpolation Method | RMSE | ME | Min | Max | Mean | Sd | Accuracy Improvement |
|---|---|---|---|---|---|---|---|---|
| Eucalyptus | Simple Kriging–Spherical | 2.8 | 0.0 | 12.9 | 24.3 | 20 | 1.09 | 36.6% |
| IDW | 4.9 | 0.3 | 2 | 28.4 | 18.58 | 1.72 | ||
| Maritime Pine | Simple Kriging–Spherical | 2.8 | 0.0 | 13.8 | 23.5 | 22.8 | 0.9 | 62% |
| IDW | 6.5 | 0.5 | 13 | 50 | 20 | 2.37 | ||
| Pedunculate Oak | Ordinary Kriging–Exponential | 3.1 | 0.1 | 6.9 | 25.9 | 19.9 | 0.83 | 72% |
| IDW | 7.8 | 0.8 | 4.3 | 60 | 19.23 | 2.96 | ||
| Cork Oak | Ordinary Kriging–Circular | 2.9 | 0.0 | 5.92 | 14.8 | 11.42 | 0.85 | 43% |
| IDW | 4.2 | 0.2 | 3 | 28 | 19 | 1.49 |
| Study | Field Work Data Collection | Remote Sensing Data | Main Statistical Approach Used |
|---|---|---|---|
| Species Ecological Envelopes under Climate Change Scenarios: A Case Study for the Main Two Wood-Production Forest Species in Portugal [45] | The SIs for maritime pine (n = 744) and eucalyptus (n = 612) were calculated using measurements from National Forest Inventory Plots in pure stands | Climate variables and scenarios, elevation, and soil data (1 km × 1 km grid). COS is a thematic map of Portuguese land cover and land use from 2015 | Empirical models for SI assessment, SK, IDW, and Bayesian machine learning methods. Climate parameters were interpolated with IDW. |
| Site Index in Eucalyptus Stands Applying Ordinary Kriging: An Approach with Different Models and Methods of Classification [46] | Forest inventory plots (n = 170) for 2119 hectares | RS data were not used in this work | Algebraic difference methods (regression models) to estimate SI and ordinary kriging for spatialization. |
| Geostatistics Applied to Growth Estimates in Continuous Forest Inventories [47] | Continuous forest inventories (n = 89 plots) | RS data were not used in this work | Algebraic difference methods used for SI classification. Geostatistical approach used for Hdom stratification. |
Disclaimer/Publisher’s Note: The statements, opinions and data contained in all publications are solely those of the individual author(s) and contributor(s) and not of MDPI and/or the editor(s). MDPI and/or the editor(s) disclaim responsibility for any injury to people or property resulting from any ideas, methods, instructions or products referred to in the content. |
© 2024 by the authors. Licensee MDPI, Basel, Switzerland. This article is an open access article distributed under the terms and conditions of the Creative Commons Attribution (CC BY) license (https://creativecommons.org/licenses/by/4.0/).
Share and Cite
Pavani-Biju, B.; Borges, J.G.; Marques, S.; Teodoro, A.C. Enhancing Forest Site Classification in Northwest Portugal: A Geostatistical Approach Employing Cokriging. Sustainability 2024, 16, 6423. https://doi.org/10.3390/su16156423
Pavani-Biju B, Borges JG, Marques S, Teodoro AC. Enhancing Forest Site Classification in Northwest Portugal: A Geostatistical Approach Employing Cokriging. Sustainability. 2024; 16(15):6423. https://doi.org/10.3390/su16156423
Chicago/Turabian StylePavani-Biju, Barbara, José G. Borges, Susete Marques, and Ana C. Teodoro. 2024. "Enhancing Forest Site Classification in Northwest Portugal: A Geostatistical Approach Employing Cokriging" Sustainability 16, no. 15: 6423. https://doi.org/10.3390/su16156423
APA StylePavani-Biju, B., Borges, J. G., Marques, S., & Teodoro, A. C. (2024). Enhancing Forest Site Classification in Northwest Portugal: A Geostatistical Approach Employing Cokriging. Sustainability, 16(15), 6423. https://doi.org/10.3390/su16156423


