Abstract
The aim of this study is to analyze the impact of financial inclusion on green economic growth in developing countries. For this purpose, 12 developing countries were selected based on the availability of data: Armenia, Egypt, Ethiopia, India, Indonesia, Iran, Jamaica, Kenya, Pakistan, Sri Lanka, Thailand, and Tunisia. Annual data for the period from 2004 to 2023 were used for this study. The focus of this study is on the achievement of Sustainable Development Goal 13 (SDG 13), which requires immediate intervention to address the challenges of climate change and its consequences. This study used principal component analysis (PCA) to construct the financial inclusion index. In this study, we conducted a unit root analysis using the second-generation unit root test. For long-run estimates, we used the Fully Modified Least Squares (FMOLS) model. According to the findings of the study, green innovation (β = 0.052 *), foreign direct investment (β = 0.438 *), and trade openness (β = 0.016 **) have positive and significant impacts on green economic growth (GEG). The extent of the positive effect of foreign direct investment (FDI) is greater, compared to green innovation and trade openness (TR). The results also indicate that financial inclusion (β = −0.241) and population (β = −0.291) have significantly detrimental impacts on GEG. However, the population impacts GEG to a greater extent, compared to financial inclusion. Similarly, results indicate that the negative impact of financial inclusion on GEG is greater than the positive impact of green innovation on GEG. On the basis of the findings of this study, policymakers are advised to promote green innovation, foreign direct investment, and trade openness to promote green economic growth. Moreover, this study suggests that green finance or financial inclusion constrained by environmental quality should be promoted to safeguard environmental quality.
1. Introduction
Sustainable growth and climate mitigation are two primary global challenges. Developing nations are continuously working towards promoting environmental quality by reducing environmental risk, promoting well-being, and ensuring social equity. While the concept of green economic growth was introduced in 1970, it gained popularity among researchers in 2009. Green growth refers to sustainable growth that integrates environmental concerns with economic policies and practices. Green growth is affected mostly by air pollution, land pollution, fossil fuels, and greenhouse gases. The major factor that affects the green growth of any country is greenhouse gases because carbon dioxide emissions alone contribute 70% to environmental degradation [1,2,3]. The factors responsible for carbon dioxide emissions are population, urbanization, deforestation, and industrialization. The assessment carried out by the United Nations for the Asia Pacific region emphasized sustainable development through implementing comprehensive environmental policies and fostering economic growth subject to environmental limits. Similarly, the findings of the Economic and Social Commission for Asia and the Pacific emphasized sustainable economic growth through the adoption of environmental protection and resource management policies. As a result, the concept of development has evolved and is now referred to as green economic growth.
Green economic growth is essential for environmental protection and social sustainability. This new source of growth has paved the way for the implementation of green economic practices. The agenda of green economic growth is aligned with SDG 13, which calls for urgent action to combat environmental change and its impact. The fulfillment of this goal is a major challenge for emerging countries [4,5,6], which can be addressed through the implementation of strategies for green economic growth. The adoption of a policy promoting green economic growth is of considerable importance in order to achieve the sustainable development goals (SDGs) [7].
The International Energy Agency (IEA) reported that approximately 80% of regional commercial energy is derived from the burning of fossil fuels. European Union countries have experienced rapid growth, contributing significantly to greenhouse gas emissions and the occurrence of climate change [8,9]. According to the World Bank, financial inclusion is defined as the degree to which individuals and small businesses have access to financial services like deposits, payments, loans, remittances, and insurance. Babajide, Adegboye [10] defined financial inclusion as an increase in the quality, quantity, and competence of financial intermediary services. Allen, Demirguc-Kunt [11], and Ozili [12] stated that the term financial inclusion refers to the procedure by which it is guaranteed that individuals, specifically those belonging to the poor segments of society, can readily avail themselves of fundamental financial services within officially recognized financial institutions [11,12]. The World Bank’s Global FINDEX, an extensively upheld data source for financial inclusion, has unveiled a comprehensive survey encompassing 150,000 households from 140 countries. This survey delves into various aspects, such as saving activities, credit utilization, account holdings, wages, and government transfers, which are disbursed directly. Many studies, including that of Alam, Azam [13], conducted research on Malaysia and analyzed how financial development affects environmental quality. Similarly, the scholarly work conducted by Khan, Ali [14] delved into the intricate relationship between fiscal decentralization and the reduction of CO2 emissions. Financial inclusion in developing nations is progressing but also has persistent challenges. During the last decade, significant steps have been taken to increase access to mobile banking and agent networks. Mobile banking enables individuals in remote areas to make transactions using their mobile phones, facilitating secure savings. Besides these advancements, large segments of the population, particularly in rural and marginalized communities, are unable to utilize these basic financial services due to a lack of availability and knowledge. Thus, limited infrastructure, regulatory challenges, and low financial literacy are barriers that hinder widespread financial inclusion [15]. Multiple efforts, such as policy reforms, partnerships between governments and private sectors, and targeted financial literacy programs, are being adopted in developing nations to accelerate the process of financial inclusion (see Appendix A, Table A2) so that SDG 13 can materialize. The COVID-19 pandemic has further highlighted the importance of digital financial services to ensure continuity in business activities during times of crisis. Financial inclusion increases the economic resilience of developing nations by improving inclusive financial solutions. In 2014, the Global Financial Development Report of the World Bank mentioned fifty countries that had adopted detailed strategies to facilitate financial inclusion [16]. According to the Economic Intelligence Unit, policymakers noticed that in 55 emerging markets, two-thirds had detailed national financial inclusion strategies by 2014, and nearly all of them had implemented those strategies.
Researchers also believe that financial inclusion has a close relationship with climate action because financial inclusion helps individual businesses invest in environmentally friendly technologies and practices. For instance, microfinance helps smallholder farmers adopt eco-friendly farming techniques that promote sustainable agriculture, such as organic farming or water-efficient irrigation systems. Similarly, financial inclusion enables individual businesses to invest in such green industries as renewable energy projects, solar panels, wind turbines, or energy-efficient appliances. This transition in the investment behavior of entrepreneurs and businesses will develop climate resilience in societies by increasing renewable energy access to marginal communities [17], which are more vulnerable to climate change. Thus, it has been concluded that financial inclusion plays a pivotal role in green economic growth and achieving SDG 13.
Most researchers have explained the concept of green economic growth theoretically but have not utilized green economic growth for empirical investigation. Barajas, Beck [16] used PCA (principal component analysis) to construct a financial inclusion index and discovered no policy synergies between increases in financial inclusion and the reduction in CO2 emissions. Usman, Makhdum [18] conducted a study that investigated financial inclusion for 15 large CO2-emitter countries and used financial development as a proxy. The study revealed that financial development exerts a detrimental influence on the degradation of the environment. Consequently, the enhancement of financial development culminates in a decline in carbon emissions. Moreover, the empirical literature is uncertain about the effects of financial inclusion on green economic growth because some studies have established that financial inclusion increases economic growth [19]. Financial inclusion facilitates easy access to green technology, which has a positive impact on the environment by increasing accessibility and affordability. It also promotes the adoption of better environmental activities that reduce climate deterioration. Promoting financial inclusion holds significant importance within impoverished communities, particularly where farmers encounter a dearth of capital or credit accessibility to invest in clean energy technology, such as solar power, wind energy, biomass, and so on, which are less expensive and more effective than burning coal.
Thus, most of the literature is theoretical and focused on defining the concept of financial inclusion. A few studies have examined the relationship of financial development with environmental quality [20,21], but these scholarly investigations focused their attention on exploring the impact of financial inclusion on the advancement of environmentally sustainable economic growth. Although financial development and financial inclusion are related concepts, they are different in their focus and objectives. For instance, financial development indicates the overall growth and efficiency of financial systems, while financial inclusion indicates the availability of financial services to individuals and businesses regardless of their socioeconomic status or location. This study, therefore, aims to examine the theoretical relationship between financial inclusion and green economic growth empirically by using panel data covering the years 2004 to 2023 in the context of developing nations.
The layout of the research contains five sections. A literature review is presented in Section 2. The data and methodology employed in the present study are discussed in the third section. Section 4 explains the findings of the study, and Section 5 presents subsequent discussions. Section 6 concludes the study by providing valuable recommendations for further policymaking.
2. Literature Review
2.1. Theoretical Literature Related to Financial Inclusion and Green Economic Growth
There are several theories in the literature that highlight the importance of financial inclusion and green innovation in environmental sustainability and promote green economic activities. Some underpinning theories on the relationships between financial inclusion, green innovation, and green economic growth are presented below.
Resource efficiency theory is a conceptual framework related to financial inclusion and green economic growth that originated in the literature through discussion and research in the field of sustainable development [22]. This theory states that sustainable development and financial inclusion are inseparable. Financial inclusion enables individuals and businesses to have easy access to financial products, loans, savings, and insurance, which equips them to invest in technologies and practices that produce the maximum output and reduce environmental impact [23].
Innovation and technological diffusion theory is based on principles of economics, innovation, and environmental science. This theory explains how financial inclusion can help to foster green economic growth through innovation and the diffusion of technologies. This theory states that financial inclusion enables businesses and entrepreneurs to have greater access to financial services, so they are more willing to invest in research and the development of clean technologies. Similarly, more financial opportunities help individuals and businesses adopt environmentally friendly innovations across various sectors.
Market development theory is based on market dynamics, consumer behavior, and economic development, and it states that expanding access to financial services and improving economic participation can enhance consumers' purchasing power and the demand for green and sustainable products [24]. This theory argues that greater access to financial services enhances the individual ability to purchase eco-friendly goods and services, which builds the pressure placed on producers to produce and supply sustainable products. On the basis of the above theories, this study developed a conceptual framework that is presented in Figure 1 and contributes to strengthening the above theories by providing empirical foundations for them.
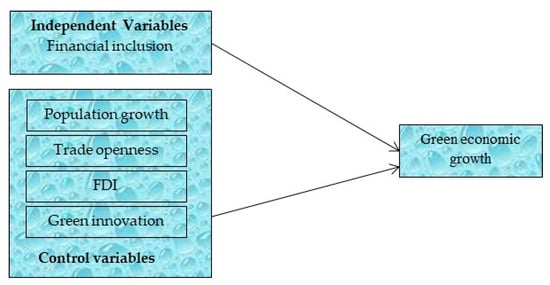
Figure 1.
Conceptual framework.
2.2. Empirical Literature
2.2.1. Financial Inclusion (FI) and Economic Growth
Ample empirical literature is available on the relationship between financial inclusion and economic growth, but few studies have explored the role of FI in green economic growth [25].
Oruo [26] conducted a study examining the correlation between financial inclusiveness and economic expansion within the framework of Kenya, covering the years from 2002/2003 to 2011/2012. Using multiple regression analysis, their findings revealed that financial inclusion has a significant positive impact on economic growth in Kenya. Bagli and Adhikary [27] estimated a comprehensive measure of financial inclusion for India using the method of rotated principal composite analysis. The results revealed a strong positive relationship between human development and state financial inclusion in India. Evans [28] studied the relationship between economic and financial development and FI in Africa. Findings revealed that the presence of population density holds the utmost significance in facilitating financial development and FI on the African continent. Finally, this study demonstrated that a recent financial services innovation, mobile banking, helped to reduce infrastructure issues and improved financial access.
Babajide, Adegboye [10] posited a relationship between FI and economic growth in the context of Nigeria. This study revealed that the concept of financial inclusion (FI) encompasses a systematic enhancement of the quantity, quality, and efficiency of financial intermediary services. The study aimed to explain the determinants of FI as well as its impact on economic growth. Through the utilization of an ordinary least squares regression model, they effectively demonstrated that FI constitutes a significant determinant of both total factor productivity and capital per worker. In a similar way, Nkwede [29] conducted an investigation into the effects of FI on the economic development of the African economy over a time period spanning from 1981 to 2013. Employing the ordinary least squares methodology, the findings validated that FI has exerted a significant adverse impact on the economic growth of Nigeria. Conversely, Okoye, Adetiloye [30] contended that FI did not have any significant effect on the economic growth of Nigeria from 1986 to 2015. Overall, the under-utilization of banking has a significant impact on a country’s progress. Dabla-Norris, Ji [31] explored the unique limitations impacting FI and its repercussions on GDP and inequality. They developed a micro-founded general equilibrium model featuring diverse agents and multiple dimensions of FI, including access (determined by participation costs), depth (governed by borrowing constraints), and intermediation efficiency. In a partial equilibrium context, easing each of these constraints individually leads to distinct increases in GDP. However, when these constraints are relaxed concurrently, the emphasis shifts towards enhancing the intensive margin, which involves increasing production per entrepreneur with access to credit, while the impact on the extensive margin, which pertains to promoting loan accessibility, is minimized.
Williams [32] examined the influence of FI on poverty reduction and economic growth in Nigeria from 2006 to 2015 within the framework of a log-linear model definition. The regression results indicate that the number of operational ATMs, bank branches, and government expenditures from three African countries serve as robust predictors of FI in the context of poverty reduction. Another study conducted by Evans and Alenoghena [33] analyzed the correlation between FI and GDP in the African context using data spanning from 2004 to 2014. Through the utilization of a Bayesian VAR model, the findings reveal that GDP per capita exerts a significant impact on FI, illustrating how an increase in GDP per capita drives the desired level of FI in Africa. However, the impact of FI on GDP per capita was found to be insignificant.
Erlando, Riyanto [34] conducted a study to examine the effects of FI on economic growth, poverty reduction, and income inequality in Eastern Indonesia. They utilized the dynamic Panel Vector Auto-regression (PVAR) method and the Toda–Yamamoto VAR bivariate causality model. The results demonstrate that socioeconomic growth had a positive impact on FI. Furthermore, FI had a positive effect on inequality, which contributed to the widening of income inequality in Indonesia. Ratnawati, Prabandari [35] conducted a comprehensive examination to investigate the impact of FI on various aspects, such as economic growth, poverty levels, income inequality, and financial stability, in the Asian region during the period of 2006–2015. The measurement of FI encompassed a range of factors, including the extent of banking penetration, accessibility to banking services, and the utilization of these services. The findings revealed that each dimension of financial stability exhibited a significant influence on economic growth, poverty reduction, income equality, and financial stability. However, it is worth noting that the effect of FI on economic growth, poverty reduction, income inequality, and financial stability in Asian nations was comparatively limited.
Conclusively, the above-discussed literature revealed that most of the studies have been conducted in the contexts of India, Africa, and Nigeria to explain the relationship between FI and economic growth. However, a few studies have explained the impact of FI on poverty alleviation, income inequality, and financial stability.
2.2.2. Determinants of Financial Inclusion
A few studies have been conducted to explore the determinants of FI; they are reviewed in the following.
Park and Mercado [36] conducted a study on 151 economies to propose a new index to measure FI. It comprises nine indicators of access, availability, and usage of financial products. According to their findings, higher output growth is significantly associated with high FI in high-income economies. Furthermore, David, Oluseyi [37] conducted an analysis of the determinants of FI in Nigeria by utilizing time series data covering the period from 1990 to 2016. In order to validate the short-term association, the Error Correction Model (ECM) was employed in this investigation. The obtained outcomes reveal the existence of a positive and statistically significant correlation between the proposed variables and FI. It is observed that FI contributes to an increase in GDP per capita. Raza, Tang [38] conducted an investigation in order to ascertain the correlation between FI and economic development in Pakistan within the timeframe of 2010 to 2015. By employing the Pearson correlation matrix, the researchers found that there exists a strong connection between FI and economic development; thus they suggest that an increase in FI could potentially result in a boost in economic development. Specifically, the number of bank accounts (per 1000 adult population) and bank branches (per 100,000 adult population) display a positive association with the Human Development Index (HDI), while the number of ATMs per 1000 km2 exhibits an adverse relationship. Le, Dang [39] used the data of 20 Asian countries over the period of 2011–2016 and explored the determinants of FI. This study revealed that high economic growth significantly increases financial literacy and the usage of financial products.
2.2.3. Financial Inclusion and Green Economic Growth
Financial inclusion plays an important role in increasing GEG by providing essential financial services that are crucial for sustainable development. The World Bank highlighted the importance of GEG by mobilizing funds for renewable energy projects in developing nations [40]. Financial inclusion is also beneficial for developing nations in promoting renewable energy projects, sustainable agriculture practices, and environmentally friendly infrastructure projects. Furthermore, financial inclusion also enhances the accessibility of finance for small and medium enterprises (SMEs) and empowers them to adopt eco-friendly technologies and practices that contribute to environmental sustainability. Moreover, in developing nations, financial inclusion (FI) supports inclusive economic growth by reaching underserved populations, such as rural communities and women. This effort aims to promote the equitable distribution of green economic benefits.
This particular section of the literature review further explores the intricate relationship between FI and its impact on the attainment of green economic growth. In their study, Zaidi, Hussain [41] conducted an examination of the influence of FI and infrastructure on the achievement of ecological sustainability within the member countries of the Organization for Economic Co-operation and Development (OECD), covering the time period from 2004 to 2017. Utilizing the augmented mean group (AMG) method, their results uncovered that environmental degradation is influenced by various factors, such as FI, energy consumption, and corruption. In another study, Liu, Hong [42] explored how FI and education contribute to the reduction in carbon dioxide emissions in China. Their research, utilizing the ARDL technique, provided evidence of the positive impact of FI on China’s environmental quality. Likewise, education is identified as a crucial factor in mitigating carbon dioxide emissions in China. Furthermore, it is observed that both GDP and population had a negative effect on carbon dioxide emissions.
Singh, Raza [43] conducted research to examine the influence of FI on the deterioration of the environment within the Organization of Islamic Cooperation (OIC) nations during the time period of 2004–2018. To gauge environmental degradation, data regarding a variety of greenhouse gas (GHG) emissions, as well as deforestation and ecological footprints, were utilized. The findings of the long-term estimation revealed positive associations between carbon emissions, (CH4) emissions, and deforestation, whereas ecological footprints and (N2O) displayed negative correlations with the higher-income OIC economy. Sohag, Husain [44] investigated the effects of renewable energy and technological innovation on driving green growth in OECD countries. By utilizing the cross-sectional autoregressive distributed lag (CS-ARDL) technique, it was determined that there are positive relationships between the progression of renewable energy, technological advancement, and economic growth in the long run. Additionally, certain research endeavors have discovered a long-run positive impact of FI on carbon emissions [45], while others have revealed a negative influence of FI on carbon emissions [46].
The literature review has revealed that engaging in green trade can mitigate environmental conflicts, enhance the sustainability of social groups, and drive economic development [47], while a few studies have explored the influence of FI on green economic growth in a single-country context. This study aims to investigate the effect of FI on green economic growth. However, no study has been conducted to find the effect of FI on green economic growth in the context of developing countries. Large emissions of carbon dioxide is considered one of the main causes of global warming, and developing countries are affected to a greater extent than developed countries by global warming. Though developed countries are also suffering from this issue, the extent of its effects is far below that of developing nations. Moreover, compared to developing countries, developed countries provide subsidies and tokens of appreciation for green economic projects, producing benefits additional to economic growth. Projects and items such as electric vehicles, the dumping of waste, family planning to control the population, renewable energy projects, and the recycling of waste, etc. are examples of such intensives, with the subsidies and tokens helping to maintain a balance between green economic growth and economic growth (GDP).
Therefore, this study contributes to the literature in many ways. Firstly, this is the first study to concentrate on empirical evidence to study the effect of FI on green economic growth in the context of developing countries. It focuses on developing countries to investigate the impact of FI on green economic growth because developing countries are suffering more than developed countries from climate change due to their comparatively decreased focus on climate change and environmental quality. Moreover, Sri Lanka, Thailand, Pakistan, Iran, and India are suffering more from climate change issues compared to other developing countries because they have no proper systems of recycling waste and no subsidies supporting the creation of a pollution-free environment. Their only focus is on the development of the economy, even at the cost of environmental quality. Secondly, we measure green economic growth by using the formula GDP + EE − NFD − CO2. GDP indicates the monetary value of goods and services, EE is the monetary value of expenditures on education, NFD is the monetary value of exploited forests, and CO2 is the monetary value of carbon dioxide damage [44]. Finally, this study developed an FI index using the Principal Composite Index.
3. Econometric Methodology
Following Kemp and Pearson [48], Sohag, Husain [44], Paramati, Mo [49], and Usman, Ozturk [50], we generated the following econometric model form:
In Equation (1), cross-sections are denoted by the subscript i, such as (i = 1,2,3…… N), whereas time period is denoted by the subscript t, such as (t = 1,2……T); β0 is intercepted, while β2, β3, β4, and β5 are coefficients of variables.
This study utilized panel data for 12 developing countries (Armenia, India, Iran, Sri Lanka, Indonesia, Pakistan, Jamaica, Kenya, Thailand, Tunisia, Ethiopia, and Egypt) on the basis of the availability of data. The study utilizes the data covering the period of 2004 to 2023. The data were collected from different sources; detailed information regarding variable descriptions, measurements, and data sources is provided in Table 1. The primary goal of the study is to explain the effect of FI on green economic growth. Moreover, this research also studied the relationships between trade openness, green innovation, population (POP), foreign direct investment (FDI), and green economic growth. The FI index was constructed by principal component analysis (PCA). Results of the PCA are given in Appendix A (see Table A1).

Table 1.
Measurement of variables and data sources.
3.1. Dependent Variables
The dependent variable is green economic growth (GEG), which is defined as growth that reduces carbon dioxide emissions, increases sustainability, and strengthens climate resilience. Most studies use CO2 emissions as a proxy for green growth because an increase in CO2 indicates a decline in green growth, and a decrease in CO2 emissions indicates an increase in green growth [51]. Green growth is measured using the formula GG = GDP + MG + -NRP- NED-CO2. The level of green economic growth is denoted by GG, with GDP representing the real gross domestic product. The spending on merit goods is indicated by MG, while NRP represents the pecuniary value of diminished coal, crude oil, natural gas, and other minerals. Additionally, NFD denotes the budgetary value of forest exhaustion, and CO2 represents the economic value of carbon dioxide. Sohag, Husain [44] measured green growth by using the following combination of indicators: green economic growth = GDP + EE − NRP − NFD–CO2, where GDP stands for gross domestic product growth (annual %), EE stands for education expenditure (% of GDP), NRP stands for fossil fuel consumption (% of total energy consumption), NFD stands for net forest deterioration (% of GNI), and CO2 stands for carbon emissions (% of fuel).
Financial inclusion (FI) is the independent variable, and following Tram, Lai [52], this study constructed a composite index of FI that covers four dimensions of financial services, i.e., (i) number of bank branches per 100,000 population, (ii) number of ATMs per 100,000 population, (iii) outstanding deposits with commercial banks (share of GDP), and (iv) outstanding loans with commercial banks (share of GDP) [39]. For correlations between these selected indicators, see Appendix A, Table A2. However, green innovation, population, FDI, and trade openness are used as control variables in this study. Earlier research has used a wide range of indicators for green innovation such as R&D investment, the production value of eco-innovative products, the number of patents, and changes in resource productivity and efficiency. A recent study assessed green innovation through environment-related technologies [53]. Moreover, the present study measured trade openness by trade % of GDP from the WDI [54], and the population is measured as the number of people per square kilometer [55].
FDI has been defined as a reliable means of expanding an economy’s domestic capabilities by growing investments through new funds and gaining access to innovative technologies [49]. The current study uses the net inflow percentage of GDP as a proxy for FDI.
3.2. Descriptive Statistics
Descriptive statistics are employed to illustrate the fundamental characteristics of the data. We present a straightforward summary of the data and offer a broad outline of the data collected and tested. Several properties, e.g., the mean, median, standard deviation, and the test statistics of Jarque and Bera, are included in the descriptive statistics. A descriptive analysis of the variables and correlation analysis is given in Table 2. Trade openness has the highest mean value of 63.3, and POP has the lowest mean value of 1.3. GEG has the highest value of standard deviation, indicating that it has the greatest volatility, while POP is the least volatile, with a standard deviation of 0.8. The Jarque–Bera test is used to test the normality of the data. The null hypothesis of the test indicates that residuals are normally distributed because the Jarque–Bera probability value is significant and less than 0.05. The residuals are not normally distributed. Correlation analysis indicates that there is no multi-collinearity between independent variables because the values of the correlations are less than 0.7.
Table 2.
Summary statistics.
4. Methods and Results
4.1. Cross-Sectional Dependence Test
Several studies have stated that panel data usually suffer from a cross-sectional dependence (CSD) problem. Pesaran, Schuermann [56] stated that this is due to mutual shocks. De Hoyos and Sarafidis [57] stated that financial and economic assimilation is the cause of the cross-sectional dependence problem. Neglecting the problem of cross-sectional dependence generates skewed and erroneous results [58]. Baltagi and Li [59] stated that the existence of cross-sectional dependence produces biased parameter estimates and inefficient inference from econometric models. Furthermore, the identification of cross-sectional dependence helps researchers to make appropriate decisions about the application of first- or second-generation unit root tests. This study utilized the Pesaran CD test to identify CSD within the dataset. The findings are presented in Table 3. The findings indicate that cross-sectional dependence exists, and this study rejects the null hypothesis of cross-sectional independence at a 1% significance level, as indicated by a p-value of 0.01.
Table 3.
Cross-sectional dependence test.
4.2. Panel Unit Root Test
In the presence of cross-sectional dependence, all of the conventional unit root tests remain invalid and are unable to control the problem of cross-sectional dependence. Therefore, current studies have used the PESCADF unit root test to check stationarity and eliminate the problem of CD. Pesaran Cross-Sectional ADF (PESCADF), developed by Pesaran [60] for heterogeneous panels, is helpful to control cross-sectional dependence in panel data. Moreover, second-generation unit root tests are more beneficial in producing unbiased and efficient estimators [61]. Thus, this study adopted Pesaran Cross-Sectional ADF (PESCADF), a second-generation unit root test, to investigate the stationarity of the data, and the results are presented in Table 4. At the 5% significance level, the null hypothesis is not rejected, suggesting that the variables are not stationary at that level. Nevertheless, variables became stationary at the first difference; thus, we rejected the null hypothesis of non-stationarity at a 1% significance level. This signifies that all the series are integrated in the order of I (1).
Table 4.
Pesaran CADF unit root test.
4.3. Panel Co-Integration Tests (PCTs)
We have applied the Pedroni [62] and Kao [63] co-integration tests to check the long-run associations between variables. The Pedroni [62] test considers heterogeneity by using certain parameters that can be different across individual cross-sections of the sample. The main advantage of the Pedroni test is that it takes into account CD, but its disadvantage is that it cannot work for more than seven variables. The Kao [63] co-integration test does not suffer from such a disadvantage. The results of Pedroni [62] suggest that seven test statistics be sub-divided into two groups: the mean group and the panel co-integration group. All seven Pedroni tests assume that there is heterogeneity across a sample. In Pedroni co-integration analysis, if the probability values of four or more tests are less than 0.05 out of seven testing statistics, this indicates that the variables are co-integrated. The Pedroni co-integration test accommodates a heterogeneous panel structure and controls cross-sectional dependence. The panel co-integration test developed by Kao [63] is based on the Engle–Granger (EG) framework. The purpose of this test is to estimate homogeneous co-integrating coefficients with heterogeneous intercepts. It uses DF and ADF to test for the presence of an LR association in a panel. It is also used to validate robustness. The variables are co-integrated if the probability values are less than 0.05. Thus, an investigation into the long-run correlation between variables integrated at the first difference is conducted using the Pedroni and Kao co-integration tests. The results of these tests are summarized in Table 5, which showcases the outcomes of the Pedroni [62] and Kao [63] co-integration assessments. These results reveal that, at the 1% significance level, four out of seven statistics exhibit significance. To enhance the robustness of our findings, the Kao [63] test was employed, which also confirms the presence of co-integration among the variables. Consequently, both the Pedroni and Kao tests provide support for the existence of a long-run co-integration relationship among the variables, leading to the rejection of the null hypothesis of no co-integration at the 1% significance level.
Table 5.
Pedroni and Kao co-integration tests.
4.4. Fully Modified Ordinary Least Squares (FMOLS)
The panel co-integration testing explained the existence of a long-run relationship between panel variables. Once we find evidence of co-integration between the variables, the next stage is to estimate the long-run estimates' coefficients. The use of traditional OLS on non-stationary variables can result in spurious regressions [64], because with OLS, when applied to the co-integrating panel model, the long-run estimators are biased and inconsistent. Therefore, it is not applicable when variables are found to be non-stationary. Furthermore, heterogeneity is an issue in panel data models, with differences in means across cross-sections as well as differences in the individual cross-section responses to short-term disturbances from the long-run equilibrium. Phillips [65] developed a fully modified OLS (FMOLS) method that is helpful in controlling autocorrelation and endogeneity problems in the data. FMOLS not only provides reliable estimates of parameters but also considers CSD, endogeneity, and heterogeneity. In other words, FMOLS generates consistent estimates along with the control on aggressor endogeneity and the issue of correlation. Moreover, FMOLS is applied in a situation wherein the number of observations is less than the time period of the study. However, FMOLS also has certain limitations. For instance, it assumes that the model specification is correct and that all relevant variables are included in the empirical model. This technique is also very sensitive to outliers and is unable to produce reliable results in the presence of an outlier [66].
This study utilized FMOLS to calculate long-run estimates, and the results of the FMOLS analysis are reported in Table 6. The results of this study indicate that financial inclusion has a negative and significant long-run association with GEG, as the coefficient of financial inclusion, -.0.241***, indicates that as financial inclusion increases by 1%, GEG will decrease by 0.241%. The results of the FMOLS regression reveal that the coefficient of green innovation (GI) is positive, having a value of 0.052, and is significant at the 10% level of significance. This illustrates that a 1% increment in green innovation (GI) results in a 0.05% increase in green economic growth (GEG).
Table 6.
FMOLS results; dependent variable = GEG.
Moreover, the results indicate that FDI and trade openness have positive and significant associations with GEG, as indicated by the coefficient values of FDI, 0.438 *, and trade openness, 0.016 ***. However, population has a negative and significant association with GEG, −0.291 *.
4.5. Causality Test
Granger [67] proposed a system for evaluating causal relationships between variables in a time series after confirming the existence of co-integration among data series. Dumitrescu and Hurlin [68], on the other hand, provide an extension to detect causality in panel data. The Dumitrescu and Hurlin [68] test assumes that there should be causality for individuals but not necessarily for all of them. Dumitrescu and Hurlin [68] panel causality analysis has some advantages over Granger causality analysis. For instance, Dumitrescu and Hurlin [68] panel causality is good for analyzing unbalanced panel data and for the problem of CSD between countries. The Dumitrescu and Hurlin [68] panel causality equation is given below:
In this equation, K shows the optimum lag interval, and Y and X refer to the variables that will be examined through causality analysis. In other words, the goal of this analysis is to determine whether X is the cause of Y or not.
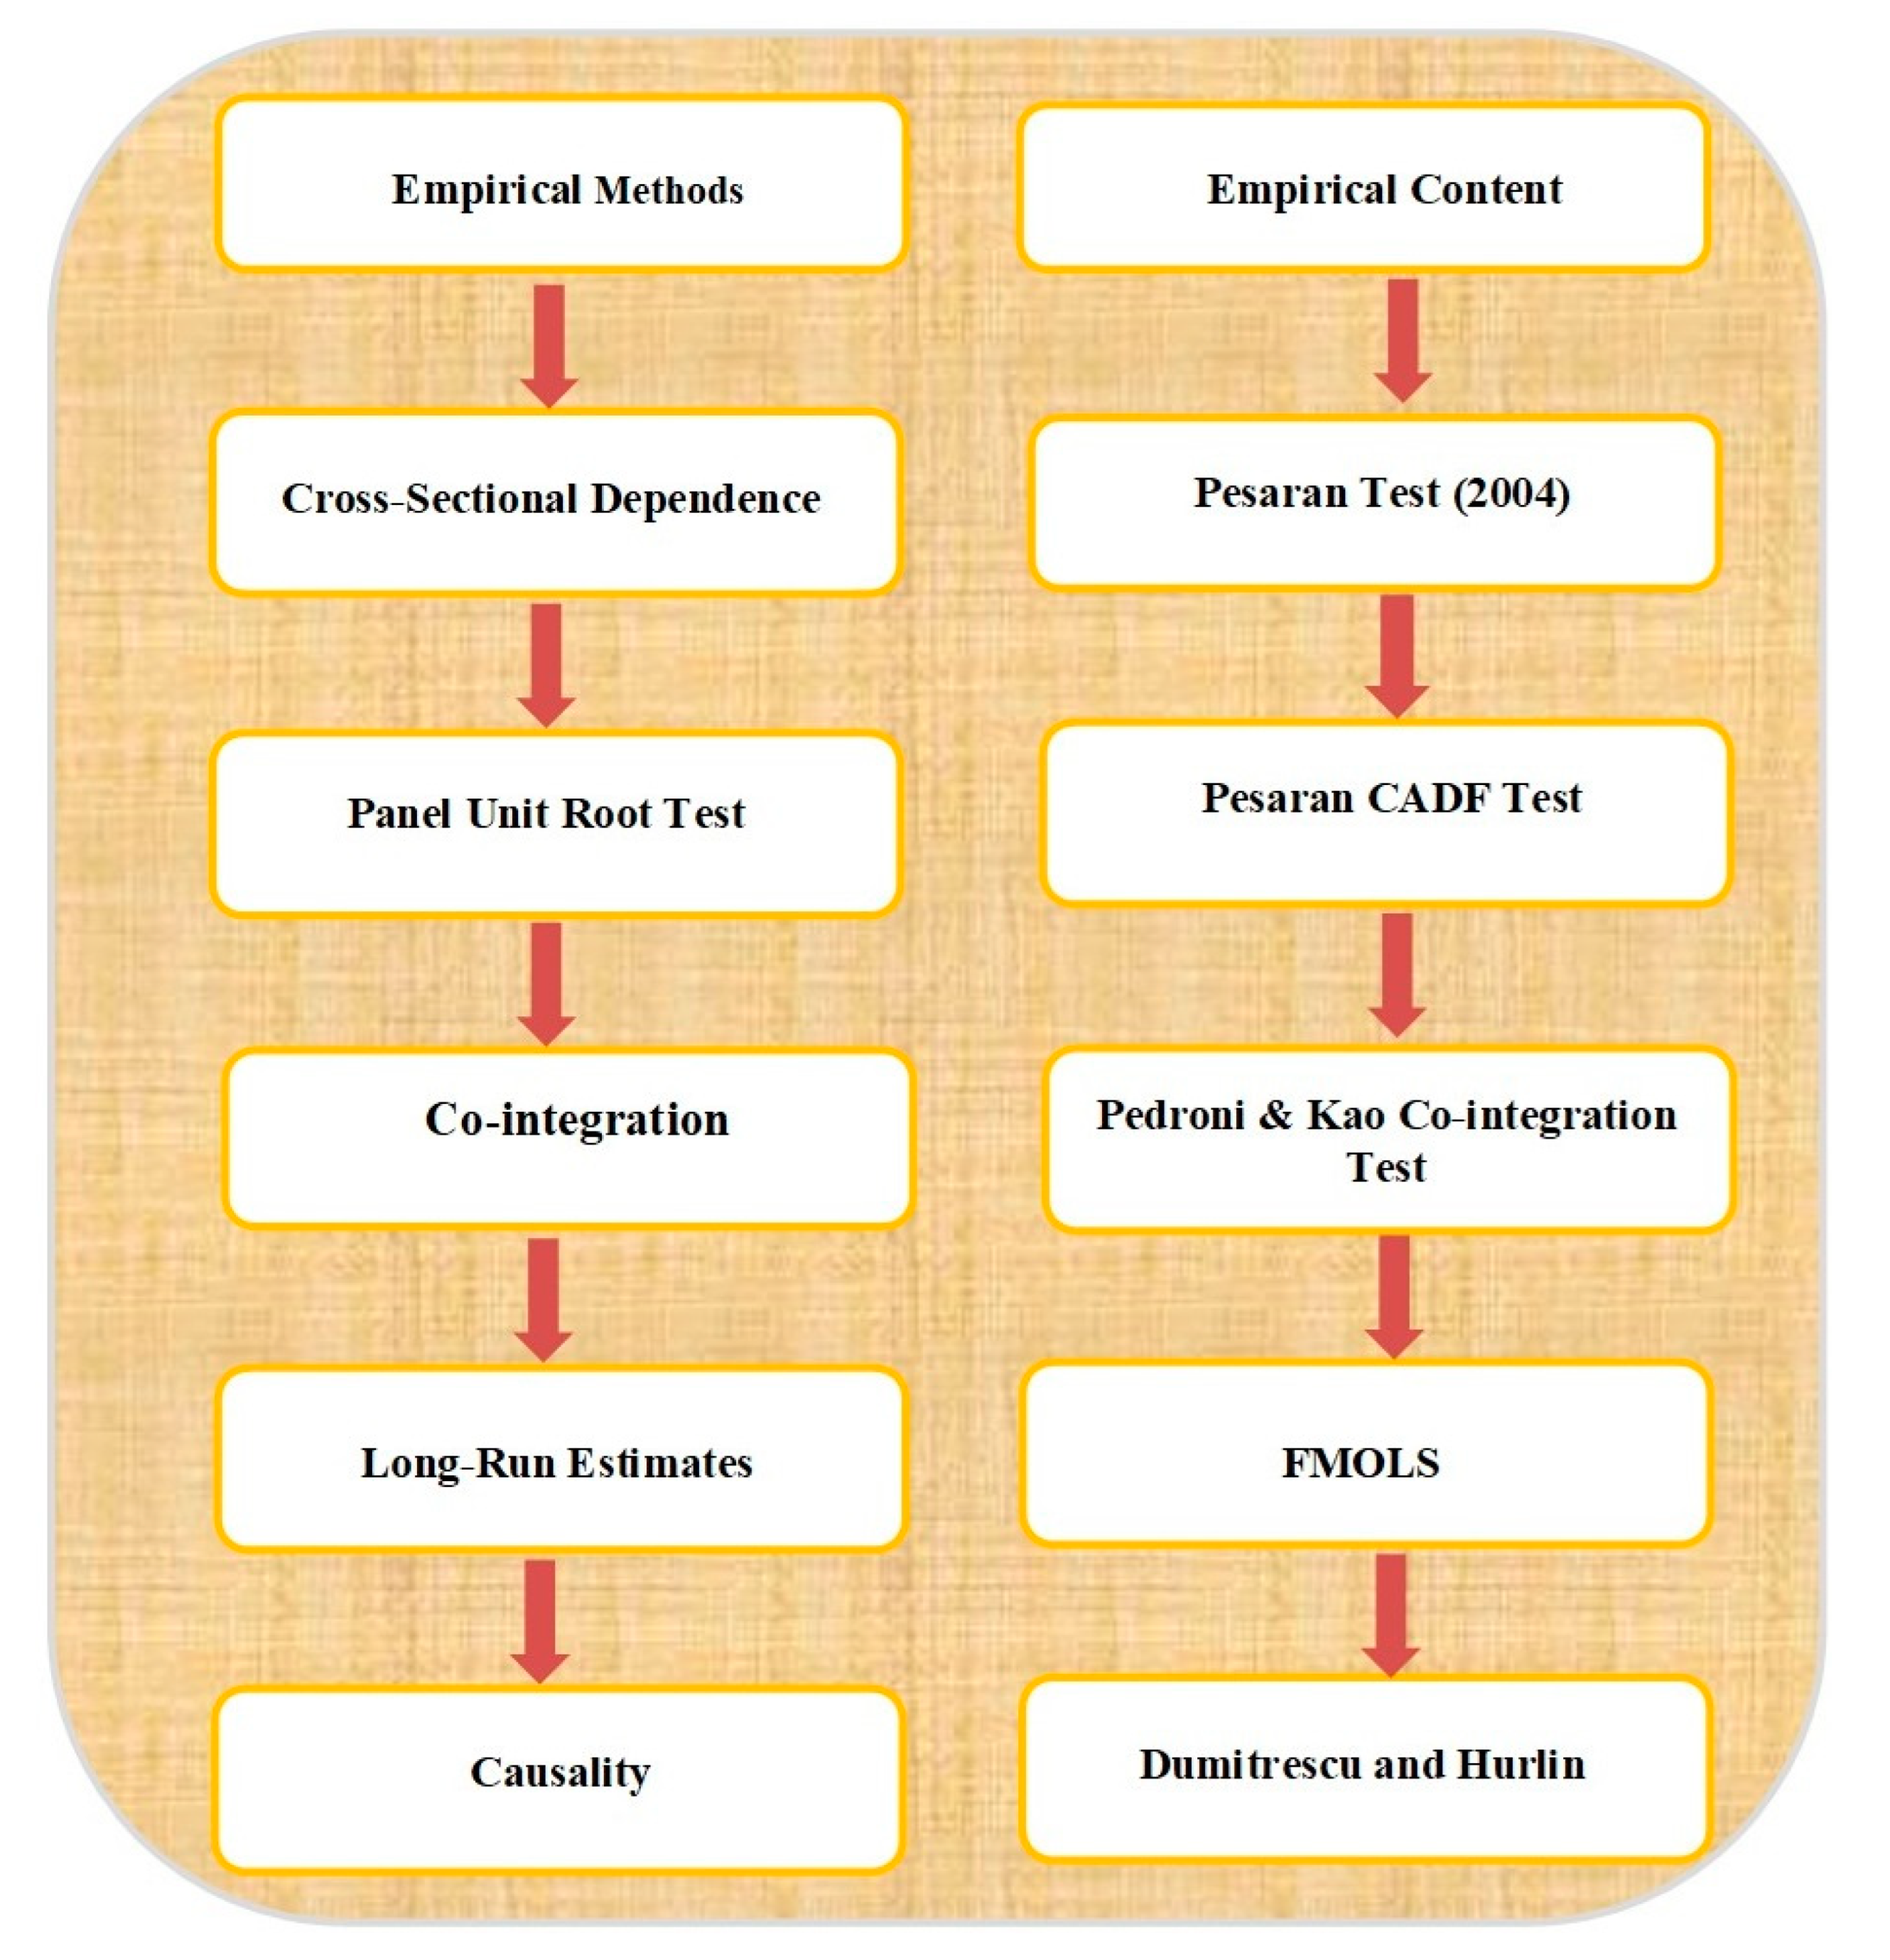
The null hypothesis proclaims ‘no Granger causality association’ between the variables for all units. The alternative hypothesis, on the other hand, states that there is evidence of Granger causation between variables in at least one unit. As a result, the alternative hypothesis supports heterogeneous outcomes, whereas the null hypothesis is a model that produces homogeneous results despite heterogeneity. This test is commonly used [68] in panel analysis. This study adopted the Dumitrescu and Hurlin (DH) test to assess causality among series in the panel. Dumitrescu and Hurlin panel causality analysis has some advantages over Granger causality analysis, such as the fact that Dumitrescu and Hurlin panel causality is good for analyzing unbalanced panel data and for the problem of CSD between countries. The results in Table 7 explain the causality between variables, and the results indicate that unidirectional causality exists between FDI and GEG, FI and GEG, and TR and GEG, while no causality exists between population and GEG. The flowchart of the entire analysis is presented in Figure 2.
Table 7.
Dumitrescu and Hurlin panel causality results.
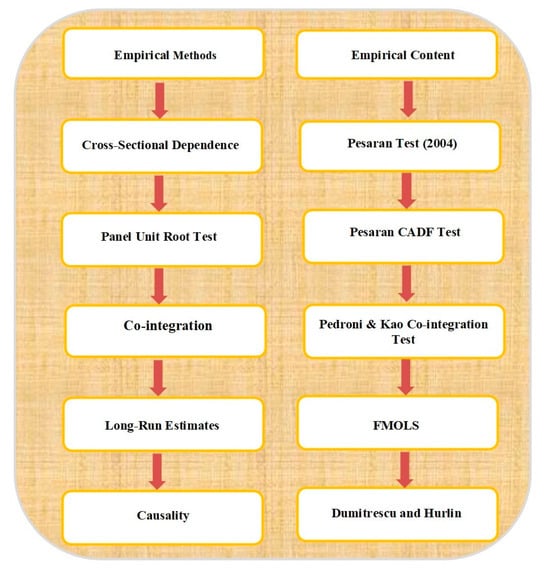
Figure 2.
Flowchart of methodology. Source: authors' own logical flow.
5. Discussion of Results
This study is an attempt to examine the impacts of financial inclusion and green innovation on green economic growth along with such control variables as trade openness, foreign direct investment, and population intensity. This study employed the fully modified ordinary least squares method to investigate the long-run estimates. This study found that financial inclusion has a negative and significant association with green economic growth. Our results contradict those of Wang, Wang [25], who found a positive and significant long-run association of financial inclusion with green economic growth and sustainable development in China. Financial inclusion brings about a positive impact on green economic growth only if financial institutions facilitate individual access to green investment and green products [69,70,71]. Moreover, when financial inclusion encourages green entrepreneurial activities, it helps individuals and communities to enhance resilience against environmental risks and climate change impacts. Contrary results in developing nations indicate that financial systems are growing and evolving with unintended negative consequences for environmental sustainability. Moreover, in developing nations, financial crises or disruptions in financial systems also cause detrimental effects in the broader economy and environment. Frequent economic fluctuations also limit financing for green initiatives in developing nations. Moreover, to stimulate economic activities and to achieve ambitious economic development goals, developing nations provide financial products to individuals and businesses with compromised environmental regulations. However, our result is supported by the literature [45]. There is no doubt that developing countries are suffering more in terms of the quality of their environments. There is always a need for a regime that facilitates green economic growth to achieve SDG 13.
Furthermore, the results of this study also indicate that green innovation has positive and significant long-run association with green growth. Our results are consistent with [72], which demonstrated that green innovations contribute to green economic growth through technological advancement, including renewable energy technologies (such as solar and wind power), energy-efficient building materials, sustainable agriculture practices, and cleaner production processes. Moreover, green innovation produces job opportunities in research and development, which helps in terms of economic diversification and reduces dependency on traditional jobs that are provided in industries that are harmful to the environment.
6. Conclusions
The achievement of sustainability goals is one of the main issues of developing countries. Most of the time, environmental impacts are ignored while these countries seek economic benefits from GDP, urbanization, technology, and industrialization [73]. In SDG 13, climate action is defined as increased efforts in all countries to decrease the emissions of greenhouse gases, while increasing the resilience and capacity to adapt to climate-induced impacts, including climate-related risks. Hence, it is essential to commence a study from the perspective of green economic growth, which can offer some useful perspectives on developing policy options for SDG 13. Since some developing countries lack the resources that determine environmental quality, such an investigation is useful, although some developing countries have resources but lack maintenance and implementation efforts [74,75]. This study analyzes the effect of financial inclusion on green economic growth. For this purpose, this study selected developing countries based on the availability of data, i.e., Armenia, India, Iran, Sri Lanka, Indonesia, Pakistan, Jamaica, Kenya, Thailand, Tunisia, Ethiopia, and Egypt. The study used data covering the period of 2004 to 2020. The empirical results reveal that variables are cross-sectionally dependent. All the variables are stationary at first differences. Pedroni [62] and Kao [63] co-integration tests were employed to investigate the long-run correlations among variables for the variables under consideration. We found evidence of a long-run co-integration relationship between variables. In order to get long-run estimates, we applied the FMOLS technique, which provides reliable estimates of parameters and takes into account CSD, endogeneity, and heterogeneity. The empirical findings revealed that financial inclusion has a negative effect on GEG because in developing countries, there are large emissions of carbon dioxide, high fossil fuel consumption, and a lack of awareness about environmental quality. Moreover, developing countries often focus only on economic growth, at the expense of environmental quality. Furthermore, we found a positive impact of green innovation, FDI, and trade openness but a negative effect of population on GEG.
Policy Implications
Based on the findings, this research has the following policy implications that will help in the achievement of sustainable development goal 13. First, policymakers should enhance financial transactions related to the development of relatively cleaner industries. Banks should create loan scheme projects that promote a quality environment by discouraging CO2 and fossil fuel emissions. Second, the study suggests that developing nations should endorse green energy production by undertaking new projects and investing in renewable energy sources. Third, policymakers should develop policies to increase financial literacy, so individuals can make informed financial decisions and upgrade the environment quality. All the proposed policy implications not only help governments in developing countries foster GEG but also contribute to the attainment of Sustainable Development Goal 13 (SDG 13). The only way to achieve a healthy climate is through the implementation of existing and new policies at the government and individual levels.
Author Contributions
This project was designed by S.N. and S.K., while S.A. (Saira Arsh). and U.R. extracted the data and conducted a deep analysis. S.A. (Sohail Abbas)., S.N. and S.K. wrote the final manuscript. G.D. and M.I. provided the resources. All the authors reviewed the final manuscript carefully. The first authorship is also shared between S.A. (Sohail Abbas) and G.D. All authors have read and agreed to the published version of the manuscript.
Funding
This research received no external funding.
Informed Consent Statement
Not applicable.
Data Availability Statement
Data are available upon reasonable request.
Acknowledgments
This research was supported by the National Research Foundation (NRF) of Korea and funded by the Ministry of Science and ICT (2022R1G1A1009887). The authors express their appreciation to the Deanship of Scientific Research at King Khalid University, Saudi Arabia, for this work, through a research group program under grant number RGP-2/232/45.
Conflicts of Interest
The authors declare no conflicts of interest.
Appendix A
Table A1.
PCA for financial inclusion.
Table A1.
PCA for financial inclusion.
| Component | Eigenvalue | Difference | Proportion | Cumulative |
|---|---|---|---|---|
| PC1 | 2.163 | 1.148 | 0.540 | 0.540 |
| PC2 | 1.014 | 0.454 | 0.253 | 0.794 |
| PC3 | 0.560 | 0.299 | 0.140 | 0.934 |
| PC4 | 0.261 | - | 0.065 | 1.000 |
| Principal Components (Eigenvectors) | ||||
| Variable | PC1 | PC2 | PC3 | PC4 |
| Fi1 | 0.353 | 0.726 | 0.585 | 0.061 |
| Fi2 | 0.505 | 0.335 | −0.749 | 0.265 |
| Fi3 | 0.602 | −0.250 | 0.026 | −0.757 |
| Fi4 | 0.505 | −0.544 | 0.307 | 0.593 |
Note: Fi1, Fi2, Fi3, and Fi4 are the number of bank branches per 100,000 population, number of ATMs per 100,000 population, outstanding deposits with commercial banks, and outstanding loans with commercial banks, respectively.
Table A2.
Comparative analysis for financial inclusion in developing regions.
Table A2.
Comparative analysis for financial inclusion in developing regions.
| Practices to Promote Financial Inclusion | Regions | ||||
|---|---|---|---|---|---|
| Sub-Saharan Africa | South Asia | Latin America | East Asia Pacific | Middle East and North Africa | |
| Mobile money adoption | High | Growing | Increasing | Advanced | Growing |
| Agent banking growth | Extensive expansion | Moderate growth | Moderate growth | High growth | Moderate growth |
| Policy and regulatory environment | Evolving | Progressive | Stable | Progressive | Reforming |
| Financial literacy initiatives | Increasing | Varied | Varied | Strengthening | Developing |
| Gender inclusion efforts | Prominent | Significant | Significant | Notable | Progressing |
| Digital infrastructure | Growing | Improving | Advanced | Robust | Developing |
| COVID-19 impact | Rise in mobile transactions | Shift towards digital payments | Rush in digital payments | Increasing reliance on digital channels | Rapid adoption of digital financial tools |
References
- Sarkodie, S.A.; Adams, S.; Owusu, P.A.; Leirvik, T.; Ozturk, I. Mitigating degradation and emissions in China: The role of environmental sustainability, human capital and renewable energy. Sci. Total. Environ. 2020, 719, 137530. [Google Scholar] [CrossRef] [PubMed]
- Luo, J.; Zhuo, W.; Liu, S.; Xu, B. The optimization of carbon emission prediction in low carbon energy economy under big data. IEEE Access 2024, 12, 14690–14702. [Google Scholar] [CrossRef]
- Li, T.; Yu, L.; Ma, Y.; Duan, T.; Huang, W.; Zhou, Y.; Jin, D.; Li, Y.; Jiang, T. Carbon emissions of 5G mobile networks in China. Nat. Sustain. 2023, 6, 1620–1631. [Google Scholar] [CrossRef]
- Sinha, A.; Shahbaz, M.J.R.e. Estimation of environmental Kuznets curve for CO2 emission: Role of renewable energy generation in India. Renew. Energy 2018, 119, 703–711. [Google Scholar] [CrossRef]
- Wang, K.; Hu, Y.; Zhou, J.; Hu, F. Fintech, financial constraints and OFDI: Evidence from China. Glob. Econ. Rev. 2023, 52, 326–345. [Google Scholar] [CrossRef]
- Hu, F.; Zhang, S.; Gao, J.; Tang, Z.; Chen, X.; Qiu, L.; Hu, H.; Jiang, L.; Wei, S.; Guo, B. Digitalization empowerment for green economic growth: The impact of green complexity. Environ. Eng. Manag. J. 2024, 23, 519–536. [Google Scholar]
- Xu, J.; Hu, W. How do external resources influence a firm's green innovation? A study based on absorptive capacity. Econ. Model. 2024, 133, 106660. [Google Scholar] [CrossRef]
- Xu, H.; Yang, C.; Li, X.; Liu, R.; Zhang, Y. How do fintech, digitalization, green technologies influence sustainable environment in CIVETS nations? An evidence from CUP FM and CUP BC approaches. Resour. Policy 2024, 92, 104994. [Google Scholar] [CrossRef]
- Zhao, S.; Zhang, L.; Peng, L.; Zhou, H.; Hu, F. Enterprise pollution reduction through digital transformation? Evidence from Chinese manufacturing enterprises. Technol. Soc. 2024, 77, 102520. [Google Scholar] [CrossRef]
- Babajide, A.A.; Adegboye, F.B.; Omankhanlen, A.E. Financial inclusion and economic growth in Nigeria. Int. J. Econ. Financ. Issues 2015, 5, 629–637. [Google Scholar]
- Allen, F.; Demirguc-Kunt, A.; Klapper, L.; Peria, M.S.M. The foundations of financial inclusion: Understanding ownership and use of formal accounts. J. Financ. Intermed. 2016, 27, 1–30. [Google Scholar] [CrossRef]
- Ozili, P.K. Impact of digital finance on financial inclusion and stability. Borsa Istanb. Rev. 2018, 18, 329–340. [Google Scholar] [CrossRef]
- Alam, A.; Azam, M.; Abdullah, A.B.; Malik, I.A.; Khan, A.; Hamzah, T.A.A.T.; Faridullah; Khan, M.M.; Zahoor, H.; Zaman, K.J.E.S.; et al. Environmental quality indicators and financial development in Malaysia: Unity in diversity. Environ. Sci. Pollut. Res. 2015, 22, 8392–8404. [Google Scholar] [CrossRef] [PubMed]
- Khan, Z.; Ali, S.; Dong, K.; Li, R.Y.M.J.E.E. How does fiscal decentralization affect CO2 emissions? The roles of institutions and human capital. Energy Econ. 2021, 94, 105060. [Google Scholar] [CrossRef]
- Zheng, C.; Chen, H. Revisiting the linkage between financial inclusion and energy productivity: Technology implications for climate change. Sustain. Energy Technol. Assess. 2023, 57, 103275. [Google Scholar] [CrossRef]
- Barajas, A.; Beck, T.; Belhaj, M.; Naceur, S.B.; Cerra, V.; Qureshi, M.S. Financial Inclusion: What Have We Learned So Far? What Do We Have to Learn? International Monetary Fund: Washington, DC, USA, 2020. [Google Scholar]
- Wüstenhagen, R.; Menichetti, E. Strategic choices for renewable energy investment: Conceptual framework and opportunities for further research. Energy Policy 2012, 40, 1–10. [Google Scholar] [CrossRef]
- Usman, M.; Makhdum, M.S.A.; Kousar, R. Does financial inclusion, renewable and non-renewable energy utilization accelerate ecological footprints and economic growth? Fresh evidence from 15 highest emitting countries. Sustain. Cities Soc. 2021, 65, 102590. [Google Scholar] [CrossRef]
- Sahay, M.R.; Cihak, M.; N'Diaye, M.P.; Barajas, M.A.; Mitra, M.S.; Kyobe, M.A.; Mooi, M.; Yousefi, M.R. Financial Inclusion: Can It Meet Multiple Macroeconomic Goals? International Monetary Fund: Washington, DC, USA, 2015. [Google Scholar]
- Bagheri, M.; Guevara, Z.; Alikarami, M.; Kennedy, C.A.; Doluweera, G.J.E.E. Green growth planning: A multi-factor energy input-output analysis of the Canadian economy. Energy Econ. 2018, 74, 708–720. [Google Scholar] [CrossRef]
- Qiu, L.; Yu, R.; Hu, F.; Zhou, H.; Hu, H. How can China's medical manufacturing listed firms improve their technological innovation efficiency? An analysis based on a three-stage DEA model and corporate governance configurations. Technol. Forecast. Soc. Change 2023, 194, 122684. [Google Scholar] [CrossRef]
- Koh, S.; Morris, J.; Ebrahimi, S.M.; Obayi, R. Integrated resource efficiency: Measurement and management. Int. J. Oper. Prod. Manag. 2016, 36, 1576–1600. [Google Scholar] [CrossRef]
- Kirikkaleli, D. Resource efficiency, energy productivity, and environmental quality in Japan. Resour. Policy 2023, 85, 104006. [Google Scholar] [CrossRef]
- Peet, R.; Watts, M. Introduction: Development Theory and Environment in An Age of Market Triumphalism; Taylor & Francis: Abingdon-on, UK, 1993; Volume 69, pp. 227–253. [Google Scholar]
- Wang, L.; Wang, Y.; Sun, Y.; Han, K.; Chen, Y. Financial inclusion and green economic efficiency: Evidence from China. J. Environ. Plan. Manag. 2022, 65, 240–271. [Google Scholar] [CrossRef]
- Oruo, J. The Relationship between Financial Inclusion and GDP Growth in Kenya; University of Nairobi: Nairobi, Kenya, 2013. [Google Scholar]
- Bagli, S.; Adhikary, M. Financial inclusion and human development: A cross-section study in India. Indian Econ. J. 2013, 61, 390–406. [Google Scholar] [CrossRef]
- Evans, O. The effects of economic and financial development on financial inclusion in Africa. Rev. Econ. Dev. Stud. 2015, 1, 21–32. [Google Scholar] [CrossRef]
- Nkwede, F. Financial inclusion and economic growth in Africa: Insight from Nigeria. Eur. J. Bus. Manag. 2015, 7, 71–80. [Google Scholar]
- Okoye, L.U.; Adetiloye, K.A.; Erin, O.; Modebe, N.J. Financial inclusion as a strategy for enhanced economic growth and development. J. Internet Bank. Commer. 2017, 22, 1–144. [Google Scholar]
- Dabla-Norris, E.; Ji, Y.; Townsend, R.M.; Unsal, D.F. Distinguishing constraints on financial inclusion and their impact on gdp and inequality. J. Monet. Econ. 2017, 117, 1–18. [Google Scholar] [CrossRef]
- Williams, H.T. Role of financial inclusion in economic growth and poverty reduction in a developing economy. Intern. J. Res. Econ. Soc. Sci. 2017, 7, 265–271. [Google Scholar]
- Evans, O.; Alenoghena, O. Financial inclusion and GDP per capita in Africa: A Bayesian VAR model. J. Econ. Sustain. Dev. 2017, 8, 44–57. [Google Scholar]
- Erlando, A.; Riyanto, F.D.; Masakazu, S. Financial inclusion, economic growth, and poverty alleviation: Evidence from eastern Indonesia. Heliyon 2020, 6, e05235. [Google Scholar] [CrossRef]
- Ratnawati, K.; Prabandari, S.P.; Kurniasari, I. The impact of financial inclusion on national development and national financial system stability. HOLISTICA–J. Bus. Public Adm. 2022, 13, 63–82. [Google Scholar] [CrossRef]
- Park, C.-Y.; Mercado, R.V. Financial inclusion: New measurement and cross-country impact assessment 1. In Financial Inclusion in Asia and beyond; Routledge: Abingdon-on-Thames, UK, 2021; pp. 98–128s. [Google Scholar]
- David, O.; Oluseyi, A.S.; Emmanuel, A. Empirical analysis of the determinants of financial inclusion in Nigeria: 1990–2016. J. Financ. Econ. 2018, 6, 19–25. [Google Scholar]
- Raza, M.S.; Tang, J.; Rubab, S.; Wen, X. Determining the nexus between financial inclusion and economic development in Pakistan. J. Money Laund. Control 2019, 22, 195–209. [Google Scholar] [CrossRef]
- Le, T.T.; Dang, N.D.L.; Nguyen, T.D.T.; Vu, T.S.; Tran, M.D. Determinants of financial inclusion: Comparative study of Asian countries. Asian Econ. Financ. Rev. 2019, 9, 1107. [Google Scholar] [CrossRef]
- Stromquist, N.P. World Development Report 2019: The Changing Nature of Work: By the World Bank; World Bank: Washington, DC, USA, 2019; p. 151. ISBN 978-1-4648-1342-9/978-1-4648-1328-3/978-1-4648-1356-6. [Google Scholar] [CrossRef]
- Zaidi, S.A.H.; Hussain, M.; Zaman, Q.U. Dynamic linkages between financial inclusion and carbon emissions: Evidence from selected OECD countries. Resour. Environ. Sustain. 2021, 4, 100022. [Google Scholar] [CrossRef]
- Liu, N.; Hong, C.; Sohail, M.T. Does financial inclusion and education limit CO2 emissions in China? A new perspective. Environ. Sci. Pollut. Res. 2022, 29, 18452–18459. [Google Scholar] [CrossRef] [PubMed]
- Singh, A.K.; Raza, S.A.; Nakonieczny, J.; Shahzad, U. Role of financial inclusion, green innovation, and energy efficiency for environmental performance? Evidence from developed and emerging economies in the lens of sustainable development. Struct. Chang. Econ. Dyn. 2023, 64, 213–224. [Google Scholar]
- Sohag, K.; Husain, S.; Hammoudeh, S.; Omar, N. Innovation, militarization, and renewable energy and green growth in OECD countries. Environ. Sci. Pollut. Res. 2021, 28, 36004–36017. [Google Scholar] [CrossRef]
- Amin, N.; Song, H. The role of renewable, non-renewable energy consumption, trade, economic growth, and urbanization in achieving carbon neutrality: A comparative study for South and East Asian countries. Environ. Sci. Pollut. Res. 2023, 30, 12798–12812. [Google Scholar] [CrossRef]
- Mehmood, U.; Tariq, S.; Haq, Z.u.; Nawaz, H.; Ali, S.; Murshed, M.; Iqbal, M. Evaluating the role of renewable energy and technology innovations in lowering CO2 emission: A wavelet coherence approach. Environ. Sci. Pollut. Res. 2023, 30, 44914–44927. [Google Scholar] [CrossRef] [PubMed]
- Dahal, A.; Dhakal, P.; Farooqui, A.A. Role of information technology for the improvement of climate change in the context of nepal. 2020. Available online: https://www.researchgate.net/profile/Pratima-Dhakal/publication/343390922_Role_of_Information_Technology_for_the_Improvement_of_Climate_Change_in_the_Context_of_Nepal/links/5f2796df92851cd302d57a54/Role-of-Information-Technology-for-the-Improvement-of-Climate-Change-in-the-Context-of-Nepal.pdf (accessed on 18 June 2024).
- Kemp, R.; Pearson, P. MEI Project about Measuring Eco-Innovation. Final Report. 2008. Available online: http://www.merit.unu.edu/MEI/index.php (accessed on 18 June 2024).
- Paramati, S.R.; Mo, D.; Huang, R. The role of financial deepening and green technology on carbon emissions: Evidence from major OECD economies. Financ. Res. Lett. 2021, 41, 101794. [Google Scholar] [CrossRef]
- Usman, A.; Ozturk, I.; Naqvi, S.M.M.A.; Zafar, S.M.; Javed, M.I. Green versus conventional growth in the EKC framework of top pollutant footprint countries: Evidence based on advanced panel data techniques. Geol. J. 2023, 58, 3368–3384. [Google Scholar] [CrossRef]
- Hussain, Z.; Mehmood, B.; Khan, M.K.; Tsimisaraka, R.S.M.J.F.i.P.H. Green growth, green technology, and environmental health: Evidence from high-GDP countries. Front. Public Health 2022, 9, 816697. [Google Scholar] [CrossRef] [PubMed]
- Tram, T.X.H.; Lai, T.D.; Nguyen, T.T.H. Constructing a composite financial inclusion index for developing economies. Q. Rev. Econ. Finance 2023, 87, 257–265. [Google Scholar] [CrossRef]
- Wang, Q.; Qu, J.; Wang, B.; Wang, P.; Yang, T. Green technology innovation development in China in 1990–2015. 2019, 696, 134008. Sci. Total Environ. 2019, 696, 134008. [Google Scholar] [CrossRef] [PubMed]
- Usman, M.; Kousar, R.; Makhdum, M.S.A.; Yaseen, M.R.; Nadeem, A.M. Do financial development, economic growth, energy consumption, and trade openness contribute to increase carbon emission in Pakistan? An insight based on ARDL bound testing approach. Environ. Dev. Sustain. 2022, 25, 444–473. [Google Scholar] [CrossRef]
- Sohag, K.; Taşkın, F.D.; Malik, M.N. Green economic growth, cleaner energy and militarization: Evidence from Turkey. Resour. Policy 2019, 63, 101407. [Google Scholar] [CrossRef]
- Pesaran, M.H.; Schuermann, T.; Weiner, S.M. Modeling regional interdependencies using a global error-correcting macroeconometric model. J. Bus. Econ. Stat. 2004, 22, 129–162. [Google Scholar] [CrossRef]
- De Hoyos, R.E.; Sarafidis, V. Testing for cross-sectional dependence in panel-data models. Stata J. 2006, 6, 482–496. [Google Scholar] [CrossRef]
- Hsiao, C.; Pesaran, M.H. Random coefficient models. In The Econometrics of Panel Data: Fundamentals and Recent Developments in Theory and Practice; Springer: Berlin/Heidelberg, Germany, 2008; pp. 185–213. [Google Scholar]
- Baltagi, B.H.; Li, Q. A transformation that will circumvent the problem of autocorrelation in an error-component model. J. Econom. 1991, 48, 385–393. [Google Scholar] [CrossRef]
- Pesaran, M.H. Estimation and inference in large heterogenous panels with cross section dependence. 2003. Available online: https://papers.ssrn.com/sol3/papers.cfm?abstract_id=385123 (accessed on 18 June 2024).
- Bai, J.; Ng, S. Panel unit root tests with cross-section dependence: A further investigation. Econom. Theory 2010, 26, 1088–1114. [Google Scholar] [CrossRef]
- Pedroni, P. Critical values for cointegration tests in heterogeneous panels with multiple regressors. Oxf. Bull. Econ. Stat. 1999, 61, 653–670. [Google Scholar] [CrossRef]
- Kao, C. Spurious regression and residual-based tests for cointegration in panel data. J. Econom. 1999, 90, 1–44. [Google Scholar] [CrossRef]
- Hall, S.G.; Asteriou, D. Applied Econometrics; Palgrave MacMillan: London, UK, 2016. [Google Scholar]
- Phillips, P.C. Fully modified least squares and vector autoregression. Econom. J. Econom. Soc. 1995, 63, 1023–1078. [Google Scholar] [CrossRef]
- Zellner, A. Statistical analysis of econometric models. J. Am. Stat. Assoc. 1979, 74, 628–643. [Google Scholar] [CrossRef]
- Granger, C.W. Investigating causal relations by econometric models and cross-spectral methods. Econom. J. Econom. Soc. 1969, 37, 424–438. [Google Scholar] [CrossRef]
- Dumitrescu, E.-I.; Hurlin, C. Testing for Granger non-causality in heterogeneous panels. Econ. Model. 2012, 29, 1450–1460. [Google Scholar] [CrossRef]
- Zhang, L.; Saydaliev, H.B.; Ma, X. Does green finance investment and technological innovation improve renewable energy efficiency and sustainable development goals. Renew. Energy 2022, 193, 991–1000. [Google Scholar] [CrossRef]
- Chen, C.; Pan, J. The effect of the health poverty alleviation project on financial risk protection for rural residents: Evidence from Chishui City, China. Int. J. Equity Health 2019, 18, 79. [Google Scholar] [CrossRef]
- Mushtaq, N.; Manjiang, X.; Bakhtawar, A.; Mufti, M.A. Elevating the Influence of HR Analytics on Organizational Performance: An Empirical Investigation in Hi-Tech Manufacturing Industry of a Developing Economy. J. Chin. Hum. Resour. Manag. 2024, 15, 3–40. [Google Scholar]
- Ali, N.; Phoungthong, K.; Techato, K.; Ali, W.; Abbas, S.; Dhanraj, J.A.; Khan, A. FDI, green innovation and environmental quality nexus: New insights from BRICS economies. Sustainability 2022, 14, 2181. [Google Scholar] [CrossRef]
- Duan, W.; Madasi, J.D.; Khurshid, A.; Ma, D. Industrial structure conditions economic resilience. Technol. Forecast. Soc. Chang. 2022, 183, 121944. [Google Scholar] [CrossRef]
- Zheng, C.; Wu, S.; Teng, Y.-P.; Wu, S.; Wang, Z. Natural resources, tourism resources and economic growth: A new direction to natural resources perspective and investment. Resour. Policy 2023, 86, 104134. [Google Scholar] [CrossRef]
- Xu, A.; Jin, L.; Yang, J. Balancing tourism growth, Fintech, natural resources, and environmental sustainability: Findings from top tourist destinations using MMQR approach. Resour. Policy 2024, 89, 104670. [Google Scholar] [CrossRef]

Disclaimer/Publisher’s Note: The statements, opinions and data contained in all publications are solely those of the individual author(s) and contributor(s) and not of MDPI and/or the editor(s). MDPI and/or the editor(s) disclaim responsibility for any injury to people or property resulting from any ideas, methods, instructions or products referred to in the content. |
© 2024 by the authors. Licensee MDPI, Basel, Switzerland. This article is an open access article distributed under the terms and conditions of the Creative Commons Attribution (CC BY) license (https://creativecommons.org/licenses/by/4.0/).