Article

Scenario Analysis of Electricity Demand in the Residential Sector Based on the Diffusion of Energy-Efficient and Energy-Generating Products

by
Yusuke Kishita
1,*,
Yohei Yamaguchi
2,
Yuji Mizuno
3,
Shinichi Fukushige
4,
Yasushi Umeda
1 and
Yoshiyuki Shimoda
2
1
School of Engineering, The University of Tokyo, Tokyo 113-8656, Japan
2
Graduate School of Engineering, Osaka University, Osaka 565-0871, Japan
3
The Institute of Applied Energy, Tokyo 105-0003, Japan
4
School of Creative Science and Engineering, Waseda University, Tokyo 169-8555, Japan
*
Author to whom correspondence should be addressed.
Sustainability 2024, 16(15), 6435; https://doi.org/10.3390/su16156435 (registering DOI)
Submission received: 15 May 2024 / Revised: 17 July 2024 / Accepted: 25 July 2024 / Published: 27 July 2024
(This article belongs to the Section Environmental Sustainability and Applications)

Abstract

:
A variety of energy-efficient and energy-generating products, such as photovoltaics (PV) and electric vehicles, have diffused into the market to reduce greenhouse gas emissions in the residential sector. Understanding future changes in electricity demand and supply is complicated by uncertainties such as lifestyle shifts and national energy policies, and how such changes interact with the diffusion of products. To address this issue, this study adopts a scenario approach to analyze the impact of product diffusion on residential electricity demand under different social circumstances. Two simulation models are employed for the analysis: (i) a model for estimating the diffusion of products based on consumer preferences and (ii) a model to estimate electricity demand in residential sectors considering product diffusion. To demonstrate the proposed method, a scenario analysis case study was conducted, estimating the electricity demand in the residential sector of Toyonaka City, Osaka, Japan, for 2030. The results show that compared to 2012, the net electricity demand in the city in 2030 is projected to decrease by 20–39% depending on the scenarios considered, with changes in demographics and PV diffusion identified as among the most critical factors.

1. Introduction

The use of energy-efficient and energy-generating products, such as solar-powered photovoltaic (PV) systems, electric vehicles (EVs), and heat-pump water heaters, is increasingly common. This trend aims to reduce energy consumption and contribute to achieving a low-carbon future. The proliferation of these products significantly impacts the structure of electricity demand in the future. Several scholars have analyzed the influence of such product diffusion on future electricity demand [1,2,3]. Given the time required (e.g., 10 years) to develop a regional power grid system, numerous future changes and uncertainties must be considered, such as shifts in consumer lifestyles, changes in energy policies, and the adoption of energy-efficient and energy-generating products in society. Therefore, it is essential to analyze regional electricity demand in the residential sector by considering potential future scenarios and their implications. Nevertheless, less research has developed methodologies to comprehend the interplay between social changes and uncertainties, product diffusion dynamics, and regional electricity demand within a specific area.
To address this issue, we have devised a method for delineating scenarios of regional electricity demand under varying assumptions concerning future societal developments, employing a scenario-and-simulation approach [4]. In this study, scenarios are defined as narrative descriptions detailing the potential unfolding of alternative futures [5,6]. To quantify these narrative scenarios, we have developed a residential next-generation electricity demand model aimed at estimating electricity consumption in residential sectors, while accounting for future product diffusion (see Section 3.2). Our objective is not to precisely predict the configuration of future power grid systems, but rather to analyze the effects of energy-efficient and energy-generating product diffusion on regional power grids. Ultimately, our goal is to illuminate the requisites for realizing an ideal vision of regional power grid systems by identifying the factors exerting the greatest influence on future electricity demand through these scenarios. In a prior investigation [7], we delineated electricity demand scenarios incorporating the proliferation of PVs and EVs in the residential sector, illustrating the imperative of energy conservation. In this study, we have developed a generalized methodology to assess the impact of diffusion on future power demand within the residential sector. Consequently, we have broadened the scope of scenarios outlined in our earlier work [7] to encompass energy-efficient household appliances beyond PVs and EVs. Here, we conduct a scenario analysis of electricity demand within the residential sector of Toyonaka City, Osaka, Japan, for the year 2030.
The remainder of this paper is organized as follows. Section 2 delineates the present state of electricity demand in the Japanese residential sector, along with the pertinent literature. Section 3 elaborates on a scenario analysis method devised for estimating electricity demand within the residential sector. Section 4 showcases a case study involving a Japanese city to exemplify the proposed method. Section 5 deliberates on the efficacy of the method, and Section 6 provides concluding remarks.

2. Related Work on Residential Sector Electricity Demand

2.1. Related Studies

Numerous studies have examined electricity demand in residential sectors. For instance, Shimoda et al. [8] devised a model to compute energy demand based on resident behavior. Other studies investigated the effects of adopting energy-efficient and energy-generating products. These include assessing energy-efficiency gains from replacing electrical appliances [9], forecasting the future diffusion of PVs and solar water heaters [10], analyzing reductions in peak electricity demand through PVs and EVs [11], and examining changes in electricity demand with time zone-based pricing [12]. Sun et al. [2] evaluated the economic and environmental benefits of integrating PV, energy storage, and EV charging stations. Similarly, Sagaria et al. [1] simulated the potential of PVs and EV integration under various driving profiles and vehicle types. Betancourt-Torcat et al. [13] developed a power supply chain network model for EVs to determine the required number of charging stations. Thakur et al. [14] analyzed the use of second-life EV batteries for residential stationary storage. Yu et al. [15] proposed a framework to assess the real-time flexibility of commuter plug-in electric vehicles in office buildings using Monte Carlo simulations. Kobashi et al. [16] conducted a techno-economic analysis of rooftop PVs with stationary batteries and EVs in residential districts. Zhang et al. [17] developed an agent-based simulation model of PVs in Singapore’s residential sector considering consumer behavior.
Olsson and Gardumi [18] examined technological options aiming to minimize electricity system costs in Bangladesh under varied scenario assumptions (e.g., PV capacity) using the linear optimization model OSeMOSYS. Similar methodologies have been employed in other regions, such as Ethiopia [19], the Dominican Republic [20], and Brazil [21], utilizing the OSeMOSYS framework. Another prevalent bottom-up optimization model, TIMES, is frequently utilized for analyzing prospective energy systems, incorporating scenarios differing in factors such as carbon taxes and renewable targets. For instance, Di Leo et al. [22] conducted a regression analysis to forecast energy demand across residential, transport, and commercial sectors, while Tash et al. [23] explored the German electricity supply sector, integrating renewable energy technologies (wind and PV) and carbon taxes. Oshiro et al. [24] employed the AIM/Enduse model, a detailed bottom-up energy system model focusing on cost optimization, to assess final energy demand in Japan up to 2050, considering various scenarios with differing energy service demand levels.

2.2. Problem Identification

As reviewed in Section 2.1, both a simulation-based approach and a scenario-based approach, often combined with optimization models, were used to explore future electricity systems at the district or national level. However, when attempting to analyze the future electricity demand in the residential sector, we identified two research issues to be addressed.
First, the interconnections among social dynamics (e.g., energy policy and consumer lifestyles), product diffusion (e.g., EVs and PVs), and residential electricity demand in the concerned region remain insufficiently understood. While prior research [22,23] has explored the impact of energy-efficient and energy-generating product proliferation on electricity demand, it has often neglected the influence of diverse consumer behaviors and preferences. This oversight is partly due to the simplification inherent in simulation-based or scenario-driven optimization models used in existing studies. Consumer behaviors particularly at the household level [8,25] exert significant influence on residential electricity demand. Consumer preferences play a crucial role in consumer decision-making regarding the adoption of new products (e.g., EVs and PVs), thereby affecting their diffusion rates within the region [7,17,26].
Second, prior research has not examined the effects of future changes and uncertainties on residential electricity demand. While sensitivity analysis has identified key environmental and economic factors (e.g., [27,28,29]), studies have yet to delve into the household-level dynamics of consumer behavior within the residential sector. Despite the development of future scenarios for low-energy demand, smart grids, and renewable energy by various research organizations [30,31], the demand side of the residential sector remains unexplored in terms of individual consumer behaviors. Notably, no research has explicitly outlined the causal relationship between future changes and uncertainties in social contexts and their impact on electricity demand at the household level in the target region, ensuring internal consistency between them. This lack of clarity in the causal relationship hampers policymakers’ ability to assess the validity of results, underlying assumptions, and their interrelations.

3. Scenario Analysis for Estimating Residential Sector Electricity Demand

3.1. Approach

To address the research issues outlined in Section 2.2, we employ a scenario-and-simulation approach, detailed in Figure 1, to develop a method for analyzing future electricity demand in the residential sector. We integrate narrative scenarios to depict potential futures using two simulation models: the product diffusion estimation model and the residential next-generation electricity demand model.
This study focuses on energy-efficient and energy-generating products that significantly influence electricity demand in the residential sector. Specifically, we consider refrigerators, televisions, and air conditioners, which collectively represent a substantial portion of power consumption in Japan’s residential sector, along with PV systems and EVs analyzed in a previous study [7]. Additionally, we investigate heat-pump water heaters, LED lighting, and residential heat insulation, anticipating their increased prevalence in the future. For simplicity, we disregard potential future energy-efficient performance improvements on other household appliances. Scenarios for this study are constructed by assuming future performance enhancements of energy-efficient and energy-generating products, with estimated diffusion rates for each product per year. Subsequently, residential sector electricity demand is calculated based on these diffusion rates.
When describing narrative scenarios, we utilized existing technology roadmaps and other sources to estimate the future performance of energy-efficient and energy-generating products at the time of shipment. We developed a model, termed the product diffusion estimation model, to estimate the diffusion rate of these products by performance. To account for variations in consumer adoption timing, energy-efficient and energy-generating products were categorized into two types: (1) currently diffusing products, with diffusion rates increasing through new purchases and appliance upgrades, and (2) saturated products, with diffusion rates increasing solely through appliance upgrades. The diffusion rates of currently diffusing products were estimated by integrating the product choice forecasting model, which calculates diffusion rates of new purchases of durable consumer goods [26], with the appliance replacement model, which calculates the inflow–outflow of products per year based on the stock–flow concept [9]. Conversely, the diffusion rates of saturated products were estimated solely through the appliance replacement model, by calculating the inflow–outflow of products per year based on appliance replacement.
We developed a residential next-generation electricity demand model (see Section 3.2) to estimate power demand, accounting for the adoption of energy-efficient and energy-generating products. The model applied to a specific region, considers household count, consumer behavior, product adoption rates, and performance. Results from the product diffusion estimation model inform input conditions for household adoption and product performance. The detailed connection between the product diffusion estimation model and the residential next-generation electricity demand model is illustrated in Figure A1.

3.2. Residential Next-Generation Electricity Demand Model

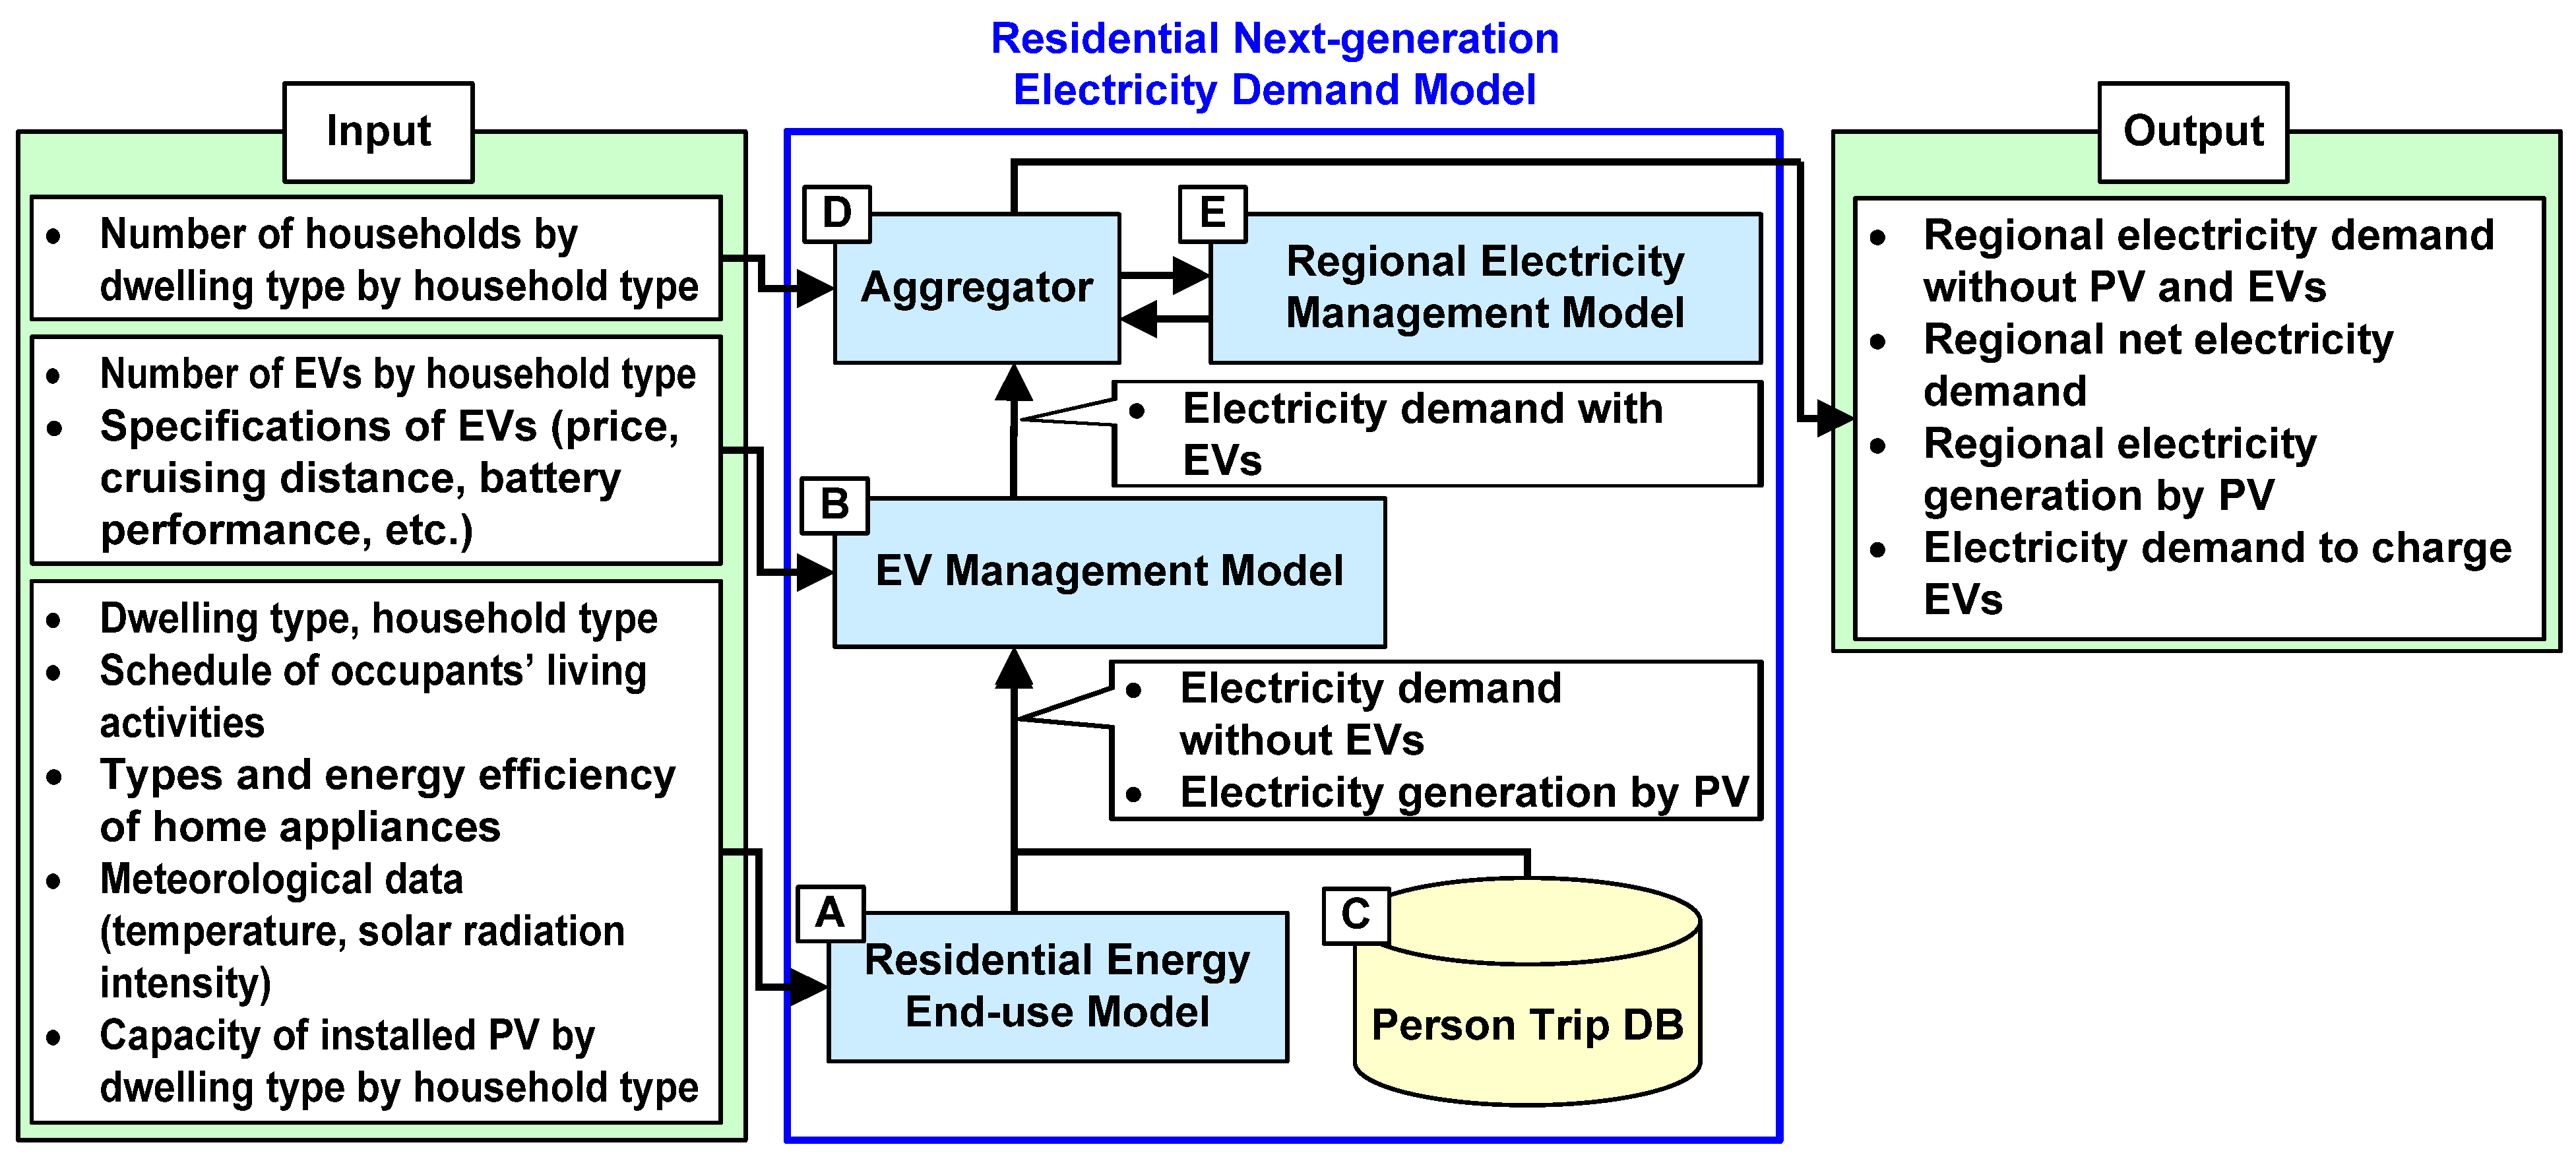
The output of the model is the electricity demand of the residential sector. The inputs include the number of households in the region, the daily life behavior of consumers, and the diffusion rates and product performances of various energy-efficient and energy-generating products (e.g., PVs and EVs). Figure 2 illustrates the overall structure of the model. The functions of components (A)–(E) in Figure 2 are as follows:
A.
Residential Energy End-use Model [8]: This model calculates household electricity demand and PV power generation based on, e.g., family composition, dwelling type, weather conditions, and resident behavior, utilizing statistical data, measurements, and questionnaire survey results.
B.
EV Management Model: This model incorporates EV adoption and specifications (e.g., price, cruising distance, battery performance) to calculate household electricity demand, including EV charging.
C.
Person Trip Database: This database stores frequency distribution data for daily driving distances and times. In component (B), the stored data are used to determine the timing of charging and discharging EV batteries. This enabled the calculation of regional electricity demand for EVs.
D.
Aggregator: Calculates regional electricity demand by multiplying household electricity demand per unit by the number of households and the amount of PV power generated. Electricity demand with EVs per household is calculated by the above components (A)–(C).
E.
Regional Electricity Management Model: Utilizing EV usage patterns and person trips per household by referring to component (C), this model determines the optimal charging/discharging pattern for EV storage batteries to minimize peak daily net electricity demand in the region, considering both PV-generated electricity and household demand. In the case study section, this model is applied to Scenario B–M (see Figure 3).

3.3. Product Diffusion Estimation Model

As discussed in Section 3.1, the product diffusion estimation model consists of two sub-models: the product choice forecasting model [26] and the appliance replacement model [9]. Descriptions of these models are provided below. The variables used in these models are listed in Table A1.
(1)
Product choice forecasting model [26]
This model combines the consumer preference model with the Bass model [32], commonly employed for long-term product diffusion forecasting. In the model, individuals purchasing a new product for the first time are categorized as “innovators” if they initiate purchases independently and as “imitators” if their decision is influenced by the adoption rate. Suppose that the maximum diffusion rate of new products is a constant Nsat, the coefficients for innovators and imitators are p and r, respectively, and the initial year of product diffusion is t0, the diffusion rate n(t) relative to Nsat in year t is given by the following equation:
d n ( t ) / d t = { ( p + r n ( t ) ) ( 1 n ( t ) ) } H ( t ) / H ( t 0 )
where parameters p and r are generally identified based on past diffusion records of the same or similar products. The term H(t)/H(t0) represents the effect of consumer preference on diffusion, where H(t) represents the percentage of consumers i with a higher utility Ui for the new diffusing product compared with other competing products in year t, and H(t0) represents H(t) in the initial year. The utility Ui is expressed using the following equation:
U i = j ( w i j s j )
where sj is the level of the attribute (preference factor) j and wij is the weighting factor for attribute j of consumer i. The weighting factor wij was identified through conjoint analysis using questionnaire surveys.
(2)
Appliance replacement model
The model, drawing from the stock flow framework for a singular product [9], computes variations in household product stock by accounting for inflow (products adopted) and outflow (products eliminated). Suppose that the initial year of stock calculation is t0, and product stock S(t) in year t is given by the following equation:
S ( t ) = S ( t 0 ) + k = t 0 t I ( k ) k = t 0 t O ( k )
where I(t) and O(t) are the inflows and outflows of the product in year t, respectively. For currently diffusing products, I(t) is the result of calculations in the product choice forecasting model. However, I(t) for diffusion-saturated products must be obtained from the product sales data. The relationship between the inflow and outflow is defined as follows:
O ( t + L T ) = I ( t )
where LT is the product lifetime. For simplicity, Equation (4) ignores the change in inflows and outflows associated with a change in the number of households over time. Furthermore, the performance distribution for each year’s stock was derived by assuming the product performance for each year of shipment.

4. Case Study: Scenario Analysis of Residential Sector Electricity Demand in Toyonaka City for 2030

4.1. Overview of the Case Study

This section presents a case study involving a Japanese city demonstrating the effectiveness of the proposed method. The case study was conducted within the governmental research project titled “Development of Evaluation Model of Energy Management Systems Using Electrical Energy Storage Systems” (2010–2015). It should be noted that the case study shown here was used for demonstration purposes to validate the proposed method.
In this study, a regional electricity demand scenario was constructed for the residential sector, focusing on Toyonaka City, Osaka (population: 390,338; area: 36.38 km2 in 2012) from 2012 to 2030. The energy-efficient and energy-generating products considered for diffusion were the eight products outlined in Section 3.1: PV, EVs, refrigerators, televisions, air conditioners, heat-pump water heaters, LED lighting, and residential heat insulation. Based on current ownership percentages, we classified currently diffusing products (PV, EVs, heat-pump water heaters, and LED lighting) and diffusion-saturated products (refrigerators, televisions, air conditioners, and residential heat insulation) into four product types each.
Referring to the authors’ prior work [33], experts participating in the research project developed two storylines (see Section 4.2). The experts chose energy policies as a key driver to describe two distinct scenarios because it was seen as the most uncertain and influential on regional energy demand. Based on these storylines, we calculated the diffusion rates of energy-efficient and energy-generating products, as well as the residential sector electricity demand, using scenario assumptions gathered from various statistical data, roadmaps, literature surveys, and questionnaire surveys, among other sources.

4.2. Scenario Storylines and Assumptions

Figure 3 illustrates two 2030 scenarios depicting varying diffusion conditions for energy-efficient and energy-generating products, driven primarily by the “introduction of new energy policies”: (A) the baseline scenario and (B) the environmental technology diffusion scenario. Scenario B envisions a future where such products are more prevalent, with superior performance compared to Scenario A. Scenario B–M incorporates a power management strategy aimed at reducing peak daily net electricity demand in the residential sector of Toyonaka City in Scenario B (calculated as household appliance electricity consumption minus PV-generated electricity), achieved through the utilization of EV storage batteries.
In line with scenario storylines, we made different assumptions between the two scenarios based on a literature review where Scenario A assumes extrapolation from the present, whereas Scenario B assumes technological innovation induced by energy/environmental policies. A partial list of assumptions for the diffusion of energy-efficient and energy-generating products is presented in Table A2. In the diffusion calculations for currently diffusing products (PV, EVs, heat pump water heaters, and LED lighting), the maximum diffusion rate Nsat in the product choice forecasting model [26] was determined as follows: First, the cost payback time for all products was assumed for each scenario. For PV, the initial cost ranged from JPY 131,000 (Scenario B) to JPY 432,000 (Scenario A), based on the technology roadmap [34], as shown in Table A2. These costs were divided by sales, and considering the reverse trend in PV power generation, the cost payback times ranged from 2.7 years (Scenario B) to 7.4 years (Scenario A) [33]. It should be noted that, for simplicity, any discount rate of the prices and costs was not considered in Table A2, all of which were assumed at constant prices in 2012. Second, we derived the distribution of the cost payback time that consumers can tolerate based on a questionnaire survey [35] and determined Nsat as the percentage corresponding to the condition for the cost payback time for each scenario in the distribution. For example, in the case of PV, the value of Nsat was set in the range of 16.1% (Scenario A) to 51.8% (Scenario B) of the total number of detached houses.
Additionally, the lifetimes of products used in the appliance replacement model calculations were sourced from multiple references [36,37,38,39]. Improvements in energy performance for heat-pump water heaters, LED lighting, air conditioners, refrigerators, and televisions were assumed based on various technology roadmaps [34,37,40] for Scenario B. For Scenario A, improvements were assumed to progress at half the rate of Scenario B. To analyze the influence of consumer preferences, the values of the weighting factor wij in Equation (2) for PV and EV were identified based on questionnaire surveys as depicted in Table A3.

4.3. Estimation of the Energy-Efficient and Energy-Generating Product Diffusion Rate and Electricity Demand

Table 1 presents calculated diffusion figures for 2030 regarding currently diffusing products. This case study focuses on two types of EVs equipped with storage batteries: mid-sized EVs and plug-in hybrid vehicles (PHVs). We assume the stock of diffusion-saturated products remains constant from 2012 to 2030, with products being replaced at the end of their service lives (see Table 1).
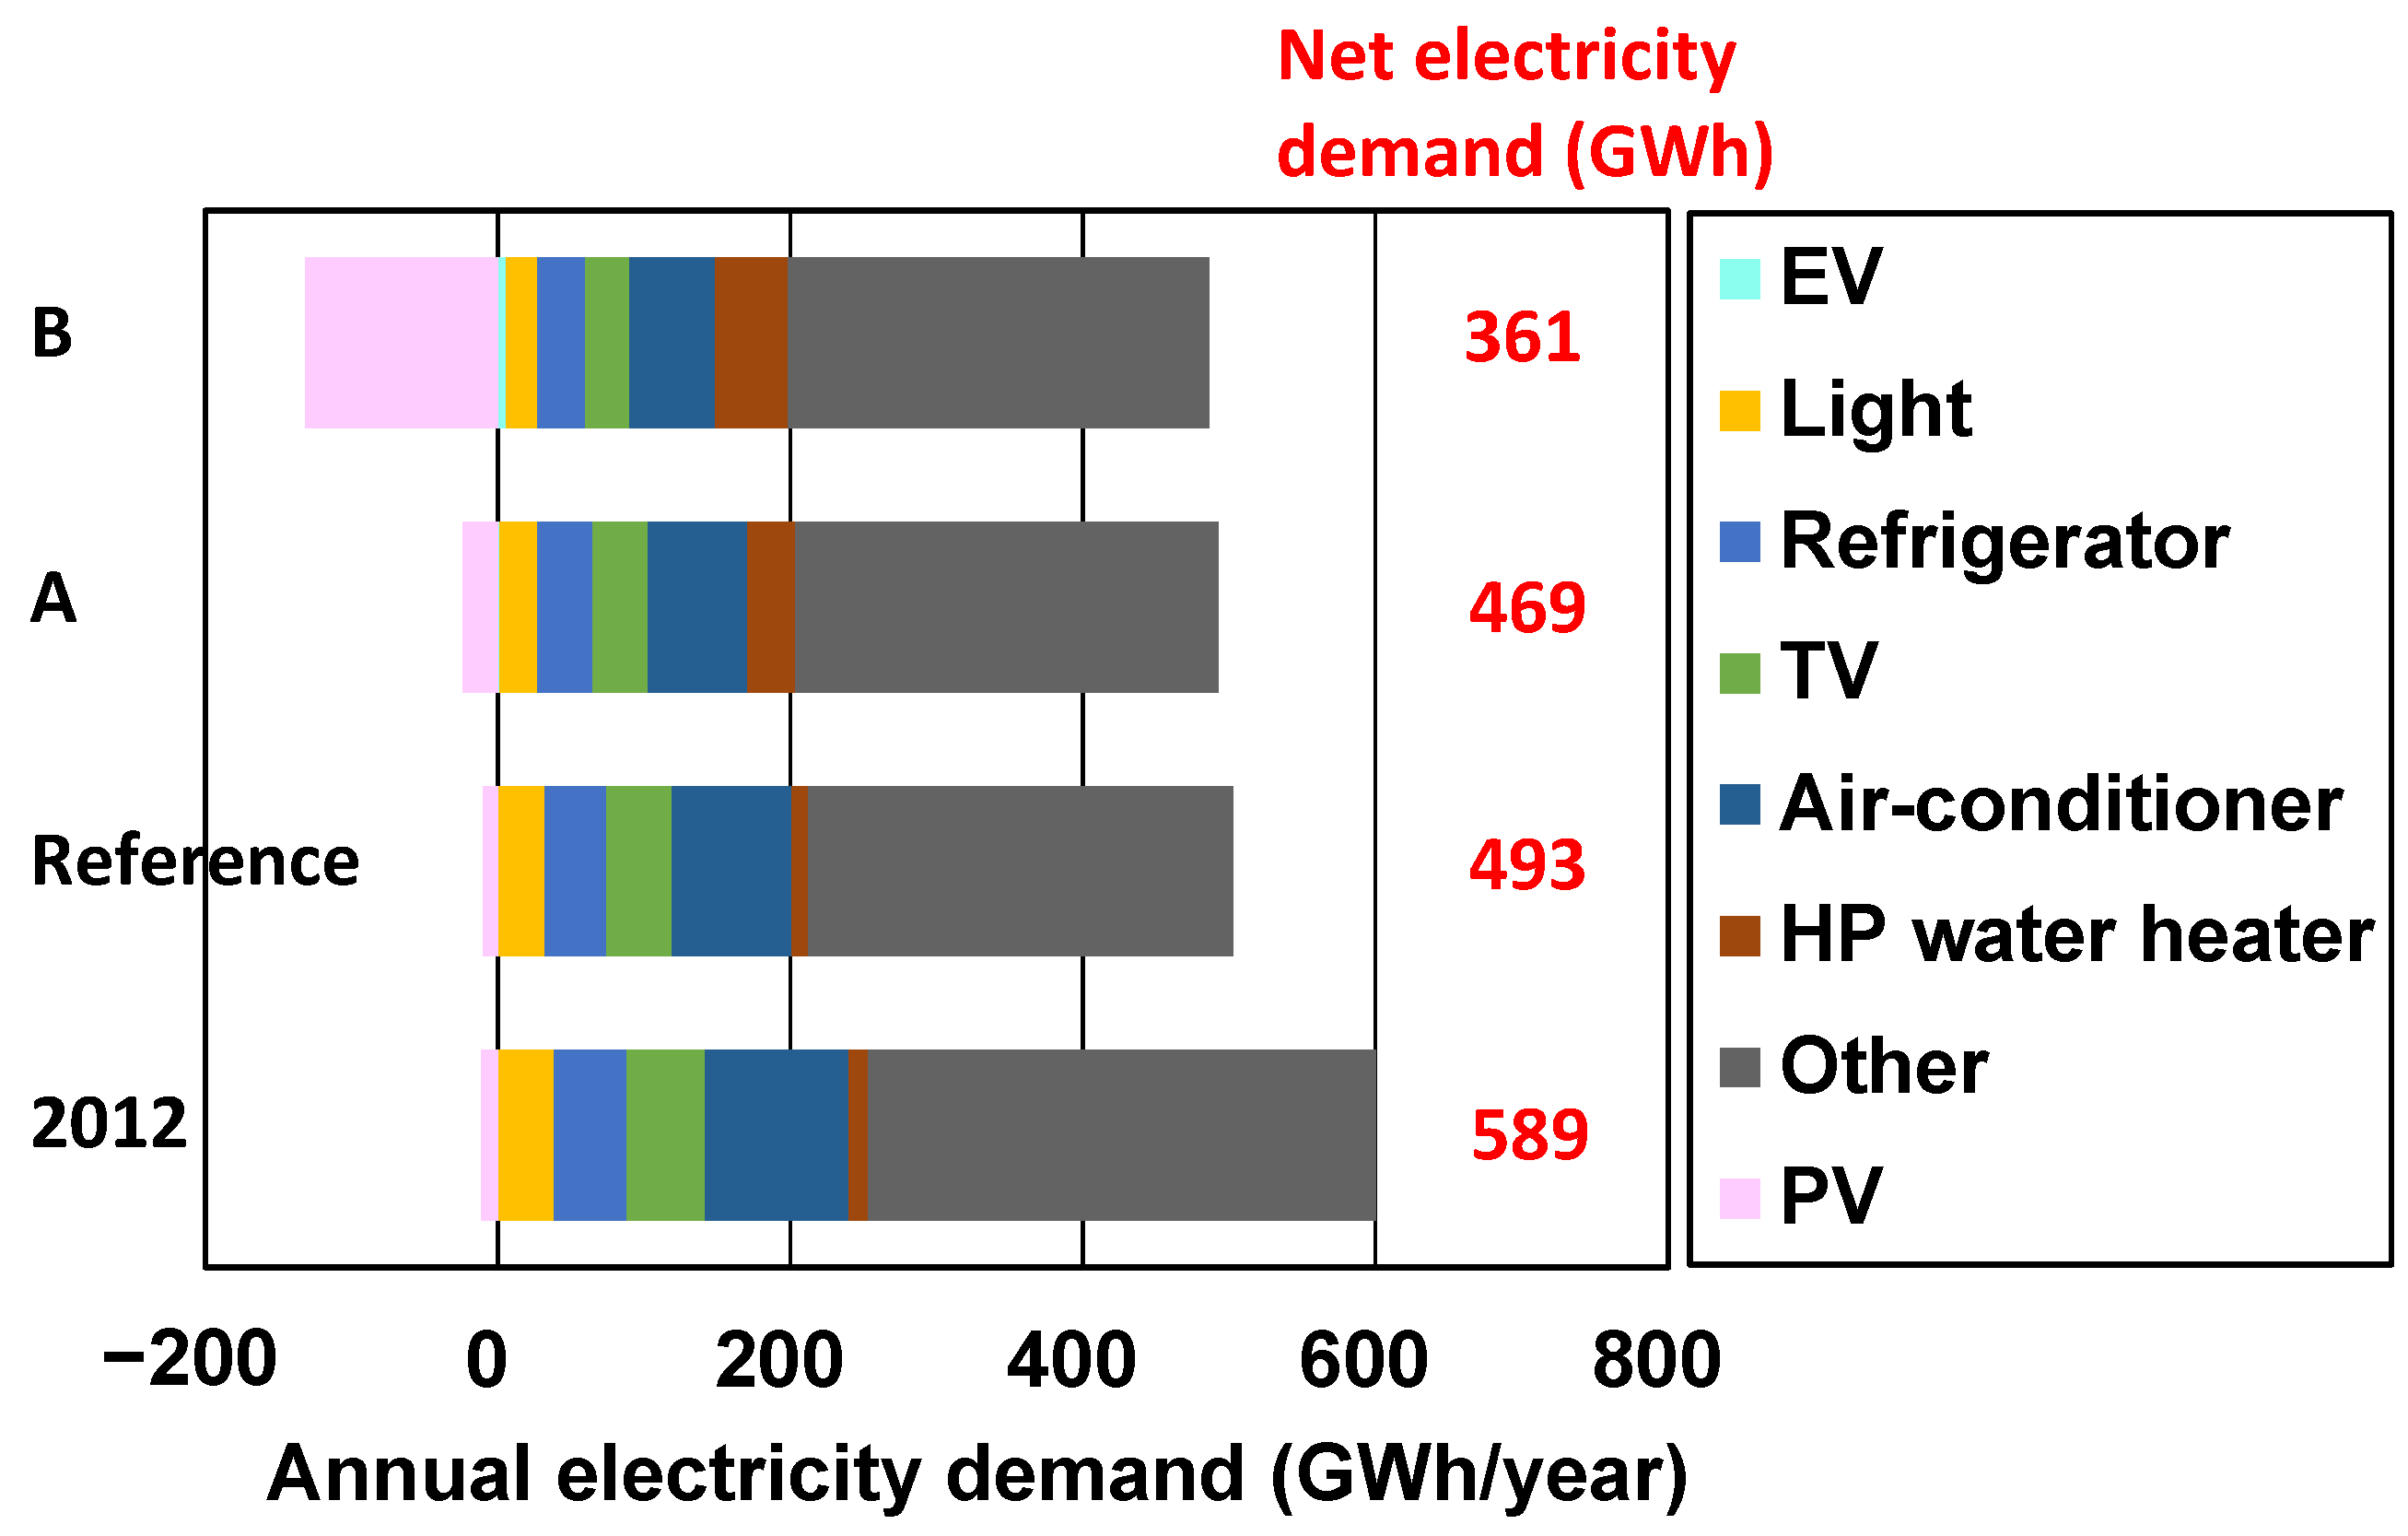
Figure 4 illustrates the results of calculating annual electricity demand in Toyonaka City’s residential sector, based on estimations of energy-efficient and energy-generating product diffusion by performance. In comparison with 2012, annual net electricity demands for Scenarios A and B decreased by 120 GWh (20.3%) and 228 GWh (38.7%), respectively. The Reference Scenario depicted in Figure 4 maintains the same product diffusion rate and performance as in 2012, with the number of households and household composition aligned with 2030. Comparing the 2012 and Reference Scenarios, annual net electricity demand decreased by 96 GWh (=589–493 GWh) due to the decline in the number of households from 2012 to 2030. We then investigated the impact of energy-efficient and energy-generating product diffusion, excluding the decline in the number of households, on electricity demand. Compared to the Reference Scenario, annual net electricity demands for Scenarios A and B decreased by 24 and 132 GWh, respectively. These reductions correspond to a 25% and 138% drop, respectively, attributable to the decline in the number of households (96 GWh). To analyze the impact of each appliance, we examined the breakdown of electricity demand in Scenario B. The amount and percentage of net electricity demand (361 GWh) for each appliance, in descending order, are as follows: other—288 GWh (79.8%), PV—−131 GWh (−36.3%), air conditioners—58.5 GWh (16.2%), heat-pump water heaters—49.7 GWh (13.8%), refrigerators—32.7 GWh (9.1%), televisions—30.2 GWh (8.4%), lighting—21.7 GWh (6.0%), and EVs—5.7 GWh (1.6%).
Figure 5 displays the load curve for the Toyonaka residential sector on a single day in August. In Scenario A, the peak net electricity demand reaches 86.6 MW at 19:00. At this time, power consumption by the appliance is distributed as follows: air conditioners (39.4 MW, 45.5%), other appliances (20.5 MW, 23.7%), lighting (10.0 MW, 11.6%), televisions (9.7 MW, 11.1%), and refrigerators (7.1 MW, 8.2%). Conversely, Scenario B peaks at 77.5 MW at 19:00, indicating a 9.1 MW reduction compared to Scenario A. The primary factor contributing to this discrepancy is the differing energy performance of air conditioners in the two scenarios. Notably, Scenario A exhibits two peaks, occurring at 7:00 (77.3 MW) and 19:00 (86.6 MW), while Scenario B displays an additional peak at 5:00 (70.9 MW) due to heat-pump water heaters’ heat diffusion. Assuming peak minimization through EV batteries in Scenarios B–M, the graph suggests the potential leveling of net electricity demand to 49.9 MW (dashed green line in Figure 5). However, Scenario B–M’s daily net electricity demand totals 1198.3 MWh, representing a 1.8% increase compared to Scenario B (1177.7 MWh) due to storage battery capacity loss.

5. Discussion

5.1. Key Findings from the Case Study

As demonstrated in Section 4, we described two scenarios representing varying diffusion conditions for energy-efficient and energy-generating products by 2030 and compared their respective electricity demands.
Figure 4 illustrates a discrepancy of 96 GWh between the 2012 and reference scenarios, with a decline in households being a major factor influencing electricity demand changes. However, the annual net electricity demand difference between Scenarios A and B was 108 GWh. The variance in energy-efficient and energy-generating product diffusion in Scenarios A and B exerted a similar impact on electricity demand change as households decline. This study assumed the diffusion of eight types of products, with PV power generation showing −23.7 GWh (−5.1% of net electricity demand) in Scenario A and −131 GWh (−36.3%) in Scenario B. Comparing these results suggests PV diffusion as a dominant factor in reducing net electricity demand. Furthermore, air conditioner usage during peak net electricity demand in Scenario A (19:00) accounted for 45.5% (39.4 MW) of home appliance consumption. Conversely, improving the energy efficiency of air conditioners, lighting, and televisions, as depicted in Scenario B, could reduce peak demand by 10.6% from 86.6 MW to 77.5 MW. Especially for high-consumption air conditioners, substantial energy savings can be attained through upgrades to models with higher energy performance. While Scenarios A and B assumed significantly different diffusion rates for products, conducting sensitivity analyses with varying diffusion rates is necessary to comprehensively analyze their impact on electricity demand for each product. In addition, the impacts of demographic changes, technological advancement, and consumer preferences on diffusion rates need to be further investigated. However, such analyses remain unaddressed and should be explored in future studies.
As previously stated, Scenario B exhibits an annual net electricity demand of 108 GWh lower than that of Scenario A. However, the diffusion of heat-pump water heaters may lead to a peak at 5:00, as depicted in Figure 5. One approach to mitigate this peak is to employ EV storage batteries, as illustrated in Scenario B–M in Figure 5b, and/or adjust the operating schedule of heat-pump water heaters. Nevertheless, Scenario B–M assumes an ideal condition where all EVs connected to the grid can contribute to peak reduction. Further investigation is necessary to assess the feasibility of this strategy. In essence, incentivizing households to utilize their EVs for peak reduction requires careful consideration. We aim to address this through consumer surveys and interviews in future research.

5.2. Methodological Contributions Relative to the Literature

The proposed method is valuable for analyzing changes in residential electricity demand across various future scenarios. This study offers two primary methodological contributions based on case study findings.
First, the proposed method combines scenario narratives (see Figure 3) with simulation models (specifically, the next-generation residential electricity demand and product diffusion estimation models). This integration facilitates iterative cycles that envision potential futures through narrative scenarios, parameterize each scenario, estimate household product diffusion rates and resulting electricity demand, and refine scenarios until sufficient insights are gained. These cycles pinpoint future electricity demand “hot spots,” aiding in the extraction of key measures (e.g., technological advancements, policy options) to mitigate electricity demand. In contrast to prior studies utilizing scenario-based approaches with optimization models (e.g., [22,24], as mentioned in Section 2.2), the proposed method distinguishes itself by providing explicit rationales for parameter value adjustments in response to future uncertainties (as illustrated by scenario storylines in Figure 3 and scenario assumptions in Table A2). This enhances the transparency of simulation results and fosters better communication among researchers and stakeholders. In this way, the combination of scenario narratives and two models (Figure 1) provides an effective way of understanding the causal relationship between future changes and uncertainties, product diffusion, and regional electricity demand. However, developing plausible and internally consistent scenarios for the target region presents challenges, necessitating input from experts and contextual knowledge from local stakeholders. One potential approach to address this challenge is to employ a participatory approach involving both experts and local stakeholders in the scenario design process, integrating the proposed method with our computer-aided scenario design methodology [43,44]. This will be a focus of our future work.
Second, the integration of the product diffusion estimation model and residential next-generation electricity demand model (Figure 1) facilitates the analysis of electricity demand changes in line with future product diffusion. Our model uniquely estimates regional electricity demand, accounting for consumer heterogeneity at the household level and utilizing assumed scenario narratives. While previous studies have developed forecasting models for PV and EV adoption focusing on consumer behaviors (e.g., [45,46,47]), these efforts did not incorporate household-level electricity demand analysis. The case study presented in Section 4 illustrates how future changes/uncertainties, product diffusion, and residential sector electricity demand in the target region were examined based on assumed scenarios. A questionnaire survey and historical product diffusion data were used synergistically to support the estimation. The workflow outlined in the case study section serves as a valuable framework for future research in this domain.

5.3. Limitations

Despite the innovative approach utilized in this study, several limitations and future challenges exist. One of the primary challenges is verifying the validity of the diffusion rates and electricity demand for the energy-efficient and energy-generating products estimated herein. One way to address this is to compare the electricity demand in 2012 shown in Figure 4 and that in a previous year. As depicted in Figure 4, the annual net electricity demand per household, calculated using the model in this study, is 3.77 MWh (=589 GWh/156,341 households). The 2009 electricity demand per household, as estimated by the Agency for Natural Resources and Energy, was 4.62 MWh [48]. The 23% disparity between the two necessitates an analysis of the causes and a review of the residential next-generation electricity demand model. According to [25], one of the most recent models for estimating residential end-use energy consumption generates an error of only 8%. Compared to [25], the load profile on a Japanese summer day shown in Figure 5 appears valid, with two peaks in the morning (around 7–8 am) and evening (around 7 pm). However, some discrepancies arise from the fact that (1) the highest peak should occur around noon and (2) the electricity demand from heat-pump water heaters at 3–6 am should not peak. This finding indicates that further testing is necessary to validate the model, and improvements are required to reduce errors, which will be addressed in future research.
The validity of the proposed method was tested for Toyonaka City (Section 4) and the Kansai region of Japan [35]. More case studies, particularly from other countries, are required to enhance this method further. Moreover, more recent data on, e.g., PV diffusion in the market, should be collected to further validate the model. These will be part of our future work. Another issue is expanding the scope to include not only the residential sector but also the service and industrial sectors [35,49]. Increasing the coverage of electricity demand in a region is essential when designing a regional power grid system.

6. Conclusions

In this study, we developed a method for describing scenarios to analyze the impact of diffusion and performance improvements of energy-efficient and energy-generating products on regional electricity demand. Employing a scenario-and-simulation approach, we amalgamated narrative stories outlining potential alternative futures with quantitative simulations to construct a residential next-generation electricity demand model and a product diffusion estimation model. This method facilitates hotspot identification for reducing residential electricity demand through iterative cycles of assumed potential futures, scenario story descriptions, product diffusion rate estimation, household electricity demand assessment, and scenario refinement.
A case study of Toyonaka City’s residential sector in Osaka for 2030 demonstrated assuming the diffusion of eight types of energy-efficient and energy-generating products (photovoltaic panels, electric vehicles, heat-pump water heaters, LED lighting, air conditioners, refrigerators, televisions, and heat insulation). The results indicated that contingent upon the diffusion rates of energy-efficient and energy-generating products, the annual net electricity demand in Toyonaka City’s residential sector decreased from 120 GWh (20.3%) to 228 GWh (38.7%) compared to 2012 levels. As described in Section 5.1, the findings highlighted that reductions in household numbers and the diffusion of PV panels had notably substantial impacts on electricity demand, while the energy efficiency improvement of air conditioners, lighting, and televisions led to reducing peak electricity demand.
Future work includes validating the product diffusion rates and electricity demand estimations in the scenarios, along with expanding the scenario scope to encompass the service and industrial sectors.

Author Contributions

Conceptualization, Y.K. and Y.Y.; Formal Analysis, Y.K. and Y.Y.; Funding Acquisition, Y.S.; Investigation, Y.K., Y.Y. and Y.M.; Methodology, Y.K., Y.Y., Y.M., S.F. and Y.U.; Supervision, Y.U. and Y.S.; Writing—Original Draft, Y.K. and Y.Y.; Writing—Review and Editing, Y.K., Y.Y., Y.M., S.F., Y.U. and Y.S. All authors have read and agreed to the published version of the manuscript.

Funding

This work was supported by the Ministry of Economy, Trade, and Industry (METI) R&D of Practical and Integrated Energy Storage Systems for Smart Community “Development of Evaluation Model of Energy Management Systems Using Electrical Energy Storage Systems” (Osaka University and The University of Tokyo, representative: Yoshiyuki Shimoda).

Institutional Review Board Statement

Not applicable.

Informed Consent Statement

Not applicable.

Data Availability Statement

The datasets used and analyzed during the current study are available from the corresponding author upon reasonable request.

Acknowledgments

Support provided by Naoto Kurahashi and Naoki Iwai, former Master’s students at Osaka University, toward data collection and analysis is greatly appreciated.

Conflicts of Interest

The authors declare no conflicts of interest and have no competing financial interests or personal relationships that could have influenced the work reported in this manuscript.

Appendix A

Table A1. List of variables used in the product diffusion estimation model.
VariableDescription
Product choice forecasting model
NsatMaximum diffusion rate of new products
n(t)Diffusion rate for Nsat at year t
pCoefficient for innovators
rCoefficient for imitators
UiUtility of consumer i
sjLevel of the attribute (preference factor) j
wijWeighting factor for attribute j of consumer i
H(t) Percentage of consumers i with a higher utility Ui of the new diffusing product compared to other competing products at year t
H(t0)H(t) at the initial year
Appliance replacement model
S(t)In-use stock of products at year t
S(t0)S(t) at the initial year
I(t)Inflow of the product at year t
O(t)Outflow of the product at year t
LTLifetime of the product
Table A2. Scenario assumptions for the residential sector of Toyonaka City (not exhaustive).
Item20122030Remarks
Scenario AScenario B
Number of households (thousands)156,341134,785[50]
Number of passenger automobiles (-)87,43086,081Assumed to decline from 2012 to 2030 in proportion to the number of households.
Grid electricity price (JPY/kWh)26.331.0Data obtained from [51], assuming the nuclear power share in 2030 is 15%.
PV installation cost (thousand JPY/kW)432432131PV installation cost in Scenario B decreases based on the technology roadmap [34].
Initial cost of heat-pump water heater (thousand JPY/unit)820550410The initial cost in Scenario B decreases based on the technology roadmap [40].
Lifetime of heat-pump water heaters, air conditioners, televisions, refrigerators (years)10Authors’ assumption by referring to [38].
Lifetime of LED lights (year)20[37]
Lifetime of detached houses and apartments (years)45 (detached), 40 (apartments)Refer to [36,39]. The lifetime of houses is used to calculate the diffusion of insulated panels.
Table A3. Conjoint analysis results for PV and EV [33].
Item Average Values of Weighting Factor wij
PV
Initial cost−0.00329 (/thousand JPY)
Annual electricity cost savings0.02164 (/thousand JPY)
Warranty period0.0156 (/year)
EV
Powertrain1.01 (gasoline vehicle), 0.64 (hybrid vehicle), 0.43 (plug-in hybrid vehicle), −2.08 (electric vehicle)
Initial cost0.0000498 (/thousand JPY)
Running cost−0.000359 (/JPY/month)
Mileage 0.00268 (/km)
Figure A1. Simplified flowchart of the residential next-generation electricity demand model and the product diffusion estimation model (developed by the authors based on Shimoda et al. [8]). All input parameter values are determined based on scenario assumptions (including the target region and the time horizon of interest). In particular, the input parameter values of the product diffusion estimation model are determined using a questionnaire survey and past product diffusion. Home appliances considered here include refrigerators, televisions, air conditioners, heat-pump water heaters, LED lighting.
Sustainability 16 06435 g0a1

References

  1. Sagaria, S.; Duarte, G.; Neves, D.; Baptista, P. Photovoltaic integrated electric vehicles: Assessment of synergies between solar energy, vehicle types and usage patterns. J. Clean. Prod. 2022, 348, 131402. [Google Scholar] [CrossRef]
  2. Sun, C.; Zhao, X.; Qi, B.; Xiao, W.; Zhang, H. Economic and environmental analysis of coupled PV-energy storage-charging station considering location and scale. Appl. Energy 2022, 328, 119680. [Google Scholar] [CrossRef]
  3. Vilaça, M.; Santos, G.; Oliveira, M.S.A.; Coelho, M.C.; Correia, G.H.A. Life cycle assessment of shared and private use of automated and electric vehicles on interurban mobility. Appl. Energy 2022, 310, 118589. [Google Scholar] [CrossRef]
  4. Alcamo, J. Scenarios as tools for international environmental assessments. In Environmental Issue Report No. 24; Ribeiro, T., Ed.; European Environmental Agency: Copenhagen, Denmark, 2001. [Google Scholar]
  5. Kishita, Y.; Hara, K.; Uwasu, M.; Umeda, Y. Research needs and challenges faced in supporting scenario design in sustainability science: A literature review. Sustain. Sci. 2016, 11, 331–347. [Google Scholar] [CrossRef]
  6. Schwartz, P. The Art of the Long View; Doubleday: New York, NY, USA, 1991. [Google Scholar]
  7. Kishita, Y.; Kurahashi, N.; Yamaguchi, Y.; Shimoda, Y.; Fukushige, S.; Umeda, Y. Scenario design approach to envisioning regional electricity networks with photovoltaics and electric vehicles. In Proceedings of the International Conference on Engineering Design, Seoul, Republic of Korea, 19–22 August 2013. Paper #492. [Google Scholar]
  8. Shimoda, Y.; Yamaguchi, Y.; Okamura, T.; Taniguchi, A.; Yamaguchi, Y. Prediction of Greenhouse Gas Reduction Potential in Japanese Residential Sector by Residential Energy End-use Model. Appl. Energy 2010, 87, 1944–1952. [Google Scholar] [CrossRef]
  9. Tasaki, T.; Motoshita, M.; Uchida, H.; Suzuki, Y. Assessing the Replacement of Electrical Home Appliances for the Environment: An Aid to Consumer Decision Making. J. Ind. Ecol. 2013, 17, 290–298. [Google Scholar] [CrossRef]
  10. Higgins, A.; McNamara, C.; Foliente, G. Modelling Future Uptake of Solar Photo-voltaics and Water Heaters under Different Government Incentives. Technol. Forecast. Soc. Chang. 2014, 83, 142–155. [Google Scholar] [CrossRef]
  11. Drude, L.; Pereira, L.C.; Ruether, R. Photovoltaics (PV) and Electric Vehicle-to-grid (V2G) Strategies for Peak Demand Reduction in Urban Regions in Brazil in a Smart Grid Environment. Renew. Energy 2014, 68, 443–451. [Google Scholar] [CrossRef]
  12. Bartusch, C.; Alvehag, K. Further Exploring the Potential of Residential Demand Response Programs in Electricity Distribution. Appl. Energy 2014, 125, 39–59. [Google Scholar] [CrossRef]
  13. Betancourt-Torcat, A.; Charry-Sanchez, J.; Almansoori, A.; Alkatheri, M.; Flett, P.; Elkamel, A. An integrated electric vehicle network planning with economic and ecological assessment: Application to the incipient middle Eastern market in transition towards sustainability. J. Clean. Prod. 2021, 302, 126980. [Google Scholar] [CrossRef]
  14. Thakur, J.; de Almeida, C.M.L.; Baskar, A.G. Electric vehicle batteries for a circular economy: Second life batteries as residential stationary storage. J. Clean. Prod. 2022, 375, 134066. [Google Scholar] [CrossRef]
  15. Yu, Z.; Lu, F.; Zou, Y.; Yang, X. Quantifying the real-time energy flexibility of commuter plug-in electric vehicles in an office building considering photovoltaic and load uncertainty. Appl. Energy 2022, 321, 119365. [Google Scholar] [CrossRef]
  16. Kobashi, T.; Choi, Y.; Hirano, Y.; Yamagata, Y.; Say, K. Rapid rise of decarbonization potentials of photovoltaics plus electric vehicles in residential houses over commercial districts. Appl. Energy 2022, 306, 118142. [Google Scholar] [CrossRef]
  17. Zhang, N.; Lu, Y.; Chen, J.; Hwang, B.G. An agent-based diffusion model for Residential Photovoltaic deployment in Singapore: Perspective of consumers’ behavior. J. Clean. Prod. 2022, 367, 132793. [Google Scholar] [CrossRef]
  18. Olsson, J.M.; Gardumi, F. Modelling least cost electricity system scenarios for Bangladesh using OSeMOSYS. Energy Strategy Rev. 2021, 38, 100705. [Google Scholar] [CrossRef]
  19. Gebremeskel, D.H.; Ahlgren, E.O.; Beyene, G.B. Long-term electricity supply modelling in the context of developing countries: The OSeMOSYS-LEAP soft-linking approach for Ethiopia. Energy Strategy Rev. 2023, 45, 101045. [Google Scholar] [CrossRef]
  20. Quevedo, J.; Moya, I.H. Modeling of the dominican republic energy systems with OSeMOSYS to assess alternative scenarios for the expansion of renewable energy sources. Energy Nexus 2022, 6, 100075. [Google Scholar] [CrossRef]
  21. Dreier, D.; Howells, M. OSeMOSYS-PuLP: A stochastic modeling framework for long-term energy systems modeling. Energies 2019, 12, 1382. [Google Scholar] [CrossRef]
  22. Di Leo, S.; Caramuta, P.; Curci, P.; Cosmi, C. Regression analysis for energy demand projection: An application to TIMES-Basilicata and TIMES-Italy energy models. Energy 2020, 196, 117058. [Google Scholar] [CrossRef]
  23. Tash, A.; Ahanchian, M.; Fahl, U. Improved representation of investment decisions in the German energy supply sector: An optimization approach using the TIMES model. Energy Strategy Rev. 2019, 26, 100421. [Google Scholar] [CrossRef]
  24. Oshiro, K.; Fujimori, S.; Ochi, Y.; Ehara, T. Enabling energy system transition toward decarbonization in Japan through energy service demand reduction. Energy 2021, 227, 120464. [Google Scholar] [CrossRef]
  25. Yamaguchi, Y.; Shoda, Y.; Yoshizawa, S.; Imai, T.; Perwez, U.; Shimoda, Y.; Hayashi, Y. Feasibility assessment of net zero-energy transformation of building stock using integrated synthetic population, building stock, and power distribution network framework. Appl. Energy 2023, 333, 120568. [Google Scholar] [CrossRef]
  26. Matsumoto, M.; Kondoh, S.; Fujimoto, J.; Masui, K. A modeling framework for the diffusion of green technologies. In Management of Technology Innovation and Value Creation: Selected Papers from the 16th International Conference on Management of Technology; Sherif, M.H., Khalil, T.M., Eds.; World Scientific Publishing Company: Singapore, 2008; pp. 121–136. [Google Scholar]
  27. Fodhil, F.; Hamidat, A.; Nadjemi, O. Potential, optimization and sensitivity analysis of photovoltaic-diesel-battery hybrid energy system for rural electrification in Algeria. Energy 2019, 169, 613–624. [Google Scholar] [CrossRef]
  28. Liu, J.; Chen, X.; Yang, H.; Li, Y. Energy storage and management system design optimization for a photovoltaic integrated low-energy building. Energy 2020, 190, 116424. [Google Scholar] [CrossRef]
  29. Nurunnabi, M.; Roy, N.K.; Hossain, E.; Pota, H.R. Size optimization and sensitivity analysis of hybrid wind/PV micro-grids—A case study for Bangladesh. IEEE Access 2019, 7, 150120–150140. [Google Scholar] [CrossRef]
  30. International Energy Agency (IEA). Technology Roadmaps: Smart Grids; IEA Publications: Paris, France, 2011. [Google Scholar]
  31. National Renewable Energy Laboratory (NREL). Renewable Electricity Futures Study. 2023. Available online: https://www.nrel.gov/analysis/re-futures.html (accessed on 23 March 2023).
  32. Bass, F.A. New product growth model for consumer durables. Manag. Sci. 1969, 15, 215–227. [Google Scholar] [CrossRef]
  33. Kishita, Y.; Kurahashi, N.; Yamaguchi, Y.; Fukushige, S.; Umeda, Y. Describing and analyzing future scenarios of electricity systems based on low-carbon technologies. In Proceedings of the 22nd Japan Society of Mechanical Engineers Design and Systems Division Conference, Hiroshima, Japan, 26–28 September 2012; pp. 690–699. (In Japanese). [Google Scholar]
  34. New Energy and Industrial Technology Development Organization (NEDO). PV Roadmap (PV2030+). 2009. Available online: https://www.nedo.go.jp/content/100080327.pdf (accessed on 23 March 2023). (In Japanese).
  35. Iwai, N.; Kurahashi, N.; Kishita, Y.; Yamaguchi, Y.; Shimoda, Y.; Fukushige, S.; Umeda, Y. Scenario analysis of regional electricity demand in the residential and commercial sectors—Influence of diffusion of photovoltaic systems and electric vehicles into power grids. Procedia CIRP 2014, 15, 319–324. [Google Scholar] [CrossRef]
  36. Komatsu, Y. Life time estimations of Japanese buildings and houses at the years of 1997 and 2005. J. Archit. Plan. Environ. Eng. 2008, 72, 2197–2205. (In Japanese) [Google Scholar]
  37. Ministry of Economy, Trade and Industry (METI). Current Situation of LED Lighting Industry. 2012. Available online: https://www.meti.go.jp/committee/summary/0004296/pdf/001_05_00.pdf (accessed on 23 March 2023). (In Japanese).
  38. Ministry of the Environment (MOE). Environmental Conservation Effect by Promoting Reuse: Lifetime Extension Effects and Environmental Consequences through Consumer Surveys. 2011. Available online: https://www.env.go.jp/content/900532654.pdf (accessed on 23 March 2023). (In Japanese).
  39. Shima, H.; Hara, T.; Yoshida, Y.; Matsuhashi, R. Estimation of lifetime of buildings and prediction of generation of demolished concrete by proportional hazard model. J. Environ. Eng. 2003, 573, 87–94. (In Japanese) [Google Scholar] [CrossRef] [PubMed]
  40. Ministry of Economy, Trade and Industry (METI). Cool Earth: Energy Innovation Technology: Technology Development Roadmap. 2008. Available online: https://www8.cao.go.jp/cstp/tyousakai/hyouka/kentou/gas_sekitan/haihu2/sanko2-1_2.pdf (accessed on 23 March 2023). (In Japanese).
  41. Ministry of the Environment (MOE). Summary of Automobile Working Group. 2012. Available online: https://www.env.go.jp/council/content/i_05/900424322.pdf (accessed on 23 March 2023). (In Japanese).
  42. Kishita, Y.; Nakamura, Y.; Kegasa, A.; Hisazumi, Y.; Hori, T.; Fukushige, S.; Umeda, Y. Scenario Analysis of the Diffusion of Fuel Cells in the Residential Sector. Procedia CIRP 2014, 15, 294–299. [Google Scholar] [CrossRef]
  43. Kishita, Y.; Mizuno, Y.; Fukushige, S.; Umeda, Y. Scenario structuring methodology for computer-aided scenario design: An application to envisioning sustainable futures. Technol. Forecast. Soc. Chang. 2020, 160, 120207. [Google Scholar] [CrossRef]
  44. Kishita, Y.; Masuda, T.; Nakamura, H.; Aoki, K. Computer-aided scenario design using participatory backcasting: A case study of sustainable vision creation in a Japanese city. Futures Foresight Sci. 2023, 5, e141. [Google Scholar] [CrossRef]
  45. Chesser, M.; Hanly, J.; Cassells, D.; Apergis, N. The positive feedback cycle in the electricity market: Residential solar PV adoption, electricity demand and prices. Energy Policy 2018, 122, 36–44. [Google Scholar] [CrossRef]
  46. Moon, H.B.; Park, S.Y.; Jeong, C.; Lee, J. Forecasting electricity demand of electric vehicles by analyzing consumers’ charging patterns. Transp. Res. Part D Transp. Environ. 2018, 62, 64–79. [Google Scholar] [CrossRef]
  47. Vasseur, V.; Kemp, R. The adoption of PV in the Netherlands: A statistical analysis of adoption factors. Renew. Sustain. Energy Rev. 2015, 41, 483–494. [Google Scholar] [CrossRef]
  48. Agency for Resources and Energy. Survey on Energy-Saving Policy Analysis 2010FY “Current Status of Energy Consumption in Households”; Agency for Resources and Energy: Tokyo, Japan, 2011. (In Japanese) [Google Scholar]
  49. Kishita, Y.; Mizuno, Y.; Fukushige, S.; Umeda, Y. Describing electricity demand scenarios focusing on the diffusion of low-carbon technologies in 2030. In Proceedings of the EcoDesign 2015: 9th International Symposium on Environmentally Conscious Design and Inverse Manufacturing, Tokyo, Japan, 2–4 December 2015; pp. 899–905. [Google Scholar]
  50. National Institute of Population and Social Security Research. Japan’s Population Forecasting by Region; National Institute of Population and Social Security Research: Tokyo, Japan, 2013. (In Japanese) [Google Scholar]
  51. Energy and Environment Council. Alternatives of Energy and Environment. 2012. Available online: http://www.cas.go.jp/jp/seisaku/npu/policy09/pdf/20120629/20120629_1.pdf (accessed on 23 March 2023).
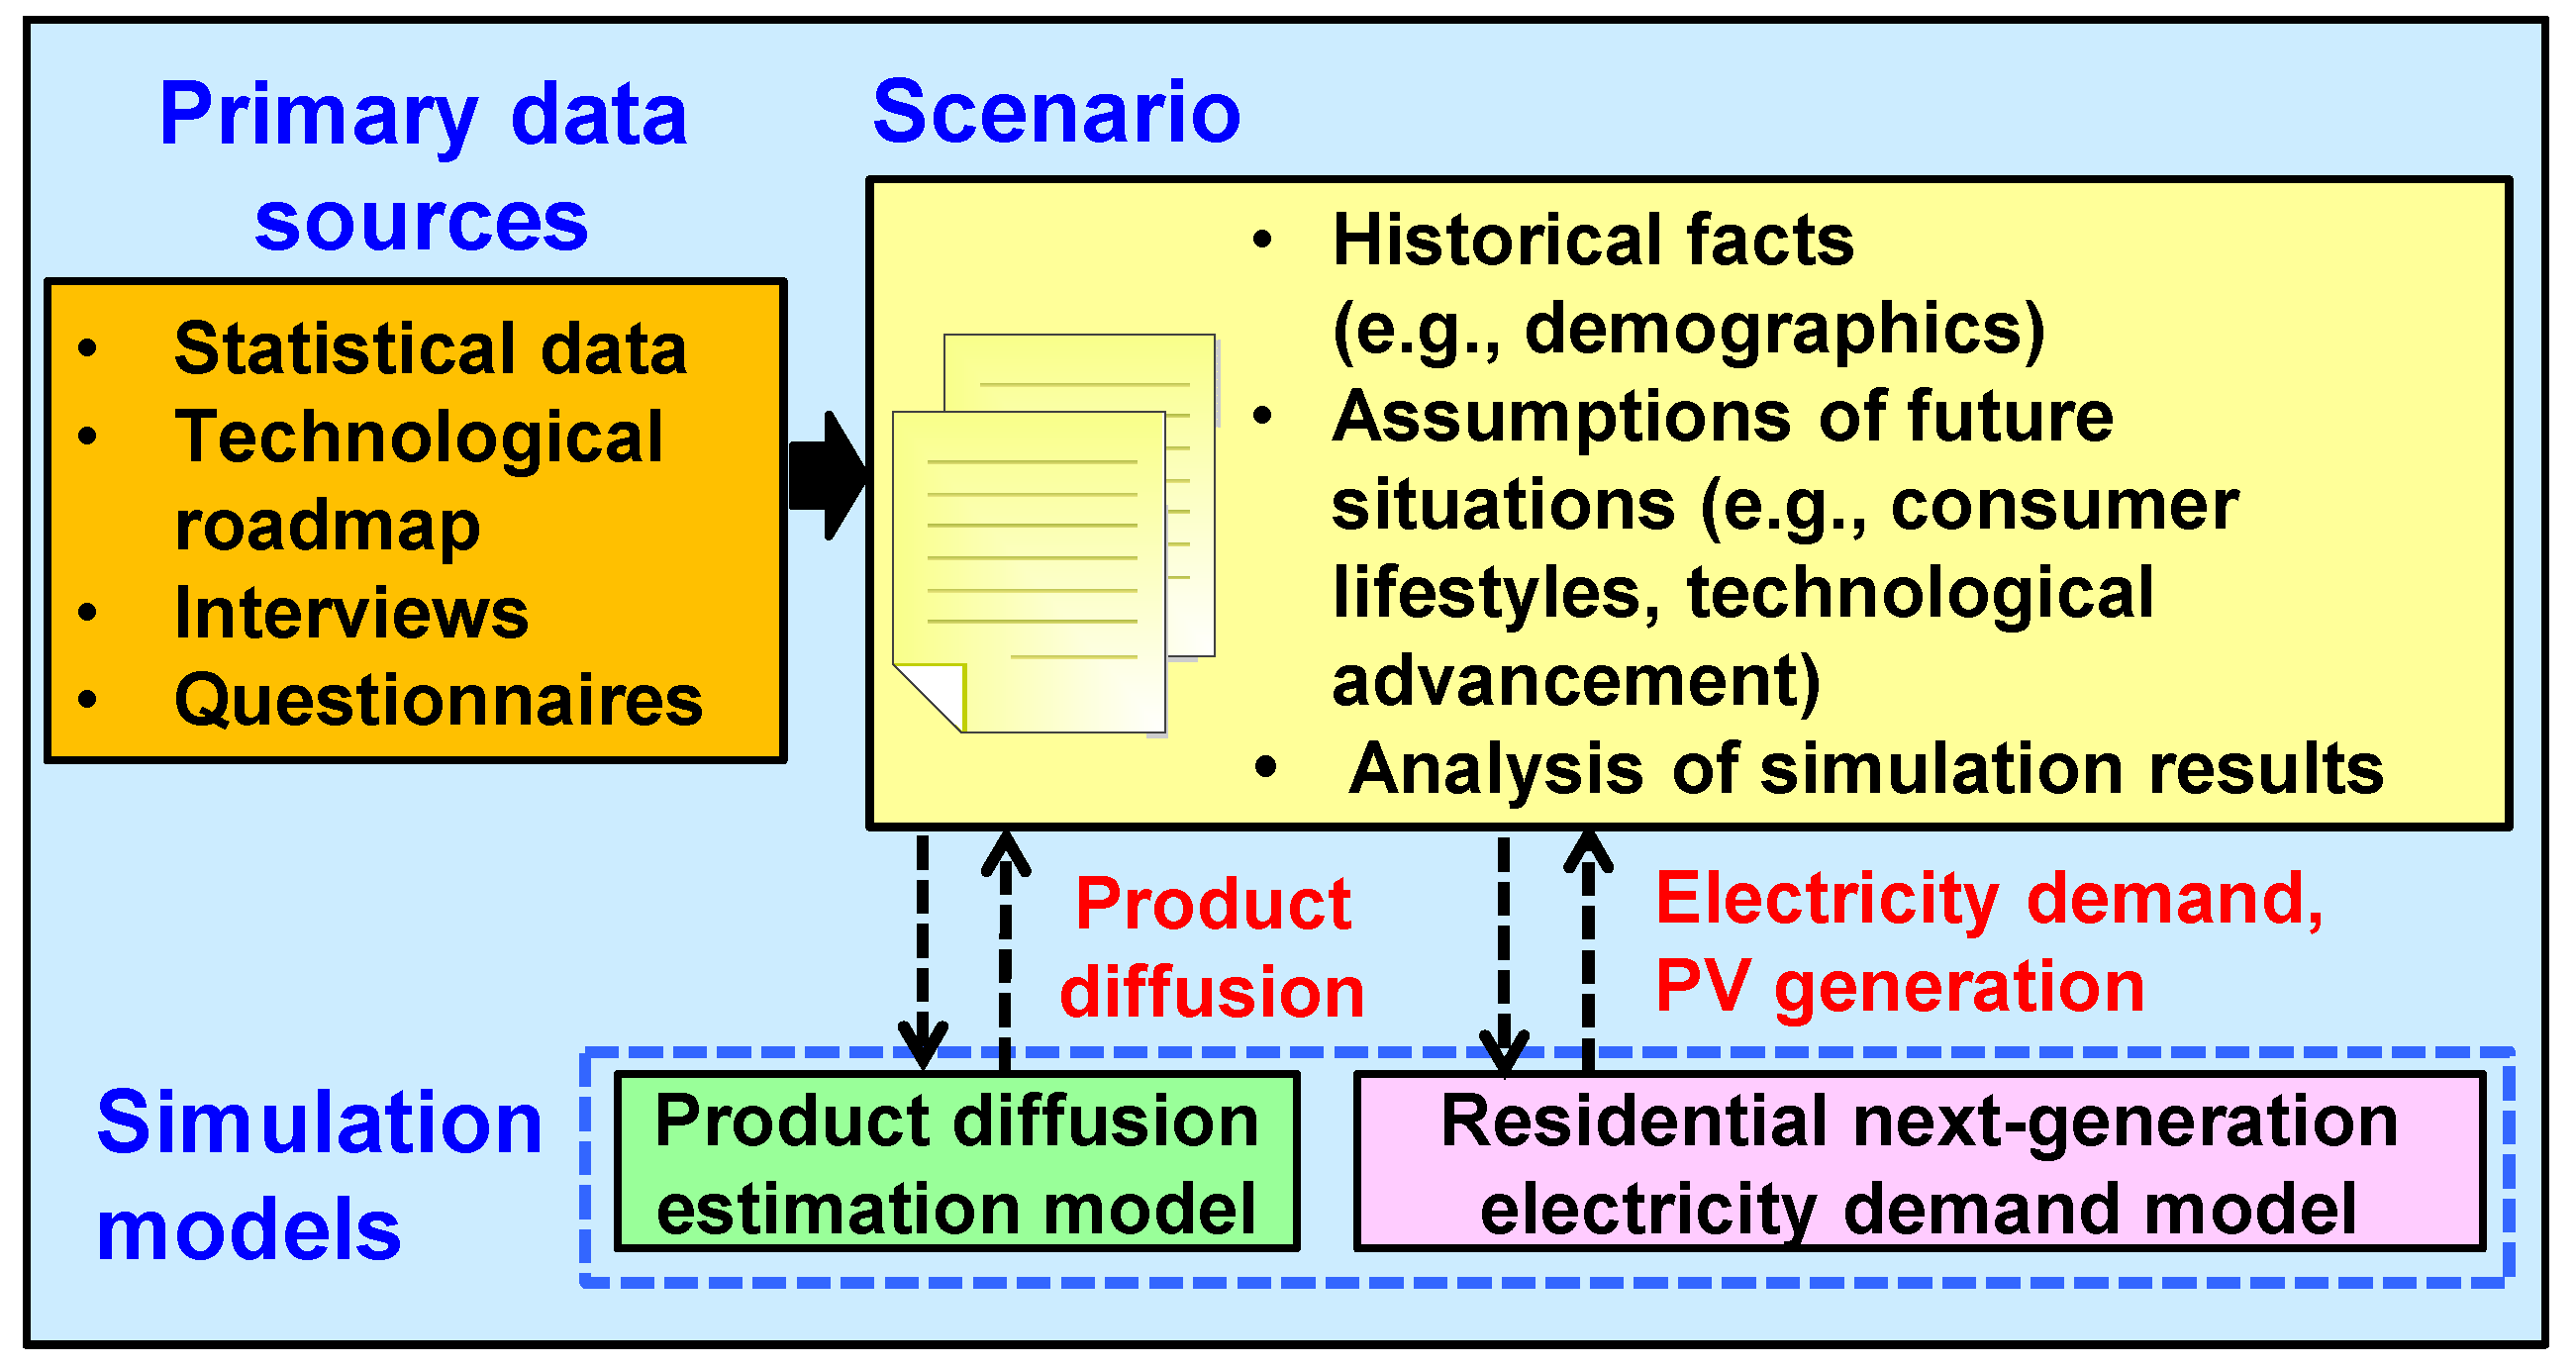
Figure 1. Approach to describing and analyzing regional electricity demand scenarios.
Sustainability 16 06435 g001
Figure 2. Residential next-generation electricity demand model. Home appliances considered here include refrigerators, televisions, air conditioners, heat-pump water heaters, LED lighting.
Sustainability 16 06435 g002
Figure 3. Scenario storylines of residential electricity demand in Toyonaka City.
Sustainability 16 06435 g003
Figure 4. Annual electricity demand in the residential sector of Toyonaka City.
Sustainability 16 06435 g004
Figure 5. Electricity demand curve on a summer day in 2030.
Sustainability 16 06435 g005
Table 1. Estimation results for product diffusion.
ProductProduct Diffusion in 2030Remarks
Scenario AScenario B
PV65 MW (32%)124 MW (61%)Calculated based on the cost payback time, which is assumed to be 7.4 years in Scenario A and 2.7 years in Scenario B [33]. Percentages in parentheses refer to percentages in detached houses.
Plug-in hybrid vehicle (PHV)7095 (8.3%)9711 (11.3%)Calculated based on the market share by automobile type assumed by [41]. Percentages in parenthesis refer to the percentage of the number of automobiles owned.
Mid-size EV13,268 (15.5%)14,861 (17.3%)
Heat-pump water heaters33,97862,698Calculated based on the cost payback time, which is assumed to be 7 years in Scenario A and 3.5 years in Scenario B [40,42]. The diffusion rate in Scenario B is 74.1% in apartment houses and 80.2% in detached houses, respectively.
LED lights689,260
(86.5%)
1,589,357
(100%)
Calculated based on the cost payback time of 3 years in Scenario A, while the diffusion rate in Scenario B is assumed to be 100% based on the policy target [37].
Disclaimer/Publisher’s Note: The statements, opinions and data contained in all publications are solely those of the individual author(s) and contributor(s) and not of MDPI and/or the editor(s). MDPI and/or the editor(s) disclaim responsibility for any injury to people or property resulting from any ideas, methods, instructions or products referred to in the content.