Review

Geographic Information Systems (GISs) Based on WebGIS Architecture: Bibliometric Analysis of the Current Status and Research Trends

by
Jorge Vinueza-Martinez
*,
Mirella Correa-Peralta
,
Richard Ramirez-Anormaliza
,
Omar Franco Arias
and
Daniel Vera Paredes
Faculty of Science and Engineering, Universidad Estatal de Milagro, Milagro 091706, Ecuador
*
Author to whom correspondence should be addressed.
Sustainability 2024, 16(15), 6439; https://doi.org/10.3390/su16156439
Submission received: 28 May 2024 / Revised: 27 June 2024 / Accepted: 5 July 2024 / Published: 27 July 2024

Abstract

:
Geographic information systems (GISs) based on WebGIS architectures have transformed geospatial data visualization and analysis, offering rapid access to critical information and enhancing decision making across sectors. This study conducted a bibliometric review of 358 publications using the Web of Science database. The analysis utilized tools, such as Bibliometrix (version R 4.3.0) and Biblioshiny (version 1.7.5), to study authors, journals, keywords, and collaborative networks in the field of information systems. This study identified two relevant clusters in the literature: (1) voluntary geographic information (VGI) and crowdsourcing, focusing on web integration for collaborative mapping through contributions from non-professionals and (2) GIS management for decision making, highlighting web-based architectures, open sources, and service-based approaches for storing, processing, monitoring, and sharing geo-referenced information. The journals, authors, and geographical distribution of the most important publications were identified. China, Italy, the United States, Germany, and India have excelled in the application of geospatial technologies in areas such as the environment, risk, sustainable development, and renewable energy. These results demonstrate the impact of web-based GISs on forest conservation, climate change, risk management, urban planning, education, public health, and disaster management. Future research should integrate AI, mobile applications, and geospatial data security in areas aligned with sustainable development goals (SDGs) and other global agendas.

1. Introduction

In the current digital era, the visualization and analysis of geospatial data have evolved by leaps and bounds owing to geographic information systems (GISs) based on WebGIS architectures [1]. WebGIS architecture refers to the structure and design of a WebGIS. It involves the integration of various components and technologies to enable the creation, management, and visualization of spatial data over the Internet [2]. The success of WebGIS applications is intrinsically linked to their design and implementation [3,4]. The current literature describes several WebGIS architectures, including client–server architectures [5,6,7,8], designed to reduce server load and provide cross-browser compatibility [9,10]; service-oriented architectures (SOAs), for interoperable and modularized geospatial services [11]; and cloud computing [12,13], for storing, processing, and combining data services from multiple providers over the Internet [11,14]. These architectural structures reflect the diversity of the approaches used to optimize the functionality, interoperability, and efficiency of geographic information systems in web environments.
Today, the use of geographic information systems with WebGIS architectures has consolidated their position as the dominant method of delivering GIS functionality over the Internet. This is achieved by leveraging technologies, such as web services [15,16,17,18,19,20,21,22] and open standards [11,23,24,25], which enables widespread access [26,27,28] to geospatial information on various computing devices, including tablets and mobile phones, provided that a stable Internet connection is available. By integrating with the cloud and employing advanced analysis techniques, contemporary WebGISs offer scalability [9,14,20,29], high performance [9,20,30], processing capabilities [25,31,32], and interactive visualizations of large datasets [33,34]. These online applications not only provide immediate access to geographic information but also facilitate well-informed decision-making in various traditional application fields, such as forest conservation, climate change [35,36,37,38], risk management [39,40,41], urban planning [17,42,43], education [11,44,45,46], and health, specifically in case studies of COVID-19-related events.
There have been several real-world case studies on healthcare. Since 2019, with the emergence of COVID-19, various authors have highlighted several critical points and made significant contributions regarding the use of WebGIS technologies. Schmidt F. et al. (2021) highlighted the importance of integrating voluntary geographic data with official data to analyze the mobility of infected persons facing data-protection challenges and ethical requirements [17,18,47,48]. LI J. et al. (2022) demonstrated how WebGIS platforms could ease the educational burden of geography teachers and improve teaching in the context of the pandemic [15,49,50]. Torres-Ruiz M. et al. (2023) developed a healthcare recommender system that combines geospatial data and patient profiles to optimize access to healthcare services [17,30,51]. Finally, Duarte L. et al. (2021) created open-source GIS applications to map healthcare facilities and analyze the relationship between their location and COVID-19 cases, highlighting the need for further research for in-depth analyses [28,46,52]. These studies show how WebGIS has been crucial to pandemic management, providing innovative tools for education, healthcare, and geospatial analyses of health data.
However, unresolved challenges, unaddressed research areas, and notable gaps persist. Few researchers have presented a theoretical or practical framework for effectively integrating heterogeneous data [15,50], ensuring interoperability across platforms [53,54], and improving the usability of web interfaces for non-expert users [14,47]. In addition, we face the task of addressing the limitations of mobile devices [55] and maintaining a constant technological upgrade. The uneven adoption of standards [50], security issues [56], and the need for user training pose additional challenges [2]. Exploring current developments and identifying future trends and research areas will enable researchers to make significant contributions to this field.
A review of the literature revealed that existing studies have provided valuable information in several application areas and have broadened our understanding of web-based GISs. However, several challenges and the need for further research in this field were also identified. Table 1 presents a compilation of major review studies published between 2002 and 2023 related to GISs or WebGIS in different contexts, such as malnutrition [57,58], the Open Geospatial Consortium (OGC) [55], public health surveillance [56], the quality of geographic information services (QOGISs) [2], building information modeling (BIM), and web GIS integration [57]. This table reveals that no bibliometric review studies focusing specifically on GIS integration based on WebGIS architectures and their applications have been published. Furthermore, these reviews provide only an overview and do not offer comprehensive information on the problems, topics, and trends of web-based information systems. Therefore, further research on the trends and use of web-based GIS architecture is required.
The current studies are insufficient because they do not provide detailed information on the current status, issues, and trends in web-based GISs. This lack of information is crucial for predicting the direction of future research on the integration of these three aspects. Researchers require a clear understanding of the current state, research trends, and existing gaps to determine the direction of their research. Therefore, the main objective of this review is to provide a holistic view of the current global trends in WebGIS applications and the need to develop a comprehensive conceptual framework for understanding these perspectives by analyzing the implications and future directions of WebGIS and its application areas.
We hypothesize that, by bibliometrically analyzing the existing literature, we can identify key areas of research that have been under-exploited or present significant opportunities for technological and methodological advancement. We anticipate that the development of emerging technologies, such as artificial intelligence (AI), cloud computing, augmented reality (AR), big-data analytics, the Internet of Things (IoT), blockchain, mobile applications, and geospatial data security, will be increasingly integrated with web-based GISs, improving their efficiency and resilience. Furthermore, we predict that understanding and implementing these technologies in areas beyond forest conservation, risk management, and urban planning, and with international agenda goals, will provide new opportunities to address critical global challenges. This approach will allow researchers to not only map the current state of research but also provide a clear path for future research to maximize the positive impact of WebGIS in diverse contexts.

2. Background

This study ensures a reliable and reproducible research protocol using the bibliometric analysis method, a quantitative study that identifies the main variables [64]. It provides details of the required information, including publications, keywords, citations, authors, and institutions, for the interaction of scientific variables [65,66,67,68,69,70,71]. This method also helps to identify gaps, critical points, opportunities, possible efforts, and the limitations of future research [72,73]. Additionally, it allows for the use of scientific mapping techniques, with the R packages Bibliometrix R (version R 4.3.0) and Biblioshiny (version 1.7.5) used for analysis and visualization [74,75].
Therefore, this study conducted an exhaustive search of the scientific literature indexed in the Web of Science (WOS) database, covering more than two decades of research related to WebGIS applications from 2002 to the present. Through a rigorous and systematic approach, it aimed to analyze and categorize emerging best practices that have influenced the design and successful implementation of WebGIS applications. The identification and analysis of best practices will offer valuable insights to both researchers and practitioners in the fields of GIS and geoinformatics.
By understanding the trends and approaches that have proven effective over time, a solid foundation can be established for the development of future WebGIS applications.
This bibliometric analysis offers valuable insights for future research, including the following:
  • presenting detailed bibliometric information on 391 scientific articles sourced from the Web of Science database;
  • utilizing the bibliometric package R and Biblioshiny to gather and document quantitative data on a selected group of articles;
  • employing variables, such as the number of authors per article and an index measuring author dominance, to identify the primary authors in this particular research field;
  • conducting a citation analysis and creating collaborative maps to understand the network associated with this research area;
  • evaluating countries to assess the production, citations, affiliations, and networks related to WebGIS architecture research in each country.
Finally, this article is organized as follows. Section 3 presents the methodology applied, and the methods of data collection, analysis, and visualization employed in this bibliometric research are detailed. Section 4 presents the findings of the bibliometric analysis. Section 5 discusses the main elements of geographic information systems based on WebGIS architectures and the key results derived from the exploration of the scientific literature. Section 6 concludes the study with the implications for future research.

3. Materials and Methods

This study adopted a methodological process that included five phases for the general flow of scientific mapping, namely, study design, data collection, data analysis, data visualization, and interpretation, as defined by [76,77,78,79] and adapted from [80], as shown in Figure 1.

3.1. Phase 1—Study Design

In the initial phase of the research, the focus was on the study design process [76,82,83,84], which involved the use of the bibliometric analysis method. As the name suggests, this method offers the opportunity to investigate a large body of scientific knowledge within a specific research field, encompassing the scientific rigor, reliability, and replicability of the researchers’ procedures. As indicated by numerous scholars, this methodology allows for an examination of qualitative and quantitative variables to identify notable authors, reputable journals, and important keywords while facilitating the integration of a comprehensive literature review and a rigorous bibliometric analysis [83,84].
A methodological analysis of the published articles referred to this study revealed the sub-stages applied in the study design phase [85]: (1) defining the research questions; (2) writing the research protocol; and (3) defining the research sample to be analyzed.
In the first sub-stage of the study design, the research questions focused on identifying the general trends of publications related to the design and implementation of WebGIS applications through a bibliometric analysis. The aim was to identify existing knowledge gaps related to this trend and to understand issues that have not yet been addressed. In addition, possible future research directions for the development of WebGIS architectures were also explored [77,78,79,86,87].
The research questions that guided this study were as follows. RQ1 is what is the predominant global trend of scientific publications in the research field based on the main authors, keywords, and citations in the research field. RQ2 is what findings have been discovered from this global trend in the literature. RQ3 is what are the implications and future directions of an architectural framework based on WebGIS. The first research question aimed to identify the qualitative and quantitative variables of the knowledge base and intellectual structure of the research topic. The second research question aimed to examine the research front, which is the state of the art based on the conceptual and social structure of the scientific community. Finally, the third research question aimed to identify practical and theoretical implications and ideas for future research in this field.
In the second sub-stage of the study design, the research protocol was drafted, and Table 2 shows the currently recognized literature corpus components, which serve as unique identifiers of the research methodology, incentives, and research strategy employed while establishing a connection to the subsequent aspects.
The third sub-stage of the study design consisted of specifying the search strategy and Boolean equation to be consulted. For the first factor, relevant keywords were selected to facilitate the initial search. These keywords included “spatial data infrastructure”, “geospatial web services”, “geoportal”, “geospatial data integration”, “distributed GIS architecture”, “Web GIS”, “GIS applications”, “architecture”, “web GIS”, “web-GIS”, “Mobile GIS”, “GIS”, “cloud GIS”, “software architecture”, “data process”, “cartographic design”, “technologies”, and “applications”. For the second factor, after a series of queries, the documents containing the most common terms and their synonyms were divided into three components: (1) a webGIS component, with the terms “webGIS”, “web-gis”, “web-based GIS”, “Web GIS”, “web mapping”, “geoweb”, and “web services”; (2) a geographic information system component, with the terms “geographic information system”, “gis”, and “spatial data infrastructure; and (3) an architecture component, with the terms “architecture”, “technical” “cloud”, “mobile”, “software”, and “open source”. The adoption of these keywords resulted in a final search equation (Table 3) that allowed for an expanded collection of records that met the objectives of this research.

3.2. Phase 2—Data Collection

The second phase was carried out in three sub-stages: (1) data retrieval, (2) data loading and conversion, and (3) data cleaning. In the first sub-stage, data retrieval, the scientific database to be consulted was defined. Clarivate Analytics’ Web of Science (WoS) and Elsevier’s Scopus are the most relevant scientific databases in various disciplines. A comparison between WoS and Scopus [85,88,89,90] revealed that Scopus covers 97% of all publications included in WoS, and the addition of Scopus-only journals may considerably reduce the average impact and citation coverage in some countries [83,84,85]. For example, it is possible to explore only the used data collected from the Web of Science (WoS) Core Collection to cover a selective set of the most widely used journals [91].
The criteria for the filtering process were based on the designed Boolean equation (Table 3) for the exploration of fields such as title, abstract, and author keywords [92,93]. In this context, Table 4 shows the criteria for the filtering process derived from the research protocol (Table 2) and the results obtained from Web of Science. This approach was designed to acquire more relevant findings and delve deeper into the various aspects of geographic information systems based on web architecture. The main research yielded a total of 1764 records spanning from 2002 to September 2023.
Subsequently, additional filters were employed to improve the results [94]. The scope of the research was limited to the WoS Core Collection indices, namely, Science Citation Index Expanded (SCI-EXPANDED), Social Sciences Citation Index-Science (SSCI), Arts & Humanities Citation Index (A&HCI), and Conference Proceedings Citation Index-Science (CPCI-S), yielding 460 findings. In terms of journal selection, it was determined that only the most important scientific journals in the disciplines of science, social sciences, arts, and humanities should be explored, covering the entire citation network (396 papers). No categories or specializations were exempted, which facilitated a comprehensive review of both generic and specialized journals [95]. In addition, the search was limited to articles or reviews, owing to the credibility of the review articles because of their rigorous peer-review process [76,84], which, in turn, generates reliable scientific communication, promotes meaningful research, and presents accurate conclusions [85,96]. The researchers chose not to impose any temporal restrictions, with the aim of capturing research trends over the entire publication period that is available in the WoS database, which spans 21 years, from 2002 to 2023. The analysis was conducted on September 19, 2023, to ensure transparency and replicability. By employing the above research strategy, the researchers obtained a final sample consisting of a total of 391 articles. To improve the reliability of the research, we provided a bibliometric extract in the Zenodo repository [97].
Furthermore, this study was strengthened by the methodological use of the PRISMA statement for systemic reviews and meta-analyses [98], where the workflow provided can enhance the replicability of the results. Figure 2 presents the research steps, with the exception of a meta-analysis, which was not included in this study.
This study collected data on several aspects, including (1) descriptive information, (2) source analysis, (3) author and citation analysis, (4) network and keyword analysis, and (5) the geographical distribution of the articles.
In this second sub-stage, which involved data loading and conversion of the 391 articles obtained from the WoS database, the documents were referenced in a plain-text file (*. txt) with the complete record and references cited from the download option to be used by the open-source statistical application R and the Bibliometrix package.
The last sub-stage, data cleaning, involved pre-processing the data using the filter option of the Biblioshiny application. To avoid the inclusion of irrelevant documents in the analysis, the following were not considered: data papers (1 document), proceedings papers (28 documents), papers ensuring peer-review processes, papers written in a language other than English (4 documents), and papers with duplicated and misspelled elements [101] or references to citations with multiple versions, different spellings, or stacks of the author’s name [102]. The quality of the results depended on the quality of the data. In the process of data re-collation, the design of a custom database might be required [76]. Accordingly, we performed data cleaning, which resulted in a robust corpus of 358 indexed research articles.

3.3. Phase 3—Data Analysis

The third phase of the research process focused on selecting an aspect of the data analysis within the bibliometric field to extract meaningful insights and gain an in-depth understanding of the relationships between different variables. This study used multiple metrics and statistical techniques, including a keyword frequency analysis, co-occurrence networks [84], a citation analysis, and thematic mapping. These techniques allow for the identification of the structure of knowledge through the keywords found in publications, creating a network of co-occurrences that is presented in a thematic map, facilitating the interpretation of research topics [91].
To answer research questions RQ1, RQ2, and RQ3, tools such as the Bibliometrix R package and Microsoft Excel were used for data visualization and presentation. Visualizations included annual scientific output graphs, keyword co-occurrence networks, citation networks, conceptual structure maps, thematic evolution maps, dendrograms, thematic maps, trending topic graphs, citation burst analysis, and research front maps.
For research question RQ1, “What is the predominant global trend of scientific publications in the research field based on top authors, keywords, and citations?”, bibliometric analyses, including annual scientific output, keyword co-occurrence networks, and citation networks, were performed. The graphs used were line graphs of the annual scientific production, distribution graphs of the authors’ productivity according to Lotka’s law, tree graphs, and word clouds.
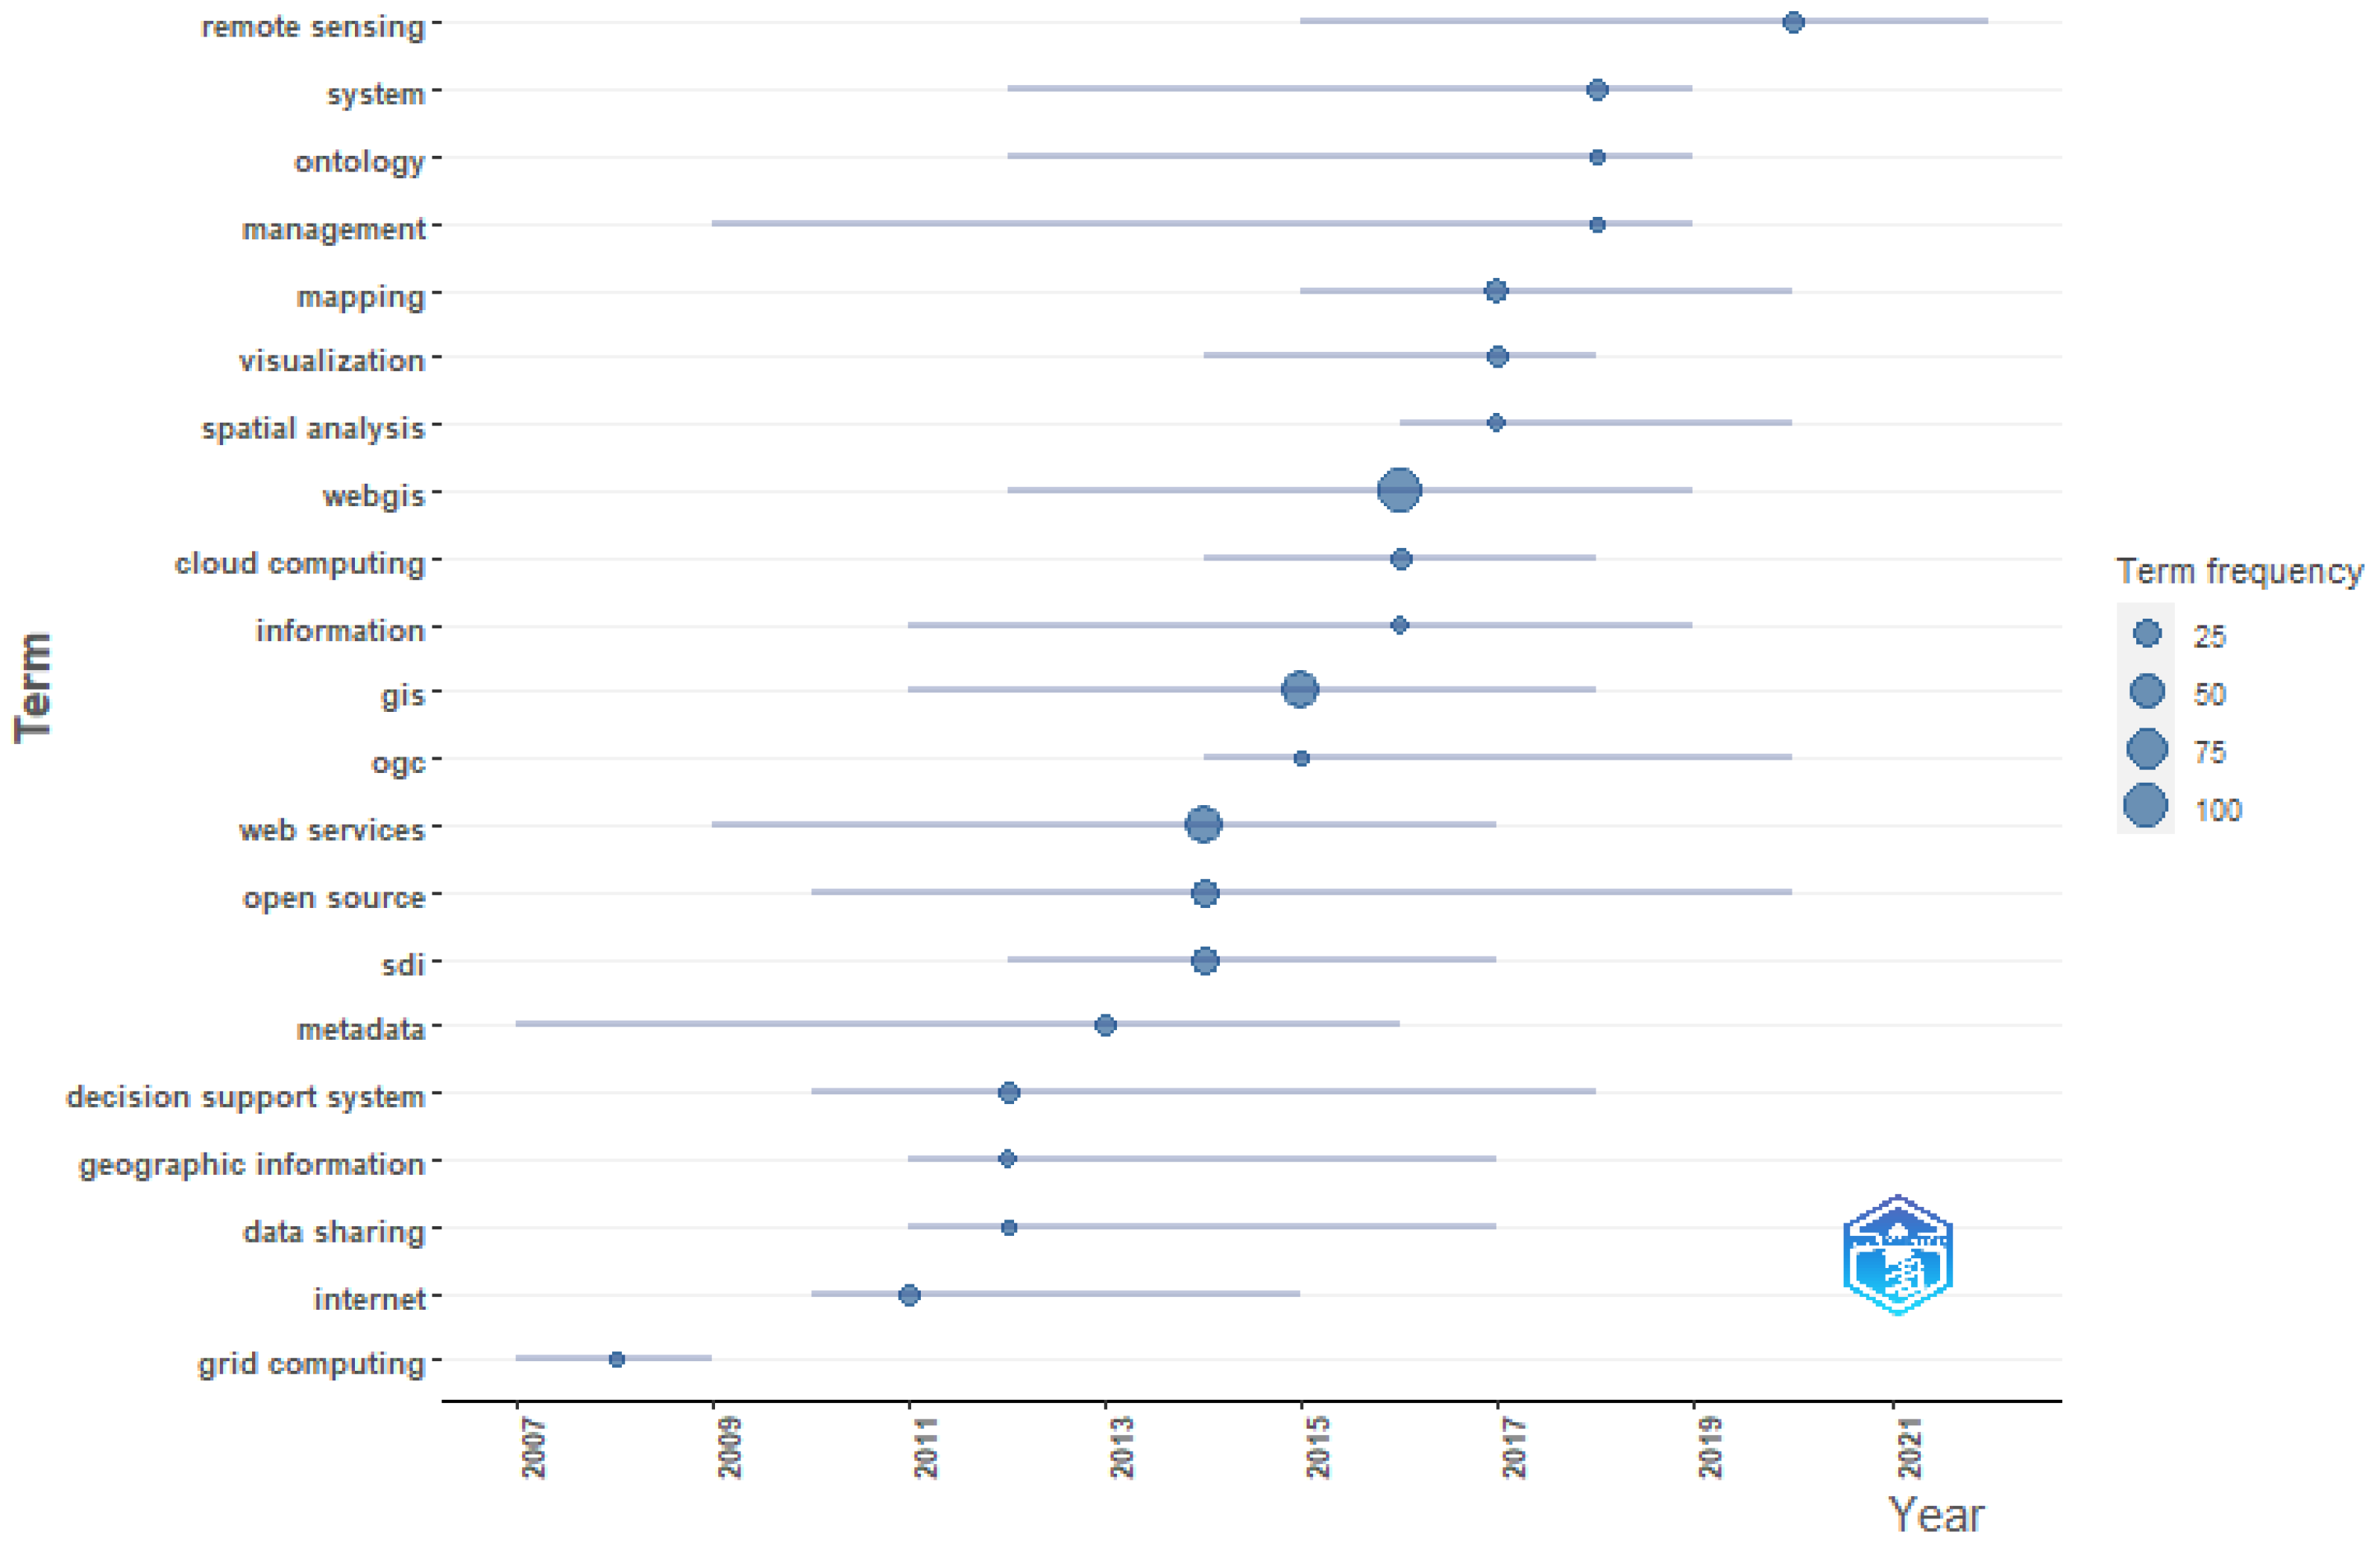
Regarding question RQ2, “What findings have been discovered from this global trend in the literature?”, keyword analyses were performed using Keywords Plus, Keywords’ Authors, Keywords Title, and Keywords Abstract. Conceptual structural maps, thematic evolution maps, dendrographs, and thematic maps were also produced. The graphs used included conceptual structure maps (scatter plots), thematic evolution maps (line graphs), dendrograms (hierarchical cluster analysis), and term evolution graphs to analyze the evolution of the frequency of keywords or terms in the field of research over time. The international collaboration map allowed for the identification of patterns of collaboration between countries and an understanding of the global dynamics in scientific production.
For question RQ3, “What are the implications and future directions of a WebGIS-based architectural framework?”, a citation analysis was used to identify influential documents, and thematic mapping was performed. The graphs generated were alluvial graphs (Sankey diagrams) to show the flows and connections between different stages or categories over time and topic diagrams (thematic maps) to represent topics according to their relevance and development within the research field. The main themes and trends in the applied research were addressed to analyze the evolution of GISs based on web architecture.
The results of the bibliometric analysis began with a description of the main bibliometric statistics to answer the three research questions RQ1, RQ2, and RQ3. Therefore, the metrics and information on several key elements were analyzed. These included the main information, annual scientific production, scientific sources, and the evolution of sources. Additionally, the number of articles per author, author domain ranking, and author impact (h-index, g-index, and m-index) were considered. Author productivity according to Lotka’s law, author keywords, and thematic cluster dendrograms were also evaluated. Author citations and article sources, production by country, citations by country, collaboration maps, and thematic evolution were included.
To carry out this analysis efficiently, we used the following: the RStudio software package (version R 4.3.0) and the Bibliometrix R package (http://www.bibliometrix.org, accessed on 30 September 2023), equipped with a set of scientometric tools and written in R language. These algorithms offer efficient statistics and integrated visualization tools, allowing for a more complete understanding of the examined research field [78]. The Microsoft Excel 2016 desktop application was used for statistical analysis and visual representation. These tools provide efficient statistics and integrated visualization capabilities, allowing for a complete understanding of the research field. The combination of these methods allowed for a detailed and comprehensive analysis, identifying the current status, key trends, issues, and future directions in the field of WebGIS and geospatial information systems.

3.4. Phase 4—Data Visualization

The fourth stage involved data visualization, in which appropriate mapping software was used to display the results of the third stage [83]. The analysis of the results required the use of a data-reduction methodology to demonstrate the knowledge structure [103].

3.5. Phase 5—Interpretation

Finally, the fifth stage included an exploratory and interpretative analysis [103], which allowed us to highlight the different themes in this area of the research domain, covering the entire period of publication and outlining the driving, core, specialized, and emerging themes, along with their evolution over time. For the interpretation of the findings, we relied on bibliometric methods and the researchers’ in-depth knowledge of the field, although these are not substitutes for extensive reading in the field. The second to fourth stages of the process were software-assisted and included different sub-stages [76].

4. Results

The results of the bibliometric analysis began with a description of the main bibliometric statistics, serving to answer the following two research questions, namely RQ1—what is the predominant global trend of scientific publications in the research field based on the main authors, keywords, and citations—and RQ2—what findings have been discovered from this global trend in the literature. Therefore, the metrics and information of each of the following elements were analyzed: (1) main information, (2) annual scientific output, (3) scientific sources, (4) evolution of sources, (5) number of articles per author, (6) author domain ranking, (7) author impact (h-index, g-index, and m-index), (8) author productivity (Lokta law), (9) author keywords, (10) thematic cluster dendrogram, (11) author citations and article sources, (12) country production, (13) country citation, (14) collaboration map, and (15) thematic evolution.

4.1. Descriptive Bibliometric Analysis

There has been an increase in the mention of web-based geographic information system (GIS) applications, techniques, and tools in the literature. Table 5 shows information on 358 articles that demonstrate this trend of scientific production between 2002 and 2023, and we conducted a historical count of the annual publications of all the selected articles.
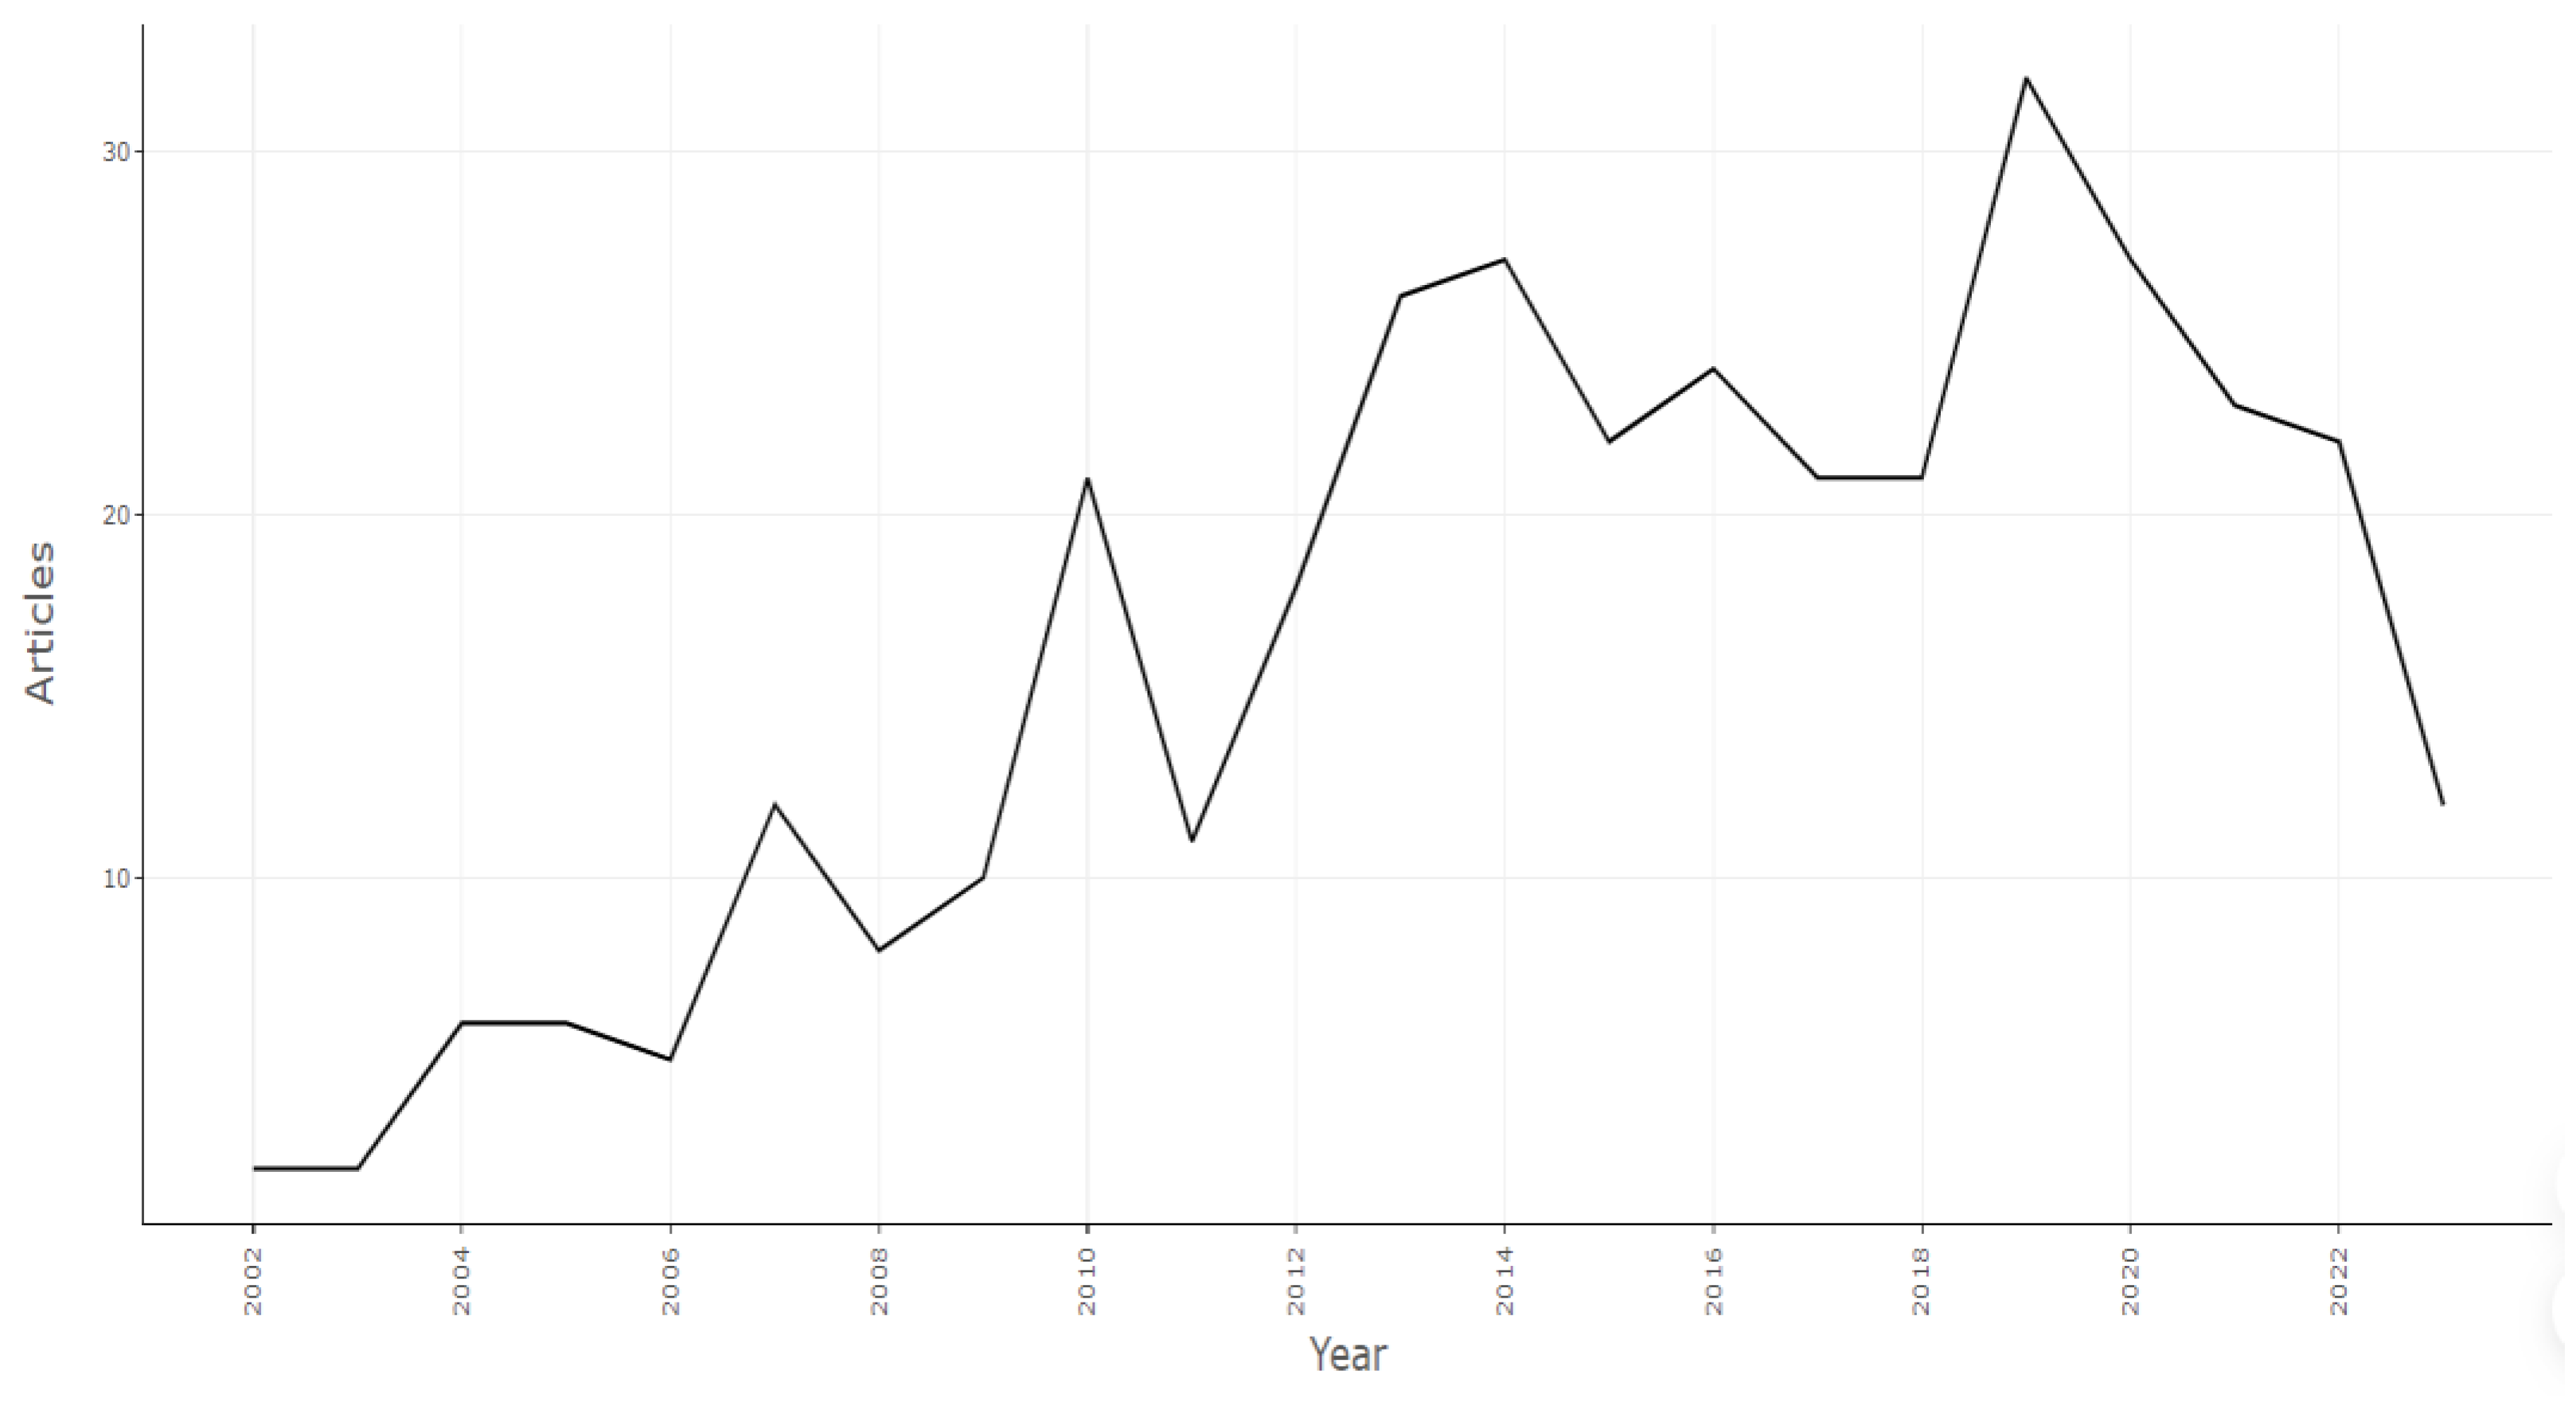
Our search strategy consisted of 358 documents, comprising 339 articles (94.7%), 17 reviews (4.7%), and 2 early accesses (0.6%). Over a period of twenty-one years, the first period, from 2002 to 2012 (10 years), there were an average of 11 articles produced per year, while in the last decade, from 2013 to 2023, it reached an average annual output of 11.36. The average annual number of publications in 2023 was 8.91. However, the highest spike in scientific output regarding GISs occurred in 2019, when it reached a peak of 34 publications. The collaboration index (CI) achieved was 4.22, indicating the average number of authors per jointly authored or co-authored article, of which an average of 27.93% accounted for international collaborations, demonstrating high collaboration in the web-based GIS scientific community. Overall, there has been a significant increase in the number of publications since 2002 (Figure 3). Over the past two decades, from 2002 to 2023, the scientific community’s interest in studying geographic information systems (GISs) based on WebGIS architectures has resulted in the publication of 358 peer-reviewed articles out of the 391 papers obtained from WoS, representing more than 92% of all collected publications.
We analyzed 358 articles published in peer-reviewed scientific journals. The distribution of articles (Table 6) did not show a significant concentration; however, it highlighted journals specializing in sustainability, environment, geographical sciences, ecology, natural sciences, environmental sustainability policy, practice and implementation, and land issues.
Figure 4 shows the frequency of the distribution of journals focusing on the theme in question and related topics. An inspection of the data from 2002 to 2023 revealed a remarkable increase in the number of publications on the topic. However, the graph illustrates the results of the local Loess regression, which integrates variables such as the number and timing of publications of the journal under analysis. This approach allows for an unbounded distribution function, whereby values less than zero can be assumed if the data are close to zero. Its use results in superior visual outputs and emphasizes the publication-period intervals.

4.2. Authors

This section presents the most cited authors in the field of WebGIS-based geographic information systems, along with their keywords, domain-ranking factors, and number of citations. Table 7 provides a list of the authors and their publications in the top 20 rankings, highlighting those with the highest number of publications. The following authors had the highest number of publications, with four publications each: Derron, M.H. [41,104,105,106], Jaboyedoff, M. [41,104,105,106], Li, Songnian [107,108,109,110], Kulawiak, M. [25,111,112], and Sayar A. [113,114,115,116].
According to this statistic, several authors have no more than two publications in their name. Although several authors assumed the role of lead authors, most contributed as co-authors. Accordingly, the subsequent section of this research seeks to measure the relative power of each author by analyzing the preponderance-ranking factor through the number of articles.

4.2.1. Classification of Authors’ Domains

The dominance factor (DF) quantifies the degree to which a given author is the first author of a fraction of articles co-authored by several authors. The DF metric has been widely used in numerous bibliometric studies to assess author dominance in article production. The DF ranking was determined by dividing the proportion of single-first-authored articles (Nmf) by the total number of multi-authored articles (Nmt) written by a given author. In the case of single-authored articles, this calculation was omitted because of the constant value of one. The DF factor can be mathematically expressed as follows:
DF = Nmf Nmt
Table 8 lists the top 20 DF classification systems. The information presented in tabular form indicates a paucity of articles per author, as well as indicating whether they are first-author or multi-author articles. These results demonstrate that we are dealing with an emerging topic in the literature. Furthermore, the table reveals that Aye Z. C. [41,105,106] and Karnatak H.C. [117,118,119] exert the most profound influence as authors in this field, each having published three articles as the first author, resulting in the highest DF among all authors, followed by Akinci H. [120,121], Balla D. [33,122], Hofer B. [123,124], and Kalabokidis K. [125,126], who have two articles as first authors. Aye, Z. C. is a professor at the University of Lausanne Faculty of Geosciences and Environment and holds a PhD in environmental sciences (Institute of Earth Sciences) and a master’s degree in geoinformatics. The author is interested in risk-management issues (webGIS, decision-support systems, natural hazards, risk management, and geoinformatics) encountered in several empirical studies in Europe. Karnatak, Harish Chandra, is a scientist and Head of the Department of Geoweb Services, IT, and Distance Learning (GIT&DL) at the Indian Institute of Remote Sensing (ISRO), and their research areas are geoinformatics, SDSS, open-source GIS, web and distributed GISs, spatial analysis, and processing on the web and e-learning. The areas of interest of the main authors are related to the topics of geoinformatics, open-source GIS, web and distributed GISs, WebGIS, and decision-support systems. The authors Kulawiak M. [25,111,127], and Sayar A. [113,114,115,116], despite having a larger number of published papers, are not listed as lead authors. Kulawiak M. occupies the seventh position because he is the author of only three out of four articles and has a lower DF than the other authors in the first position.

4.2.2. Authors’ Impact

Table 9 presents the results on the influence of the authors in relation to the h-index, which measures a researcher’s productivity and citation impact; the g-index, which evaluates the distribution of citations received by the researcher; and the m-index, which captures the value of the h-index per year, total citations, total articles, and the number of years that the researcher has been publishing scientific papers. The h-index was developed as a scientific metric to facilitate objective comparisons of research results, and it is based on the number of publications and their impact. Over the years, new indicators have emerged that extend the scope of the h-index, such as the ha-index, hp-index, and hp-frac-index. An example of this is the g-index, which considers the citation impact of an author and recognizes that a single article can generate numerous citations; its aim is to address the limitation of the h-index, which does not take into account the highest number of citations in any publication. In contrast, the m-index is a more effective measure of a researcher’s impact than the h-index. The hm-index considers the average number of citations of a researcher’s articles, which provides a more consistent and fair assessment of their impact over time. The h-index only considers the total number of citations, which may not accurately reflect the continuous contributions of researchers.
The results reveal that the top 20 authors have an h-index ranging from four to two. After a careful examination, which included the total citation count, number of articles disseminated, and year of publication start, it was found that there is a clear growing flow of research.

4.2.3. Authors’ Productivity

Lotka’s law (Figure 5) is a mathematical formulation that was first introduced in 1926 to explain the frequency of publication by authors in a specific research field. Essentially, this law postulates that the number of authors who contribute to research during a given period is the proportion of those who produce a single contribution. To represent this mathematically, x n × y x = C, where y x refers to the number of authors writing x n articles in a particular field of research, which is inversely proportional to the square of n. The constants C and n can be estimated by calculation. The results shown in Figure 5 are consistent with Lotka’s findings, which reveal that authors produce an average of two publications in a given research field. Furthermore, the figure shows the percentage of authors involved in the research field, suggesting that the field is young and growing. Specifically, approximately 93.1% of the authors have published only one research article, while only 5% have published two scientific articles, 1.7% have published three articles, and 0.2% have published between four and five articles.

4.2.4. Author Keywords

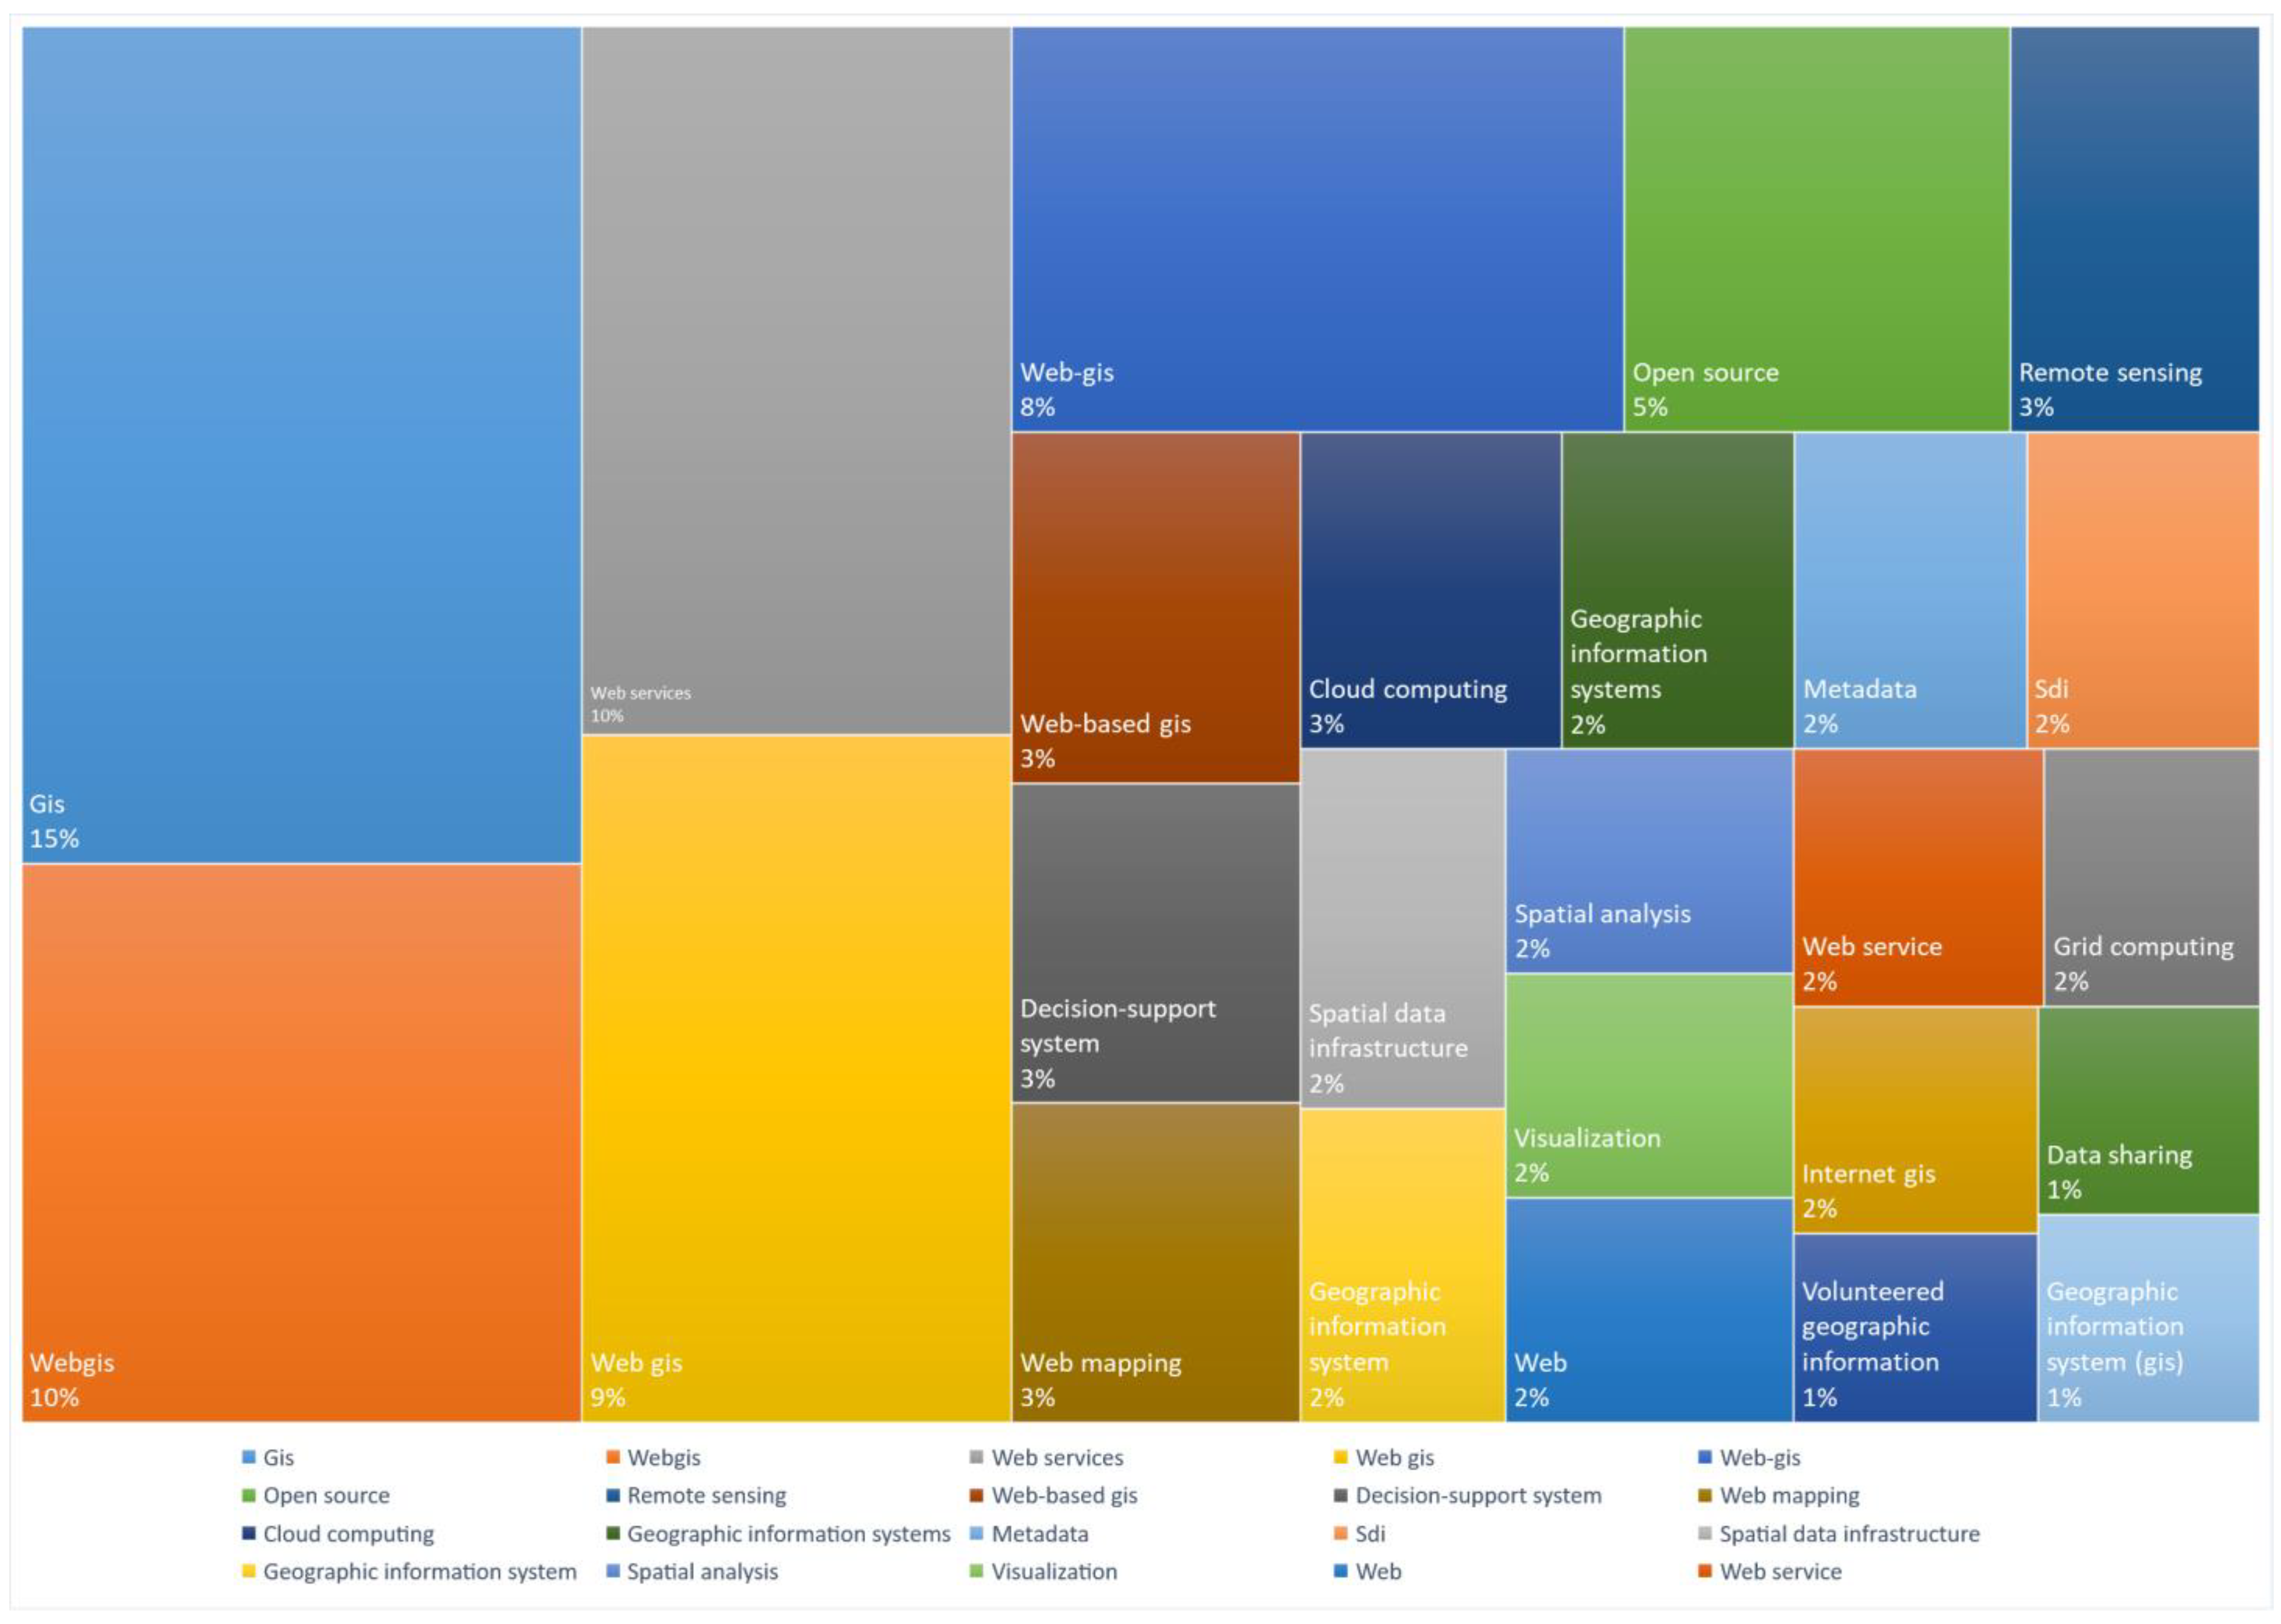
This section presents the correlations between keywords related to web-based geographic information systems. In academic articles, researchers use several keywords, and examining them is crucial for determining research trends, identifying gaps in the discourse on web-based geographic information systems, and determining areas that may be of interest for future research. Table 10 lists the total number of keywords per author in the top 25 positions and the number of related articles. These elements are not indicative but refer to the most frequently used keywords. However, if we focus on the keywords gis, web services, web-based gis, and open source, important aspects emerge. The keyword analysis reveals other main aspects, such as remote sensing, decision-support system, web mapping, cloud computing, spatial data infrastructure or SDI, and architecture, that are related to geographic information systems based on webGIS architecture.
The word-tree map (Figure 6) highlights the importance of analyzing the keywords used by academics in their academic publications. There is a notable dominance of terms related to Internet technology and geographic information systems, implying a notable focus on the merging of these disciplines. Importantly, a keyword analysis is of the utmost importance to determine research trends, identify gaps in the discourse related to web-based geographic information systems, and indicate areas of interest for future research. This reflects the diversity and depth of the topics addressed in this field while pointing to future directions, thus emphasizing the need to investigate the intersections between emerging technologies and spatial infrastructure to advance the understanding and application of these dynamic systems.
However, the thematic dendrogram in Figure 7 presents the hierarchical order and correlation between the author keywords generated through hierarchical clustering, and the multiple correspondence factor analysis (MCA) method was used to identify high-frequency keywords (omitting synonyms) and potential research topics that are important for bibliometric analyses and developing domain trends. The cutting of the dendrogram and the use of vertical lines helped to investigate and interpret the different clusters. As Andrews J. (2003) [128] points out, the purpose is not to determine the optimal level of connections between clusters but rather to estimate the approximate number of clusters in order to facilitate further in-depth analyses.
The Biblioshiny multiple correspondence factor analysis (MCA) tool was used with the following reference parameters: coding label field (field = DE); contiguous sequence of n terms (ngram = 1), factorial method used (method = MCA); minimum number of term occurrences to analyze and plot (minDegree = 4); number of terms (40); and number of clusters (cluster = 2), maximum number of clusters to maintain (k. max = 8), stemming = FALSE, and documents = 5. As a result, this study identified two main clusters within the proposed research field: (1) voluntary geographic information (VGI) and crowdsourcing and (2) geographic information system management decision making. The first thread focuses on the integration of geographic information on the web, enabling the visualization and analysis of and collaboration on maps and spatial data through online platforms related to research, with geographic data distributed by non-professionals through crowdsourcing, which involves obtaining contributions from a large group of people for a project or task. The second thread focuses on the application of geographic information systems (GISs), Web GISs, geoweb, and other similar systems based on web, mobile, service-based architectures (SOAs), and open-source architectures. These applications are used to process, monitor, share, and interoperate geo-referenced information with the help of maps that are applied to spatial data infrastructure (SDI). Open-source architectures, which are widely used in web and mobile applications, enable community collaboration, customization, and modification of software, providing flexibility, cost-effectiveness, and community support. Service-based architecture (SOA) can facilitate the creation of loosely coupled, interoperable geospatial services to provide comprehensive and customizable GIS functionality in the context of WebGIS, making it applicable to various domains, including web and mobile architectures. In summary, these areas are related to forest fires, environmental conservation and preservation, climate change, biodiversity, risk management, urban planning, energy, and other aspects.
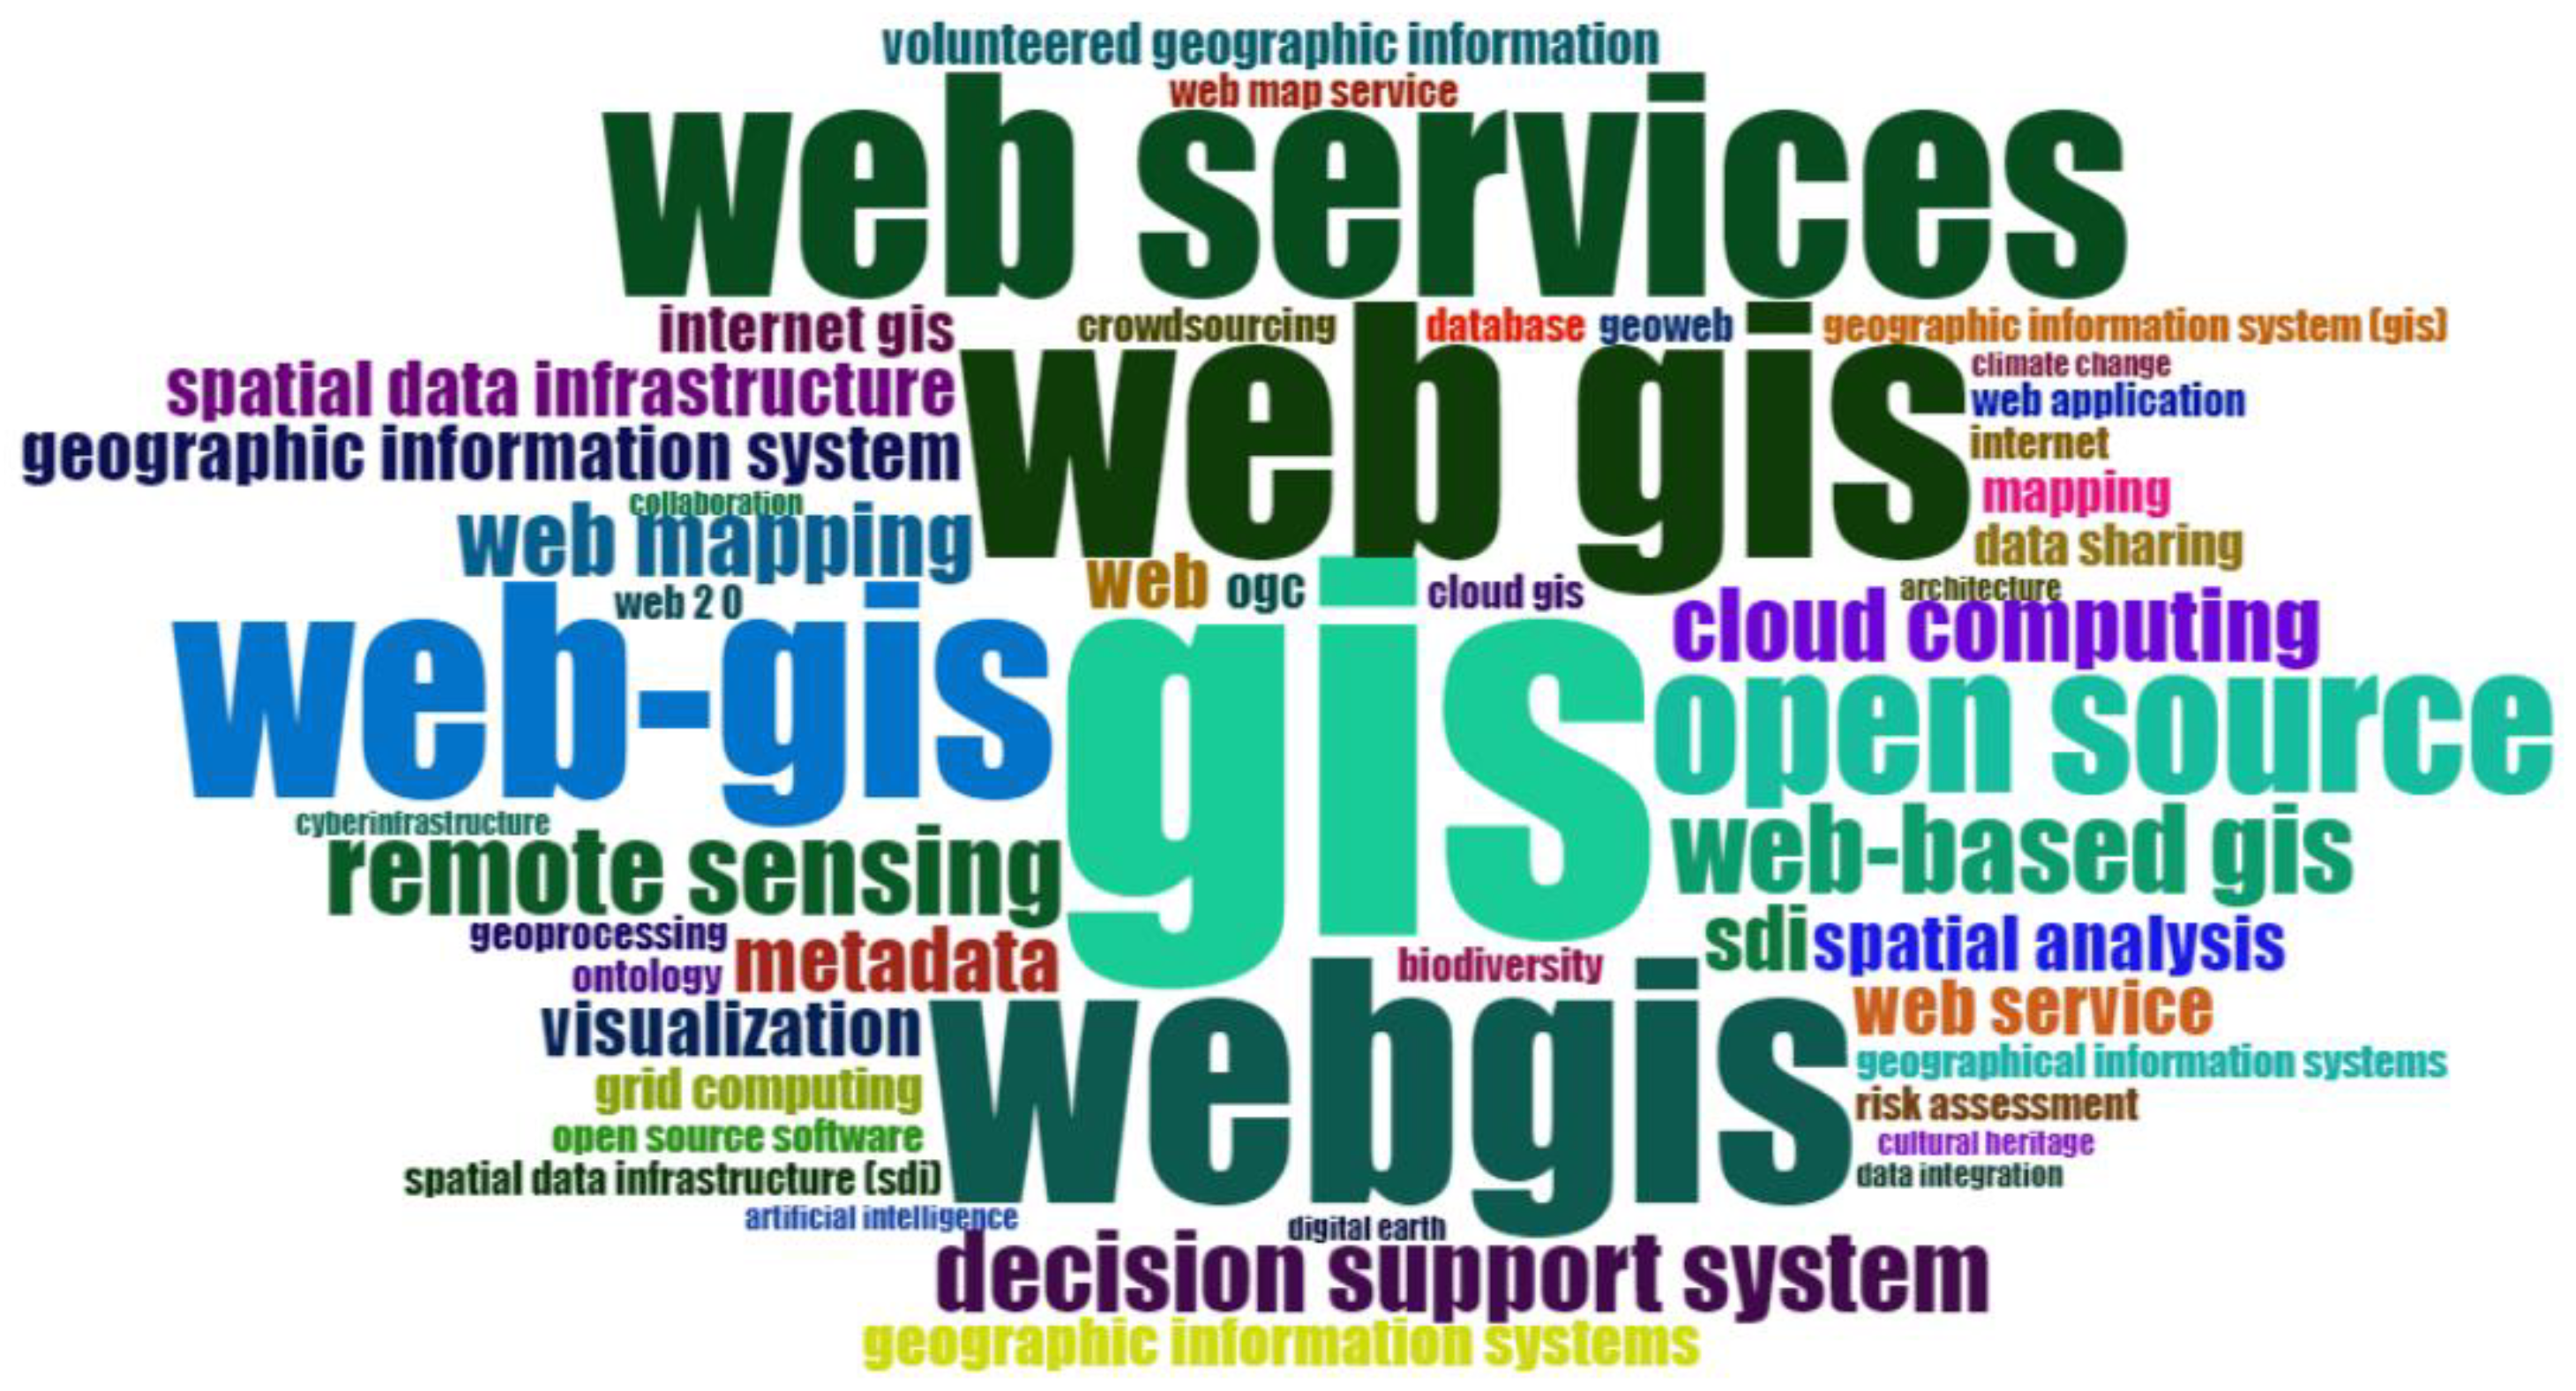
Furthermore, the word cloud (Figure 8) highlights important aspects of geographic information systems, such as web-based geographic information systems (GISs), decision-support systems, web services, spatial data infrastructure, remote sensing, cloud computing, and open source, as relevant aspects of the literature. The integration of geographic information systems (GISs) with web-based architectures or cloud services over the Internet is of the utmost importance in today’s geospatial technological landscape. This is because storing, processing, and accessing geographic data in the cloud allows for improved accessibility and real-time collaboration, resulting in greater efficiency in the management and analysis of geographic information. In addition, the presence of web services and web-based architectures simplifies data integration and facilitates spatial decision making through online platforms and applications, which significantly increases the applicability of geographic information systems in various fields, such as urban planning, environmental monitoring, and resource management.
Figure 9 shows the analysis of search trends in the field of geographic information systems (GISs), which revealed a significant evolution over the years. In the initial stages, research focused on the integration of GISs with other networked computing systems. However, from 2011 onwards, there was a shift towards the importance of the Internet in GIS-related research. In 2012, there was an increasing focus on the implementation of web-based GISs, highlighting terms such as “data sharing”, “geographic information”, and “decision support system”. In 2013, research focused on metadata, recognizing their fundamental role in the context of GISs. From 2014 onwards, spatial data infrastructure (SDI), open-source systems, and web services were emphasized, indicating an increased focus on interoperability and access to geospatial data. The emergence of the term “gis” in 2015 and the reference to the Open Geospatial Consortium (OCG) indicate greater recognition of the importance of GISs and international standards for geospatial data exchange. In 2016, the focus shifted again to the implementation of web-based GISs, with terms such as “information”, “cloud computing”, and “webgis” gaining prominence. From 2017 onwards, research specialized in areas such as spatial analysis, visualization, and mapping, highlighting the importance of spatial data representation and analysis. From 2018, researchers focused on concepts such as “ontology”, “management”, and “system”, indicating an interest in the organization and structured categorization of geographic data to facilitate their analysis and use. Finally, from 2020 onwards, the research diversified into areas such as “remote sensing”, due to the increasing use of GISs in applications related to climate and dynamic services. This analysis reflects the evolving importance of GISs and the need for interdisciplinary research to address various challenges in the field of geospatial information.

4.3. Author Citations and Article Sources

Table 11 shows the number of citations of the other articles in the top rankings. This shows that some articles were worth citing only in specific years. Several authors combined geographic information systems (GISs) with other fields; this significantly influenced the number of citations, especially with regard to the environment, risk, climate, and other aspects related to sustainability. The highest number of references was received by an article published in 2012, which was the most cited article to date. Four articles written in 2014, 2007, and 2010 were remarkably significant in terms of the number of citations received in various years and the ranking obtained. This indicates that the articles provided high-quality information on web-based geographic information systems. According to the results, Environmental Modelling & Software is the most cited, with citations from four articles published in the journal, followed by ISPRS Journal of Photogrammetry and Remote Sensing, Global and Planetary Change, and Journal of Environmental Management, with one article published in each journal. For the citation analysis, the methodology and approach employed by Groger and Plumer were used.
Environmental Modelling & Software is dedicated to the advancement of environmental modeling and software. Its goal is to improve our ability to describe, understand, predict, and manage the behavior of natural environmental systems at various scales spanning air, water, and land. These advances are intended to be disseminated to a wide scientific and professional audience. Journal articles explore the use of service-oriented architectures (SOAs) and geospatial services in environmental modeling, emphasizing the importance of geographic information systems (GISs) in this context. Specific examples of systems and tools, such as CRP-DSS for agricultural management, GeojModelBuilder (Version 1.0) for environmental monitoring, and HydroDesktop (Version 1.3) for hydrological data analysis, are mentioned to underline the integration of spatial data and interoperability as essential components of these applications.
The ISPRS Journal of Photogrammetry and Remote Sensing focuses primarily on disciplines that employ photogrammetry, remote sensing, spatial information systems, and machine vision, as well as related fields. The journal serves as a primary resource and a repository for advances in these areas of study. An article published in the journal examines CityGML, a global standard for 3D city models, with an emphasis on semantics. This standard facilitates the interoperability of geospatial data in applications such as urban planning, navigation, environmental simulations, and heritage management.
Other articles, such as that by Fang et al., focus on the integration of GISs into an integrated information system for environmental monitoring based on the Internet of Things (IoT) and cloud computing. In addition, a study by Raup et al. (2007) [129] focuses on the GLIMS glacier database, which employs GIS technology to store and analyze global glacier data using PostgreSQL with PostGIS. This database allows for customized map navigation, data queries, and downloads in GIS formats, as well as integration with other scientific disciplines through OGC protocols. Finally, Simão A. (2009) [130] addressed the use of a web GIS for collaborative planning and public participation. It presents a conceptual framework that combines information, the MC-SDSS, and argument maps to improve access to information and public participation in spatial planning. GIS was integrated into the spatial decision-support system (SDSS) with functionalities for spatial data acquisition and analysis. These studies confirm the growing trend in multidisciplinary research on the use of geographic information systems (GISs) and their contributions to visualization, temporal analysis, and data management in the fields of environmental management and sustainable development.

4.4. Countries

In this section, we investigate the diffusion of web-based geographic information systems, with a focus on identifying the country central to this research in terms of geographic reach. Our analysis comprised a review of all published articles, overall citation counts, and collaboration between researchers. We began by examining the total number of articles published on this topic.

4.4.1. Total Number of Articles per Country

Table 12 provides an analysis of the geographical distribution of research on web-based geographic information systems (GISs). Within this area of study, China stands out as the leading country in terms of academic output, with 229 published articles. This reflects China’s strong focus and rapid development in the field of web-based geographic information systems, also known as Web GISs.
China’s leadership in this field is evidenced not only by the number of articles published but also by the diversity and depth of the research conducted (229). This study covers a wide range of applications, including urban planning and environmental management. The increasing adoption of Web GISs in these areas has been driven by the need for informed and sustainable decision making in an ever-changing urban environment and natural resource management.
A key trend in the current research focuses on the integration of cutting-edge technologies, such as the Internet of Things (IoT) and artificial intelligence (AI), into geographic information systems. This is because these advanced technologies offer the ability to collect and process geospatial data in real time, significantly improving the efficiency of spatial decision making. For example, the IoT enables real-time data collection from sensors scattered across a city or region, providing valuable information for decision making in areas such as traffic management and environmental monitoring.
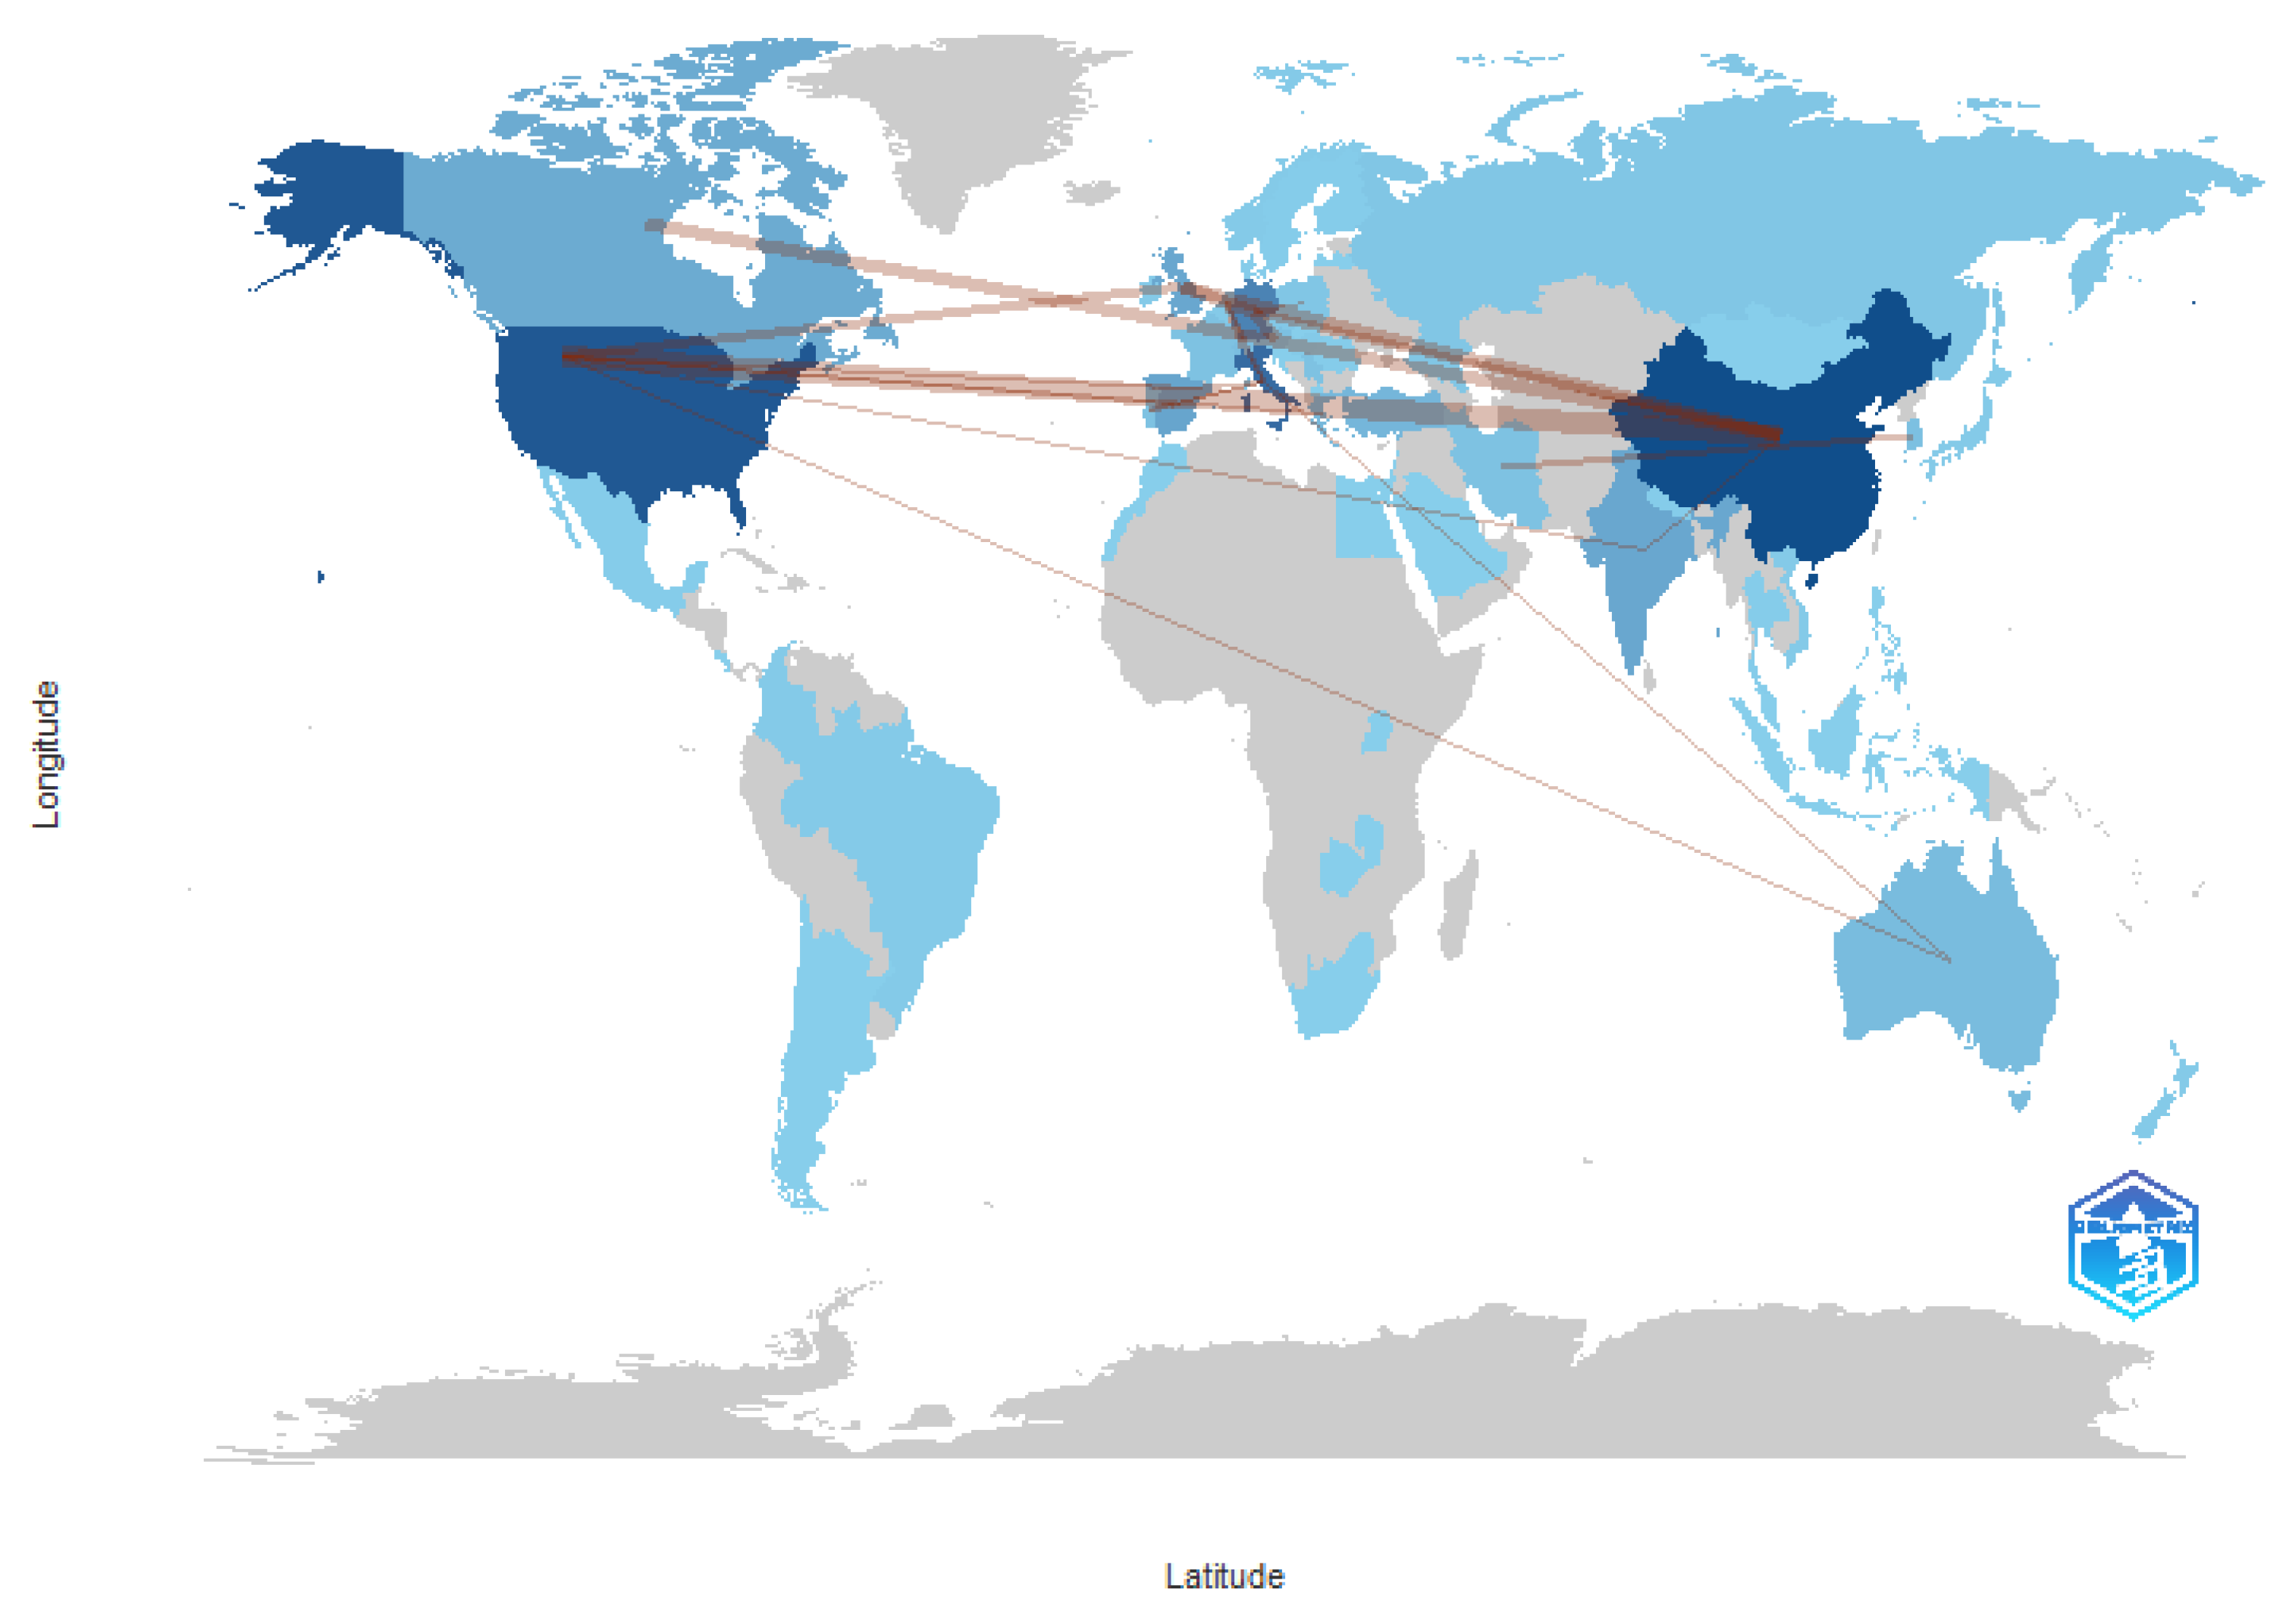
In summary, China’s dominance in Web GIS research underscores its commitment to the application of geospatial technologies to address urban and environmental changes. In addition, the trend toward IoT and AI integration highlights the need for more advanced and effective solutions in this evolving field. This research trend is also reflected in other countries, such as Italy (166), the United States (164), Germany (93), and India (64), indicating a global interest in the implementation of policies and technologies related to the environment, risk, sustainable development, and renewable energy. The faded blue shade in Figure 10 shows significant progress on the issue in several nations (Germany, India, Spain, the UK, Canada, Greece, and Turkey). The graph depicts the regions that are yet to participate in scientific discourse. It appears that there is a dearth of representation from South America and Africa, which may suggest a lack of participation from countries on these continents in the publication of web-based geographic information system articles during the period of investigation.

4.4.2. Country Publications and Collaboration Map

This section analyzes articles on geographic information systems based on web architecture in terms of single or multiple publications in each country. In this sense, it also intends to examine collaboration and networking between countries. Table 13 highlights the average number of citations per state and shows that New Zealand, France, Sweden, and the United States of America have a higher average number of citations than other countries. The United States, China, Germany, Italy, Spain, and the United Kingdom have the highest number of appointments. The United States (USA), China, and Germany show a high rate of collaboration between countries (Figure 10), considering the number of citations and the considerably high average number of citations per article, indicating strong collaboration and a focus on research and innovation in this field. Spain and the UK also have a high average number of citations per article, suggesting that the academic sector in these countries contributes significantly to the development and evolution of web-based geographic information systems. Overall, these countries appear to have strong research and development in this field, which may be supported by significant investments in academic research and related projects.

4.5. Evolutionary GIS Analysis Based on Web Architecture: Main Themes and Applied Research Trends

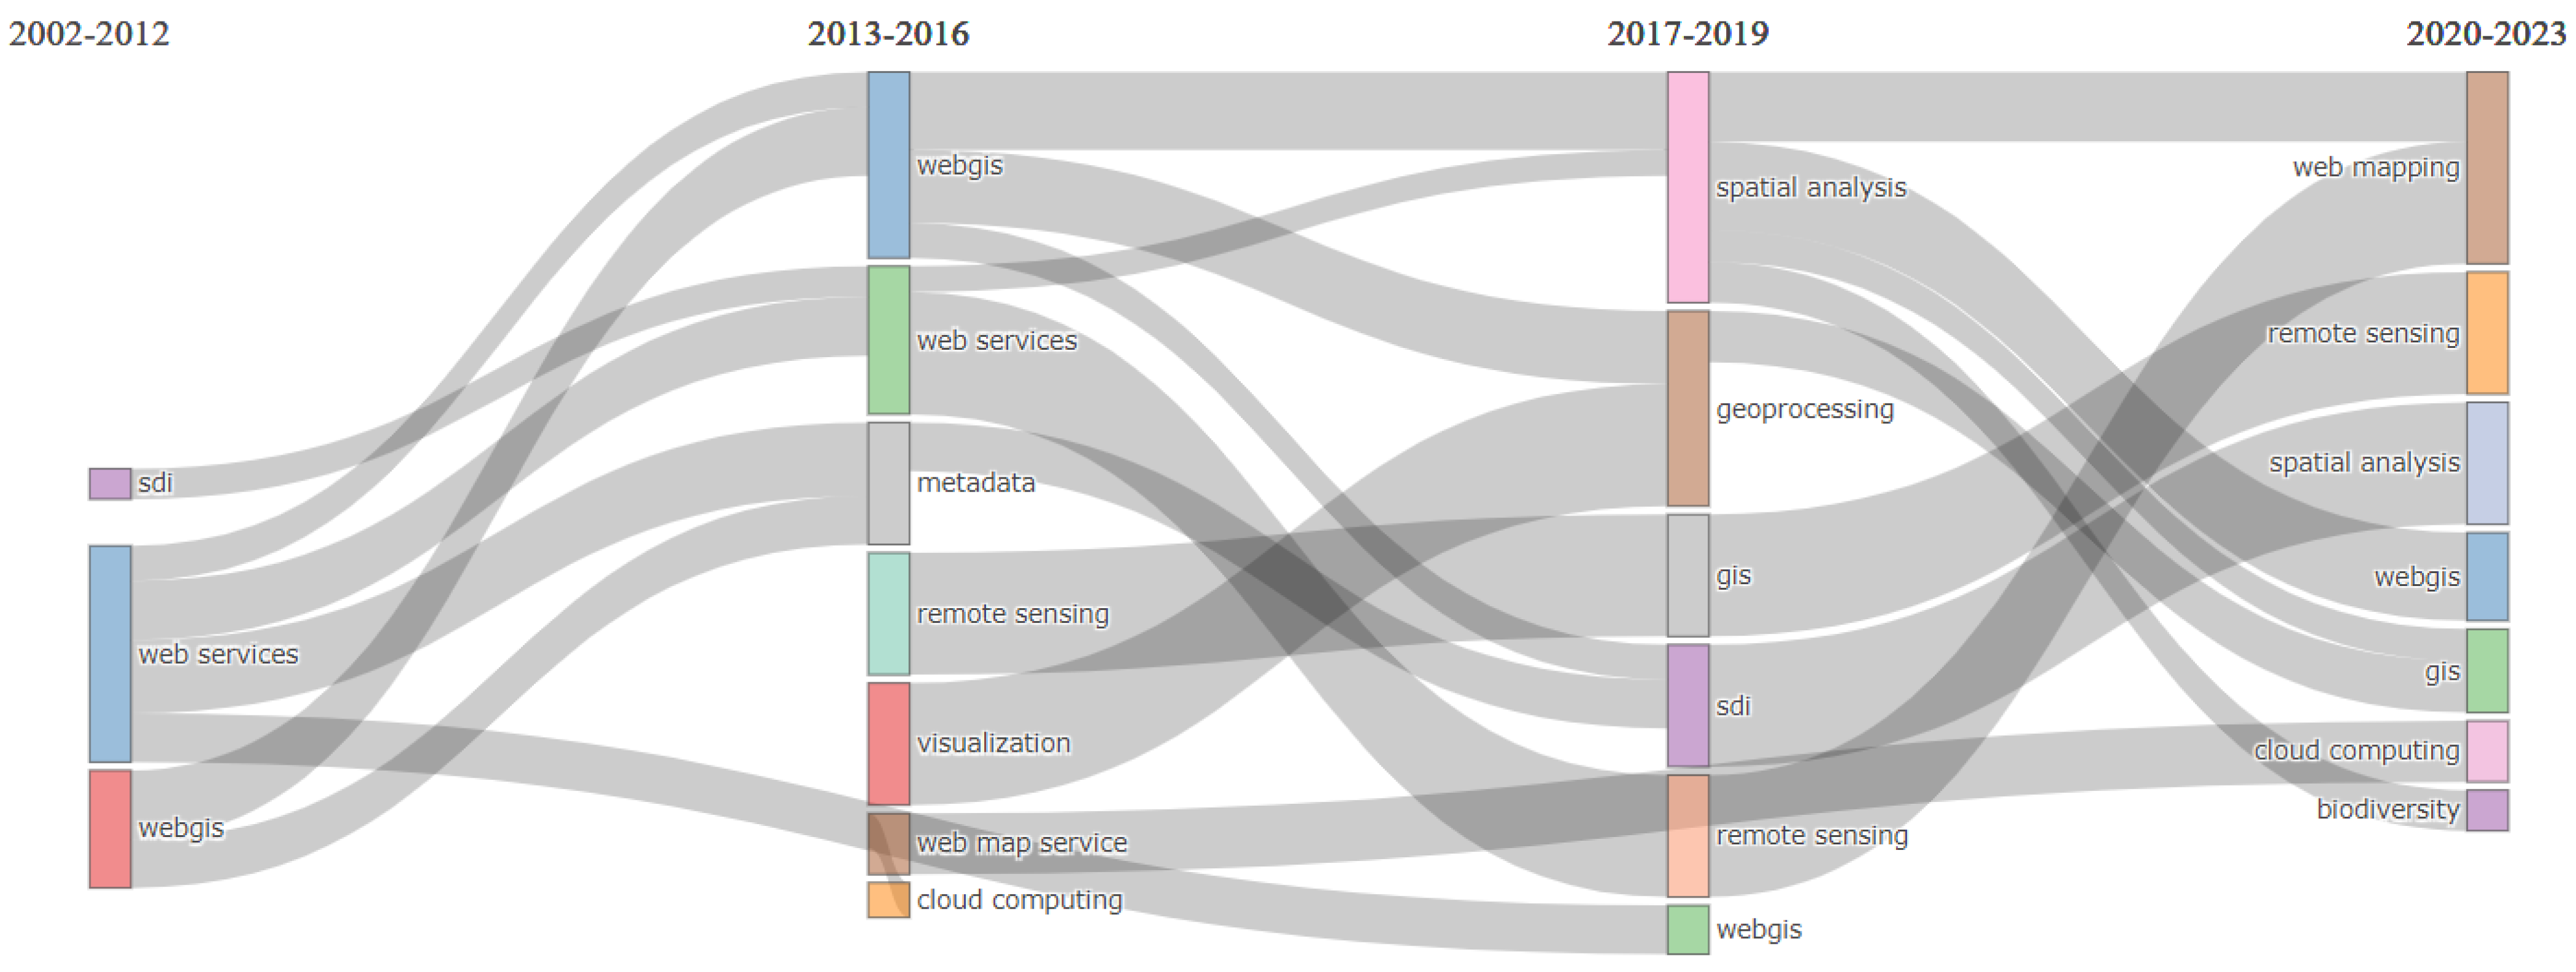
Figure 11 shows an alluvial graph derived from a longitudinal analysis of a thematic map, constructed with author keywords from a database of scripts, allowing us to track the evolution of topics regarding GISs. The analysis was segmented into four key periods using three cutoff points: 2012, 2016, and 2019. The parameters used in these frameworks were as follows: a word count of 250, a minimum clustering frequency of five per thousand documents, a weight index calculated using the inclusion index weighted by word occurrences, a minimum weight index of 0.1, three labels assigned to each cluster, and the use of the WalkTrap clustering algorithm.
Between 2002 and 2023, research in the field of geographic information systems (GISs) underwent significant evolution in thematic lines of interest. From 2002 to 2012, studies focused on spatial data infrastructure (SDI), web services, and webgis. The period from 2013 to 2016 marked a shift in focus towards webgis, web services, metadata, remote sensing, and visualization, standing out for its more robust scientific contribution, in addition to incorporating web map services and the application of cloud computing in this field of study.
From 2017 to 2019, the trends were oriented towards spatial analysis, geoprocessing, and gis, emerging as innovative topics in research. These were complemented by the continuity in the use of spatial analysis, geoprocessing, remote sensing, and webgis, which was prevalent in the previous period. The most recent thematic trends between 2020 and 2023 included web mapping, remote sensing, spatial analysis, webgis, gis, cloud computing, and biodiversity, with the latter being an emerging topic within the scope of application.
It was observed that certain topics showed a tendency to merge, split into subtopics, or even disappear over time. Between 2002 and 2012, “web services” and “webgis” were predominant. But, by 2013–2016, “webgis” had shifted towards “metadata” and “visualization,” while “sdi” had disappeared. From 2013 to 2016, “cloud computing” and “web mapping” services emerged, suggesting technological diversification. Then, from 2017 to 2019, “spatial analysis” stood out, indicating a focus on specialized analyses, while by 2020–2023, “web mapping”, “remote sensing”, and “biodiversity” had gained prominence, reflecting changes in priorities and the introduction of new concerns, such as biodiversity. This thematic analysis revealed the diversification and deepening of study areas within the field of GISs, reflecting both technological evolution and changing research and application needs in spatial analyses.
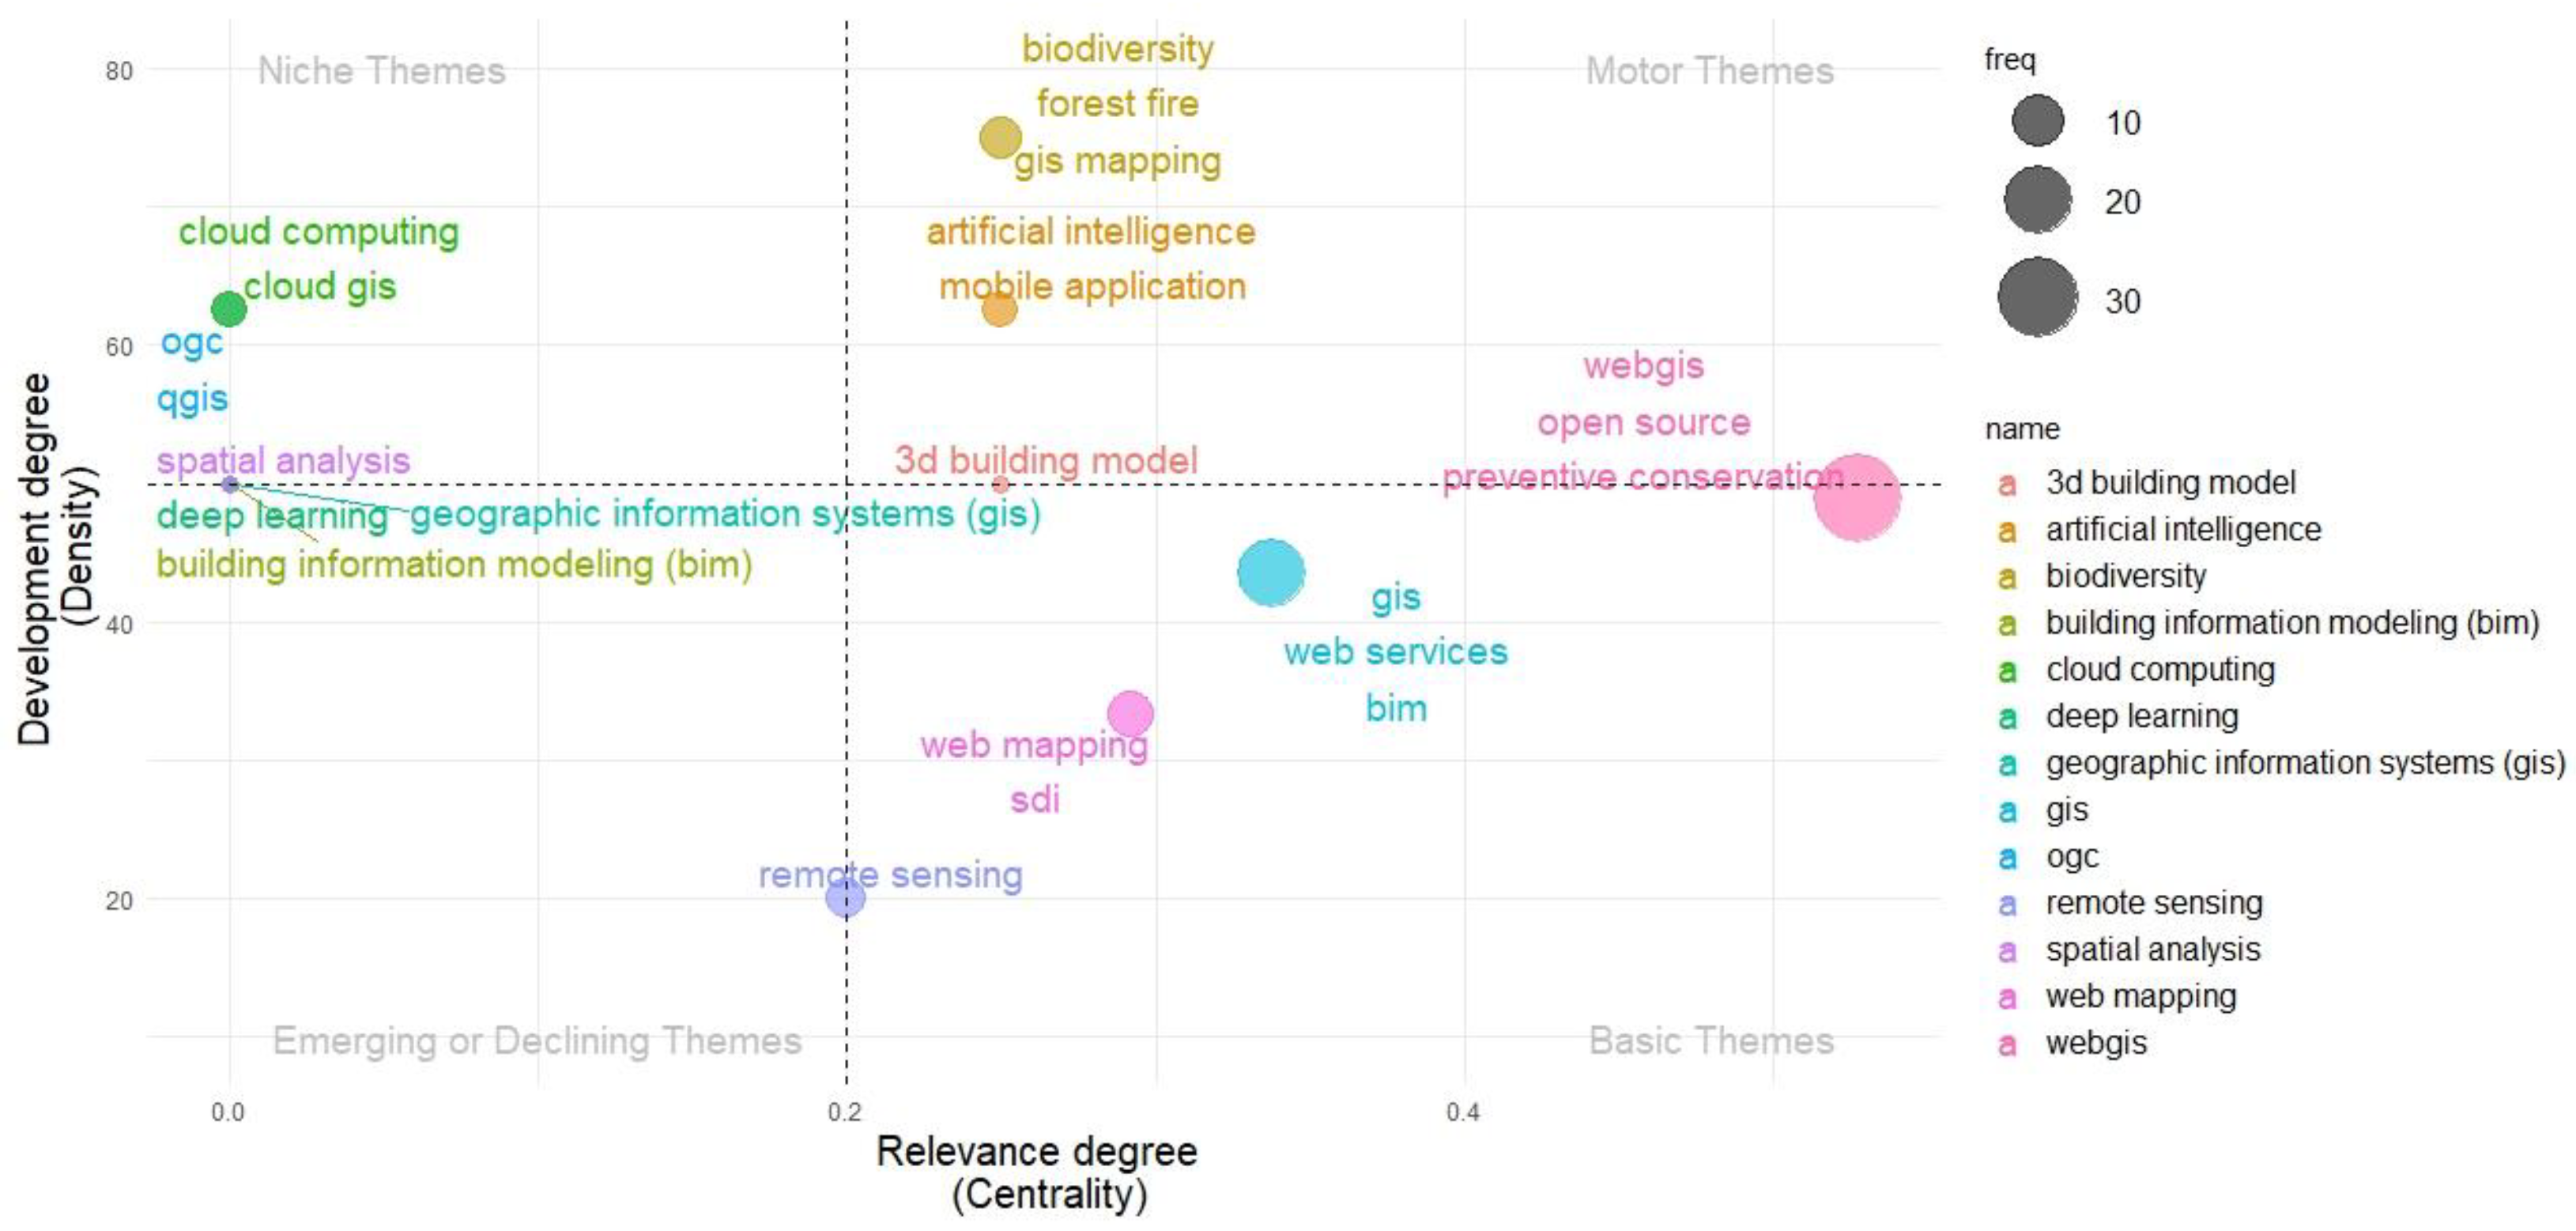
Figure 12 illustrates the progression of topics within the scope of the study. The author keyword network was subjected to a clustering algorithm that allows for discerning, describing, and accentuating numerous themes within a given area. A thematic or specific diagram was used to describe each cluster or theme during the last period of 2020–2023, allowing for an evaluation of the research trends of the last four years, which accentuated the importance (centrality) and advancement (density) of the thematic network.
During the last period of 2020–2023 (Figure 12), the presence of “remote sensing” and 3D building models as emerging or declining themes suggests an evolution in traditional “remote sensing” and 3D-modeling methodologies. The concentration of terms around “WebGIS”, “open source”, “web services”, “SDI”, and “BIM” in the core themes indicates a strong trend toward accessibility, interoperability, and collaboration in the field of geospatial data. The emergence of “cloud computing” and “CyberGIS” as niche themes reflects a specialized focus on cloud computing and cyberinfrastructure to handle large volumes of data. “Biodiversity”, “forest fire”, “GIS mapping”, “artificial intelligence”, and “mobile application” as driver themes show a significant move towards the integration of advanced technologies, such as artificial intelligence and mobile applications, in geospatial data management and analysis. The clustering of biodiversity and wildfire themes highlights the application of these technologies in the management of critical environmental issues. Taken together, these 2020–2023 trends reflect a field that relies heavily on digitization, grid computing, and mass collaboration, with a clear drive towards decision-support systems and real-time data-driven solutions, pointing to a future with increasingly integrated and connected technologies.

Analysis of Emerging Priorities and Advanced Technologies in WebGIS: Thematic Clusters and Relevant Studies

This section examines new priorities and emerging technologies in geographic information systems (GISs) based on web architecture. A detailed analysis of the thematic clusters was performed, differentiating between the basic themes and related drivers in Figure 12, and the relevant studies that illustrate these trends were highlighted. This approach provided insight into the evolution and key innovations of WebGIS.
In the cluster of driving themes (“biodiversity”, “forest fire,” and “GIS mapping”), Niza et al. (2021) [131] stand out for their study on the use of digital images to assess biodiversity (“A Picture is Worth a Thousand Words: Using Digital”). Also noteworthy is a study by Qayum et al. (2020) [132] for the predictive modeling of forest fires using geospatial tools (“Predictive Modeling of Forest Fire Using Geospatial”). These studies highlight the importance of geospatial and digital technologies in the assessment and protection of biodiversity, as well as in the prevention and management of natural disasters, such as forest fires. The trend towards the use of advanced tools for environmental management is evident and will continue to grow. This is especially true with the increasing availability of data and improvements in predictive modeling technologies.
In the cluster of driving themes (“artificial intelligence” and “mobile application”), Ishida et al. (2020) [133] focused on the implementation and evaluation of a web-based registration system. Tengtrairat et al. (2021) [134] developed an automated method for landslide hazard prediction using artificial intelligence and web GIS techniques. Razavi-Termeh et al. (2020) [26] presented ubiquitous GIS-based wildfire susceptibility mapping, with maps designed and implemented for web and mobile applications. These studies highlight how artificial intelligence and advanced GISs can significantly improve the prediction and management of natural hazards, providing more accurate and efficient tools for real-time decision making. The application of artificial intelligence in geospatial analysis is driving a new era of innovation in risk and disaster management.
In the core cluster of topics (“gis”, “web services”, and “bim”), Xu Z. et al. (2020) [60] stand out for their work on combining IFC and 3D tiles to create 3D visualizations, thus improving visualization capabilities in architecture and engineering. Achuthan et al. (2021) [135] provided a digital information modeling framework for UAS-ENG, advancing geospatial data capture and analysis. Jiang et al. (2022) [136] focused on surface water quality encapsulation, demonstrating the application of GISs in environmental monitoring. Sammartano et al. (2023) [137] integrated HBIM-GIS models for a multi-scale seismic analysis, providing a powerful tool for seismic risk management.
In the cluster of basic topics (“webgis”, “open source”, and “preventive conservation”), Sanchez-Aparicio et al. (2020) [138] stand out with their WebGIS approach for preventive heritage conservation, highlighting the importance of this type of technology in cultural preservation. Masciotta et al. (2023) [139] integrated laser scanning and 360 photogrammetry technologies with WebGIS, facilitating the capture and detailed visualization of geospatial data. Belcore et al. (2021) [31] optimized precision agriculture through a WebGIS-based workflow, while La Guardia et al. (2023) [48] moved towards the creation of web-based digital twins. Atesoglu et al. (2023) [140] assessed land use and vegetation changes, demonstrating the capability of WebGIS in environmental monitoring. Szujo et al. (2023) [141] applied WebGIS to the mining sector, highlighting its versatility in handling complex 2D and 3D data.
In web mapping and SDI clustering, Foglini et al. (2023) [142] stressed the importance of marine spatial data infrastructure for managing maritime space. Nunez-Andres et al. (2022) [143] highlighted the use of spatial data infrastructure for rock inventory, while Duarte et al. (2021) [144] promoted open-source GIS applications for spatial assessment. Karakol and Comert C. (2022) [145] emphasized the architecture for the composition of semantic web services, and Myslen-kov et al. (2023) [146] created a web atlas of wind waves of Russian seas, facilitating the visualization and analysis of natural phenomena.
In summary, the analysis of new priorities and emerging technologies in WebGIS revealed a significant evolution in thematic clusters, highlighting the central roles of biodiversity, forest-fire prediction, artificial intelligence, and mobile applications. Studies such as those by Niza et al. (2021) [131] and Qayum et al. (2020) [132] underline the importance of geospatial technologies in environmental assessment and protection. However, Ishida et al. (2020) [133] and Tengtrairat et al. (2021) [134] demonstrated how artificial intelligence and mobile applications improve the prediction and management of natural hazards. The combination of GISs with web services and cloud computing, along with the incorporation of advanced technologies, is driving a new era of innovation in the field, improving accessibility, collaboration, and efficiency in geographic information management.
Despite these advances, challenges and gaps remain that require further research. Data integration remains a key challenge, particularly in simplifying spatial decision-making. It is crucial for deepening our understanding of how to optimize the utility of WebGIS in web- and cloud-based environments. In addition, the increasing complexity of geospatial data and the need for more accurate and efficient tools for real-time analysis highlight the importance of the further development of artificial intelligence technologies and mobile applications. Future research should focus on other aspects or fields of application to maximize the potential of WebGISs, not only in urban planning but also in environmental monitoring and resource management, ensuring that these tools continue to evolve to meet other emerging challenges. This analysis provides a valuable roadmap for future research, highlighting the importance of adaptability and innovation in the application of GISs to address emerging environmental and technological challenges.

5. Discussion

This bibliometric analysis was conducted to determine the predominant research trends with respect to the scientific output of author productivity, citation relevance, journals, cross-country production and collaboration, and other sub-themes. Furthermore, we explored the pattern of academic articles related to this topic, untapped knowledge, possible avenues, and future implications using the scientific mapping workflow applied [77,78,79,86,87]. The bibliometric analysis identified the authors with the highest number of publications: Derron, M.H. [41,104,105,106], Jaboyedoff, M. [41,104,105,106], Li, Songnian [107,108,109,110], Kulawiak, M. [25,111,112], and Sayar A. [113,114,115,116]. However, a closer analysis of the results using the domain factor (DF) as the first authors revealed that Aye, Zar Chi [41,105,106] and Karnatak H.C. [117,118,119] exerted the most significant influence as authors in the field of geographic information systems based on WebGIS architectures. Each of them published three articles as the first author, which makes them stand out in this research area. Akinci H. [120,121], Balla D. [33,122], Hofer B. [123,124], and Kalabokidis [125,126], who have also made notable contributions, closely follow them. Aye, Zar Chi [41] focused on addressing issues related to WebGIS risk management, decision-support systems, natural hazards, risk management, and geoinformatics, with a special emphasis on conducting empirical studies in Europe. Karnatak Harish Chandra [117,118,119], however, conducted research in the areas of geoinformatics, SDSS, open-source GISs, web and distributed GISs, web-based spatial analysis and processing, and e-learning. The main areas of interest of these authors demonstrate a clear relationship between the topics of geoinformatics, open-source GISs, web and distributed GISs, WebGISs, and decision-support systems.
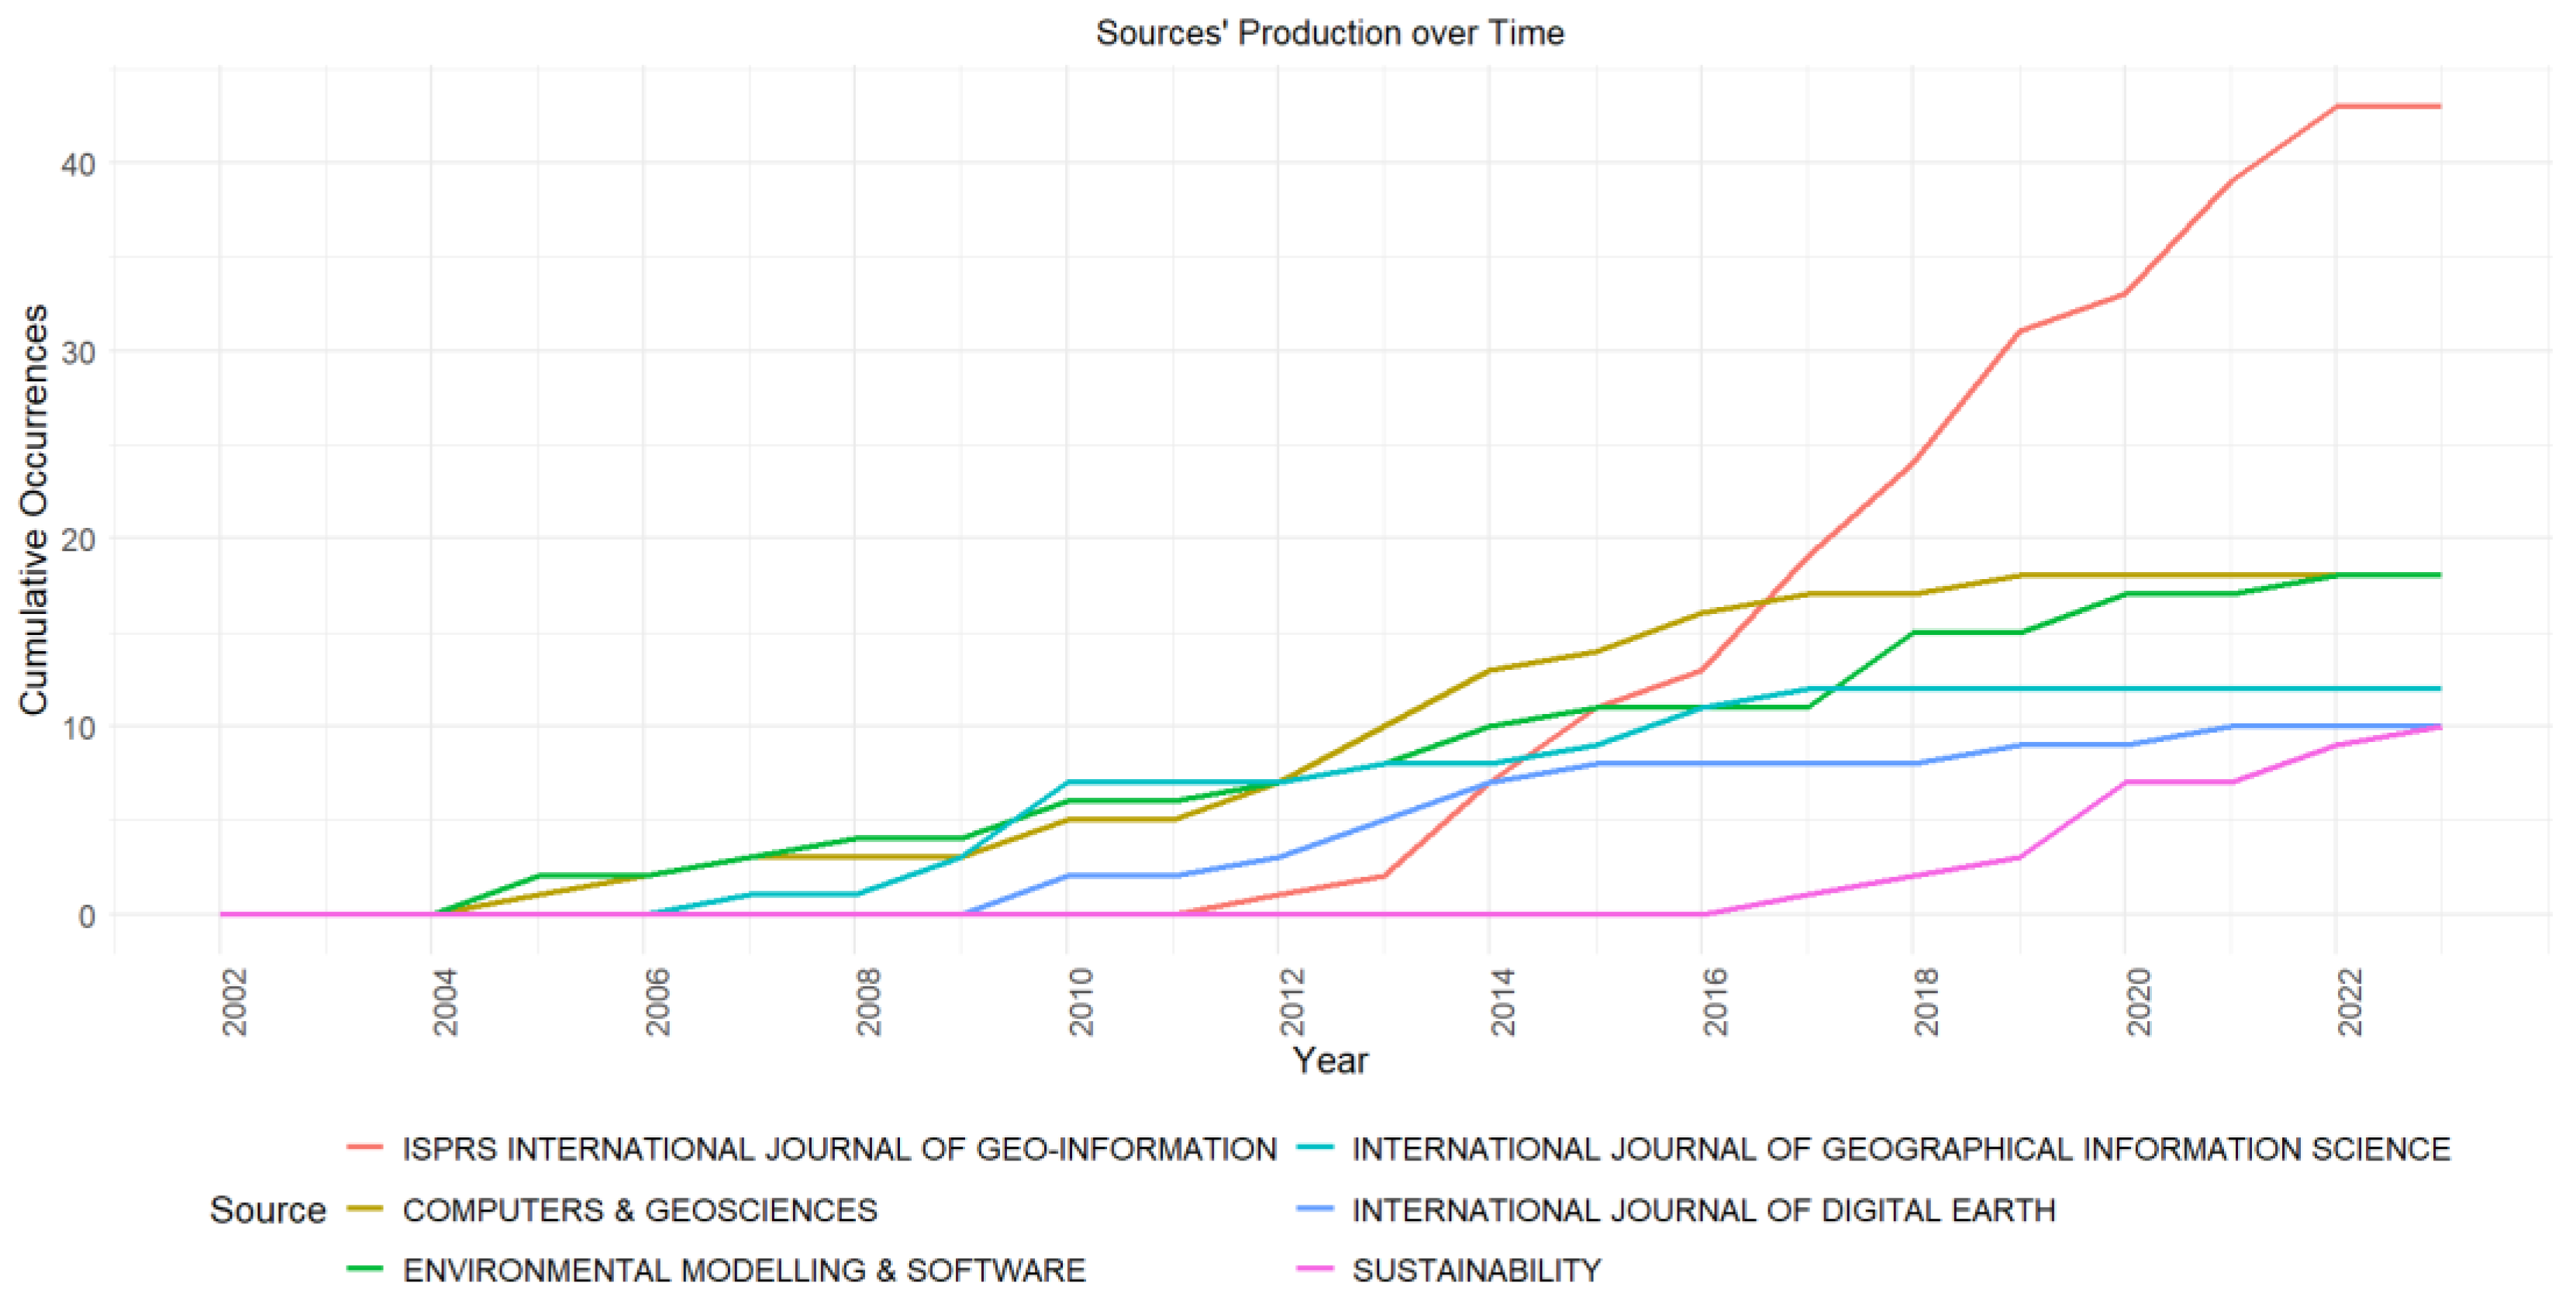
The analysis also revealed that the journals with the highest number of articles on the topics under analysis were the ISPRS International Journal of Geo-information with 43 publications, Environmental Modelling & Software with 20 publications, and Computers & Geosciences with 19 publications. These were closely followed by the International Journal of Geographical Information Science with twelve publications and the International Journal of Digital Earth and Sustainability with ten publications. These journals focus on topics related to earth sciences, computer science, and geospatial technology, with a particular focus on modeling, software, geographic information, and environmental sustainability.
In terms of the citation analysis, the methodology and approach employed in an article in 2012 [147] obtained the highest number of references, thus making it the most cited article to date. It is worth noting that four articles written in different years [148] had considerable significance in terms of citations received over several years and the subsequent ranking achieved. This indicates the provision of high-quality information on web-based geographic information systems within these articles. This evidence further underlines the broad focus of this field of research in defining WebGIS architecture. Furthermore, the thematic dendrogram (Figure 7) outlined two progressions in the discourse, where two main clusters were identified in the proposed knowledge field: (1) volunteered geographic information (VGI) and crowdsourcing and (2) GIS management for decision-making. The first thread focuses on integrating geographic information into the web, enabling the visualization and analysis of and collaboration on maps and spatial data through online platforms. The second thread focuses on GIS applications based on the web, mobile, SOA, and open-source architectures. These areas are associated with forest fires, conservation, climate change, biodiversity, risk management, urban planning, and energy. In addition, this study highlights important aspects of GISs, such as (1) web-based GISs, (2) decision-support systems, (3) web services, (4) spatial data infrastructure, (5) remote sensing, (6) cloud computing, and (7) open sources.
The evolutionary analysis of web-based geographic information system (GIS) architecture between 2002 and 2023 (Figure 11) revealed a remarkable progression in research topics, highlighting the transition from spatial data infrastructure and web services to more advanced technologies, such as spatial analysis, cloud computing, and artificial intelligence. In the early years, the focus was on establishing a solid foundation for the interoperability of and access to geospatial data. Beginning in 2013, the emphasis shifted to metadata integration, remote sensing, and data visualization, marking an evolution towards more sophisticated techniques for geographic information management.
From 2020 to 2023 (Figure 12), topics such as web mapping, remote sensing, spatial analysis, and biodiversity became more relevant, reflecting a shift in research priorities toward environmental conservation and natural resource management. Leading studies from this period demonstrated how artificial intelligence and mobile applications can significantly improve the prediction and management of natural hazards, providing more accurate and efficient tools for real-time decision making. These technological advances are driving a new era of innovation in the field of GISs, improving accessibility, collaboration, and efficiency in geographic information management.
Despite these advances, significant challenges remain in the literature that must be addressed in future research. Data integration remains a key challenge, particularly in simplifying spatial decision making. It is crucial to optimize the utility of WebGIS in environments based on emerging technologies by applying more accurate and efficient tools for real-time analyses, such as augmented reality (AR), big-data analytics, the Internet of Things (IoT), blockchain, and geospatial data security. In addition, exploring priority areas related to WebGIS aligns with the sustainable development goals (SDGs) [149], including natural resource management (SDGs 6 and 15), climate change and resilience (SDG 13), sustainable urbanization (SDG 11), food security (SDG 2), health and well-being (SDG 3), quality education (SDG 4), and infrastructure and innovation (SDG 9). The application of WebGIS in these areas highlights its potential to contribute significantly to sustainable development by addressing global challenges through efficient and collaborative geospatial information management. Future research should focus on maximizing the positive impact of WebGIS in these areas and ensuring that this tool continues to evolve to address new global challenges.
Finally, the authors analyzed the research results and issues under discussion and strongly support the idea that the integration of GISs with web-based architectures or cloud services improves accessibility, collaboration, and efficiency in geographic information management and analysis. However, web services and web-based architectures can further simplify data integration and facilitate spatial decision-making; therefore, other factors should be explored. This study highlights the increasing applicability of GISs to urban planning, environmental monitoring, resources management, and, as of 2019, the field of health.
In the context of future research and trends, there is a need to deepen our understanding of global agendas. These include the Sustainable Development Goals (SDGs), the 2030 Agenda for Sustainable Development [150], the Paris Agreement on Climate Change [151], the Sendai Framework for Disaster Risk Reduction 2015–2030 [152], the Convention on Biological Diversity (CBD) [153], the UN-Habitat’s New Urban Agenda targets [154], the Intergovernmental Panel on Climate Change (IPCC) targets [155], and the WHO’s Global Health Strategy 2020–2025 [156]. The integration of WebGIS into these global frameworks and agendas can enhance their impact, improve geospatial information management, and facilitate informed decision making in various fields critical to sustainable development and global resilience.

5.1. Implications

In response to research question RQ3, “What are the implications and future orientations of a WebGIS-based architectural framework?”, from a theoretical perspective, future research on geographic information systems (GISs) based on web architectures or cloud services could further explore the theoretical foundations underlying the integration of these reusable, geospatial service-oriented technologies that enhance user experiences related to the discovery, access, processing, and visualization of geospatial data in a distributed manner in a distributed computing environment [157]. A more detailed analysis of the conceptual frameworks underpinning web architecture and how they relate to the fundamental principles of GISs can be undertaken. This could include the evaluation of the theoretical models that guide interoperability, scalability, and security in web and cloud environments, as well as the development of new theories that address emerging challenges in the field, such as machine learning and artificial intelligence, in geospatial analysis and decision-making processes.
At a practical level, future research could focus on the development and effective implementation of strategies to improve usability and user experience in web-based GIS applications or cloud services. This can be achieved by identifying design constraints and refining the platform [158]. Optimizing user–system interactions and understanding the specific needs of users in different application contexts could be fruitful areas. In addition, practical research could explore the integration of emerging technologies, such as artificial intelligence and machine learning, to further enhance the analysis and decision-making capabilities of web-based GISs.
Another relevant research direction could be the ongoing assessment of the security and privacy of geospatial data in the web and cloud environments. As these technologies evolve, it is crucial to address issues related to protecting sensitive geographic information and ensuring the integrity of data. Applied research in this area could be essential for developing practical frameworks and policies for data and information security [159] and cross-domain authorization [160], as well as web server-, application server-, and database server-level applications that support trust in the use of web-based GISs and cloud services.

5.2. Limitations

This study, like any other study, has certain limitations that could be addressed in more comprehensive future research. For example, exploring only one research database, such as the Web of Science database, might impose restrictions. A more complex examination could also delve into the Scopus, IEEE, and Dimensions databases separately and holistically, particularly in terms of GIS-related aspects. Therefore, the use of search terms such as “geographic information systems” or “GIS” and “web architecture” or “web service” might be too broad and could have inadvertently excluded valuable studies. Furthermore, although our analysis included 358 peer-reviewed scientific articles, an analysis of conference papers might yield interesting results for subsequent researchers, given the novelty of this research topic. Moreover, as this is a nascent field of research, our analysis will inevitably be subject to periodic obsolescence as newer research is published. Finally, although the bibliometric analysis mitigated the subjectivity of our examination [161], the identification and verification of recurring themes may yield different results, revealing areas of great interest that have not been mentioned in this study.

6. Conclusions

The presented bibliometric analysis provides a comprehensive overview of the current trends in the exploration of geographic information systems (GISs) based on web frameworks and cloud services. Through a comprehensive assessment of scientific productivity, influential authors, leading journals, and thematic patterns were identified, thus describing the current landscape of this emerging field. A bibliometric analysis underlines the importance of exploring both the most consulted publications and the contributions of individual authors. Therefore, this study adopted a quantitative approach to the analysis of bibliometric factors, and the application of a qualitative approach to the analysis of recurrent keywords allowed for trends in the literature to be highlighted. This approach highlighted the growing viability of GISs in areas such as urban planning, ecological monitoring, and resource governance and underlined the importance of merging them with web frameworks and cloud services to improve accessibility and efficiency in geographic information management.
The evolutionary analysis of geographic information systems (GISs) based on web architecture between 2002 and 2023 highlighted a remarkable transformation in research topics. The transition from spatial data infrastructures and web services to more advanced technologies, such as spatial analysis, cloud computing, and artificial intelligence, was significant. Initially, the focus was on establishing a solid foundation for the interoperability of and access to geospatial data. From 2013, the focus shifted to metadata integration, remote sensing, and data visualization, marking an evolution towards more sophisticated techniques for geographic information management. Between 2020 and 2023, topics such as web mapping, remote sensing, spatial analysis, and biodiversity gained greater prominence, reflecting a shift in research priorities towards environmental conservation and natural resource management. Leading studies from this period demonstrated how artificial intelligence and mobile applications can significantly improve the prediction and management of natural hazards, providing more accurate and efficient tools for real-time decision making.
Despite these advances, there are significant challenges and gaps in the literature that must be addressed in future research. Data integration remains a crucial challenge, particularly for simplifying spatial decision making. It is essential to optimize the utility of WebGIS in web-based and cloud environments and to develop more accurate and efficient tools for real-time analyses. There are still priority areas related to WebGIS that align with global goals, such as the sustainable development goals (SDGs), including natural resource management, climate change and resilience, sustainable urbanization, food security, health and well-being, quality education, and infrastructure and innovation, in addition to other global agendas, such as the 2030 Agenda for Sustainable Development, the Paris Agreement on Climate Change, the Sendai Framework for Disaster Risk Reduction 2015–2030, the Convention on Biological Diversity (CBD), the objectives of the New Urban Agenda of UN-Habitat, the goals of the Intergovernmental Panel on Climate Change (IPCC), and the WHO’s Global Health Strategy 2020–2025. The application of WebGIS in these areas highlights its potential to significantly contribute to sustainable development by addressing global challenges through the efficient and collaborative management of geospatial information. The integration of WebGIS into these international frameworks and agendas can enhance their impact, improve geospatial information management, and facilitate informed decision making in a variety of fields that are critical to sustainable development and global resilience. Researchers should focus on maximizing the positive impact of WebGIS in these areas, ensuring that this tool continues to evolve to meet emerging universal challenges.
Future research could delve deeper into the fundamentals underlying the integration of web and cloud technologies into GISs. A thorough exploration of conceptual frameworks, theoretical models, and fundamental principles would allow for a better understanding of the interoperability, scalability, and security in these digital environments. In addition, exploration could address emerging obstacles, such as the use of artificial intelligence and machine learning in geospatial decision-making and control procedures. This sophisticated theoretical stance would contribute to the evolution and consolidation of the conceptual foundations of GISs based on web frameworks and cloud services. From a technical point of view, further exploration could focus on strategies that improve usability and user experience in web-based GIS applications or cloud services. Identifying and overcoming design constraints, as well as optimizing the interaction between the user and the system, are key objectives for increasing the effectiveness of these platforms. The integration of emerging technologies, such as artificial intelligence and machine learning, could be a fruitful area for strengthening the analytical and decision-making capabilities of GISs in digital environments. In addition, a continuous assessment of the security and privacy of geospatial data is indispensable to ensure integrity and trust in the use of GISs based on web frameworks and cloud services. While this study provides valuable insights into the current trends, it is imperative to recognize its limitations and promote further exploration that addresses additional issues, such as the exploration of additional databases and the consideration of periodic obsolescence in an ever-evolving field of research.

Author Contributions

Conceptualization, O.F.A. and J.V.-M.; methodology, J.V.-M. and M.C.-P.; software, J.V.-M., R.R.-A. and D.V.P.; formal analysis, J.V.-M. and M.C.-P.; literature review and investigation, J.V.-M. and R.R.-A.; data curation, J.V.-M., R.R.-A. and D.V.P.; writing—review and editing, J.V.-M., O.F.A. and M.C.-P.; visualization, J.V.-M. and M.C.-P.; supervision, R.R.-A., O.F.A. and M.C.-P.; project administration, J.V.-M. and O.F.A.; funding acquisition, J.V.-M. All authors have read and agreed to the published version of the manuscript.

Funding

This research was financed by the Universidad Estatal de Milagro, under the research project “MULTIVARIED GENERIC MODEL IN THE DESIGN OF A GEOWEB, FOR THE SUSTAINABLE DEVELOPMENT OF THE AREAS OF INFLUENCE OF THE STATE UNIVERSITY OF MILAGRO” resolution OCAS-SO-24-2020-No. 22 and the provisions of contract C20-SI-03.

Data Availability Statement

A collection of the data used in the research is available in the Zenodo repository entitled “Geographic Information Systems (GIS) based on WebGIS architecture. A bibliometric analysis of current status and research trends”, found at the following link: https://doi.org/10.5281/zenodo.10149927 (accessed on 17 November 2023).

Acknowledgments

The authors would like to thank the editorial team and reviewers who provided constructive and helpful comments to improve the quality of this article.

Conflicts of Interest

The authors declare no conflicts of interest.

References

  1. Dhurandhar, P.; Tamrakar, A.; Patra, J.P. Review on GIS-based online information system for rural development in Chhattisgarh. Int. J. Health Sci. 2022, 6, 8226–8231. [Google Scholar] [CrossRef]
  2. Agrawal, S.; Gupta, R.D. Web GIS and its architecture: A review. Arab. J. Geosci. 2017, 10, 518. [Google Scholar] [CrossRef]
  3. Li, L.; Zhu, D.; Ye, S.; Yao, X.; Li, J.; Zhang, N.; Han, Y.; Zhang, L. Design and implementation of geographic information systems, remote sensing, and global positioning system–based information platform for locust control. J. Appl. Remote Sens. 2014, 8, 084899. [Google Scholar] [CrossRef]
  4. Qin, R. Development of a GIS-based integrated framework for coastal seiches monitoring and forecasting: A North Jiangsu shoal case study. Comput. Geosci. 2017, 103, 70–79. [Google Scholar] [CrossRef]
  5. Rosatti, G.; Zorzi, N.; Zugliani, D.; Piffer, S.; Rizzi, A. A Web Service ecosystem for high-quality, cost-effective debris-flow hazard assessment. Environ. Model. Softw. 2018, 100, 33–47. [Google Scholar] [CrossRef]
  6. Jayawardhana, U.K.; Gorsevski, P.V. An ontology-based framework for extracting spatio-temporal influenza data using Twitter. Int. J. Digit. Earth 2019, 12, 2–24. [Google Scholar] [CrossRef]
  7. Auer, T.; MacEachren, A.M.; McCabe, C.; Pezanowski, S.; Stryker, M. HerbariaViz: A web-based client-server interface for mapping and exploring flora observation data. Ecol. Inform. 2011, 6, 93–110. [Google Scholar] [CrossRef]
  8. Gong, H.; Simwanda, M.; Murayama, Y. An Internet-Based GIS Platform Providing Data for Visualization and Spatial Analysis of Urbanization in Major Asian and African Cities. ISPRS Int. J. Geo-Inf. 2017, 6, 257. [Google Scholar] [CrossRef]
  9. He, H.; Zhu, W. Efficient, Customizable and Edge-Based WebGIS System. IEEE Access 2020, 8, 126164–126177. [Google Scholar] [CrossRef]
  10. Walter, S.H.G.; Muller, J.P.; Sidiropoulos, P.; Tao, Y.; Gwinner, K.; Putri, A.R.D.; Kim, J.R.; Steikert, R.; van Gasselt, S.; Michael, G.G.; et al. The Web-Based Interactive Mars Analysis and Research System for HRSC and the iMars Project. Earth Space Sci. 2018, 5, 308–323. [Google Scholar] [CrossRef]
  11. Agrawal, S.; Gupta, R.D. Development of SOA-based WebGIS framework for education sector. Arab. J. Geosci. 2020, 13, 563. [Google Scholar] [CrossRef]
  12. Yang, C.; Raskin, R.; Goodchild, M.; Gahegan, M. Geospatial Cyberinfrastructure: Past, present and future. Comput. Environ. Urban Syst. 2010, 34, 264–277. [Google Scholar] [CrossRef]
  13. Evangelidis, K.; Ntouros, K.; Makridis, S.; Papatheodorou, C. Geospatial services in the Cloud. Comput. Geosci. 2014, 63, 116–122. [Google Scholar] [CrossRef]
  14. Hu, K.; Gui, Z.; Cheng, X.; Wu, H.; McClure, S.C. The concept and technologies of quality of geographic information service: Improving user experience of giservices in a distributed computing environment. ISPRS Int. J. Geo-Inf. 2019, 8, 118. [Google Scholar] [CrossRef]
  15. Zhang, M.; Jiang, L.; Yue, P.; Gong, J. Interoperable web sharing of environmental models using OGC web processing service and Open Modeling Interface (OpenMI). Environ. Model. Softw. 2020, 133, 104838. [Google Scholar] [CrossRef]
  16. Kolb, J.P. Using web services to work with Geodata in R. R J. 2019, 11, 6–23. [Google Scholar] [CrossRef]
  17. Jing, C.; Zhu, Y.; Fu, J.; Dong, M. A lightweight collaborative GIS data editing approach to support urban planning. Sustainability 2019, 11, 4437. [Google Scholar] [CrossRef]
  18. Hou, Z.W.; Qin, C.Z.; Zhu, A.X.; Liang, P.; Wang, Y.J.; Zhu, Y.Q. From manual to intelligent: A review of input data preparation methods for geographic modeling. ISPRS Int. J. Geo-Inf. 2019, 8, 376. [Google Scholar] [CrossRef]
  19. Aturinde, A.; Rose, N.; Farnaghi, M.; Maiga, G.; Pilesjö, P.; Mansourian, A. Establishing spatially-enabled health registry systems using implicit spatial data pools: Case study-Uganda. BMC Med. Inform. Decis. Mak. 2019, 19, 215. [Google Scholar] [CrossRef] [PubMed]
  20. Mete, M.O.; Yomralioglu, T. Implementation of serverless cloud GIS platform for land valuation. Int. J. Digit. Earth 2021, 14, 836–850. [Google Scholar] [CrossRef]
  21. Locati, M.; Vallone, R.; Ghetta, M.; Dawson, N. QQuake, a QGIS Plugin for Loading Seismological Data from Web Services. Front. Earth Sci. 2021, 9, 614663. [Google Scholar] [CrossRef]
  22. Xing, H.; Chen, J.; Wu, H.; Hou, D. A web service-oriented geoprocessing system for supporting intelligent land cover change detection. ISPRS Int. J. Geo-Inf. 2019, 8, 50. [Google Scholar] [CrossRef]
  23. Iosifescu-Enescu, I.; Hugentobler, M.; Hurni, L. Web cartography with open standards—A solution to cartographic challenges of environmental management. Environ. Model. Softw. 2010, 25, 988–999. [Google Scholar] [CrossRef]
  24. Hamilton, M.C.; Nedza, J.A.; Doody, P.; Bates, M.E.; Bauer, N.L.; Voyadgis, D.E.; Fox-Lent, C. Web-based geospatial multiple criteria decision analysis using open software and standards. Int. J. Geogr. Inf. Sci. 2016, 30, 1667–1686. [Google Scholar] [CrossRef]
  25. Kulawiak, M.; Kulawiak, M.; Lubniewski, Z. Integration, processing and dissemination of LiDAR data in a 3D web-GIS. ISPRS Int. J. Geo-Inf. 2019, 8, 144. [Google Scholar] [CrossRef]
  26. Razavi-Termeh, S.V.; Sadeghi-Niaraki, A.; Choi, S.M. Ubiquitous GIS-based forest fire susceptibility mapping using artificial intelligence methods. Remote Sens. 2020, 12, 1689. [Google Scholar] [CrossRef]
  27. Shibuya, K. A Framework of Multi-Agent-Based Modeling, Simulation, and Computational Assistance in an Ubiquitous Environment. Simulation 2004, 80, 367–380. [Google Scholar] [CrossRef]
  28. Puttinaovarat, S.; Horkaew, P. Internetworking flood disaster mitigation system based on remote sensing and mobile GIS. Geomat. Nat. Hazards Risk 2020, 11, 1886–1911. [Google Scholar] [CrossRef]
  29. Bebortta, S.; Das, S.K.; Kandpal, M.; Barik, R.K.; Dubey, H. Geospatial serverless computing: Architectures, tools and future directions. ISPRS Int. J. Geo-Inf. 2020, 9, 311. [Google Scholar] [CrossRef]
  30. Can, R.; Kocaman, S.; Gokceoglu, C. A convolutional neural network architecture for auto-detection of landslide photographs to assess citizen science and volunteered geographic information data quality. ISPRS Int. J. Geo-Inf. 2019, 8, 300. [Google Scholar] [CrossRef]
  31. Belcore, E.; Angeli, S.; Colucci, E.; Musci, M.A.; Aicardi, I. Precision agriculture workflow, from data collection to data management using FOSS tools: An application in Northern Italy vineyard. ISPRS Int. J. Geo-Inf. 2021, 10, 236. [Google Scholar] [CrossRef]
  32. Loupian, E.; Burtsev, M.; Proshin, A.; Kashnitskii, A.; Balashov, I.; Bartalev, S.; Konstantinova, A.; Kobets, D.; Radchenko, M.; Tolpin, V.; et al. Usage experience and capabilities of the vega-science system. Remote Sens. 2022, 14, 77. [Google Scholar] [CrossRef]
  33. Balla, D.; Zichar, M.; Tóth, R.; Kiss, E.; Karancsi, G.; Mester, T. Geovisualization techniques of spatial environmental data using different visualization tools. Appl. Sci. 2020, 10, 6701. [Google Scholar] [CrossRef]
  34. Walker, J.D.; Letcher, B.H.; Rodgers, K.D.; Muhlfeld, C.C.; D’angelo, V.S. An interactive data visualization framework for exploring geospatial environmental datasets and model predictions. Water 2020, 12, 2928. [Google Scholar] [CrossRef]
  35. Kalpakis, V.; Kokkos, N.; Pisinaras, V.; Sylaios, G. An integrated coastal zone observatory at municipal level: The case of Kavala Municipality, NE Greece. J. Coast. Conserv. 2019, 23, 149–162. [Google Scholar] [CrossRef]
  36. Gordov, E.P.; Okladnikov, I.G.; Titov, A.G.; Voropay, N.N.; Ryazanova, A.A.; Lykosov, V.N. Development of Information-computational Infrastructure for Modern Climatology. Russ. Meteorol. Hydrol. 2018, 43, 722–728. [Google Scholar] [CrossRef]
  37. Nguyen, H.T.; Duong, T.Q.; Nguyen, L.D.; Vo, T.Q.N.; Tran, N.T.; Dang, P.D.N.; Nguyen, L.D.; Dang, C.K.; Nguyen, L.K. Development of a spatial decision support system for real-time flood early warning in the Vu Gia-Thu Bon river basin, Quang Nam Province, Vietnam. Sensors 2020, 20, 1667. [Google Scholar] [CrossRef] [PubMed]
  38. Kalinka, M.; Geipele, S.; Pudzis, E.; Lazdins, A.; Krutova, U.; Holms, J. Indicators for the smart development of villages and neighbourhoods in baltic sea coastal areas. Sustainability 2020, 12, 5293. [Google Scholar] [CrossRef]
  39. Capolupo, A.; Monterisi, C.; Saponieri, A.; Addona, F.; Damiani, L.; Archetti, R.; Tarantino, E. An interactive webgis framework for coastal erosion risk management. J. Mar. Sci. Eng. 2021, 9, 567. [Google Scholar] [CrossRef]
  40. Tamburis, O.; Giannino, F.; D’Arco, M.; Tocchi, A.; Esposito, C.; Di Fiore, G.; Piscopo, N.; Esposito, L. A night at the opera: A conceptual framework for an integrated distributed sensor network-based system to figure out safety protocols for animals under risk of fire †. Sensors 2020, 20, 2538. [Google Scholar] [CrossRef] [PubMed]
  41. Aye, Z.C.; Jaboyedoff, M.; Derron, M.H.; Van Westen, C.J.; Hussin, H.Y.; Ciurean, R.L.; Frigerio, S.; Pasuto, A. An interactive web-GIS tool for risk analysis: A case study in the Fella River basin, Italy. Nat. Hazards Earth Syst. Sci. 2016, 16, 85–101. [Google Scholar] [CrossRef]
  42. Poorazizi, M.E.; Steiniger, S.; Hunter, A.J.S. A service-oriented architecture to enable participatory planning: An e-planning platform. Int. J. Geogr. Inf. Sci. 2015, 29, 1081–1110. [Google Scholar] [CrossRef]
  43. Langella, G.; Basile, A.; Giannecchini, S.; Moccia, F.D.; Mileti, F.A.; Munafó, M.; Pinto, F.; Terribile, F. Soil Monitor: An internet platform to challenge soil sealing in Italy. Land Degrad. Dev. 2020, 31, 2883–2900. [Google Scholar] [CrossRef]
  44. Li, J.; Xia, H.; Qin, Y.; Fu, P.; Guo, X.; Li, R.; Zhao, X. Web GIS for Sustainable Education: Towards Natural Disaster Education for High School Students. Sustainability 2022, 14, 2694. [Google Scholar] [CrossRef]
  45. Zápotocký, M.; Koreň, M. Multipurpose GIS Portal for Forest Management, Research, and Education. ISPRS Int. J. Geo-Inf. 2022, 11, 405. [Google Scholar] [CrossRef]
  46. Sebastián-López, M.; González, R.d.M. Mobile learning for sustainable development and environmental teacher education. Sustainability 2020, 12, 757. [Google Scholar] [CrossRef]
  47. Mauro, N.; Ardissono, L.; Lucenteforte, M. Faceted search of heterogeneous geographic information for dynamic map projection. Inf. Process. Manag. 2020, 57, 102257. [Google Scholar] [CrossRef]
  48. La Guardia, M.; Koeva, M. Towards Digital Twinning on the Web: Heterogeneous 3D Data Fusion Based on Open-Source Structure. Remote Sens. 2023, 15, 721. [Google Scholar] [CrossRef]
  49. Jelokhani-Niaraki, M.; Sadeghi-Niaraki, A.; Choi, S.M. Semantic interoperability of GIS and MCDA tools for environmental assessment and decision making. Environ. Model. Softw. 2018, 100, 104–122. [Google Scholar] [CrossRef]
  50. Huang, M.; Fan, X.; Jian, H.; Zhang, H.; Guo, L.; Di, L. Bibliometric Analysis of OGC Specifications between 1994 and 2020 Based on Web of Science (WoS). ISPRS Int. J. Geo-Inf. 2022, 11, 251. [Google Scholar] [CrossRef]
  51. Obeidavi, Z.; Rangzan, K.; Kabolizade, M.; Mirzaei, R. A web-based GIS system for wildlife species: A case study from Khouzestan Province, Iran. Environ. Sci. Pollut. Res. 2019, 26, 16026–16039. [Google Scholar] [CrossRef] [PubMed]
  52. Saka, S.K.; Mathew, A.E.; Ganesh, V.; Raja, K.; Gopalakrishnan, G.; Iyyappan, M.; Dash, S.K.; Usha, T.; Ramanamurthy, M.V.; Sameeran, G.S.; et al. A web-gis and mobile-based application for a safe ocean for fishers. Mar. Technol. Soc. J. 2021, 55, 50–57. [Google Scholar] [CrossRef]
  53. Schmidt, F.; Dröge-Rothaar, A.; Rienow, A. Development of a Web GIS for small-scale detection and analysis of COVID-19 (SARS-CoV-2) cases based on volunteered geographic information for the city of Cologne, Germany, in July/August 2020. Int. J. Health Geogr. 2021, 20, 40. [Google Scholar] [CrossRef] [PubMed]
  54. Kamel Boulos, M.N.; Cai, Q.; Padget, J.A.; Rushton, G. Using software agents to preserve individual health data confidentiality in micro-scale geographical analyses. J. Biomed. Inform. 2006, 39, 160–170. [Google Scholar] [CrossRef]
  55. Marx, S.; Phalkey, R.; Aranda-Jan, C.B.; Profe, J.; Sauerborn, R.; Höfle, B. Geographic information analysis and web-based geoportals to explore malnutrition in Sub-Saharan Africa: A systematic review of approaches. BMC Public Health 2014, 14, 1189. [Google Scholar] [CrossRef] [PubMed]
  56. Luan, H.; Law, J. Web GIS-based public health surveillance systems: A systematic review. ISPRS Int. J. Geo-Inf. 2014, 3, 481–506. [Google Scholar] [CrossRef]
  57. Wang, H.; Pan, Y.; Luo, X. Integration of BIM and GIS in sustainable built environment: A review and bibliometric analysis. Autom. Constr. 2019, 103, 41–52. [Google Scholar] [CrossRef]
  58. Shkundalov, D.; Vilutienė, T. Bibliometric analysis of building information modeling, geographic information systems and web environment integration. Autom. Constr. 2021, 128, 103757. [Google Scholar] [CrossRef]
  59. Duarte, L.; Teodoro, A.C. GIS Open-Source Plugins Development: A 10-Year Bibliometric Analysis on Scientific Literature. Geomatics 2021, 1, 206–245. [Google Scholar] [CrossRef]
  60. Xu, Z.; Zhang, L.; Li, H.; Lin, Y.-H.; Yin, S. Combining IFC and 3D tiles to create 3D visualization for building information modeling. Autom. Constr. 2020, 109, 102995. [Google Scholar] [CrossRef]
  61. Tuama, É.Ó.; Hamre, T. Design and Implementation of a Distributed GIS Portal for Oil Spill and Harmful Algal Bloom Monitoring in the Marine Environment. Mar. Geod. 2007, 30, 145–168. [Google Scholar] [CrossRef]
  62. Russomanno, D.J.; Tritenko, Y. A Geographic Information System Framework for the Management of Sensor Deployments. Sensors 2010, 10, 4281–4295. [Google Scholar] [CrossRef] [PubMed]
  63. Possenti, L.; Savini, L.; Conte, A.; D’Alterio, N.; Danzetta, M.L.; Di Lorenzo, A.; Nardoia, M.; Migliaccio, P.; Tora, S.; Villa, P.D. A New Information System for the Management of Non-Epidemic Veterinary Emergencies. Animals 2020, 10, 983. [Google Scholar] [CrossRef] [PubMed]
  64. Gröger, G.; Plümer, L. CityGML—Interoperable semantic 3D city models. ISPRS J. Photogramm. Remote Sens. 2012, 71, 12–33. [Google Scholar] [CrossRef]
  65. Junquera, B.; Mitre, M. Value of bibliometric analysis for research policy: A case study of Spanish research into innovation and technology management. Scientometrics 2007, 71, 443–454. [Google Scholar] [CrossRef]
  66. El Akrami, N.; Hanine, M.; Flores, E.S.; Aray, D.G.; Ashraf, I. Unleashing the Potential of Blockchain and Machine Learning: Insights and Emerging Trends from Bibliometric Analysis. IEEE Access 2023, 11, 78879–78903. [Google Scholar] [CrossRef]
  67. Poleto, T.; Nepomuceno, T.C.C.; de Carvalho, V.D.H.; Friaes, L.C.B.d.O.; de Oliveira, R.C.P.; Figueiredo, C.J.J. Information Security Applications in Smart Cities: A Bibliometric Analysis of Emerging Research. Future Internet 2023, 15, 393. [Google Scholar] [CrossRef]
  68. Dewamuni, Z.; Shanmugam, B.; Azam, S.; Thennadil, S. Bibliometric Analysis of IoT Lightweight Cryptography. Information 2023, 14, 635. [Google Scholar] [CrossRef]
  69. Wang, J.; Chen, Y.; Huo, S.; Mai, L.; Jia, F. Research Hotspots and Trends of Social Robot Interaction Design: A Bibliometric Analysis. Sensors 2023, 23, 9369. [Google Scholar] [CrossRef]
  70. Espina-Romero, L.; Noroño Sánchez, J.G.; Rojas-Cangahuala, G.; Palacios Garay, J.; Parra, D.R.; Rio Corredoira, J. Digital Leadership in an Ever-Changing World: A Bibliometric Analysis of Trends and Challenges. Sustainability 2023, 15, 13129. [Google Scholar] [CrossRef]
  71. Suyanto, E.; Fuad, M.; Antrakusuma, B.; Suparman; Shidiq, A.S. Exploring the Research Trends of Technological Literacy Studies in Education: A Systematic Review Using Bibliometric Analysis. Int. J. Inf. Educ. Technol. 2023, 13, 914–924. [Google Scholar] [CrossRef]
  72. Vural Allaham, M. Bibliometric Analysis of Hr Analytics Literature. Elektron. Sos. Bilim. Derg. 2022, 21, 1147–1169. [Google Scholar] [CrossRef]
  73. Merigó, J.M.; Yang, J.B. A bibliometric analysis of operations research and management science. Omega 2017, 73, 37–48. [Google Scholar] [CrossRef]
  74. Abdullah, K.H.; Roslan, M.F.; Ishak, N.S. Unearthing Hidden Research Opportunities through Bibliometric Analysis: A Review. Asian J. Res. Educ. Soc. Sci. 2023, 5, 251–262. [Google Scholar] [CrossRef]
  75. Wu, M.; Long, R.; Bai, Y.; Chen, H. Knowledge mapping analysis of international research on environmental communication using bibliometrics. J. Environ. Manag. 2021, 298, 113475. [Google Scholar] [CrossRef] [PubMed]
  76. Aria, M.; Cuccurullo, C. bibliometrix: An R-tool for comprehensive science mapping analysis. J. Informetr. 2017, 11, 959–975. [Google Scholar] [CrossRef]
  77. Sardi, A. Aplikasi R Biblioshiny dalam Mengungkap Trend Riset Pembelajaran Berbasis ICT: Kajian Scientometrik. EduNaturalia J. Biol. Dan Kependidikan Biol. 2022, 3, 37. [Google Scholar] [CrossRef]
  78. Azhari, S.C.; Fadjarajani, S.; Firmansyah, M.F.; Yuniarti, T. A Scientometric Analysis of Academic Performance Development: R Biblioshiny. JISAE J. Indones. Stud. Assess. Eval. 2023, 9, 44–57. [Google Scholar] [CrossRef]
  79. Silva, M.d.S.T.; de Oliveira, V.M.; Correia, S.É.N. Scientific mapping in Scopus with Biblioshiny: A bibliometric analysis of organizational tensions. Context. Rev. Contemp. Econ. Gestão 2022, 20, 54–71. [Google Scholar] [CrossRef]
  80. Borner, K.; Chen, C.; Boyack, K.W. Visualizing Knowledge Domains. Annu. Rev. Inf. Sci. Technol. 2003, 37, 179–255. [Google Scholar] [CrossRef]
  81. Cobo, M.J.; López-Herrera, A.G.; Herrera-Viedma, E.; Herrera, F. Full-Text Citation Analysis: A New Method to Enhance. J. Am. Soc. Inf. Sci. Technol. 2011, 62, 1382–1402. [Google Scholar] [CrossRef]
  82. Gutiérrez-Salcedo, M.; Martínez, M.Á.; Moral-Munoz, J.A.; Herrera-Viedma, E.; Cobo, M.J. Some bibliometric procedures for analyzing and evaluating research fields. Appl. Intell. 2018, 48, 1275–1287. [Google Scholar] [CrossRef]
  83. Secinaro, S.; Brescia, V.; Calandra, D.; Biancone, P. Employing bibliometric analysis to identify suitable business models for electric cars. J. Clean. Prod. 2020, 264, 121503. [Google Scholar] [CrossRef]
  84. Zupic, I.; Čater, T. Bibliometric Methods in Management and Organization. Organ. Res. Methods 2015, 18, 429–472. [Google Scholar] [CrossRef]
  85. Massaro, M.; Dumay, J.; Guthrie, J. On the shoulders of giants: Undertaking a structured literature review in accounting. Account. Audit. Account. J. 2016, 29, 767–801. [Google Scholar] [CrossRef]
  86. Secinaro, S.; Calandra, D.; Secinaro, A.; Muthurangu, V.; Biancone, P. The role of artificial intelligence in healthcare: A structured literature review. BMC Med. Inform. Decis. Mak. 2021, 21, 125. [Google Scholar] [CrossRef] [PubMed]
  87. Pedraza-Navarro, I.; Sánchez-Serrano, S. Análisis de las publicaciones presentes en WoS y Scopus. Posibilidades de búsqueda para evitar literatura fugitiva en las revisiones sistemáticas. Rev. Interuniv. Investig. Tecnol. Educ. 2022, 13, 41–61. [Google Scholar] [CrossRef]
  88. Dumay, J.; Cai, L. A review and critique of content analysis as a methodology for inquiring into IC disclosure. J. Intellect. Cap. 2014, 15, 264–290. [Google Scholar] [CrossRef]
  89. Secundo, G.; Del Vecchio, P.; Mele, G. Social media for entrepreneurship: Myth or reality? A structured literature review and a future research agenda. Int. J. Entrep. Behav. Res. 2021, 27, 149–177. [Google Scholar] [CrossRef]
  90. Dumay, J.; Guthrie, J.; Puntillo, P. IC and public sector: A structured literature review. J. Intellect. Cap. 2015, 16, 267–284. [Google Scholar] [CrossRef]
  91. Waltman, L. A review of the literature on citation impact indicators. J. Informetr. 2016, 10, 365–391. [Google Scholar] [CrossRef]
  92. López-Illescas, C.; de Moya-Anegón, F.; Moed, H.F. Coverage and citation impact of oncological journals in the Web of Science and Scopus. J. Informetr. 2008, 2, 304–316. [Google Scholar] [CrossRef]
  93. Alvarez-Melgarejo, M.; Torres-Barreto, M.L. Resources and Capabilities from Their Very Outset: A Bibliometric Comparison between Scopus and the Web of Science. Rev. Eur. Stud. 2018, 10, 1. [Google Scholar] [CrossRef]
  94. Li, K.; Rollins, J.; Yan, E. Web of Science use in published research and review papers 1997–2017: A selective, dynamic, cross-domain, content-based analysis. Scientometrics 2018, 115, 1–20. [Google Scholar] [CrossRef]
  95. Tibaná-Herrera, G.; Fernández-Bajón, M.T.; De Moya-Anegón, F. Categorization of E-learning as an emerging discipline in the world publication system: A bibliometric study in SCOPUS. Int. J. Educ. Technol. High. Educ. 2018, 15, 21–23. [Google Scholar] [CrossRef]
  96. Guthrie, J.; Ricceri, F.; Dumay, J. Reflections and projections: A decade of Intellectual Capital Accounting Research. Br. Account. Rev. 2012, 44, 68–82. [Google Scholar] [CrossRef]
  97. Olawumi, T.O.; Chan, D.W.M. A scientometric review of global research on sustainability and sustainable development. J. Clean. Prod. 2018, 183, 231–250. [Google Scholar] [CrossRef]
  98. Kelly, J.; Sadeghieh, T.; Adeli, K. Peer review in scientific publications: Benefits, critiques, & a survival guide. eJIFCC 2014, 25, 227–243. [Google Scholar] [PubMed]
  99. Sicilia, M.A.; García-Barriocanal, E.; Sánchez-Alonso, S. Community Curation in Open Dataset Repositories: Insights from Zenodo. Procedia Comput. Sci. 2017, 106, 54–60. [Google Scholar] [CrossRef]
  100. Vinueza Martínez, J.; Correa-Peralta, M.; Ramirez-Anormaliza, R.; Franco Arias, O.; Vera Paredes, D. Geographic Information Systems (GIS) based on WebGIS architecture. A bibliometric analysis of the current status and research trends. Zenodo 2023. [Google Scholar] [CrossRef]
  101. Page, M.J.; McKenzie, J.E.; Bossuyt, P.; Boutron, I.; Hoffmann, T.C.; Mulrow, C.D.; Shamseer, L.; Tetzlaff, J.M.; Akl, E.; Brennan, S.E.; et al. The prisma 2020 statement: An updated guideline for reporting systematic reviews. Med. Flum. 2021, 57, 444–465. [Google Scholar] [CrossRef]
  102. Haddaway, N.R.; Page, M.J.; Pritchard, C.C.; McGuinness, L.A. PRISMA2020: An R package and Shiny app for producing PRISMA 2020-compliant flow diagrams, with interactivity for optimised digital transparency and Open Synthesis. Campbell Syst. Rev. 2022, 18, e1230. [Google Scholar] [CrossRef] [PubMed]
  103. de Oliveira, V.T.; Teixeira, D.; Rocchi, L.; Boggia, A. Geographic Information System Applied to Sustainability Assessments: Conceptual Structure and Research Trends. ISPRS Int. J. Geo-Inf. 2022, 11, 569. [Google Scholar] [CrossRef]
  104. Olyazadeh, R.; Sudmeier-Rieux, K.; Jaboyedoff, M.; Derron, M.-H.; Devkota, S. An offline-online Web-GIS Android application for fast data acquisition of landslide hazard and risk. Nat. Hazards Earth Syst. Sci. 2017, 17, 549–561. [Google Scholar] [CrossRef]
  105. Aye, Z.C.; Jaboyedoff, M.; Derron, M.-H.; Van Westen, C.J. Prototype of a Web-based Participative Decision Support Platform in Natural Hazards and Risk Management. ISPRS Int. J. Geo-Inf. 2015, 4, 1201–1224. [Google Scholar] [CrossRef]
  106. Aye, Z.C.; Sprague, T.; Cortes, V.J.; Prenger-Berninghoff, K.; Jaboyedoff, M.; Derron, M.-H. A collaborative (web-GIS) framework based on empirical data collected from three case studies in Europe for risk management of hydro-meteorological hazards. Int. J. Disaster Risk Reduct. 2016, 15, 10–23. [Google Scholar] [CrossRef]
  107. Veenendaal, B.; Brovelli, M.A.; Li, S. Review of Web Mapping: Eras, Trends and Directions. ISPRS Int. J. Geo-Inf. 2017, 6, 317. [Google Scholar] [CrossRef]
  108. Han, G.; Chen, J.; He, C.; Li, S.; Wu, H.; Liao, A.; Peng, S. A web-based system for supporting global land cover data production. ISPRS J. Photogramm. Remote Sens. 2015, 103, 66–80. [Google Scholar] [CrossRef]
  109. Yang, Y.; Sun, Y.; Li, S.; Zhang, S.; Wang, K.; Hou, H.; Xu, S. A GIS-Based Web Approach for Serving Land Price Information. ISPRS Int. J. Geo-Inf. 2015, 4, 2078–2093. [Google Scholar] [CrossRef]
  110. Liu, X.; Li, S.; Huang, W.; Gong, J. Designing sea ice web APIs for ice information services. Earth Sci. Inform. 2015, 8, 483–497. [Google Scholar] [CrossRef]
  111. Kulawiak, M.; Prospathopoulos, A.; Perivoliotis, L.; Łuba, M.; Kioroglou, S.; Stepnowski, A. Interactive visualization of marine pollution monitoring and forecasting data via a Web-based GIS. Comput. Geosci. 2010, 36, 1069–1080. [Google Scholar] [CrossRef]
  112. Kulawiak, M. Client-side versus server-side geographic data processing performance comparison: Data and code. Data Br. 2019, 26, 104507. [Google Scholar] [CrossRef] [PubMed]
  113. Aktas, M.; Aydin, G.; Donnellan, A.; Fox, G.; Granat, R.; Grant, L.; Lyzenga, G.; McLeod, D.; Pallickara, S.; Parker, J.; et al. iSERVO: Implementing the International Solid Earth Research Virtual Observatory by Integrating Computational Grid and Geographical Information Web Services. Pure Appl. Geophys. 2006, 163, 2281–2296. [Google Scholar] [CrossRef]
  114. Sayar, A. A distributed map animation framework for spatiotemporal datasets. Turk. J. Electr. Eng. Comput. Sci. 2016, 24, 683–694. [Google Scholar] [CrossRef]
  115. Pierce, M.E.; Fox, G.C.; Aktas, M.S.; Aydin, G.; Gadgil, H.; Qi, Z.; Sayar, A. The QuakeSim Project: Web Services for Managing Geophysical Data and Applications. Pure Appl. Geophys. 2008, 165, 635–651. [Google Scholar] [CrossRef]
  116. Fox, G.C.; Aktas, M.S.; Aydin, G.; Bulut, H.; Gadgil, H.; Oh, S.; Pallickara, S.; Pierce, M.E.; Sayar, A.; Zhai, G. Grids for Real Time Data Applications. In Parallel Processing and Applied Mathematics. PPAM 2005. Lecture Notes in Computer Science; Wyrzykowski, R., Dongarra, J., Meyer, N., Waśniewski, J., Eds.; Springer: Berlin/Heidelberg, Germany, 2006; Volume 3911, pp. 320–332. [Google Scholar] [CrossRef]
  117. Karnatak, H.C.; Shukla, R.; Sharma, V.K.; Murthy, Y.V.S.; Bhanumurthy, V. Spatial mashup technology and real time data integration in geo-web application using open source GIS—A case study for disaster management. Geocart. Int. 2012, 27, 499–514. [Google Scholar] [CrossRef]
  118. Karnatak, H.C.; Singh, H.; Garg, R.D. Online Spatial Data Analysis and Algorithm Development for Geo-scientific Applications Using Remote Sensing Data. Proc. Natl. Acad. Sci. India Sect. A Phys. Sci. 2017, 87, 701–712. [Google Scholar] [CrossRef]
  119. Karnatak, H.C.; Saran, S.; Bhatia, K.; Roy, P.S. Multicriteria Spatial Decision Analysis in Web GIS Environment. Geoinformatica 2007, 11, 407–429. [Google Scholar] [CrossRef]
  120. Akıncı, H.; Erdoğan, S. Designing a flood forecasting and inundation-mapping system integrated with spatial data infrastructures for Turkey. Nat. Hazards 2014, 71, 895–911. [Google Scholar] [CrossRef]
  121. Akıncı, H.; Sesli, F.A.; Doğan, S. Implementation of a web services-based SDI to control and manage private ownership rights on coastal areas. Ocean Coast. Manag. 2012, 67, 54–62. [Google Scholar] [CrossRef]
  122. Balla, D.; Zichar, M.; Kozics, A.; Mester, T.; Mikita, T.; Incze, J.; Novák, T.J. A GIS tool to express soil naturalness grades and geovisualization of results on Tokaj nagy-hill. Acta Polytech. Hung. 2019, 16, 191–205. [Google Scholar] [CrossRef]
  123. Hofer, B.; Papadakis, E.; Mäs, S. Coupling Knowledge with GIS Operations: The Benefits of Extended Operation Descriptions. ISPRS Int. J. Geo-Inf. 2017, 6, 40. [Google Scholar] [CrossRef]
  124. Hofer, B.; Mäs, S.; Brauner, J.; Bernard, L. Towards a knowledge base to support geoprocessing workflow development. Int. J. Geogr. 2017, 31, 694–716. [Google Scholar] [CrossRef]
  125. Kalabokidis, K.; Athanasis, N.; Gagliardi, F.; Kayayiannis, F.; Palaiologou, P.; Parastatidis, S.; Vasilakos, C. Virtual Fire: A web-based GIS platform for forest fire control. Ecol. Inform. 2013, 16, 62–69. [Google Scholar] [CrossRef]
  126. Kalabokidis, K.; Ager, A.; Finney, M.; Athanasis, N.; Palaiologou, P.; Vasilakos, C. AEGIS: A wildfire prevention and management information system. Nat. Hazards Earth Syst. Sci. 2016, 16, 643–661. [Google Scholar] [CrossRef]
  127. Kulawiak, M.; Dawidowicz, A.; Pacholczyk, M.E. Analysis of server-side and client-side Web-GIS data processing methods on the example of JTS and JSTS using open data from OSM and geoportal. Comput. Geosci. 2019, 129, 26–37. [Google Scholar] [CrossRef]
  128. Andrews, J.E. An author co-citation analysis of medical informatics. J. Med. Libr. Assoc. 2003, 91, 47–56. [Google Scholar]
  129. Raup, B.; Racoviteanu, A.; Khalsa, S.J.S.; Helm, C.; Armstrong, R.; Arnaud, Y. The GLIMS geospatial glacier database: A new tool for studying glacier change. Glob. Planet. Chang. 2007, 56, 101–110. [Google Scholar] [CrossRef]
  130. Simão, A.; Densham, P.J.; Haklay, M. Web-based GIS for collaborative planning and public participation: An application to the strategic planning of wind farm sites. J. Environ. Manag. 2009, 90, 2027–2040. [Google Scholar] [CrossRef] [PubMed]
  131. Niza, H.; Bento, M.; Lopes, L.F.; Cartaxana, A.; Correia, A.M. A picture is worth a thousand words: Using digital tools to visualise marine invertebrate diversity data along the coasts of Mozambique and Sao Tomé & Príncipe. Biodivers. Data J. 2021, 9, 1–20. [Google Scholar] [CrossRef]
  132. Qayum, A.; Ahmad, F.; Arya, R.; Singh, R.K. Predictive modeling of forest fire using geospatial tools and strategic allocation of resources: eForestFire. Stoch. Environ. Res. Risk Assess. 2020, 34, 2259–2275. [Google Scholar] [CrossRef]
  133. Ishida, T.; Li, H. Implementation and evaluation of a web-based regional culture inheritance support system. Int. J. Web Grid Serv. 2020, 16, 39–62. [Google Scholar] [CrossRef]
  134. Tengtrairat, N.; Woo, W.L.; Parathai, P.; Aryupong, C.; Jitsangiam, P.; Rinchumphu, D. Automated Landslide-Risk Prediction Using Web GIS and Machine Learning Models. Sensors 2021, 21, 4620. [Google Scholar] [CrossRef] [PubMed]
  135. Achuthan, K.; Hay, N.; Aliyari, M.; Ayele, Y.Z. A Digital Information Model Framework for UAS-Enabled Bridge Inspection. Energies 2021, 14, 6017. [Google Scholar] [CrossRef]
  136. Jiang, J.; Pang, T.; Zhang, F.; Men, Y.; Yadav, H.; Zheng, Y.; Chen, M.; Xu, H.; Zheng, T.; Wang, P. Pathway to encapsulate the surface water quality model and its applications as cloud computing services and integration with EDSS for managing urban water environments. Environ. Model. Softw. 2022, 148, 105280. [Google Scholar] [CrossRef]
  137. Sammartano, G.; Avena, M.; Fillia, E.; Spanò, A. Integrated HBIM-GIS Models for Multi-Scale Seismic Vulnerability Assessment of Historical Buildings. Remote Sens. 2023, 15, 833. [Google Scholar] [CrossRef]
  138. Sanchez-Aparicio, L.J.; Masciotta, M.-G.; García-Alvarez, J.; Ramos, L.F.; Oliveira, D.V.; Martín-Jiménez, J.A.; González-Aguilera, D.; Monteiro, P. Web-GIS approach to preventive conservation of heritage buildings. Autom. Constr. 2020, 118, 103304. [Google Scholar] [CrossRef]
  139. Masciotta, M.G.; Sanchez-Aparicio, L.J.; Oliveira, D.V.; Gonzalez-Aguilera, D. Integration of Laser Scanning Technologies and 360º Photography for the Digital Documentation and Management of Cultural Heritage Buildings. Int. J. Archit. Herit. 2023, 17, 56–75. [Google Scholar] [CrossRef]
  140. Atesoglu, A.; Ucar, Z.; Ozel, H.B. An Assessment of Land Use Cover Change and Vegetation Trend Analysis Using Web-Based Gis in Selected Regions (Syria and Iraq) of Euphrates-Tigris River Basin. Fresenius Environ. Bull. 2022, 31, 9772–9783. [Google Scholar]
  141. Szujó, G.; Biber, Z.; Gál, V.; Szabó, B. MaGISter-mine: A 2D and 3D web application in the service of mining industry. Int. J. Appl. Earth Obs. Geoinf. 2023, 116, 103167. [Google Scholar] [CrossRef]
  142. Foglini, F.; Grande, V. A Marine Spatial Data Infrastructure to manage multidisciplinary, inhomogeneous and fragmented geodata in a FAIR perspective … the Adriatic Sea experience. Oceanologia 2023, 65, 260–277. [Google Scholar] [CrossRef]
  143. Núñez-Andrés, M.A.; Zarzosa, N.L.; Martínez-Llario, J. Spatial data infrastructure (SDI) for inventory rockfalls with fragmentation information. Nat. Hazards 2022, 112, 2649–2672. [Google Scholar] [CrossRef]
  144. Duarte, L.; Teodoro, A.C.; Lobo, M.; Viana, J.; Pinheiro, V.; Freitas, A. An Open Source GIS Application for Spatial Assessment of Health Care Quality Indicators. ISPRS Int. J. Geo-Inf. 2021, 10, 264. [Google Scholar] [CrossRef]
  145. Karakol, D.U.; Comert, C. Architecture for semantic web service composition in spatial data infrastructures. Surv. Rev. 2022, 54, 1–16. [Google Scholar] [CrossRef]
  146. Myslenkov, S.; Samsonov, T.; Shurygina, A.; Kiseleva, S.; Arkhipkin, V. Wind Waves Web Atlas of the Russian Seas. Water 2023, 15, 2036. [Google Scholar] [CrossRef]
  147. Zhang, C.; Li, W.; Zhao, T. Geospatial data sharing based on geospatial semantic web technologies. J. Spat. Sci. 2007, 52, 35–49. [Google Scholar] [CrossRef]
  148. Souza, C.M., Jr.; Pereira, K.; Lins, V.; Haiashy, S.; Souza, D. Web-oriented GIS system for monitoring, conservation and law enforcement of the Brazilian Amazon. Earth Sci. Inform. 2009, 2, 205–215. [Google Scholar] [CrossRef]
  149. United Nations, Sustainable Development Goals (SDGs). 2024. Available online: https://sdgs.un.org/goals (accessed on 21 June 2024).
  150. United Nations. The 2030 Agenda for Sustainable Development. 2024. Available online: https://www.un.org/sustainabledevelopment/development-agenda/ (accessed on 21 June 2024).
  151. United Nations. Paris Agreement on Climate Change. 2024. Available online: https://unfccc.int/ (accessed on 21 June 2024).
  152. United Nations Office for Disaster Risk Reduction. Sendai Framework for Disaster Risk Reduction 2015–2030. 2015. Available online: https://www.undrr.org/publication/sendai-framework-disaster-risk-reduction-2015-2030 (accessed on 4 July 2024).
  153. United Nations Environment Programme. Convention on Biological Diversity. 2024. Available online: https://www.cbd.int/ (accessed on 21 June 2024).
  154. United Nations Habitat. UN-Habitat’s New Urban Agenda; United Nations: New York, NY, USA, 2022. [Google Scholar]
  155. United Nations. The Intergovernmental Panel on Climate Change. 2023. Available online: https://www.ipcc.ch/ (accessed on 21 June 2024).
  156. World Health Organization. Global Strategy on Digital Health 2020–2025; World Health Organization: Geneva, Switzerland, 2021. [Google Scholar]
  157. Pons, X.; Masó, J. A comprehensive open package format for preservation and distribution of geospatial data and metadata. Comput. Geosci. 2016, 97, 89–97. [Google Scholar] [CrossRef]
  158. Mahmud, S.; Iqbal, R.; Doctor, F. Cloud enabled data analytics and visualization framework for health-shocks prediction. Futur. Gener. Comput. Syst. 2016, 65, 169–181. [Google Scholar] [CrossRef]
  159. Fang, S.; Xu, L.D.; Zhu, Y.; Ahati, J.; Pei, H.; Yan, J.; Liu, Z. An Integrated System for Regional Environmental Monitoring and Management Based on Internet of Things. IEEE Trans. Ind. Inform. 2014, 10, 1596–1605. [Google Scholar] [CrossRef]
  160. Fast, V.; Rinner, C. A Systems Perspective on Volunteered Geographic Information. ISPRS Int. J. Geo-Inf. 2014, 3, 1278–1292. [Google Scholar] [CrossRef]
  161. Espinoza-Dávalos, G.E.; Arctur, D.K.; Teng, W.; Maidment, D.R.; García-Martí, I.; Comair, G. Studying soil moisture at a national level through statistical analysis of NASA NLDAS data. J. Hydroinform. 2016, 18, 277–287. [Google Scholar] [CrossRef]
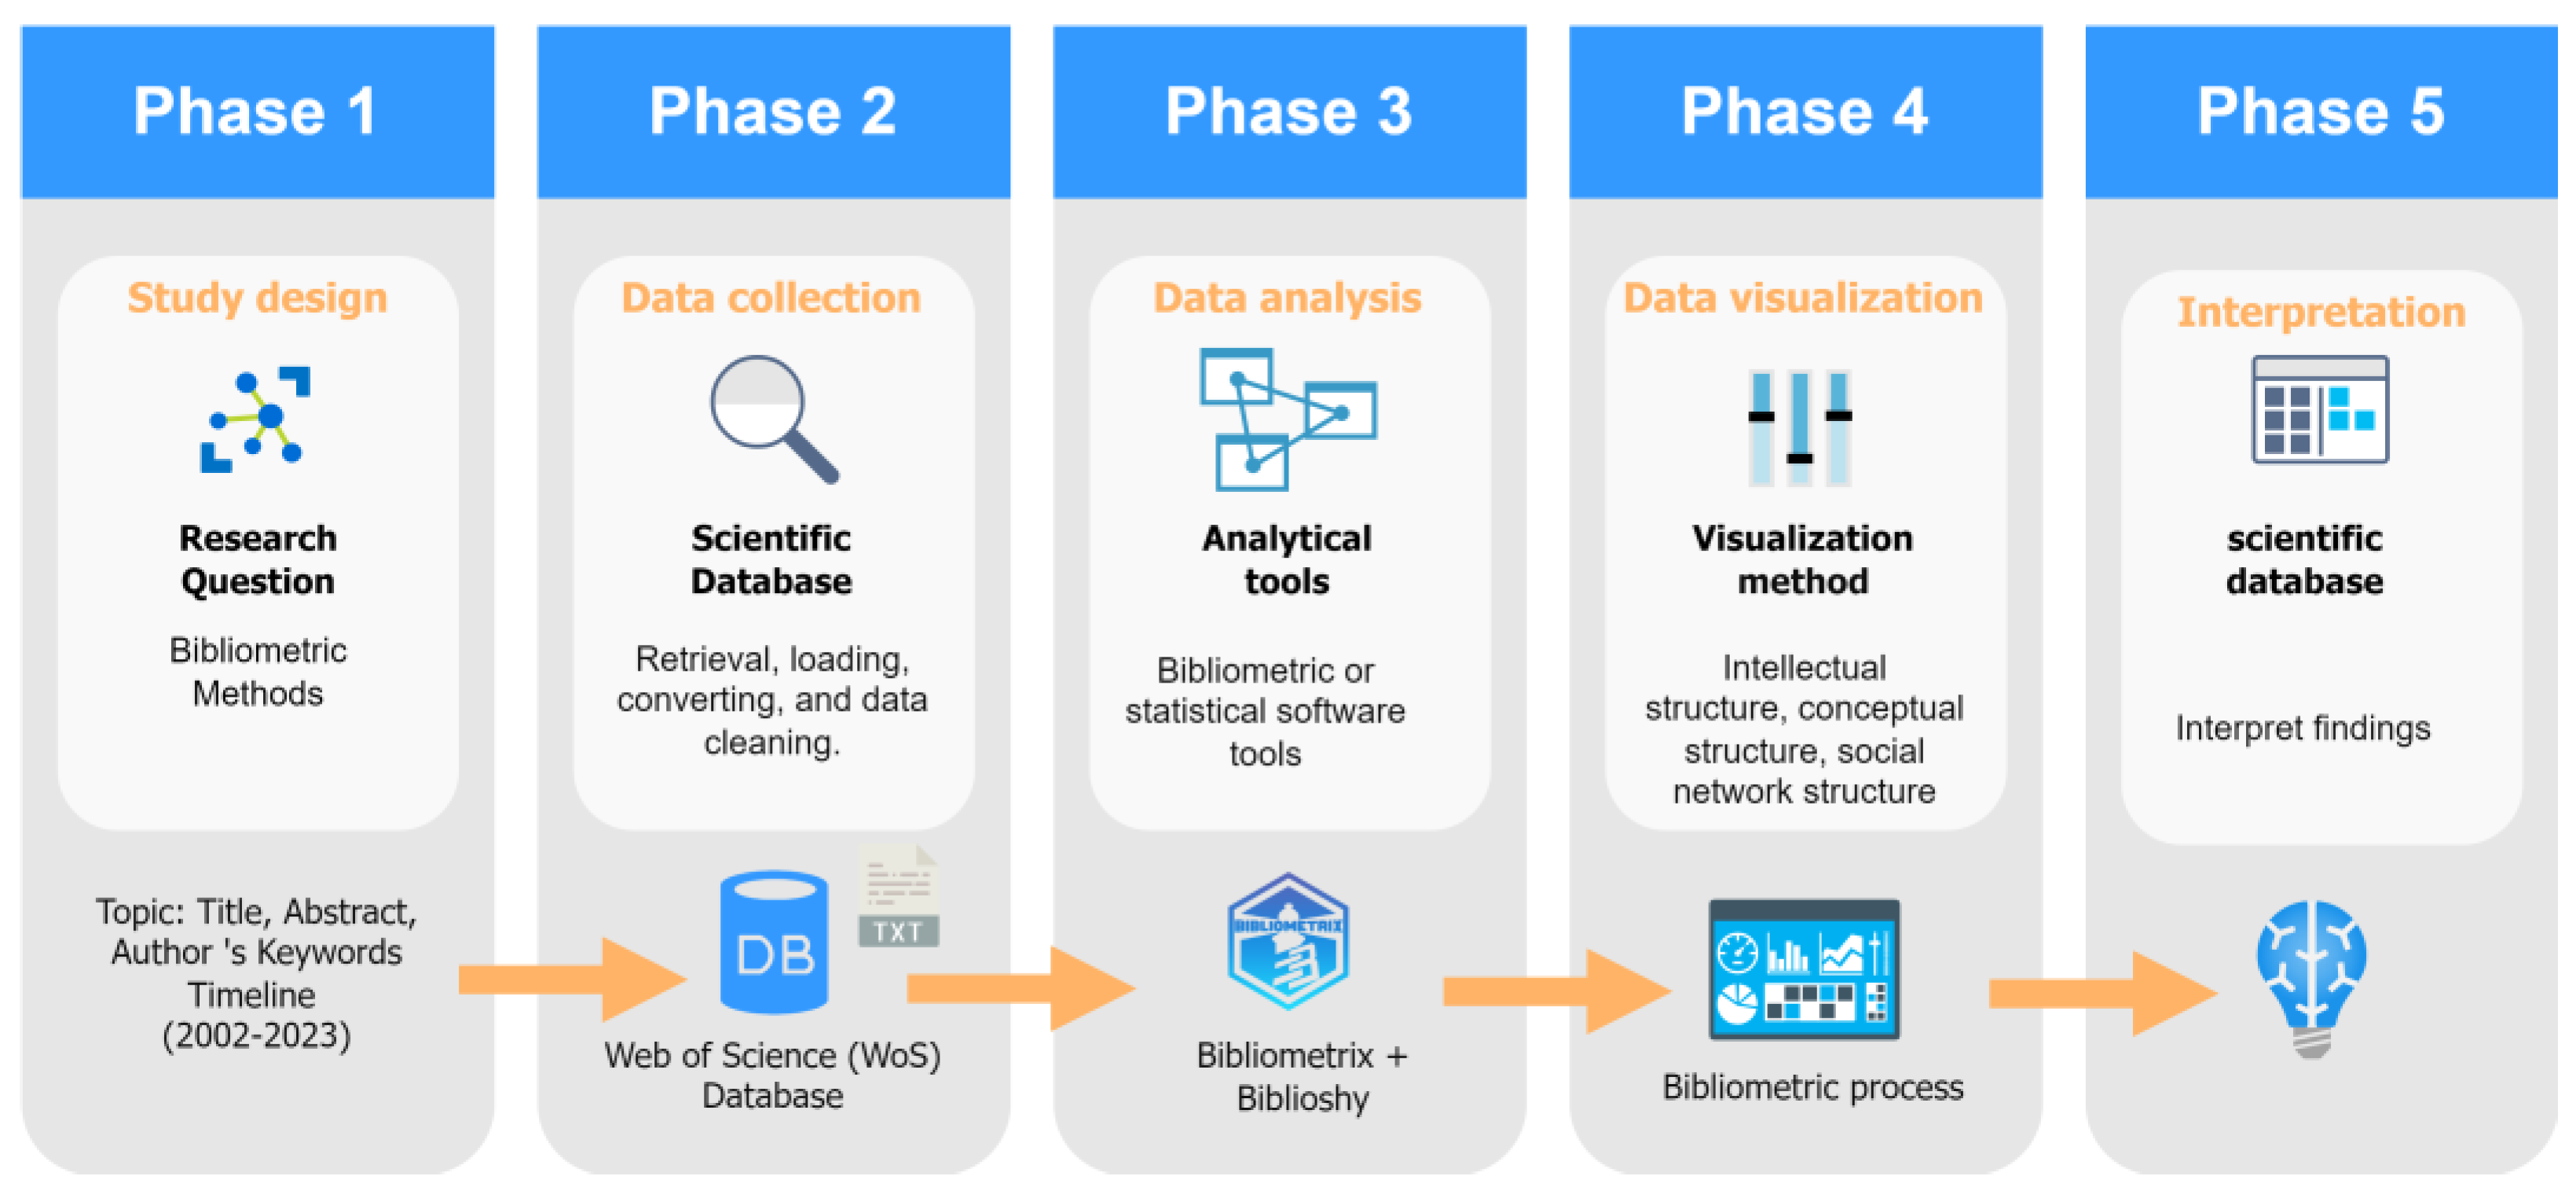
Figure 1. Methodological steps—adapted from [81].
Sustainability 16 06439 g001
Figure 2. PRISMA workflow. Source: elaborated by the authors in [99,100].
Sustainability 16 06439 g002
Figure 3. Annual scientific production. Source: authors’ elaboration using Bibliometrix and Biblioshiny R packages.
Sustainability 16 06439 g003
Figure 4. Source production over time. Source: authors’ elaboration using the Bibliometrix and Biblioshiny R packages.
Sustainability 16 06439 g004
Figure 5. Lotka’s law. Source: authors’ elaboration using the Bibliometrix and Biblioshiny R packages.
Sustainability 16 06439 g005
Figure 6. Word-tree map. Source: author’s elaboration with data from Web of Science (WoS) and Bibliometrix and Biblioshiny R packages.
Sustainability 16 06439 g006
Figure 7. Cluster dendrogram using multiple correspondence analysis of keywords. Source: authors’ elaboration using the Bibliometrix and Biblioshiny R packages.
Sustainability 16 06439 g007
Figure 8. WebGIS-based geographic information system word cloud. Source: authors’ elaboration using the Bibliometrix and Biblioshiny R packages.
Sustainability 16 06439 g008
Figure 9. Trend themes. Source: authors’ elaboration using Biblioshiny.
Sustainability 16 06439 g009
Figure 10. Country collaboration map. Source: authors’ elaboration using Biblioshiny.
Sustainability 16 06439 g010
Figure 11. Thematic evolution from 2002 to 2023. Source: Scopus WoS. Authors’ elaboration using the Bibliometrix and Biblioshiny R packages.
Sustainability 16 06439 g011
Figure 12. Thematic evolution in period of 2020–2023. Source: Scopus database. Authors’ elaboration using the R Bibliometrix and Biblioshiny R packages.
Sustainability 16 06439 g012
Table 1. Summary of the main reviews focusing on geographic information systems based on WebGIS architectures.
SourceYearReview PeriodDatabase, Type of DocumentsNumber of PapersResearch MethodTools UsedScope
[59]20142003–2013SCOPUS, Web of Science (WoS), and
PubMed: journal papers
563Systematic literature review (SRL), including retrospective analysis methods to analyze past data and trends and backward snowballing method to add more referencesNot providedUnderstand how geographic information analysis methods are used to investigate malnutrition in Sub-Saharan Africa (SSA). Understand geographic data, spatial levels, and geo-information methods. Understand how GIScience uses geo-information analysis methods such as spatial interpolation, aggregation, and downscaling techniques.
[58]20142000–2013Geobase, PubMed, and Web of Science: journal papers58Systemic review: bibliographic searchNot providedDevelopment of indicators to analyze public health surveillance systems (WGPhSS) based on a web GIS, such as those for infectious diseases, and identification of geographical and performance inequalities.
[50]20192018Web of Science (WoS): journal papers242Bibliometric document co-citation analysis (DCA); keyword frequency, term frequency, and inverse document frequency (TF-IDF); and subject-clustering analysisCiteSpace for joint citation analysis of bibliometric documentation (DCA)Current status, limitations, and future directions in the field of quality of geographic information services (QOGis) compared with traditional quality of services (QoS) in distributed computing environments, such as web, SOA, and cloud computing.
[60]20192008–2018Web of Science (WoS): journal papers and conference papers76Bibliometric analysis: time series analysis, journal analysis, co-authorship analysis, co-occurrence analysis of keywordsVOSViewer for co-authorship and co-occurrence keyword analysisIntegration of building information modeling (BIM) and geographic information systems (GISs) in sustainable built environments.
[61]20212010–2020Web of Science (WoS): journal papers502Bibliometric analysis: citation, bibliographic linkage, co-citation or co-authorship relationshipsVOSViewer for bibliometric analysisAnalysis of the impact of open-source GIS applications in different research areas in the last 10 years (2010–2020).
[62]20212010–2020Web of Science (WoS): journal papers111Bibliometric analysis, including publication analysis, journal analysis, co-occurring keyword analysis, co-authorship analysis, country analysis, institution analysis, and main groups of keywordsVOSViewer to perform a bibliometric analysisTo reveal research trends in building information modeling (BIM), GIS, and web integration and to discuss the challenges and potential opportunities of such integration in terms of the most common uses in construction.
[63]20221994–2020Web of Science (WoS): journal papers963Systematic review using quantitative bibliometric analysis with following indicators: number of publications (NP), total citation times (TC), year published (PY), the average number of citations per paper (CPP), author co-citation analysis (ACA), document co-citation analysis (DCA), co-word analysis (CA), and many other variationsDerwent (DDA) for literature analysis
VOSViewer for bibliometric analysis
Open Geospatial Consortium (OGC) specifications; FAIR (findable, accessible, interoperable, and reusable) principles in geospatial data.
Table 2. Research protocol.
Protocol ElementsAuthors’ Considerations
What is known? What are the research topics?Geographic information systems are studied based on existing knowledge, and they currently have various purposes and fields of application. Owing to its wide application, development, and growth, it is possible to conduct a bibliometric study in which the contributions and applications of geographic information systems based on WebGIS architectures are investigated.
LimitationsThe authors decided to search only the top scientific journals in the sciences, social sciences, arts, and humanities and to browse the entire citation network.
Restrictions by document typeThe researchers specifically opted for peer-reviewed articles and reviews, deliberately excluding conference proceedings, books, and chapters.
CategoriesFor all categories, the researchers decided not to impose research restrictions on a particular scientific publication because of its relatively increasing scope, which is similar to the scope of this review. Thus, this review covers a wide range of topics and categories.
Table 3. Boolean equation for the search.
ComponentKeywordsBoolean Equation
per Component
Final Boolean Equation
webGISwebGIS OR web-GIS OR “web-based GIS” OR “Web GIS” OR “web* mapping” OR Geoweb OR web services(webGIS OR web-GIS OR “web-based GIS” OR “Web GIS” OR “web* mapping” OR Geoweb OR “web services”)(webGIS OR web-GIS OR “web-based GIS” OR “Web GIS” OR “web* mapping” OR Geoweb OR web services) AND (“geographic* information syste*” OR “gis” OR “spatial data infrastructure”) AND (architecture OR technical OR cloud OR mobile OR software OR open source)
Geographic Information Systemgeographic* information syste*” OR “gis” OR “spatial data infrastructure(“geographic* information syste*” OR “gis” OR “spatial data infrastructure”)
Architecturearchitecture OR technical OR cloud OR mobile OR software OR open source(architecture OR technical OR cloud OR mobile OR software OR open source)
Table 4. Criteria for the filtering process.
CriteriaValueFinal
Documents
Topic
(title, abstract, author’s keywords)
TS = (webGIS OR web-GIS OR “web-based GIS” OR “Web GIS” OR “web* mapping” OR Geoweb OR “web services”) AND TS = (“geographic* information syste*” OR “gis” OR “spatial data infrastructure”) AND TS = (architecture OR technical OR cloud OR mobile OR software OR open source)1764
results
Web of Science indices SCI-EXPANDED, SSCI, A&HCI, CPCI-S only460
results
SourceScientific journals only396
results
CategoriesAll categories without imposing restrictions on research
Document typeArticles and review articles only391
results
Time space2002 to Sept. 2023
Table 5. Main information.
TypeDescriptionResults
Main Information About Data
PeriodYears of publication2002:2023
Sources Frequency distribution of sources as journals176
DocumentsTotal number of documents358
Annual growth rate %Average number of annual growth8.91
Document average ageAverage age of the document7.82
Average citations per docAverage total number of citations per document18.38
ReferencesTotal number of references or citations13,558
Document Contents
Keywords Plus (ID)Total number of phrases that frequently appear in the title of an article’s references653
Author’s Keywords (DE)Total number of keywords1383
Authors
AuthorsTotal number of authors1383
Authors of single-authored docsNumber of single authors per article14
Author Collaborations
Single-authored docsNumber of documents written by a single author14
Co-authors per docAverage number of co-authors in each document4.22
International co-authorships %Average number of international co-authorships27.93
Document Types
ArticleNumber of articles339
Article; early accessNumber of early access articles2
ReviewNumber of review articles17
Table 6. Top twenty sources.
Top 20 SourcesNo.
ISPRS International Journal of Geo-Information43
Environmental Modelling & Software20
Computers & Geosciences19
International Journal of Geographical Information Science12
International Journal of Digital Earth10
Sustainability10
Remote Sensing8
Natural Hazards and Earth System Sciences7
Computers and Electronics in Agriculture6
Ecological Informatics6
Sensors6
Water6
Earth Science Informatics4
GeoInformatica4
ISPRS Journal of Photogrammetry and Remote Sensing4
Natural Hazards4
Science of the Total Environment4
Annals of Geophysics3
Applied Sciences-Basel3
Arabian Journal of Geosciences3
Table 7. Number of articles by the 20 best authors.
Number of ArticlesAuthors
4(1) Derron, M.H.
(2) Jaboyedoff, M.
(3) Kulawiak, M.
(4) Li, S.
(5) Sayar A.
3(6) Agrawal, S.
(7) Aydin G.
(8) Aye, ZC.
(9) Brovelli, M.A.
(10) Castelli, F.
(11) Choi S.M.
(12) Gonzalez-Aguilera D.
(13) Gould M.
(14) Granell C.
(15) Grasso S.
(16) Gupta, R.D.
(17) Karnatak, H.C.
(18) Lentini, V.
(19) Li, Lin.
(20) Liu, X.
Table 8. Authors’ dominance factor.
AuthorsPapersSingle AuthorFirst AuthorDominance Factor (DF)Rank by DF
Aye, Z.C.3 31.001
Karnatak, H.C.3 31.001
Akinci, H.2 21.001
Balla, D.2 21.001
Hofer, B.2 21.001
Kalabokidis, K.2 21.001
Kulawiak, M.4 30.757
Agrawal, S.3 20.677
Brovelli, M.A.3 20.677
Castelli, F.3 20.677
Denzer, R.2 10.5011
Evangelidis, K.2 10.5011
Flanagan, D.C.2 10.5011
Fox, G.C.2 10.5011
Govedarica, M.2 10.5011
Gui, Z.P.2 10.5011
Masciotta, M.G.2 10.5011
Sayar, A.4110.3318
Granell, C.3 10.3318
Table 9. Number of articles of the 20 best authors according to h-index and g-index ranks.
Authorsh_Indexg_IndexMinedTotal CitationsTotal PapersYear Start
Kulawiak M.440.2869142010
Li S.450.44411152015
Aydin G.330.1673332006
Aye Z.C.330.3335532015
Brovelli M.A.330.33310032015
Castelli F.330.4292132017
Derron M.H.330.3335532015
Jaboyedoff M.330.3335532015
Lentini V.330.4292132017
Li J.340.2733942013
Li X.330.2148032010
Sayar A.340.1673442006
Sun Y.330.3334532015
Van.330.1884632008
Wu H.330.3337432015
Zhang L.330.34432014
Agrawal S.230.2862032017
Akinci H.220.167722012
Aktas M.S.220.1111722006
Table 10. Most frequent author keywords.
Author Keywords (Top 25)Occurrences
Gis51
Webgis34
Web services33
Web gis32
Web-gis27
Open source17
Remote sensing11
Web-based gis11
Decision-support system10
Web mapping10
Cloud computing9
Geographic information systems8
Metadata8
Sdi8
Spatial data infrastructure8
Geographic information system7
Spatial analysis7
Visualization7
Web7
Web service7
Grid computing6
Internet gis6
Volunteered geographic information5
Data sharing5
Geographic information system (gis)5
Table 11. Author and source citations.
Ranking No.Authors and Their Sources (Top 20)Total Citations (Number of Citations Received)Total
Citations per Year
Total
Citations Normalized
1Gröger G, 2012, ISPRS Journal of Photogrammetry and Remote Sensing34428.6677.354
2Fang S, 2014, 1596, IEEE Transactions on Industrial Informatics29029.0009.321
3Raup B, 2007, Global and Planetary Change27115.9415.212
4Simão A, 2009, Journal of Environmental Management16110.7333.667
5Granell C, 2010, Environmental Modelling & Software14710.5005.406
6Ames DP, 2012, Environmental Modelling & Software12110.0832.587
7Lhomme S, 2013, Natural Hazards and Earth System Sciences1029.2735.446
8Hagemeier-Klose M, 2009, Natural Hazards and Earth System Sciences956.3332.164
9Newman G, 2010, International Journal of Geographical Information Science896.3573.273
10Evangelidis K, 2014, Computers & Geosciences898.9002.861
11Grassi S, 2012, Energy Policy887.3331.881
12Tarjuelo JM, 2015, Agricultural Water Management819.0004.154
13Rao M, 2007, Environmental Modelling & Software774.5291.481
14El-Mekawy M, 2012, ISPRS International Journal of Geo-Information746.1671.582
15Flemons P, 2007, Ecological Informatics714.1761.365
16Hall GB, 2010, International Journal of Geographical Information Science694.9292.538
17Kulkarni AT, 2014, Computers & Geosciences676.7002.154
18Yue P, 2015, Environmental Modelling & Software667.3333.385
19Karnatak HC, 2007, Geoinformatica623.6471.192
20Martinis S, 2013, Remote Sensing575.1823.043
Table 12. Total number of articles published in each country.
CountryTotal Number of Articles
China229
Italy166
USA164
Germany93
India64
Spain62
United Kingdom46
Canada39
Greece38
Turkey35
Australia24
Table 13. The average number of citations in each country.
CountryTotal CitationsAverage Article Citations
USA141530.80 *
China88615.30
Germany75427.90
Italy54711.60
Spain44926.40
United Kingdom39027.90
Greece26323.90
Switzerland22928.60
India22511.80
Turkey16212.50
Australia13919.90
Canada13612.40
France12642.00 *
Poland8320.80
Netherlands7915.80
Iran7610.90
Sweden7437.00 *
New Zealand6969.00 *
* Countries showing high average article citation rates and cross-country collaboration.
Disclaimer/Publisher’s Note: The statements, opinions and data contained in all publications are solely those of the individual author(s) and contributor(s) and not of MDPI and/or the editor(s). MDPI and/or the editor(s) disclaim responsibility for any injury to people or property resulting from any ideas, methods, instructions or products referred to in the content.