Abstract
In the current context of global resource constraints and sustainable development, the efficient utilization of resources in the Yellow River basin, as one of China’s main economic regions, is particularly important. Based on the Super-SBM model with undesirable outputs, we analyze the spatial–temporal evolution of resource utilization efficiency in the Yellow River basin during 2000–2020 and investigate the impact of population aging on it using a fixed effects regression model and spatial Durbin model. The resource utilization efficiency has shown an overall upward trend in the Yellow River basin, which never realizes the DEA efficiency. There remains considerable room for efficiency improvement. There is an obvious spatial heterogeneity in resource utilization efficiency, presenting a spatial pattern of “leading downstream, intermediate midstream and lagging upstream”. Resource utilization efficiency has a high redundancy rate in terms of environmental pollution output, water resource input, science and education input in the Yellow River basin. Currently, excessive resource consumption and excessive pollutant emissions are the main causes of efficiency loss. Population aging not only promotes regional resource utilization efficiency but also has a significant positive spatial spillover effect in neighboring regions. Population aging’s impact shows heterogeneity, with a significant promoting impact on resource-based cities and other cities, while its promoting impact on provincial capital cities is not significant.
1. Introduction
For more than half a century, massive economic development has been made in China, the cost of which includes rapid depletion of resources and raw materials [1,2] such as energy, water, food, land, and minerals, as well as sharp deterioration of the ecological environment [3,4]. Similar issues have been observed in other rapidly developing countries, highlighting the global nature of resource utilization challenges [5,6]. Resources are the material basis for human society. At present, the crude development mode characterized by “high input, high consumption, low output” has not been completely reversed. The phenomenon of resource wastefulness still exists in production and life, resulting in high total resource consumption. This leads to chronically tight resource constraints faced by high-quality development, relatively high pressure on safety and security [7]. It is foreseeable that China’s existing demographic transition will likely result in a reduction in the potential economic growth rate [8,9]. For China to achieve a shift from resource-dependent economic growth to one driven by technological innovation, it must consider a demographic transition that has a key impact on the economy. Population aging has become the new symbol and trend in current global demographic transition [10,11]. Heterogeneities in regional demographic transition and economy determine the spatial differentiation of resource utilization efficiency. Meanwhile, China’s demographic structure has also changed significantly, which is consistent with the global demographic transition [10].
The Yellow River basin is a crucial economic and ecological governance zone in China where demographic transition is most obvious. In 2022, the permanent population reached 0.33 billion people in the Yellow River basin, with GDP reaching 24.43 trillion RMB, respectively accounting for 23.12% and 20.19% of China. The population aging rate has reached 14.98%, slightly above China’s average. The data are derived from the 2022 statistical bulletin on national socio-economic development of 90 cities. Exploring how population aging affects resource utilization efficiency in the Yellow River Basin could aid in achieving regional high-quality development. Meanwhile, it serves as a reference for comprehensively enhancing resource utilization efficiency in China and other big river basins.
An in-depth study on the inter-relationship between demographic transition and resource utilization will help achieve the sustainable development goal of improving regional resource utilization efficiency and further formulating relevant policies in conjunction with demographic transition to promote scientific resource allocation. Our study aims to quantitatively analyze the impact of population aging on resource utilization efficiency in the Yellow River basin. The research integrates two significant global issues, spanning multiple disciplines including demography economics, resource economics, and spatial economics, embodying the characteristics of interdisciplinary research and presenting important innovative significance. Following methodologies used to measure efficiency in other regions [12], we investigate resource utilization efficiency in the Yellow River basin by the Super-SBM model. Furthermore, we expose the gap between actual and optimal values of each input–output variable at the internal factor level by the efficiency loss model. Then, we explore the spatiotemporal differentiation characteristics and evolutionary process of resource utilization efficiency in the Yellow River basin, involving methods such as kernel density estimation, Markov chain transfer matrix, and spatial autocorrelation analysis. Finally, we explore the impact of population aging on resource utilization efficiency through benchmark regression models and spatial Durbin models. The rest of our paper is organized as follows: Section 2 sorts out the relevant literature. We describe our data and method in Section 3. In Section 4, we investigate resource utilization efficiency and its spatial–temporal evolution in the Yellow River basin. In Section 5, we empirically test and discuss how population aging impacts resource utilization efficiency. Finally, Section 6 describes our main findings and research prospects.
2. Literature Review
Demographic structure and resource utilization have long been two important areas of economics. We take “economic growth” as a bridge to sort out the literature from two aspects: demographic structure and economic growth, resource utilization and economic growth. According to the existing literature, the demographic structure indirectly affects economic growth mainly through demographic dividends, savings rates, and human capital [13,14]. Most research on resource utilization has focused on its relationship with economic growth [15]. However, are abundant resources a “blessing” [16,17] or a “curse” [18,19,20,21] for economic growth? The jury is still out. Empirical evidence shows that the relationship between the two differs in performance in various countries and at various periods [22].
To ensure a comprehensive review, we used several academic databases and search engines, including Google Scholar, Web of Science, and Scopus. The following keywords were used in various combinations: “demographic structure”, “resource utilization”, “economic growth”, “population aging”, “demographic transition”, and “resource efficiency”. The search was restricted to articles published during 2000–2024 to capture recent advancements and relevant studies in these fields. Recent global studies have shown that demographic transitions significantly impact resource utilization and economic growth [9,23]. At present, there is much research on demographic structure and economic growth, as well as on economic growth and resource utilization. However, few studies combine the two and directly examine the mechanism of demographic structure on resource utilization efficiency. After summarizing the relevant literature, we found the following: First, most of the results are relatively single in their selection of research objects for resource utilization, such as water resource [24], land resource [25], etc., without fully considering the comprehensiveness of resources. Thus, these conclusions obtained are relatively scattered and fragmented. Second, in terms of research content, the existing research either focuses on a single demographic element, such as population scale [26], population aging [27,28], gender imbalance [29], population quality [30], etc., or focuses on the holistic study of population–resource–environment–development (PRED) [31]. However, there are fewer studies that examine how population quality, scale, and structure impact resource utilization. Third, in the research methodology, the existing analyses on resource utilization efficiency measurement are mostly focused on result description and mechanism explanation based from management or economics perspectives [32,33] and seldom depict its temporal evolution rule and identify its spatial–temporal heterogeneity. Fourth, most studies fail to consider geographical factors’ impact on resource utilization [34] and ignore the objective spatial effects, resulting in biased model settings and a lack of universality in their conclusions.
Our research, with obvious intersectionality, involves many disciplines such as population economics, resource economics, and spatial economics, etc. In short, we investigate the spatial–temporal heterogeneities in resource utilization efficiency, and explore the direct and indirect impacts of population aging on it, which is conducive to understanding the interaction mechanism of PRED, exploring a new human–land relationship, and to promote the cross-integration of multiple disciplines, such as demography, economics, and resource science.
3. Data and Methodology
3.1. Study Area
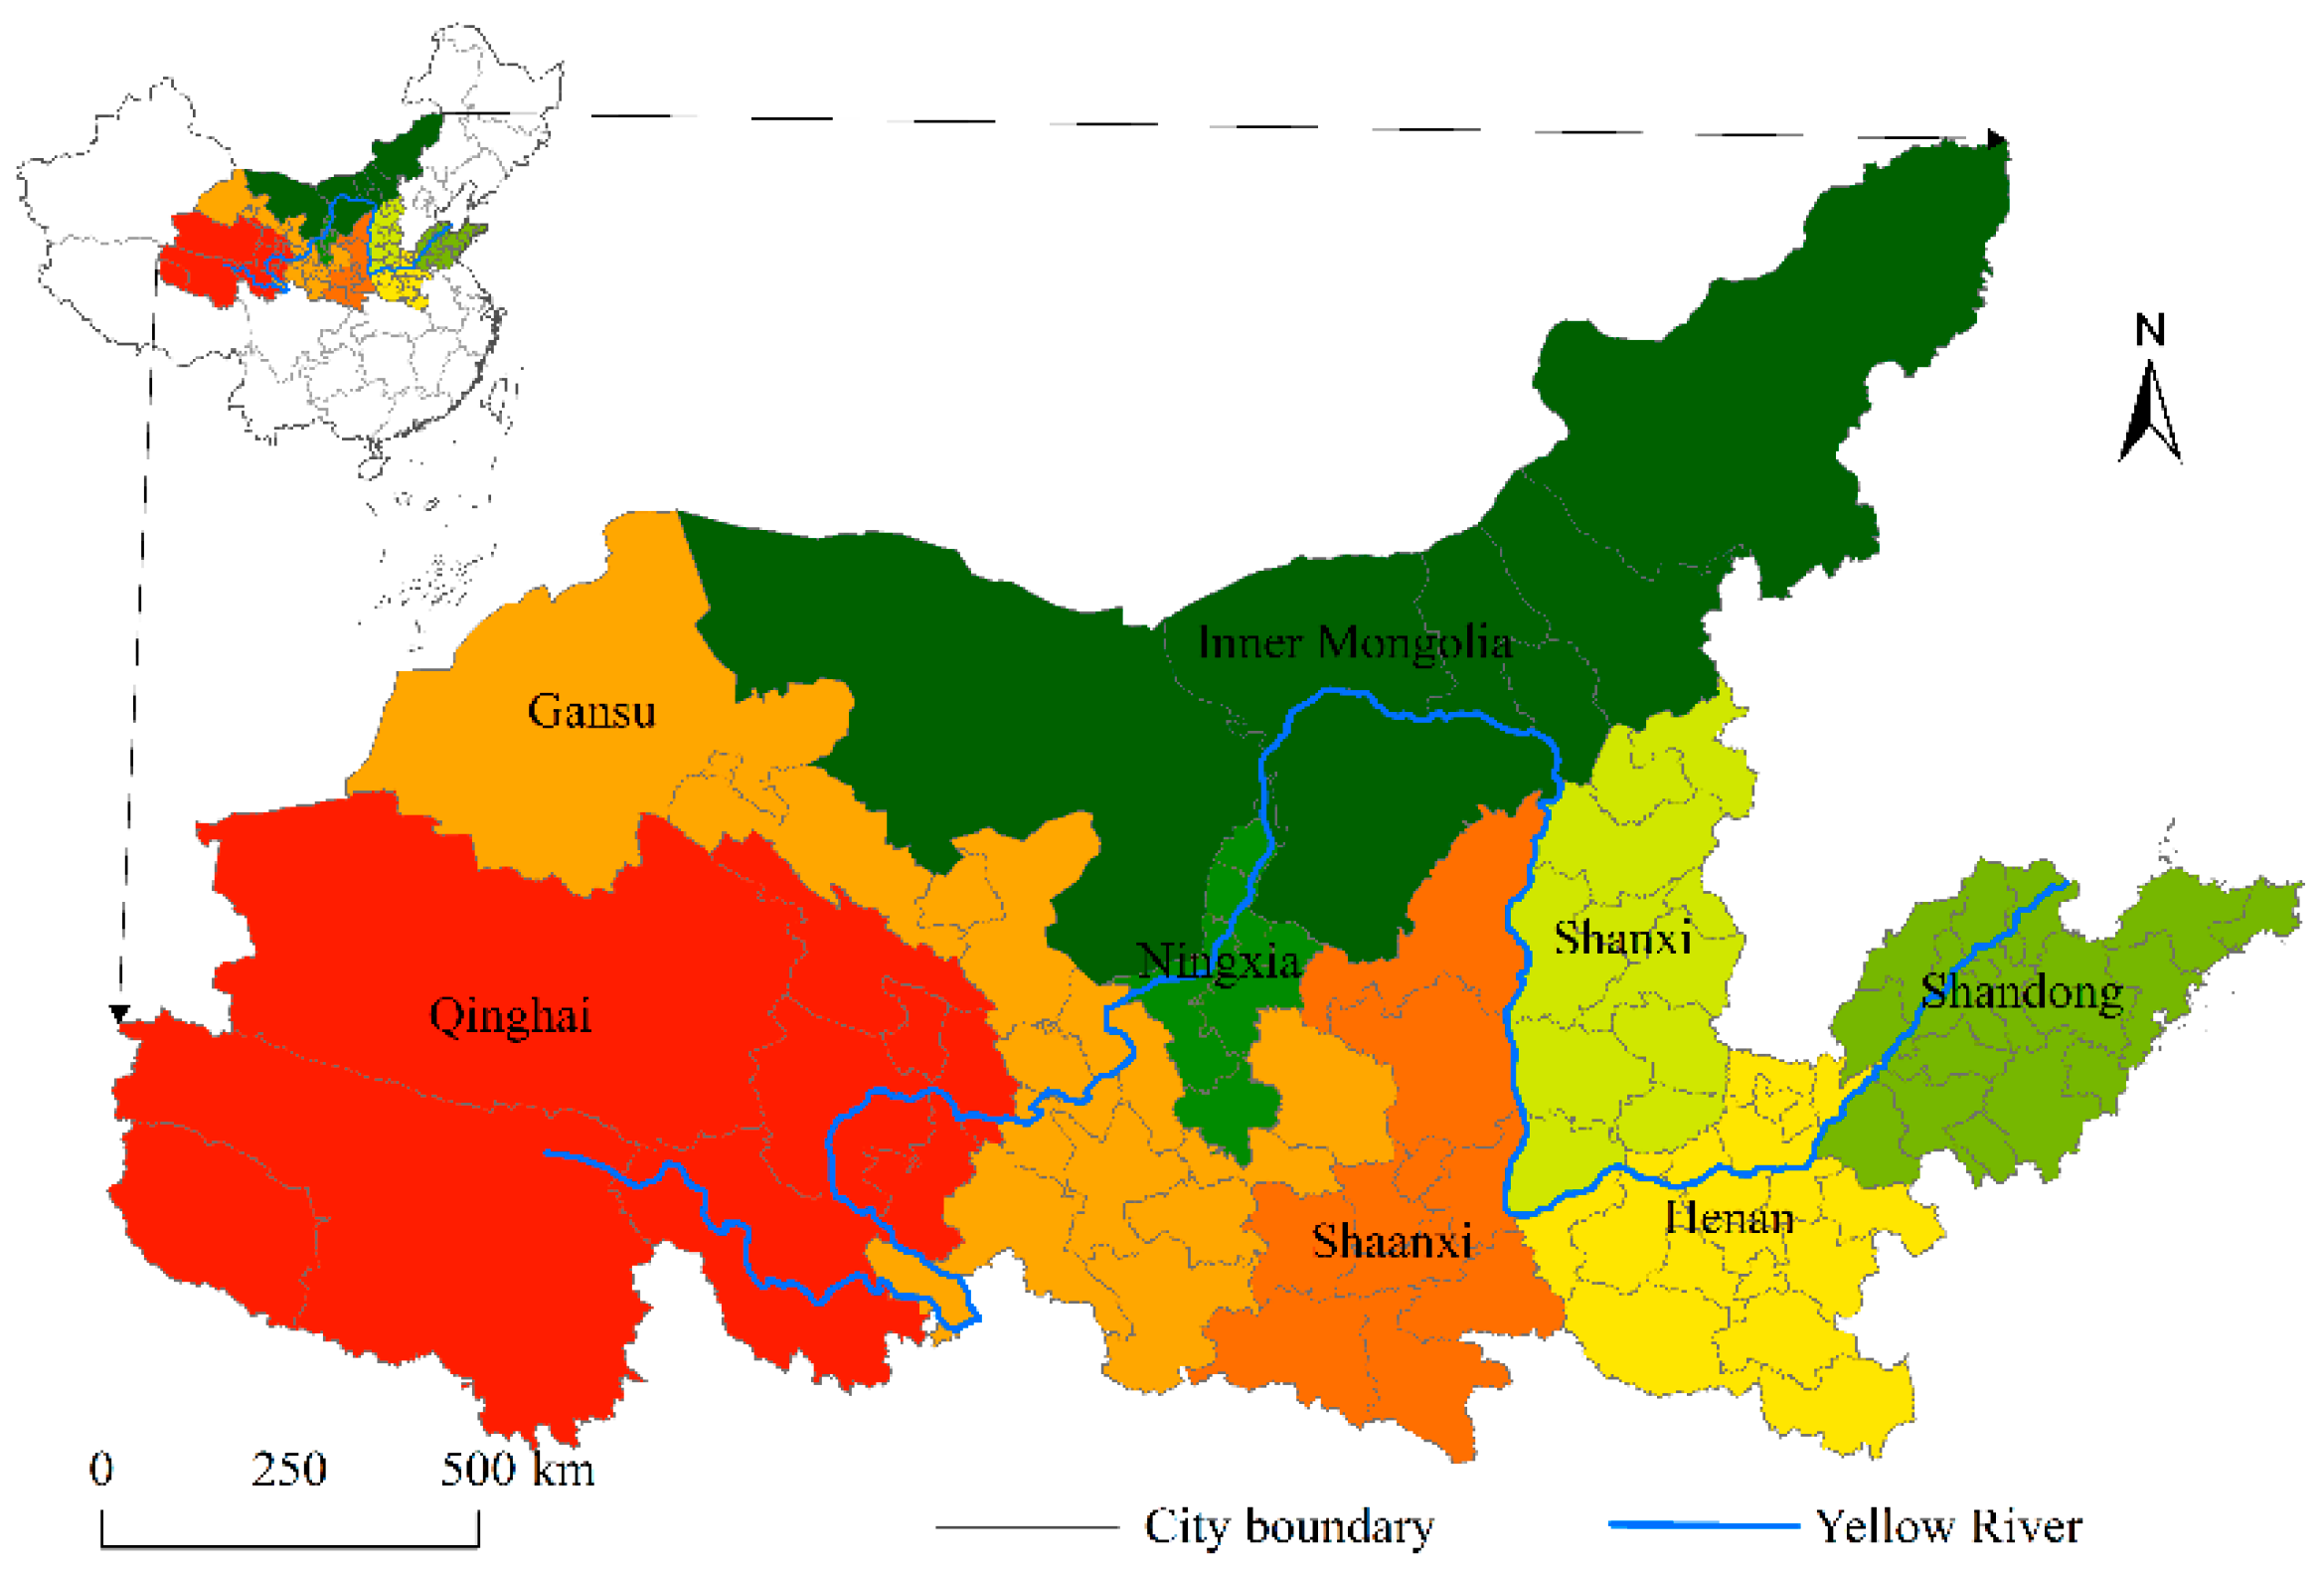
Taking the natural areas of the Yellow River basin as the basis, and considering the completeness and regional socio-economic correlation of each study unit (most existing studies have included Sichuan in the Yangtze River Economic Belt and the eastern four leagues of Inner Mongolia (Chifeng, Tongliao, Hinggan League, Hulunbuir) in the Northeast region), we define our study area as 90 regions (79 prefecture-level cities, 2 leagues, 8 autonomous prefectures, and 1 county-level city) in 8 provinces, as shown in Figure 1.

Figure 1.
The Yellow River basin.
3.2. Variables and Data Sources
3.2.1. Dependent Variable: Resource Utilization Efficiency (RU)
Resource utilization efficiency refers to the ability to maximize economic output through minimal input of natural and socio-economic resources while reducing environmental pollution in economic activities. The core principle lies in achieving the greatest possible economic benefits and ecological protection with the least amount of resource input, thereby promoting the coordinated development of economy, resources, and environment. Based on the resource utilization efficiency connotation, we construct an index system from the input–output perspective (Table 1), taking into account the coordinated development of the regional economy, resource conservation, and environmental protection, as well as the availability and comparability of sample data. And then, we measure the resource utilization efficiency in the Yellow River basin during 2000–2020 by the Super-SBM model. The input variables include natural resource variables and socio-economic variables. We select built-up land area, energy consumption, and water supply volume as the inputs of the natural resource variables, namely land, energy, and water resources. Meanwhile, we select total investment in fixed assets, total urban employment, and total expenditure on technology and education as the inputs for socio-economic variables, including capital, labor, and technology. And then, we select real GDP as the desired output. Finally, we combine industrial wastewater discharge, industrial sulfur dioxide emissions, and industrial soot emissions into an environmental pollution composite index by the entropy weight method, which are the non-desired output.

Table 1.
Variables and index selection.
3.2.2. Independent Variable: Population Aging Rate (PA)
We select a PA aged 65+ as the independent variable, and use a PA aged 60+ as the proxy variable for the robustness test.
3.2.3. Control Variables
To enhance the research accuracy, we select population urbanization rate, industrial structure, foreign capital intensity, technological innovation, and basic facilities as control variables (Table 1). Among them, population urbanization rate is represented by the proportion of urban population to permanent population. The industrial structure is gauged by the secondary industry’s value added to the GDP. The foreign capital intensity is represented by foreign direct investment. Technological innovation is represented by patents granted per 104 persons. The basic facility is represented by highway mileage per square kilometer.
3.2.4. Data
Considering the serious lack of relevant data in Linxia, Gannan, and other regions (Jiyuan, Linxia Prefecture, Gannan Prefecture, Haibei Prefecture, Xilingol League, Guoluo Prefecture, Alxa League, Haidong, Huangnan Prefecture, Hainan Prefecture, Yushu Prefecture, Haixi Prefecture), and in order to maintain the data statistical caliber consistency, we select 78 cities in the Yellow River basin during 2000–2020 as samples. Our research period is 1990–2020, mainly involving data on population and socio-economy. The data of permanent population, aging population, and urban population are from China’s Census V-VII. Based on the above data, we calculate the population aging rate aged 65+ and population urbanization rate in various cities. Urban built-up land area, urban water supply volume, total investment in fixed assets, technology expenditure, education expenditure, real GDP, industrial waste emissions, the proportion of value added by the secondary industry to the GDP, and foreign direct investment are from China Urban Statistical Yearbook (2001–2021). The missing data in individual cities in individual years are from provincial and municipal statistical yearbooks or local statistical bulletins of national socio-economic development. Total urban employment is calculated by summing the number of urban units, private, and individual employed persons from China Urban Statistical Yearbook (2001–2021). We calculate patents granted per 104 persons according to the number of patents granted in China Urban Statistical Yearbook (2001–2021) and the permanent population data in the Census V–VII. We calculate highway mileage per square kilometer according to highway mileage and urban administrative area in China Urban Statistical Yearbook (2001–2021). Due to the lack of total energy consumption data in prefecture-level cities and the statistical caliber changes for the alternative indicator commonly used since 2017, “urban electricity consumption”, we use urban nighttime light data as a weighting factor to allocate provincial energy consumption totals to their respective counties and cities, thereby obtaining the total energy consumption for each city.
3.3. Method
3.3.1. Benchmark Model and Spatial Econometric Model
We analyze the direct effects of population aging on resource utilization efficiency (RU) by a benchmark model. The formula is as follows:
where RU, PA, and con represent the resource utilization efficiency, population aging rate, and control variables, respectively; α0 represents the constant term, and α1 and α2 represent the variable regression coefficient; εit represents the random disturbance term; i and t represent the city and year, respectively.
Building on the previous analysis, we test and discuss the spatial effects of population aging on resource utilization efficiency by a spatial Durbin model. The formula is as follows:
where W represents the space weight matrix, ρ represents the spatial spillover coefficient, and β1 and β2 represent variables’ spatial lag term coefficient. The remaining variables hold identical meanings as in the benchmark model.
3.3.2. Super-SBM Model
Based on the traditional DEA and SBM models, the Super-SBM model introduced by Tone allows the inclusion of non-desired output indicators in the resource utilization efficiency evaluation index system [35] and considers the problem of input–output variables’ slack and further investigates for decision-making units with RU ≥ 1 [36]. The formula is as follows:
where x, yg, and zb are the input vector, desired output vector, and non-desired output vector, respectively. S−, Sg, and Sb are the input slack variable, desired output slack variable, and non-desired output slack variable, respectively. m, S1, and S2 are the vectors’ numbers. X, Yg, and Zb are the corresponding weight matrix. λ is the weight vector. ρ represents the decision-making unit (DMU). When S− = Sg = Sb = 0 and ρ = 1, the DMU is valid; when ρ < 1, the DMU is invalid, and there is potential for improvement in the input–output model. For the above linear programming model, the input redundancy and output insufficiency can be calculated based on the variable slack information to reveal the cause of efficiency loss and improvement direction. The formulae are as follows: input redundancy = S−/x, desired output insufficiency = Sg/yg, and undesired output redundancy = Sb/zb.
4. Resource Utilization Efficiency in the Yellow River Basin
4.1. Resource Utilization Efficiency Measurement
The average value of the resource utilization efficiency (RU) showed a steady upward trend in the Yellow River basin during 2000–2020, and the overall level remained relatively low. RU rose from 0.2099 in 2000 to 0.6221 in 2020 (Table 2), reaching the highest value. However, the whole has not yet realized DEA efficiency, and there remains considerable room for efficiency improvement. Over the past 20 years, RU showed an upward trend, while spatial heterogeneities were relatively obvious, with multi-year averages of 0.3124, 0.3876, and 0.5048, respectively, in its upstream, midstream, and downstream (Table 2). RU in its downstream was always ahead of that in its midstream and upstream. The average value of RU reached 0.7122 in its downstream by 2020, while in its midstream, it lagged behind that in the Yellow River basin. However, the average efficiency value reached 0.6974 in its midstream by 2020, which is higher than that in the Yellow River basin, and whose advantage was strengthened. RU was relatively low in the upstream and always lagged behind others.
Table 2.
RU’s changes.
RU in provincial capital cities increased rapidly, while it remained the lowest among different city types during 2000–2005. After 2005, RU in provincial capital cities exceeded that in other cities and resource-based cities in turn. Especially during 2015–2020, RU rose rapidly in provincial capital cities, while whose gap gradually widened with resource-based cities and other cities. The average RU increased from 0.1701 to 0.4392 in resource-based cities during 2000–2010, ahead of that in the Yellow River basin. Since then, the growth of RU slowed down in resource-based cities, while its RU level gradually lagged behind that in provincial capital cities and other cities. The variation trend in RU in other cities was similar to that in the Yellow River basin, whose multi-year average was similar.
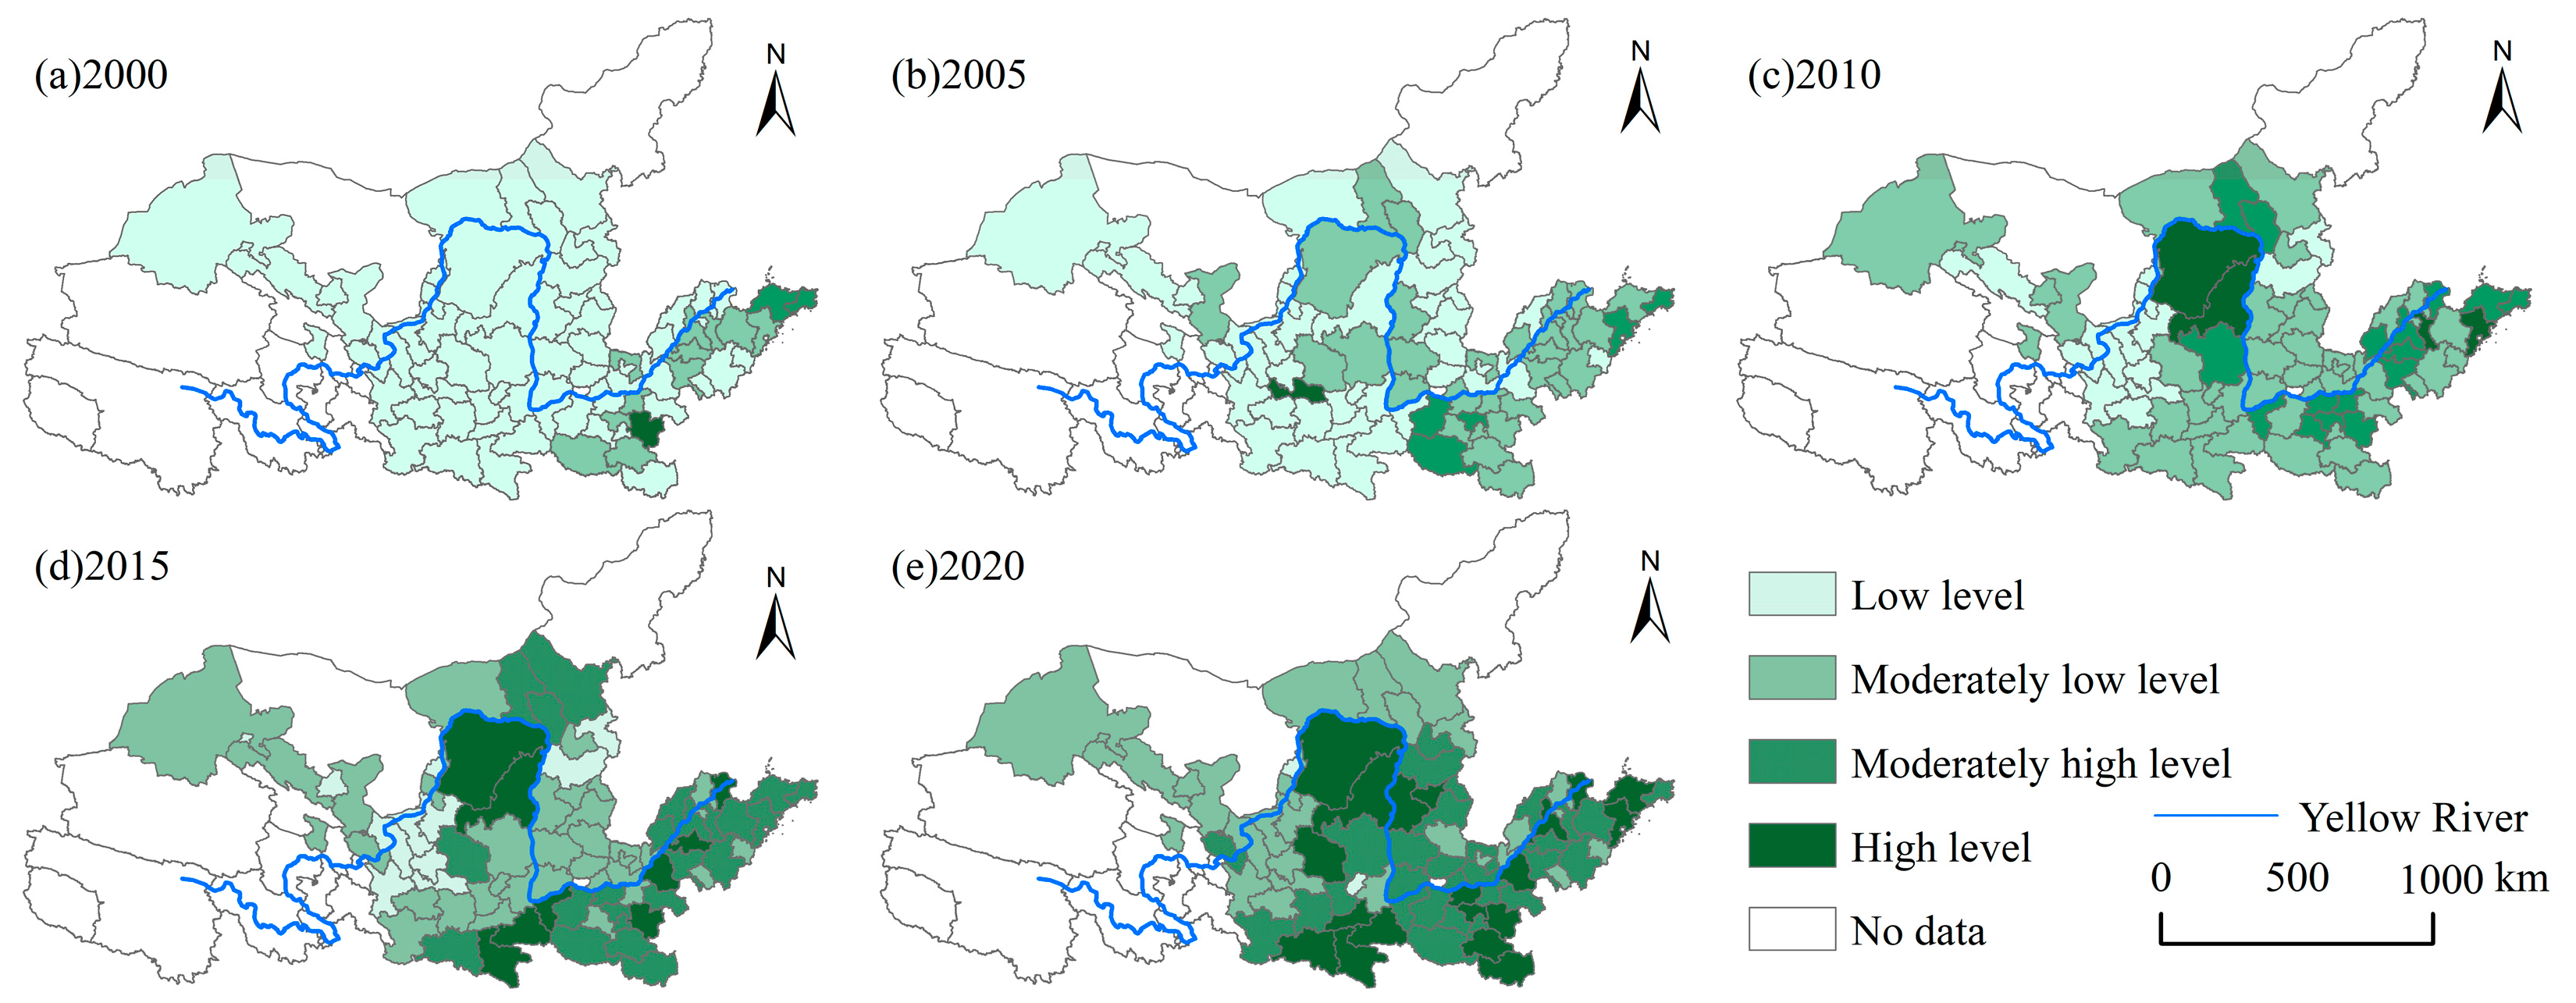
To visually reflect the spatial distribution of RU in the Yellow River basin, we adopt the natural breakpoint method, using thresholds of 0.2796, 0.4782, and 0.8201 to classify it into four levels, namely high level, moderately high level, moderately low level, and low level. Subsequently, we select five years (2000, 2005, 2010, 2015, and 2020) to conduct the visual analysis (Figure 2). RU showed an overall improvement trend in the Yellow River basin during 2000–2020, albeit with spatial heterogeneities. RU generally maintains the spatial pattern of “leading downstream, intermediate midstream and lagging upstream”. The overall level of RU was relatively low in the Yellow River basin in 2000, with predominance of cities at a low level. The high value areas were mainly concentrated in its downstream, with only that in Zhoukou (1.0761) achieving DEA efficiency (efficiency value ≥ 1). In 2005, RU was mainly at a moderately low level in its downstream. The RU’s types in its midstream and upstream were different from that in its downstream, with only a few cities near the Yellow River departing from the low level. RU had already moved away from the low level in all cities since 2010, except some cities in Gansu and Ningxia. The cities with the leading position in RU were relatively stable in 2015. RU was mainly at a moderately high level in its downstream and was mainly at a moderately high level in its midstream and upstream. RU significantly improved in the Yellow River basin in 2020. The spatial distribution of high level was relatively dispersed, and the cities scale achieving DEA efficiency increased to 19, with only Tongshan and Shizuishan not yet broken away from the low level.
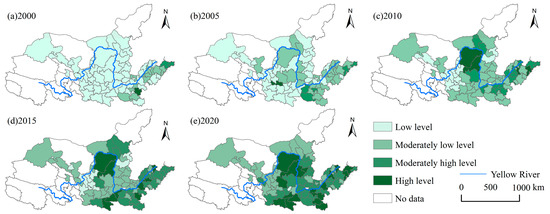
Figure 2.
Spatial distribution of RU.
4.2. Input Redundancy and Output Insufficiency Analysis
Input redundancy and undesired output redundancy were both higher than desired output insufficiency in the Yellow River basin during 2000–2020, while the main reasons leading to RU loss were concentrated in input and undesired output (Table 3). Overall, the main reasons for RU loss were the high redundancy of environmental pollution output (67.86%), water resource input (66.94%), science and education input (61.33%), land resource input (51.76%), labor input (49.79%), energy input (40.90%), and capital input (17.14%). The efficiency loss in economic output (0.62%) was relatively small. It indicates that economic output insufficiency is not the main cause of resource utilization inefficiency in the Yellow River basin, which is mainly due to excessive resource consumption and excessive pollutant emissions. From the time series, the redundancy of land resource (52.28%), water resource (53.55%), energy (29.89%), capital (24.48%), labor force (57.49%), science and education (35.97%), and input and environmental pollution output (39.11%) all showed a decreasing trend during 2000–2020. This indicates that certain progress results have been achieved in improving the resource input and reducing environmental pollution emissions in the Yellow River basin. The efficiency loss in economic output increased slightly during 2000–2020 but remained at a relatively low level.
Table 3.
Input redundancy and output insufficiency of RU.
The multi-year average redundancy rate of input–output variables in its upstream markedly surpassed that in its midstream areas, and both exceeded that in its downstream. The causes of RU loss in its upstream, midstream, and downstream were basically consistent with those in the Yellow River basin. Specifically, the redundancy rates of environmental pollution output and water resource input were relatively high across all regions, each exceeding 60.00%, indicating significant potential for regional improvement in energy conservation and emission reduction. Furthermore, the science and education input redundancy rate exceeded 80.00% in the upstream. The redundancy rates of input–output variables in resource-based cities were obviously higher than those in provincial capital cities and other cities. Among them, the environmental pollution output redundancy was the highest, with a multi-year average of 71.41%.
4.3. The Spatiotemporal Heterogeneity of RU
4.3.1. Temporal Evolution of RU
We delve into the temporal evolution trends and patterns of RU in the Yellow River basin via the kernel density estimation method (Figure 3). Overall, RU showed a dynamic evolution trend; it increased the overall level and inter-regional gap. The distribution gravity of the kernel density curves all moved to the right significantly in the Yellow River basin and its upstream, midstream, and downstream, signaling that RU improved continuously and at a faster rate. The main peak height decreased and the wave peak widened in the Yellow River basin and its midstream and downstream, while the main peak height decreased and then increased, with the wave peak widening and then narrowing in its upstream. The inter-regional gap of RU widened first and then narrowed in the upstream, while the gap continuously widened in other regions. The curve exhibited a transformation from a single peak to double peak or even multiple peaks. RU became polarized or multipolar during 2000–2020, and the polarization phenomenon varied by years. The kernel density curves all had obvious right-trailing characteristics, which revealed that RU varied greatly, with individual cities far exceeding others.
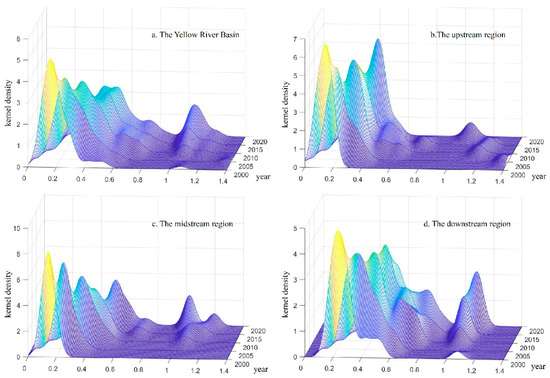
Figure 3.
Kernel density curves for RU.
We further reveal the transfer laws and characteristics of RU in the Yellow River basin by the Markov chain transfer matrix (Table 4). The Markov matrix transfer probability on the diagonal was greater than that on the non-diagonal during 2000–2020, with the transition probability average value on the diagonal being 52.90%. This indicated that RU had a higher probability of remaining in its initial state. RU’s type transfer was concentrated on both sides of the diagonal, and the element values on both sides of the non-diagonal were all below 10%. This indicated that the continuous RU type transfer was usually a step-by-step transfer. The possibility of cross-level transfer was small, reflecting that RU improvement was a continuous and gradual process. Element values above the diagonal were generally larger than those below the diagonal. This indicated that the probability of the city’s RU’s type moving up is greater than the probability of it moving down.
Table 4.
Markov chain transfer matrix of RU.
4.3.2. Spatial Correlation Analysis of RU
To reveal the inter-relationship and spatial clustering degree of RU in the Yellow River basin, we test the Global Moran’s I of RU using the inverse distance square space weight matrix (Table 5). During 2000–2020, Global Moran’s I was all positive and p < 0.05, demonstrating a positive spatial clustering effect on the RU index within the Yellow River basin. Global Moran’s I generally displayed a declining trend, showing that the spatial clustering degree of RU index weakened to a certain degree.
Table 5.
Global Moran’s I of RU.
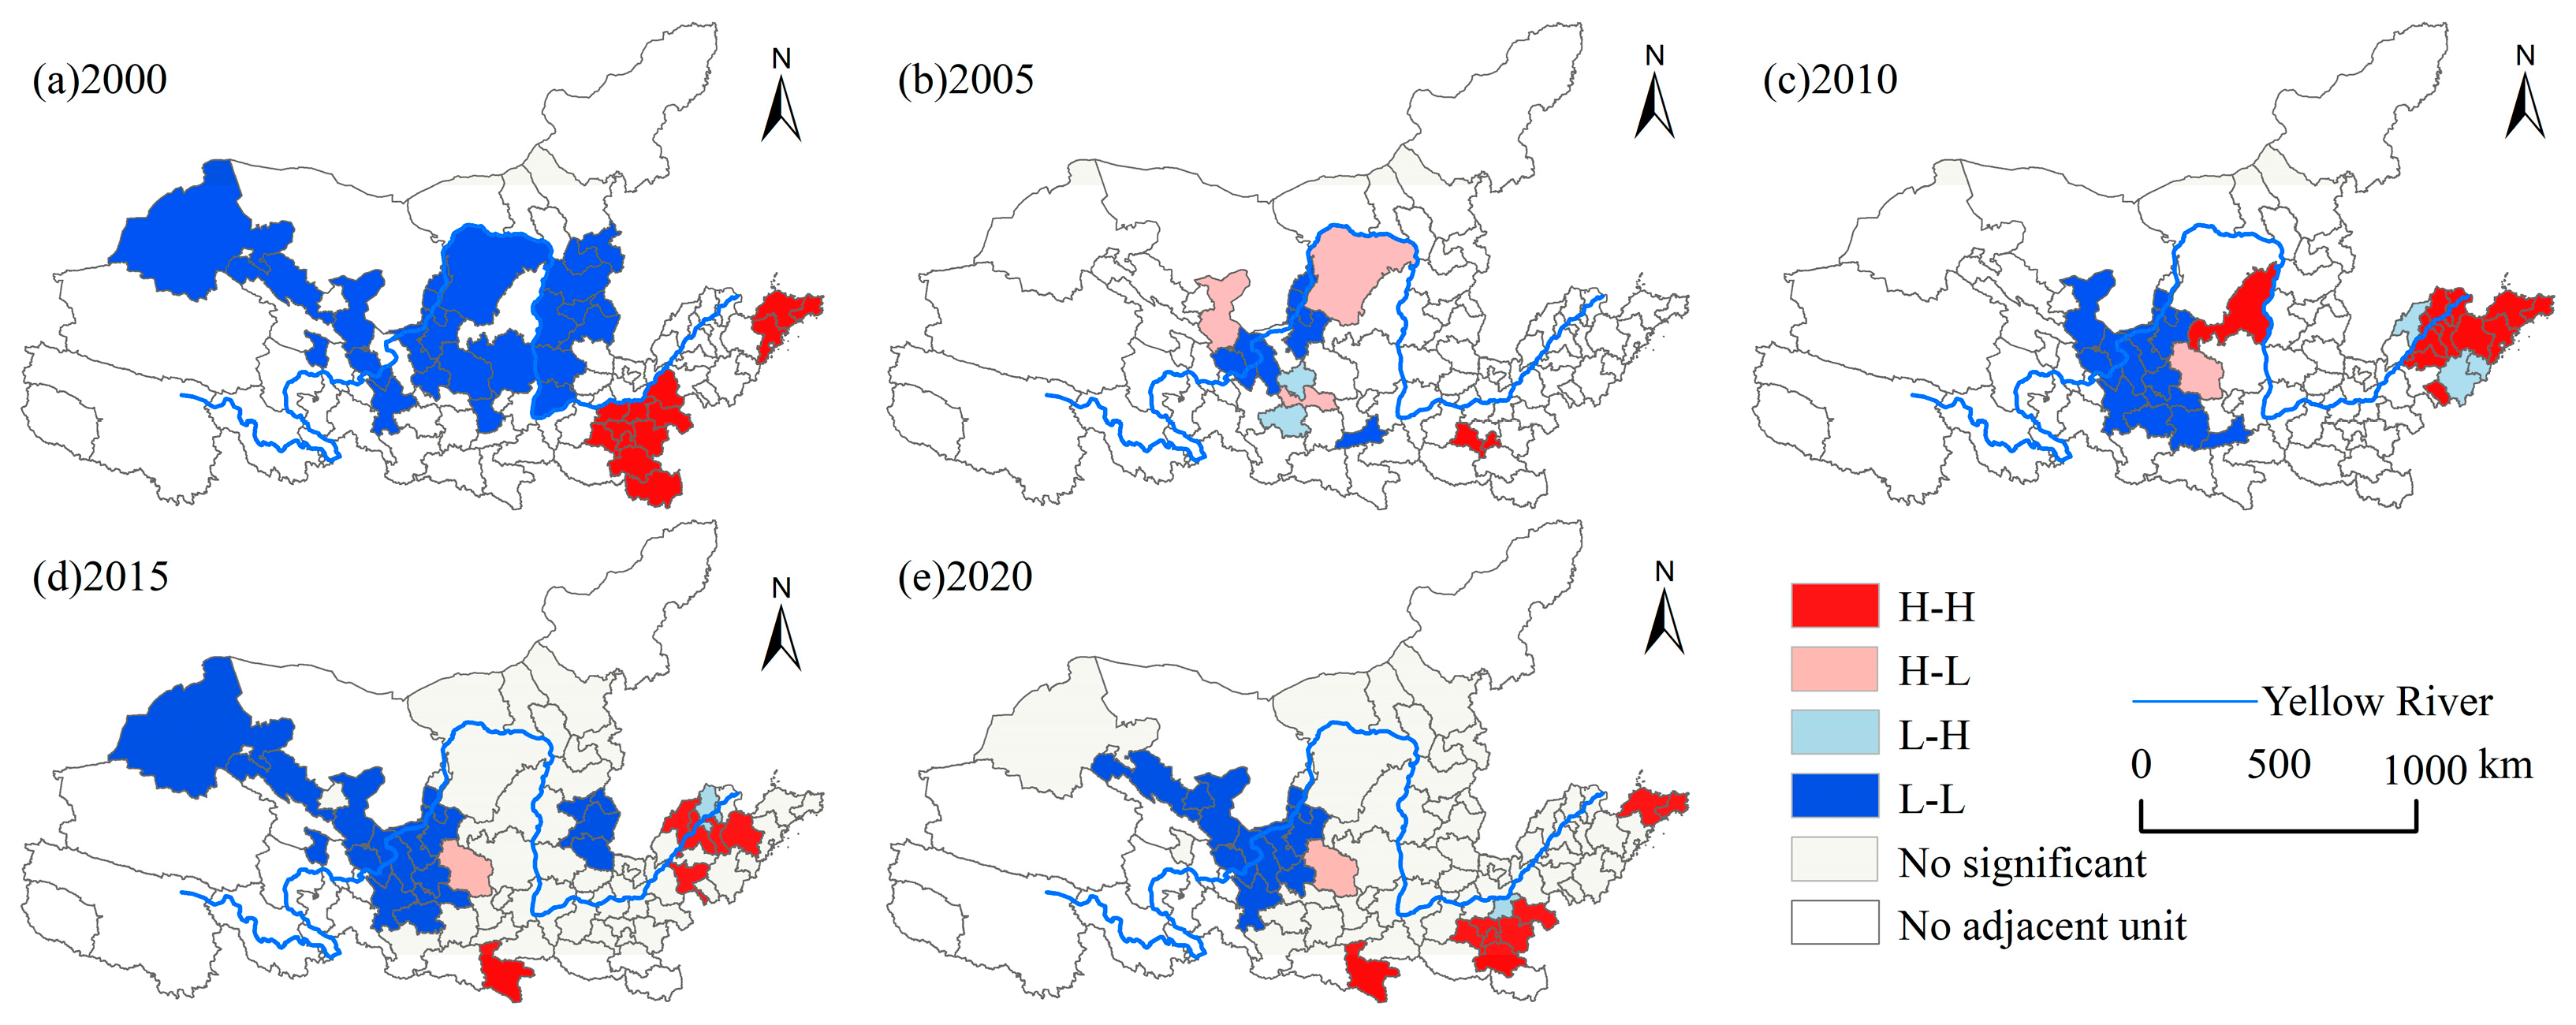
We explore the local spatial autocorrelation features of RU in the Yellow River basin by Local Moran’s I (Figure 4). During 2000–2020, there were relatively more cities with high–high cluster and low–low cluster, showing a concentrated and contiguous distribution. The high–high clusters were mainly located in its downstream, and RU between cluster cities and neighboring cities was relatively high, and the difference is small. The low–low clusters were predominantly located in its midstream and upstream and gradually shifted to its upstream, and the cluster cities were concentrated areas with low RU. There were relatively few cities with high–low cluster and low–high cluster, showing a divergent distribution.
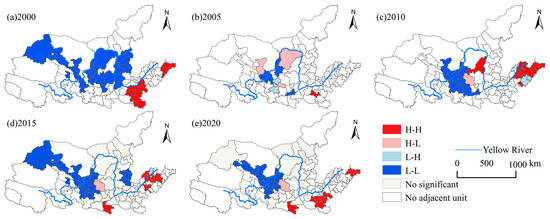
Figure 4.
LISA cluster of RU.
5. Results and Discussion
5.1. Analysis and Discussion of Base Regression Results
In order to explore the relationship between population aging and RU, we firstly performed the regression by OLS. Secondly, the fixed effects model and random effects model were selected by a Hausman test, and the results rejected the initial assumption of using a random effects model at the 1% level. Therefore, the results estimated by the individual fixed effects model were the discussion focus, while the results of other models were used as a reference (Table 6). Models (1)–(3) report the impact of population aging on RU. The outcomes from all three models demonstrate that the estimated coefficient of population aging was significantly positive. And although coefficients’ sizes vary slightly, the direction and significance levels were consistent in proving that population aging promotes the improvement of RU. RU will increase 0.510% for every 1% increase in the population aging rate.
Table 6.
Baseline regression analysis results.
The reasons behind this phenomenon are diverse and complex. Population aging enhances RU through various pathways, such as changing consumption patterns, improving labor quality, promoting technological innovation, optimizing capital allocation, and strengthening policy guidance. Firstly, compared with the young, the elderly tend to adopt more rational and frugal consumption habits, such as saving energy and water resources, and preferring energy-saving products [22]. This shift in consumption behavior contributes to the overall improvement of societal RU [11]. Secondly, population aging forces a structural adjustment in the labor market, focusing on enhancing labor quality [9]. This is achieved by increasing investments in education and professional skill training, thereby raising overall labor productivity [37]. Meanwhile, in response to a reduction in the labor force, businesses and governments increasingly focus on enhancing production efficiency through technological innovation [38]. This not only reduces labor costs but also decreases dependence on and consumption of natural resources [39], thereby increasing RU during production processes. Furthermore, the optimal allocation of capital tends more towards projects and industries that bring about high RU. The elderly often occupy more savings and wealth [40], providing capital for investments in efficient technologies and production methods. Additionally, faced with the challenges brought by population aging, proactive government policies are essential in guiding economic structures towards more sustainable practices. The promotion of resource-saving and environmentally friendly production models has achieved significant success in reducing ecological footprints. These production modes have significantly reduced resource consumption and environmental pollution in China [41,42]. Optimizing energy management can lead to substantial cost savings and efficiency improvements. Referring to seven European projects [43], optimizing energy management can effectively improve energy utilization efficiency and reduce energy waste. Enhancing education for sustainable development is closely related to raising public awareness and changing behavior. By educating the public about sustainable development, local residents can be encouraged to adopt more resource-saving and environmentally friendly behaviors, thereby supporting long-term resource utilization goals [44]. These measures can not only effectively address the challenges posed by population aging but also significantly improve RU and promote sustainable development. Therefore, viewing population aging as an opportunity to promote sustainable socio-economy, rather than merely a challenge, holds significant importance for achieving RU and long-term environmental protection.
From the standpoint of other control variables, industrial structure, foreign capital intensity, and technological innovation are all important factors in promoting RU. RU will increase 0.421% for every 1% increase in industrial structure and increase 0.075% for every 1% increase in foreign capital intensity, which will increase 0.128% for every 1% increase in technological innovation. This aligns with the majority of research [45,46,47]. The improvement of industrial structure manifests in the growth of efficient industries and the transformation or upgrading of inefficient industries, a process that eliminates resource-intensive and environmentally polluting industries. Efficient industries achieve RU by adopting advanced production methods. Meanwhile, inefficient industries improve RU by introducing new technologies and processes [45]. The introduction of foreign investment not only brings in advanced technology and management experience but also stimulates market competition, forcing local enterprises to pursue innovation and efficiency, and promoting driving the environmental standards improvement, thereby promoting RU [46]. Technological innovation is crucial for enhancing production efficiency, developing new materials and energy sources, and promoting sustainable development technologies. It reduces resource waste and increases the output efficiency of unit resource, thereby enhancing RU [47].
5.2. Heterogeneity Test
To examine the differential impacts of population aging on RU in the various types of cities within the Yellow River basin, we conducted regression analyses for provincial capital central city, resource-based city, and other types city, separately (Table 6). By comparing the estimated coefficients of Models (4)–(6), it was observed that the impact of population aging on RU was only significantly positive in resource-based cities and other types cities, with the estimated coefficients of 0.652 and 0.905, respectively. The impact was negative in provincial capital cities, though not significant.
5.3. Robustness Test
To verify the robustness of the estimation results, we tested the impact of population aging on RU by two methods, Winsorize (Model (7)) and Substitution core independent variable (Model (8)) [48]. (1) Winsorize: To eliminate the impact of sample data outliers on the regression results, the sample data were re-estimated with two-sided 1% trimming. (2) Substitution core independent variable: We selected a population aging rate aged 60+ as a proxy variable for re-estimation. The results all showed that the estimated coefficients of population aging were significantly positive, which promoted efficient utilization of resources. The empirical results above are robust and credible.
5.4. Spatial Spillover Effects Analysis and Discussion
We used LM, LR, and Wald test to select a spatial econometric model suitable for the relationship between population aging and RU (Table 7). The test results showed that both LM and LR test were significant at the 5% level, indicating that the Spatial Durbin Model (SDM) was more appropriate for our analysis. According to the Hausman test, we selected the random effects SDM for regression.
Table 7.
Testing of spatial econometric model.
We conducted a regression analysis and employed the partial differentiation method using the SDM, to decompose the total effect of population aging on RU into direct effect and spatial spillover effect (Table 8). We found that the impact of population aging on RU was still significantly positive under the premise of considering spatial spillover effects, which again verifies the robustness of the previous conclusion. The coefficient of W × lnPA was significantly positive at the 1% level. This means that population aging can effectively enhance RU in neighboring regions. The direct effect and spatial spillover effect of population aging on RU were both positive and passed the significance test. This demonstrated that population aging not only enhanced regional RU, but also had a significant positive spatial spillover effect on RU in neighboring regions.
Table 8.
Spatial Durbin model regression results.
In response to the challenges of an aging population, some regions have adopted proactive policy adjustments and technological innovations to improve RU. These innovations serve as examples for neighboring regions, inspiring them to adopt similar measures and thereby collectively enhance RU [49]. Additionally, population aging strengthens close cooperation networks in healthcare and elderly care services, which expand to multiple levels, including resource sharing and technology exchanges, further strengthening regional resource optimization and efficiency improvement. Moreover, population aging triggers changes in market demand, particularly increasing the requirement for energy-saving products and services, prompting industrial adjustments and innovations in both local and neighboring regions to enhance RU [50]. Lastly, the migration of knowledgeable and skilled elders brings new consumer demands and technologies to immigrant areas, further enhancing RU [51,52].
6. Conclusions and Research Prospects
6.1. Main Conclusions
The relationship between population aging and RU in natural watersheds is an uncharted field of social science research. Exploring the inter-relationship between demographic transition and resource utilization is conducive to understanding of the interaction mechanism of PRED and exploring a new type of human–land relationship. We measure RU in the Yellow River Basin during 2000–2020 using the Super-SBM model and efficiency loss model and analyze its spatial–temporal evolution characteristics. We explore the impact of population aging on RU through the fixed effects regression model and the spatial Durbin models. To some extent, our findings not only promote the cross-integration of multiple disciplines, such as demography, economics, and resource science but also provide theoretical references for achieving the sustainable development goal of comprehensively improving RU.
RU showed a dynamic evolution trend, increasing its overall level and gap between cities in the Yellow River basin. The overall level of RU remained relatively low, rising from 0.2099 in 2000 to 0.6221 in 2020. The whole had not realized DEA efficiency, and there remains a large space for efficiency improvement. RU in each city type had strong stability, and the improvement of RU was a continuous and gradual process. The probability of each city type moving up was greater than the probability of the type moving down. RU exhibited significant spatial heterogeneities in the Yellow River basin, maintaining an overall spatial pattern of “leading downstream, intermediate midstream and lagging upstream”. There was a significant positive spatial correlation in RU in the Yellow River basin, but the correlation exhibited a trend in gradual weakening. High–high clusters were mainly located in Shandong and Henan, showing a concentrated and contiguous distribution. Low–low clusters were mainly located in Shaanxi and Gansu, showing a divergent distribution. The redundancy rate of environmental pollution output, water resource input, science and education input, land resource input, labor input, energy input, and capital input were relatively high, while the insufficiency rate of economic output was relatively small. It indicated that excessive resource consumption and excessive pollutant emissions were the main reasons for resource utilization inefficiency in the Yellow River basin. Population aging could significantly promote the efficient utilization of resources, whose impact exhibited a significant positive spatial spillover effect. Population aging not only promoted regional RU, but also had a driving effect on neighboring regions. The impact of population aging on RU had heterogeneous characteristics, and it only had a significant promoting effect on resource-based cities and other cities, while its driving effect on provincial capital cities was not significant.
6.2. Research Prospects
Our innovation is to construct a new RU evaluation index system, which not only considers the resource diversity but also accurately reflects the overall RU. Furthermore, we explore the spatiotemporal evolution of RU in the Yellow River basin and its effects due to population aging, which is also one of the highlights of this paper. This not only broadens the perspective on the efficient utilization of resources but also provides new insights into how demographic shifts impact resource utilization. However, there are still some limits. Firstly, scientific quantification methods of RU still need to be further explored, and the scientific evaluation system of RU also needs to be improved. Secondly, the administrative scope and natural scope cannot be effectively overlapped. So, some data cannot be completely matched to the real natural watersheds. The most recent data were not included due to issues such as delays in data release, as well as inconsistencies, irregularities, and differences in the data statistical caliber of the indicator data published by statistical bureaus. Thirdly, our findings only examine the direct effect of population aging on RU, without considering the indirect effects through the conduction mechanism variables. With the increasingly prominent issue of population aging, future research can further explore the impact mechanism and response strategies of population aging on RU and effectively address the opportunities and challenges that population aging brings to efficient utilization of resources. Finally, our findings mainly focus on the current situation of RU, but the prediction of future development and change trends is insufficient. These will be the direction of our joint efforts with other scholars in the future.
Author Contributions
Conceptualization, Z.W.; methodology, P.W.; software, P.W.; data curation, P.W.; writing—original draft preparation, P.W.; writing—review and editing, Z.W.; visualization, P.W.; supervision, Z.W.; funding acquisition, Z.W. All authors have read and agreed to the published version of the manuscript.
Funding
This research was funded by the National Natural Science Foundation of China (Grant No. 42371194) and the Natural Science Foundation of Shandong Province of China (Grant No. ZR2022QD129).
Institutional Review Board Statement
Not applicable.
Informed Consent Statement
Not applicable.
Data Availability Statement
The data used to support the findings of this study are available from the corresponding author upon request.
Conflicts of Interest
The authors declare no conflicts of interest.
References
- Zhao, X.; Fan, X.; Liang, J. Kuznets type relationship between water use and economic growth in China. J. Clean. Prod. 2017, 168, 1091–1100. [Google Scholar] [CrossRef]
- Song, Y.; Huang, J.; Zhang, Y.; Wang, Z. Drivers of metal consumption in China: An input-output structural decomposition analysis. Resour. Policy 2019, 63, 101421. [Google Scholar] [CrossRef]
- Song, M.; Ma, X.; Shang, Y.; Zhao, X. Influences of land resource assets on economic growth and fluctuation in China. Resour. Policy 2020, 68, 101779. [Google Scholar] [CrossRef]
- Luo, X.; Lu, L.; Wang, Z.; Yang, L. Gray correlation analysis of energy consumption, environmental pollution, and economic growth in subtropical regions of China: Guangxi and Zhejiang as examples. Trop. Conserv. Sci. 2019, 12, 1940082919848101. [Google Scholar] [CrossRef]
- Xiong, J.; Xu, D. Relationship between energy consumption, economic growth and environmental pollution in China. Environ. Res. 2021, 194, 110718. [Google Scholar] [CrossRef]
- Zhao, J.; Zhao, Z.; Zhang, H. The impact of growth, energy and financial development on environmental pollution in China: New evidence from a spatial econometric analysis. Energy Econ. 2021, 93, 104506. [Google Scholar] [CrossRef]
- Wei, W.; Cai, W.; Guo, Y.; Bai, C.; Yang, L. Decoupling relationship between energy consumption and economic growth in China’s provinces from the perspective of resource security. Resour. Policy 2020, 68, 101693. [Google Scholar] [CrossRef]
- Gagnon, E.; Johannsen, B.K.; Lopez-Salido, D. Understanding the new normal: The role of demographics. IMF Econ. Rev. 2021, 69, 357–390. [Google Scholar] [CrossRef]
- Maestas, N.; Mullen, K.J.; Powell, D. The Effect of Population Aging on Economic Growth, the Labor Force, and Productivity. Am. Econ. J. Macroecon. 2023, 15, 306–332. [Google Scholar] [CrossRef]
- Wang, Z.; Qi, G. Demographic Transition in Natural Watersheds: Evidence from Population Aging in the Yellow River Basin Based on Various Types of Migration. Sustainability 2022, 14, 10573. [Google Scholar] [CrossRef]
- Wang, Z.; Wei, L.; Zhang, X.; Qi, G. Impact of demographic age structure on energy consumption structure: Evidence from population aging in mainland China. Energy 2023, 273, 127226. [Google Scholar] [CrossRef]
- Gökgöz, F.; Erkul, E. Investigating the energy efficiencies of European countries with super efficiency model and super SBM approaches. Energy Effic. 2019, 12, 601–618. [Google Scholar] [CrossRef]
- Cai, F.; Zhao, W. When demographic dividend disappears: Growth sustainability of China. In The Chinese Economy: A New Transition; Palgrave Macmillan UK: London, UK, 2012; pp. 75–90. [Google Scholar]
- Whalley, J.; Zhao, X. The contribution of human capital to China’s economic growth. China Econ. Policy Rev. 2013, 2, 1350001. [Google Scholar] [CrossRef]
- Wen, S.; Jia, Z. Resource curse or resource blessing: Perspective on the nonlinear and regional relationships in China. J. Clean. Prod. 2022, 371, 133491. [Google Scholar] [CrossRef]
- Allcott, H.; Keniston, D. Dutch disease or agglomeration? The local economic effects of natural resource booms in modern America. Rev. Econ. Stud. 2018, 85, 695–731. [Google Scholar] [CrossRef]
- De Haas, R.; Poelhekke, S. Mining matters: Natural resource extraction and firm-level constraints. J. Int. Econ. 2019, 117, 109–124. [Google Scholar] [CrossRef]
- Sachs, J.D.; Warner, A.M. The curse of natural resources. Eur. Econ. Rev. 2001, 45, 827–838. [Google Scholar] [CrossRef]
- Auty, R. Sustaining Development in Mineral Economies: The Resource Curse Thesis; Routledge: London, UK, 2002. [Google Scholar] [CrossRef]
- Papyrakis, E.; Gerlagh, R. The resource curse hypothesis and its transmission channels. J. Comp. Econ. 2004, 32, 181–193. [Google Scholar] [CrossRef]
- Cao, B.; Hafeez, M. An assessment of resource curse hypothesis for Chinese economy. Resour. Policy 2023, 87, 104295. [Google Scholar] [CrossRef]
- Garau, G.; Lecca, P.; Mandras, G. The impact of population ageing on energy use: Evidence from Italy. Econ. Model. 2013, 35, 970–980. [Google Scholar] [CrossRef]
- Wang, R.; Tan, J.; Yao, S. Are natural resources a blessing or a curse for economic development? The importance of energy innovations. Resour. Policy 2021, 72, 102042. [Google Scholar] [CrossRef]
- Song, M.; Wang, R.; Zeng, X. Water resources utilization efficiency and influence factors under environmental restrictions. J. Clean. Prod. 2018, 184, 611–621. [Google Scholar] [CrossRef]
- Huang, H.; Wang, Z. Evaluation and improvement of agricultural land resource utilization efficiency: A case study of Jiangxi Province. Chin. J. Eco-Agric. 2019, 27, 803–814. [Google Scholar] [CrossRef]
- Cleland, J. World population growth; past, present and future. Environ. Resour. Econ. 2013, 55, 543–554. [Google Scholar] [CrossRef]
- Mehri, N.; Messkoub, M.; Kunkel, S. Trends, determinants and the implications of population aging in Iran. Ageing Int. 2020, 45, 327–343. [Google Scholar] [CrossRef]
- Wang, Z.; Pan, Z.; Xu, Z.; Cui, X.; Zhang, X. How does demographic transition affect energy conservation? Evidences from the resource effects of global demographic transition. J. Clean. Prod. 2024, 441, 140954. [Google Scholar] [CrossRef]
- Zhang, Y.; Zou, B.; Zhang, H.; Zhang, J. Empirical research on male preference in China: A result of gender imbalance in the seventh population census. Int. J. Environ. Res. Public Health 2022, 19, 6482. [Google Scholar] [CrossRef]
- Kianto, A.; Sáenz, J.; Aramburu, N. Knowledge-based human resource management practices, intellectual capital and innovation. J. Bus. Res. 2017, 81, 11–20. [Google Scholar] [CrossRef]
- Repetto, R. Population, resources, environment: An uncertain future. Popul. Bull. 1987, 42, 3–43. [Google Scholar]
- Deng, G.; Li, L.; Song, Y. Provincial water use efficiency measurement and factor analysis in China: Based on SBM-DEA model. Ecol. Indic. 2016, 69, 12–18. [Google Scholar] [CrossRef]
- Pang, Y.; Wang, X. Land-use efficiency in Shandong (China): Empirical analysis based on a super-SBM model. Sustainability 2020, 12, 10618. [Google Scholar] [CrossRef]
- Cheng, Z.; He, J.; Liu, Y.; Zhang, Q.; Deng, Y. Exploring the spatial structure and impact factors of water use efficiency in China. Environ. Impact Assess. Rev. 2023, 103, 107258. [Google Scholar] [CrossRef]
- Tone, K. A slacks-based measure of efficiency in data envelopment analysis. Eur. J. Oper. Res. 2001, 130, 498–509. [Google Scholar] [CrossRef]
- Chen, Y.; Zhang, R.; Miao, J. Unearthing marine ecological efficiency and technology gap of China’s coastal regions: A global meta-frontier super SBM approach. Ecol. Indic. 2023, 147, 109994. [Google Scholar] [CrossRef]
- Börsch-Supan, A. Labor market effects of population aging. Labour 2003, 17, 5–44. [Google Scholar] [CrossRef]
- Gao, W.; Chen, Y.; Xu, S.; Lyulyov, O.; Pimonenko, T. The Role of Population Aging in High-Quality Economic Development: Mediating Role of Technological Innovation. SAGE Open 2023, 13, 21582440231202385. [Google Scholar] [CrossRef]
- Miao, C.; Fang, D.; Sun, L.; Luo, Q. Natural resources utilization efficiency under the influence of green technological innovation. Resour. Conserv. Recycl. 2017, 126, 153–161. [Google Scholar] [CrossRef]
- Ventura, L.; Horioka, C.Y. The wealth decumulation behavior of the retired elderly in Italy: The importance of bequest motives and precautionary saving. Rev. Econ. Househ. 2020, 18, 575–597. [Google Scholar] [CrossRef]
- Sun, Z.; Zhang, J. Impact of resource-saving and environment-friendly society construction on sustainability. Sustainability 2022, 14, 11139. [Google Scholar] [CrossRef]
- Pu, W.; Zhang, A.; Wen, L. Can China’s resource-saving and environmentally friendly society really improve the efficiency of industrial land use? Land 2021, 10, 751. [Google Scholar] [CrossRef]
- Agrawal, R.; De Tommasi, L.; Lyons, P.; Zanoni, S.; Papagiannis, G.K.; Karakosta, C.; Papapostolou, A.; Durand, A.; Martinez, L.; Fragidis, G.; et al. Challenges and opportunities for improving energy efficiency in SMEs: Learnings from seven European projects. Energy Effic. 2023, 16, 17. [Google Scholar] [CrossRef]
- Piao, X.; Managi, S. The international role of education in sustainable lifestyles and economic development. Sci. Rep. 2023, 13, 8733. [Google Scholar] [CrossRef]
- Xu, L.; Tan, J. Financial development, industrial structure and natural resource utilization efficiency in China. Resour. Policy 2020, 66, 101642. [Google Scholar] [CrossRef]
- He, Y.; Zuo, H.; Liao, N. Assessing the impact of reverse technology spillover of outward foreign direct investment on energy efficiency. Environ. Dev. Sustain. 2023, 25, 4385–4410. [Google Scholar] [CrossRef]
- Wang, H.; Wang, M. Effects of technological innovation on energy efficiency in China: Evidence from dynamic panel of 284 cities. Sci. Total Environ. 2020, 709, 136172. [Google Scholar] [CrossRef] [PubMed]
- Lu, X.; White, H. Robustness checks and robustness tests in applied economics. J. Econom. 2014, 178, 194–206. [Google Scholar] [CrossRef]
- Du, D.; Xiao, C.; Huang, J. How the energy technology influences the total factor of energy efficiency?: Evidence from China. Environ. Sci. Pollut. Res. 2023, 30, 87613–87627. [Google Scholar] [CrossRef] [PubMed]
- Qi, H.; Liu, Y. Change of population age structure and the upgrading of household consumption: An empirical research based on CFPS data. China Popul. Resour. Environ. 2020, 30, 174–184. [Google Scholar]
- Wigger, C. Who with whom? Untangling the effect of high-skilled immigration on innovation. J. Econ. Geogr. 2022, 22, 449–476. [Google Scholar] [CrossRef]
- Pan, Z.; Wang, Z.; Cui, X. New interpretation of human-land relation: Differentiated impacts of global demographic transition on carbon emissions. Sustainability 2024, 16, 5168. [Google Scholar] [CrossRef]

Disclaimer/Publisher’s Note: The statements, opinions and data contained in all publications are solely those of the individual author(s) and contributor(s) and not of MDPI and/or the editor(s). MDPI and/or the editor(s) disclaim responsibility for any injury to people or property resulting from any ideas, methods, instructions or products referred to in the content. |
© 2024 by the authors. Licensee MDPI, Basel, Switzerland. This article is an open access article distributed under the terms and conditions of the Creative Commons Attribution (CC BY) license (https://creativecommons.org/licenses/by/4.0/).