Article

Sustainably Produced but Unsustainably Destroyed: Effective Price Promotion for the Sustainable Management of Unsold Inventory in Korea

1
Department of Clothing and Textiles, Kyung Hee University, 26, Kyungheedae-ro, Dongdaemun-gu, Seoul 02447, Republic of Korea
2
Department of Hospitality and Retail Management, Texas Tech University, Lubbock, TX 79409, USA
*
Author to whom correspondence should be addressed.
Sustainability 2024, 16(15), 6456; https://doi.org/10.3390/su16156456 (registering DOI)
Submission received: 18 June 2024 / Revised: 23 July 2024 / Accepted: 24 July 2024 / Published: 28 July 2024
(This article belongs to the Section Sustainable Management)

Abstract

:
Focusing on sustainable fashion brands’ effective price promotion, this experimental study developed two sets of stimuli, ‘discount’ and ‘disclosure’ strategies, and tested consumers’ evaluations of price fairness, product attractiveness, quality, and brand trust based on each strategy. Subsequently, this study compared consumers’ evaluations of the discount and disclosure strategies. An analysis of 961 Korean samples revealed that a high discount rate increased price fairness and product attractiveness, and the highly promotion-focused consumers were more likely to perceive product attractiveness and quality when positive framing was presented. In the disclosure strategy, the reference point effect was prominent; when the conventional markup rate was provided, consumers showed greater price fairness, product attractiveness, and brand trust. Furthermore, it was noteworthy that disclosing conventional markup along with the firm’s markup showed the same price fairness perceptions as that of a high markup rate. Built on reference point and regulatory focus fit, this study empirically proved the effectiveness of the price promotions of sustainable fashion brands to whom quality and trustworthiness are greatly important, extending the academic originality of this study. Practically, effective use of price promotion strategies can help fashion management handle inventory problems in a sustainable way without massive investment in technologies.

1. Introduction

Despite a growing interest in efficient inventory management in the fashion industry, unsold items are inevitable since consumer demands are volatile and fashion seasons are shorter than ever. To eliminate these unsold items, price discounts are one of the most efficient ways to encourage sales by reducing consumers’ perceived risk and inspiring immediate action [1]. Nonetheless, some fashion houses still destroy unsold merchandise instead of offering discount prices. For example, in 2018, it was revealed that Burberry destroyed USD 38 million worth of unsold items. France 24 [2] reported that this amount was the equivalent of 20,000 Burberry trench coats. Louis Vuitton and Nike were also accused of deliberately damaging stock [3,4]. These fashion brands claimed that a significant discount erodes brand equity and discourages consumers from paying full price [2,5]. More serious concerns are that the remaining stock marked for recycling can be stolen and sold in unauthorized markets, undermining the originality and exclusivity of the products [5]. Given that originality and exclusivity are key assets for fashion products, the fashion industry is seemingly faced with the challenge of responsibly preserving brand equity, in that destroying “perfectly good clothes and products” [3] is definitely counter to sustainable initiatives.
To prevent overproduction and lower stock, some fashion firms have invested in AI technology to manage inventory and better anticipate demand [2]. However, not all firms can adopt these technologies due to high costs, and accurately estimating demand is almost impossible. Therefore, this study posited that offering price discounts during and after the fashion season is still a viable option to reduce unsold products for the majority of fashion firms. Nonetheless, the price promotion literature has argued that frequent and heavy discounts might be regarded as reflecting a compromised product quality, working conditions, etc., and/or implying that the initial markup was improperly high [1,6,7] and that inappropriate discounts can lead to consumers’ skepticism and distrust of the firm. We deemed this negative association greater in firms that claimed to enact sustainable production and sales practices. Even if products are sustainably produced, if they are inappropriately offered at discount prices, consumers are likely to be skeptical of the product quality, fair labor treatment, and pricing policies, which may ultimately deteriorate the firm’s trustworthiness. Thus, effective price promotion strategies are even more critical for sustainable fashion brands, but the majority of price promotion studies have not considered such brand-specific characteristics.
Some brands (e.g., Everlane) have recently begun disclosing their markups in an attempt to bolster responsibility and credibility with consumers. With markups, disclosing the breakdown costs of raw materials, labor, transportation, and so on allows consumers to be aware of the true cost of what they wear and build up trust in the firm [8]. By revealing a much lower markup (200–300%) than the general industry standard (500–800%), the firms also communicate a reasonable sense of pricing to consumers effectively [9]. Although previous studies have tested the benefits of unveiling the cost structure, including price fairness perceptions [10], trust [11], and brand attitudes [12], whether or not disclosing cost information always induces favorable consumer reactions remains largely unknown. Considering that many price promotion studies have manifested that unreasonable price promotions can induce consumers’ negative product evaluations, such as quality, pricing, and trust, the effects of the cost disclosure strategy may also be dependent on how the firm correctly capitalizes on this tactic.
To help sustainable fashion firms employ price promotion strategies, focusing on ‘discount’ and ‘disclosure,’ this study investigated consumers’ responses (i.e., price fairness, product attractiveness, quality perception, and brand trust) with an experimental design. For the discount strategy, the discount rate and message framing were manipulated, and the reference point and message framing were manipulated for the disclosure strategy. These effects were examined based on two theoretical foundations, reference point and regulatory focus fit, thus providing academic implications. Managerially, by dealing with both traditional and new methods of price promotion, this study can suggest a valuable guideline for sustainable fashion managers to develop effective and keen strategies by understanding consumers’ perceptions. Furthermore, the findings can contribute to mitigating the social and environmental concerns of unsold fashion inventory, particularly for fashion brands that claim sustainable practices in the production and consumption cycle.

2. Literature Review

2.1. Reference Points

The prospect theory explains risk and ambiguity, amalgamating nonadditive event uncertainty after obscurity and reference dependence [13]. This indicates that the subsistence of a reference point is a key assumption of prospect theory concerning which after-effects are met as gains or losses. According to the prospect theory [14], a reference point signifies a standard assessment individuals reflect as a benchmark for appraising and linking prospective consequences, gains, and losses. The idea of a reference point underlines the subjective and context-dependent decision-making characteristics, accentuating that individuals’ selections and inclinations are often predisposed according to how they perceive and frame their options relative to a set standard [13].
When there is no risk or uncertainty associated with the outcomes, a gain will be selected over a loss, yet absolute outcomes can be weighed differently by framing the reference point [15]. As essential indicators in assessing value, reference points play an important role in decision-making, but individuals are deeply inclined to gauge their capabilities and judgments relative to existing rather than absolute reference points [16]. Hence, reference points can be induced based on personal past experiences, social comparisons, and expectations [10,16]. In an extension of the idea of reference points, Jung et al. [10] identified a reference price as “the standard against which observed prices are compared, which strongly influences consumers’ price perceptions” (p. 497). This study deemed reference prices a critical factor in eliciting differences in consumers’ perceptions of a given price.

2.2. Regulatory Focus and Regulatory Fit

Regulatory focus, proposed by Higgins [17], refers to the process people undertake to affiliate themselves (i.e., their behaviors and self-conceptions) with suitable goals or standards. Encompassing the basic hedonic principle, the regulatory focus ponders self-regulation vis à vis desired end-states that reflect two distinct motivational systems: promotion and prevention focus [17,18]. Promotion focus expresses growth, aspirations, and advancements, which reflect an approach orientation and positive outcomes [18], whereas prevention focus reflects an avoidance orientation or an aversion to risk and loss, emphasizing protection, safety, and security needs [19,20]. This addresses that promotion-focused individuals favor working toward gains over preventing non-gains, while prevention-focused individuals present alertness in avoiding a loss over working toward non-loss [18,20]. For instance, individuals who rank high in promotion focus demonstrate greater proneness to the positive valence of outcomes while those highly focused on prevention exhibit heightened sensitivity towards the valence of outcomes, specifically negativity [21]. Messages aimed at the pursuit of gains are more convincing for promotion-focused individuals, as they tend to process information more globally and are eager to pursue accomplishments and achievements to maximize potential gains. In contrast, prevention-focused individuals are more amenable to messages with an underlying avoidance of loss, mistakes, and failures and process information locally [22].
Consumer perceptions of price fairness, product attractiveness, product quality, and brand trust can be influenced by underlying regulatory focus. Within the framework of a price promotion, the successful acquisition of the advertised price (i.e., the desired outcome) aligns with consumer expectations and minimizes fairness concerns [10,21,23]. On the other hand, denial of the promoted price may constitute an outcome discrepancy, violating consumer anticipation of a lower price. Driven by achieving gains and potential rewards, promotion-focused individuals may perceive price fairness if it aligns with a promoted offer. In contrast, prevention-focused individuals may perceive if a promoted price is not obtained, especially considering the unrecoverable effort invested in the search and purchase process, because it will translate into a perception of price unfairness relative to the scenario where the promotion is secured [10,23]. Moreover, research by Luan et al. [24] suggests that promotion-focused consumers are inclined to products aligned with enhancing social standing or offering unique experiences, whereas prevention-focused individuals might find products with features promoting safety, reliability, or practicality more appealing.
In terms of quality perception, Khan et al. [25] claimed that prevention-focused individuals, prioritizing avoiding losses and minimizing risks, might be more drawn to products emphasizing durability, reliability, and brand reputation as indicators of high quality. This is supported by studies such as that by Kordrostami and Kordrostami [26], which found that prevention-focused consumers valued product guarantees and warranties as strong quality cues. Similarly, those highly focused on promotion exhibited greater trust in brands perceived as socially responsible or offering unique experiences, as these brands are associated with their desire for progress and positive outcomes [27]. On the other hand, prevention-focused consumers were more trusting of brands perceived as offering secure transactions and minimizing purchase risks [28].
Likewise, a regulatory fit derives from increasing the value of the pursued goal based on expected benefit and cost outcomes [20]. This indicates that if regulatory fit designates pursuing a goal that fits the person’s regulatory orientation, it may boost the perceived assessment of the goal’s objective and brand-related responses [29]. Based on the previous findings that promotion relies on feelings and judgment and prevention on reasoning, Hong et al. [30] supported this view, as promotion-focused people who relied on their feelings were likely to pay more for a preferred product than promotion-focused people who choose products based on reasoning. This is because regulatory fit reinforces a person’s inspirational commitment to the choice process and stimulates a hedonic value of “feeling right,” enriching the perceived worth of objects to which these feelings are endorsed [22]. Regulatory fit can result in emotional, cognitive, and behavioral effects [18,20,22]. Hence, a greater regulatory fit significantly enhances persuasion [29].

2.3. Consumers’ Responses to Price Discounts

Pricing strategy has expanded from reference prices and sensitivity to prices to the application of pricing tactics (e.g., [31,32]). Using a reference price as the price to which no discount is applied, consumers compare current prices with reference prices while they shop [33]. If a business gives a reference price notwithstanding the actual price, consumers’ intention to purchase tends to intensify as they perceive better price attractiveness, feeling that they earn monetary benefits through taking advantage of discounts at a certain rate [34]. Yet consumers tend to put more weight on the perceived value of a price than the actual value since they perceive each price differently (cheap or expensive) [35]. In the case of price promotion, consumers tend to feel like they are losing less than usual [34]. Similarly, Kim [36] found that if a pricing tactic triggers disutility, it will lead to negative consequences such as passing up a discount or even purchasing at a higher price than the upper limit.
Dynamic pricing generated from different resources leads to consumer complaints about perceived price fairness or unfairness, which could lead to dissatisfaction, negative word of mouth, and a deteriorated brand reputation [37,38,39]. Price fairness is defined as “consumers’ judgments and associated emotions as to whether the price they paid is just, relative to the prices other comparative parties paid” [10] (p. 499). This implies that perceived fairness can be imperative for both the prices consumers are presented with and the prices available to others [10]. Since consumers perceive the price according to their perceptions of product quality and monetary sacrifice, they conjecture that a high price signals higher quality but greater monetary sacrifice [40].
Similarly, price promotions may undesirably stimulate changes in brand trust and produce choices for expensive or high-end brands known as prestigious brands [41]. Since highly discounted pricing emphasizes economic gains, which can escalate price sensitivity while presenting quality as a less important choice, there is a negative relationship with brand trust. If consumers are aware of product quality due to recognized quality or brand reputation, they will likely accept a price promotion, which further leads to positive behavioral action but only has a temporary effect on brand trust [40,41]. Therefore, the previous literature (e.g., [34,40,41]) has posited that high discounts result in price fairness and product attractiveness, while quality perceptions and brand trust are neglected. Therefore, H1 was suggested:
H1. 
High discounts will increase (a) price fairness and (b) product attractiveness but not (c) quality perceptions and (d) brand trust.
Regulatory fit can be generated by framing messages showing positive or negative outcomes to which people are sensitive. When the framing of a message is well matched with an individual’s regulatory focus, the fit can promote positive reactions [18]. The literature has argued that promotion-focused individuals are largely affected by ‘eager strategy’ (i.e., positive framing), while ‘vigilant strategy’ (i.e., negative framing) fits prevention-focused individuals. For example, when individuals are more oriented to a promotion focus, it is important to emphasize how many gains are achievable by buying the products. Conversely, if individuals are more oriented to a prevention focus, highlighting how many losses would be generated by not buying the products is effective [30].
Regulatory fit impacts price values by influencing people, corresponding to their response to and engagement with the product [22]. Higgins et al. [20] supported this view, as they found that individuals facing regulatory fit (positive or negative) allocated higher prices to a coffee mug than those who did not have regulatory fit toward the message. This implies that an adverse reaction will reduce perceived value, and a positive response may improve value [29]. Subsequently, the framing effects have been explored in marketing research to provide higher expectancy values of price to consumers, as price promotion is similar to the framing of purchase decisions [42]. By comparing the effect of positive or negative, Lee et al. [43] and Ashraf et al. [44] found that ads that are positively framed messages are more effective than those with negatively framed messages for promotion-focused consumers, regardless of product type, whether hedonic or utilitarian. This implies how matching a website’s shopping experience to a customer’s buying style (promotion-focused or prevention-focused) increases their purchase intention. Similarly, by framing the promotion/prevention conditions for price discounts (e.g., promotional discounts framing the charges as USD 65 with USD 5 in discounts for those paying in cash, while prevention and penalty charges of USD 60 and a USD 5 penalty for paying in credit), Higgins et al. [20] suggested that individuals preferred to have positive gains in the promotion scenario (a receive discount) than positive non-losses in the prevention scenario (avoiding a penalty). Likewise, consumers’ perceptions of price can be affected by regulatory fit and how price information is presented; thus, H2 and H3 were proposed.
H2. 
There is an interaction effect of message framing and regulatory focus in price discounts. That is, people with high promotional goals will show higher (a) price fairness, (b) product attractiveness, (c) quality perceptions, and (d) brand trust with positive framing than with negative framing.
H3. 
There is an interaction effect of discount rates, message framing, and regulatory focus. That is, the effects of the discount rate on (a) price fairness and (b) product attractiveness, (c) perceived quality, and (d) brand trust will be moderated by the regulatory fit.

2.4. Consumers’ Responses to Cost Disclosures

A cost disclosure (transparency) strategy is defined as a firm’s voluntary disclosure of the costs incurred through a product’s production or service delivery [10] (p. 496). Cost transparency builds brand trust and a positive attitude toward brands, establishing brand credibility with consumers [12]. By showing the breakdown of the costs of production and labor conditions, a cost-transparent strategy has the ability to generate consumers’ perceived price fairness and brand trust because they will perceive this strategy as reflective of ethical and responsible conduct [8,45]. A recent study by Jung et al. [10] found that disclosing the true cost, markup, and retail price proliferates perceived gains and losses of not buying, compared to only giving the retail price. When the price of a principal brand is inferior to the reference price (competitor’s retail price or markup), consumers perceive it as a gain, while if a price is higher than the reference price (i.e., the reference price is less than the price), it is considered as a loss [46].
Providing cost transparency or price portioning from brands and firms is uncommon due to an unwillingness to publicize profit margins, implicitly signaling a lower perceived cost of production to producers [11,42]. Mohan et al. [11] asserted that if firms’ profits and markups are recognized as being too high, then cost transparency can destroy brands’ trust and price fairness. Although Abraham and Hamilton [47] emphasized that price partitioning showed a positive evaluation compared to the total price level, they also emphasized that price structure is perceived as complex. This is because many consumers may find enhanced cost information more burdensome [42,47]. As many consumers have prejudged a firm’s costs, signaling consumers by disclosing costs can increase price fairness and brand trust [11].
To do so, the cost signal should be making the “right things to do” type of costs more prominent (e.g., product quality, materials, and labor costs), not costs (e.g., promotional and brand costs) unrelated to perceived price fairness [45]. When price markups or increases are disclosed by host brands and companies rather than outside sources, consumers tend to perceive firms’ price markups or increases as fair [10]. By providing reasonable explanations for their pricing decisions, consumers may avoid incorrect inferences of motives, resulting in a willingness to buy more expensive items [48]. Less transparency of price changes may signal sneaky tactics and an intention to keep a distance from consumers. In this sense, Ferguson [48] found that a limited explanation was fair for small price increases, while a more detailed cost explanation was appropriate for significant price changes. Moreover, Suri et al. [49] posited that price information disclosures for a fixed price format vs. a discounted format could result in higher quality, lower sacrifice, and higher value. This is because conventional markup and fixed prices serve as references, such that they can help evaluate price quality, while discounted prices assess monetary sacrifices or gains associated with a purchase [50].
Furthermore, for message framing, Das et al. [51] examined the positive effects of the fit among multiple cues and the fit between a cue and a regulatory focus on sales promotions. Das et al. [51] and Ramanathan and Dhar [52] posited that a gain-framed message (“Get $× off”) invites more purchases when it is offered to promotion-focused subjects along with other corresponding signals (e.g., the familiarity of the brand). Whereas loss-framed messages such as “Save $×” stimulate more purchases when showed to the prevention-focused subjects and displayed with other compatible cues that also lead to a prevention focus. Considering all of these factors, this study posited the reference and regulatory fit effects of the cost disclosure strategy. Thus, H4 and H5 were proposed as follows:
H4. 
When a conventional markup rate is disclosed, (a) price fairness, (b) quality, (c) product attractiveness, and (d) brand trust will be higher than in the other cases.
H5. 
There is an interaction effect of message framing and regulatory focus in cost disclosures. That is, people with high promotional goals will show higher (a) price fairness, (b) quality, (c) product attractiveness, and (d) brand trust with positive framing than with negative framing.

3. Methods

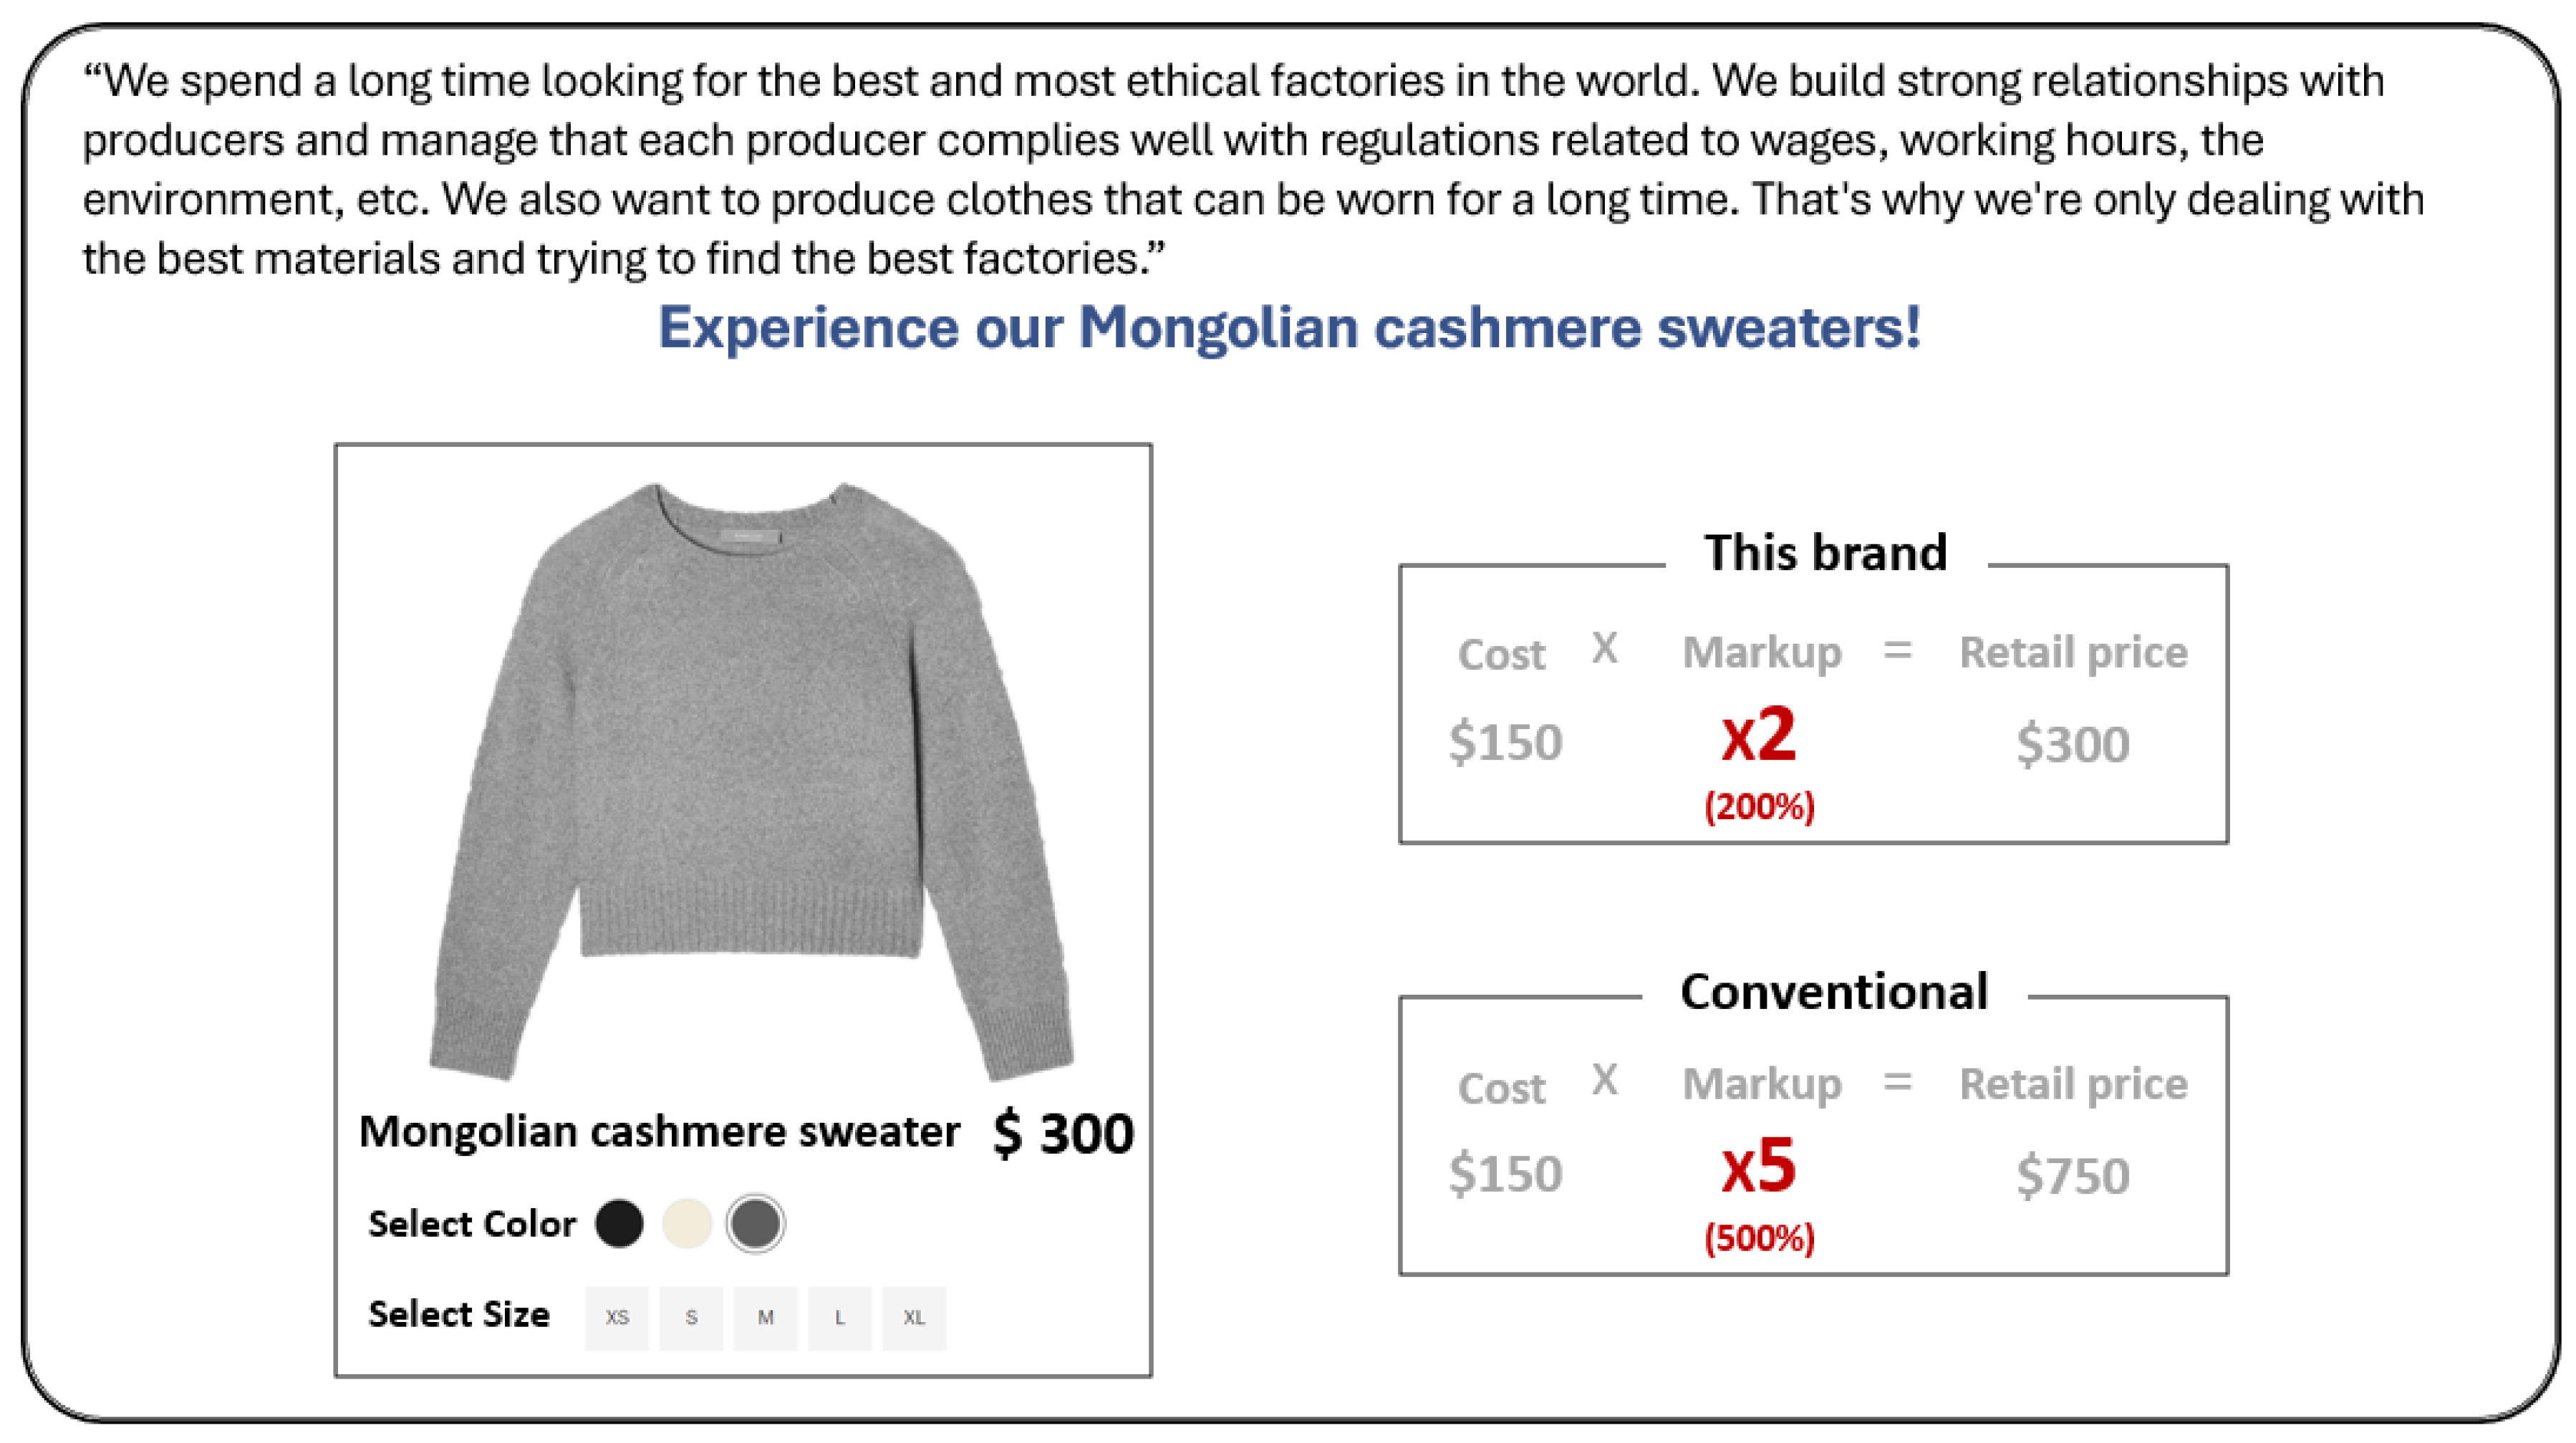
3.1. Stimuli Development

A between-subjects experiment was designed with two sets of stimuli. This study developed mock website images in which a fictitious fashion brand emphasized sustainable principles in the production process as well as the high-quality fabric (a Mongolian cashmere sweater). The following description was provided to help subjects understand the brand:
“We spend a long time looking for the best and most ethical factories in the world. We build strong relationships with producers and ensure that each producer complies well with regulations related to wages, working hours, the environment, etc. We also want to produce clothes that can be worn long. That’s why we’re only dealing with the best materials and trying to find the best factories.”
We selected the Mongolian cashmere sweater as the product in developing the stimuli because Mongolian cashmere is regarded as a high-end fabric, lighter than wool, but offering more thermal protection. Given that we attempted to test the price discount effects of high-quality products, as well as the cost disclosure strategy mainly adopted in fashion brands that employ low markup but high production costs [9], we deemed that product categories with high production costs and high-quality fabric would be appropriate. Moreover, since the pricing of fashion products tends to be largely dependent on design aspects, we intended to minimize the design factor in investigating pricing effects; thus, we adopted a simple and neutral-colored sweater. By referring to actual brands that sell Mongolian cashmere sweaters, we set the retail price of the product shown in the stimulus image as USD 300 and manipulated the price information accordingly (Table 1).
In the price discount category, we manipulated the discount rates and message framing. As a high discount rate condition, we provided a 70% discount, and a 10% discount for the low discount rate condition. For message framing, we added the phrase “you may gain $ if you purchase it now” for the positive framing, whereas the negative framing case read “you may lose $ if you do not purchase it now”. The no framing condition only provided retail prices. Consequently, six stimuli were developed in the discount strategy: 2 (discount rate: 70%, 10%) × 3 (framing: no, positive, negative).
For the disclosure strategy, five different types of cost information were developed by manipulating unveiled information (e.g., a markup rate, a conventional markup rate) and message framing. The Markup condition disclosed its markup rate with the retail price. The Reference condition showed a conventional markup rate with its own markup rate and retail price, and the Reference-positive condition added a positively framed sentence (“you may gain $ if you purchase it now”) in disclosing the conventional markup rate. Lastly, the Reference-negative condition added a negatively framed sentence (“you may lose $ if you do not purchase it now”) in disclosing the conventional markup rate. The Control condition showed the retail price (USD 300) only without any other price and cost information such as discount rates, message framing, a markup rate, and a conventional markup rate. An example of the developed stimulus was presented in Appendix A.

3.2. Survey Instruments

The online survey included measurements mainly borrowed from the literature. The survey first determined the regulatory focus orientation with 11 items (e.g., “Do you often do well at different things that you try?”), including six items for promotion focus and five items for prevention focus [52], and randomly showed one of the stimuli. After reading the given price information, subjects answered manipulation and attention check questions (e.g., discount rate, retail price, markup rate, message framing, etc.) (developed by the authors). Then, price fairness was measured by three items (e.g., this price is reasonable) [53], and five items were provided to measure brand trust (e.g., this brand is sincere) [53]. They were measured on a 7-point Likert scale (1 = strongly disagree to 7 = strongly agree). To evaluate product attractiveness, four semantic scales were used to rate the product: “This product is” (e.g., 1 = bad to 7 = good) [54]. Product quality was measured with five items (e.g., “my overall impression of this product is”) on a 7-point semantic scale (1 = very bad to 7 = very good) [55]. Participants’ demographic information, such as age, gender, education level, and individual monthly income level, was also collected.

3.3. Samples

Upon receiving the Institutional Review Board’s approval, an online survey was conducted in 2023. An online research firm recruited 990 Korean consumers ages 18 and above, and the invited subjects were randomly assigned to one of eleven conditions. The research firm employed a quota sampling method to enhance the sample representativeness in terms of age and gender distributions. The invited subjects were asked to read the assigned price information and answer the survey questions. After scrutinizing patterners, straight liners, missing responses, etc., a total of 961 samples were used for analysis (85–90 samples per condition). The average age of the 961 Korean samples was 44.15 years old. The number of male respondents was 475 (49.4%), and the number of female respondents was 486 (50.6%). In terms of education level, 643 respondents (66.9%) held college degrees, and regarding annual individual monthly income, 428 respondents (44.5%) answered that they earned USD 2500 or less, followed by the USD 2500–USD 4000 (N = 308, 32.0%) group.

3.4. Manipulation Checks

We confirmed that all subjects responded to the attention check questions correctly (e.g., “what is the retail price of this sweater?”). Moreover, to check the manipulation of the discount rate, we asked, “discount rate of this sweater is” and provided two semantic scales (e.g., 1 = very low to 7 = very high). Subjects in the 70% discount condition perceived a significantly higher discount rate than those in the 10% discount condition (M70% = 5.27, M10% = 3.12, t = 24.05, p < 0.001). For the message framing check, we asked participants to rate “this message emphasizes how much you can gain if you purchase this sweater now” on a Likert scale (1 = strongly disagree to 7 = strongly agree), and subjects in the positive framing condition answered with significantly higher numbers than those in the negative framing condition (Mpositive = 5.43, Mnegative = 4.38, t = 6.96, p < 0.001). From these findings, this study considered the manipulations to be successful.

4. Results

4.1. Confirmatory Factor Analysis

In order to assess the reliability and validity of the measurement model, confirmatory factor analysis (CFA) was conducted in Amos 28.0. The measurement model consisted of prevention focus, promotion focus, price fairness, product attractiveness, quality perception, and brand trust. As two items of prevention focus, two items of promotion focus, and one item of quality perception had factor loadings lower than the acceptable threshold of 0.5 [56], CFA was re-run after removing these items (Table 2). As a result, the measurement model fit the data fairly well (χ2/df = 2.66, p < 0.001, CFI = 0.98, TLI = 0.98, RMSEA = 0.04). In addition, all standardized factor loadings were higher than 0.5, indicating satisfactory convergent validity [56]. The Cronbach’s α results ranged from 0.76 to 0.97, and composite reliability (CR) ranged from 0.65 to 0.95 for all constructs, suggesting acceptable reliability. Discriminant validity was also found to be acceptable by confirming that the square root of the AVE values of all constructs was greater than the correlation estimates between the corresponding constructs [57] (Table 3). Thus, we deemed the measurement model to be reliable as well as valid.

4.2. Dominant Regulatory Focus

Prior to hypotheses testing, this study attempted to estimate the dominant regulatory focus of the subjects. Following Lockwood et al.’s [58] procedure, we first created a dominant regulatory focus measure by subtracting the mean value of the prevention focus items from that of the promotion focus items. Higher values indicated a relatively stronger promotion focus than lower values in this measure. Then, we grouped the subjects with this dominant regulatory focus measure based on a median split. The median of the subtraction was 0.25 in this study, and thus, subjects whose value was greater than 0.25 were grouped as high strength of promotion focus, whereas the others who had lower than 0.25 values were grouped as low strength of promotion focus. Of the 961 subjects, 457 (47.6%) samples belonged to the high-strength promotion focus group, and 504 (52.4%) samples were in the low-strength group. Subsequent analysis for the regulatory focus effect used the dominance of promotion focus (high vs. low).

4.3. Price Discount Effects

In order to test H1, H2, and H3, three-way MANOVA was conducted in SPSS 28.0. The results confirmed the main effects of the discount rate (Roy’s criterion = 0.29, F = 43.10, p < 0.001) and regulatory fit (i.e., the interaction effect of the message framing and regulatory focus) (Roy’s criterion = 0.02, F = 2.85, p < 0.05), but not the three-way interaction effect of the discount rate, message framing, and regulatory focus (Table 4). Specifically, the high-discount group showed a higher level of price fairness (Mhigh = 3.70a, Mlow = 2.65b, Mno = 2.46b, F = 55.83, p < 0.001) and product attractiveness (Mhigh = 4.10a, Mlow = 3.74b, Mno = 3.90b, F = 6.59, p < 0.01) than those in the low- and no-discount groups, whereas a statistical difference was not found in quality perception (Mhigh = 4.73, Mlow = 4.82, Mno = 5.02, F = 2.69, p = 0.07) and brand trust (Mhigh = 4.20, Mlow = 4.23, Mno = 4.41, F = 1.16, p = 0.31) across the three groups (i.e., high-, low-, and no-discount groups). Thus, H1 was supported but H3 was not. Although the quality perception was not different at the 0.05 level, according to Ramsey and Schafer’s [59] study, which argued that a p-value greater than 0.05 but less than 0.10 implies statistically suggestive evidence to support the hypothesis, we deemed that this result showed a statistically suggestive difference in evaluating quality (p = 0.07). That is, quality perception might be higher when a discount is not offered (Mhigh = 4.73, Mlow = 4.82, Mno = 5.02).
Also, a regulatory fit effect on product attractiveness (F = 3.40, p < 0.05) and quality perception (F = 3.74, p < 0.05) was found but was not found on price fairness (F = 0.26, p > 0.05) and brand trust (F = 1.79, p > 0.05). As shown in Figure 1, planned contrast results revealed that highly promotion-focused subjects tended to show higher product attractiveness with positive framing than the no framing group (Mhigh*pos = 4.18a, Mhigh*neg = 3.92ab, Mhigh*no = 3.87b), and they also scored higher in quality perception when a positive framing was presented (Mhigh*pos = 5.05a, Mhigh*neg = 4.61b, Mhigh*no = 4.83ab), as compared to a negative framing. On the contrary, regulatory fit effects were not found in low promotion-focused subjects; the extent of product attractiveness was not different among the three framing groups, and this association was also found in quality perception. Thus, H2 was partially supported.

4.4. Cost Disclosure Effects

To test H4, one-way MANOVA was conducted on the Control (control, retail price only), Markup (retail price + markup rate), and Reference (retail price + markup rate + conventional markup rate) conditions in SPSS 28.0 (Roy’s criterion = 0.14, F = 9.02, p < 0.001). The results confirmed that price fairness (F = 11.92, p < 0.001), product attractiveness (F = 3.68, p < 0.05), and brand trust levels (F = 3.81, p < 0.05) were perceived differently according to the conditions but that there was no difference in quality perceptions (F = 1.68, p > 0.05). Post hoc test results revealed that when a conventional markup was disclosed (Reference condition), people tended to show the highest extent of price fairness (Mreference = 3.27a, Mmarkup = 2.41b, Mcontol = 2.45b), product attractiveness (Mreference = 4.21a, Mmarkup = 3.71b, Mcontrol = 3.91ab), and brand trust (Mreference = 4.49a, Mmarkup = 4.06b, Mcontrol = 4.41ab), as compared to when only the retail price was presented (Control condition), as well as when the brand’s markup rate was disclosed along with the retail price (Markup condition). Therefore, H4 was partially supported.
Two-way MANOVA was conducted to examine the effects of regulatory focus fit (i.e., the interaction effect of message framing and regulatory focus) (Roy’s criterion = 0.06, F = 4.05, p < 0.01) with regard to the Reference (conventional markup + no framing), Reference-positive (conventional markup + positive framing), and Reference-negative (conventional markup + negative framing) groups. This result revealed that the main effect of message framing was significant, but the interaction effect of message framing and regulatory focus was not, and thus H5 was rejected. Regarding the message framing effect, it was found that the extent of brand trust in the Reference (no framing) condition was greater than those in Reference-positive (positive framing) and Reference-negative (negative framing) conditions (Mreference = 4.49a, Mreference-positive = 4.21ab, Mreference-negative = 4.01b).

4.5. Comparison of Price Discount and Cost Disclosure Effects

Although it was not hypothesized, this study further attempted to compare the price information effects of discount and disclosure strategies on price fairness, product attractiveness, quality perception, and brand trust. For this, we first conducted the multi-group confirmatory factor analysis (MGCFA) to confirm the measurement invariance between the responses from the price discount cost disclosure conditions. In this analysis, message framing groups were excluded to focus on discount rates and the reference point effects, and the 1, 4, 7, 8, and 9 conditions were analyzed (Table 1). Configural invariance was confirmed with the acceptable fit of an unconstrained model (χ2/df = 1.89, CFI = 0.96, TLI = 0.95, RMSEA = 0.05). The result also ensured metric invariance by comparing the measurement weights of the constrained and unconstrained models (Δχ2 = 23.82, Δdf = 17, p = 0.12), as well as scalar invariance, and the equality of the intercepts of the constructs (Δχ2 = 10.25, Δdf = 21, p = 0.98). The results suggested that the measurement model had the same structure and meaning across conditions, indicating the possibility of comparison.
The results of one-way MANOVA (Roy’s criterion = 0.26, F = 28.02, p < 0.001) found that price fairness (F = 19.23, p < 0.001) and product attractiveness (F = 3.44, p < 0.01) differed according to the conditions. Specifically, price fairness was significantly higher in the 70% rate of the price discount group and the Reference condition of the cost disclosure group (i.e., disclosing a conventional markup rate) than the others (M70% = 3.73a, Mreference = 3.27a, M10% = 2.49b, Mcontrol = 2.45b, Mmarkup = 2.41b). Similarly, product attractiveness was the highest in the Reference condition, which presented a conventional markup rate, whereas disclosing its own markup rate and a 10% discount rate showed the lowest product attractiveness (Mreference = 4.21a, M70% = 4.11ab, Mcontrol = 3.91ab, Mmarkup = 3.71b, M10% = 3.69b). No significant differences were found in quality perception and brand trust across conditions.

5. Discussion

To suggest evidence for effective price promotion strategies for sustainable fashion brands, this study developed two sets of stimuli, ‘discount’ and ‘disclosure’ strategies, and tested consumers’ evaluations of price fairness, product attractiveness, quality, and brand trust according to respective strategies. Then, this study compared consumers’ evaluations of the discount and disclosure strategies. In the discount group, the high discount rate was found to help enhance price fairness and product attractiveness, but it reduced quality perception with statistically suggestive evidence. This result indicated that consumers may feel attracted to the price and products at the high discount rate but that such rates were also associated with compromised quality. Therefore, sustainable fashion brands should set a reasonable discount rate to elicit the perception that quality is important for these brands [60]. Contrary to the literature [44,45], brand trust was not affected by the discount rate in this study. This may be because the contexts varied; this study employed a fictitious brand, while previous studies argued for a negative association between a high discount rate and brand trust in the context of premium brands.
The findings also confirmed the effects of regulatory fit on product attractiveness and quality perception in the discount strategy, consistent with previous studies [10,21,23,31]. Highly promotion-focused consumers were likely to perceive the product as being more attractive and having higher quality when positive framing was presented, which highlights the monetary benefits of purchasing the advertised products, compared to both the negative-framing and the no-framing groups. Since individuals high in promotion focus prove greater proneness to the positive valence of outcomes [21], positively framed messages emphasizing financial gains could be more convincing for promotion-focused individuals, who are eager to obtain potential gains. By contrast, the financial gain might not be attractive to individuals with a low level of promotion focus. If the message contained safety, security and reliability concerns, they would be influenced [29]. Regulatory fit effects did not differ according to the discount rate, and they were not found in the subjects with low promotion focus. This result was in line with Aaker and Lee’s [61] study, which argued that emphasizing how many gains are attainable was more persuasive to promotion-oriented individuals. The findings suggested that sustainable fashion brand managers should consider how they will present the discount information in planning price discount promotions; it will be important to emphasize salient benefits that consumers can obtain so that they can perceive a higher attractiveness and quality of the advertised products.
In the disclosure strategy, the reference point effect was prominent. The conventional markup rate served as a reference point such that when a higher markup conventionally employed in the market was provided with the focal brand’s lower markup, consumers showed greater price fairness, product attractiveness, and brand trust than those in the no-reference groups. This result implied that consumers could compare the given cost information with the reference point and easily recognize gains from the focal brand. This was supported by Jung et al. [10], stating that “cost information per se does not necessarily help justify the pricing, but how consumers interpret the information and perceive gains from purchasing the apparel product, and losses from not purchasing the product suggest the critical role of cognitive processes in this relationship” (p. 504). From this finding, we confirmed that reference points play an important role in revealing cost structure by generating relative values [16] and consequently increasing consumers’ favorable responses.
Unlike the discount strategy, the disclosure strategy did not reveal the regulatory fit effect. Notably, when the markup was disclosed along with the conventional markup and the framing was not provided, subjects tended to show the highest brand trust compared to when positive and negative framings were given. Also, this effect did not differ according to the subjects’ promotion orientations, which did not support the regulatory fit. This finding suggests that the regulatory fit effect is context-specific; that is, the interaction effect of positive framing and promotion-focused orientation is not always activated, and this finding could manifest conditional factors to induce the regulatory fit effects of price information. Another plausible reason for this result could be ‘information overload’. As people are only capable of processing limited information, they tend to prioritize which information they process [54]. If too much cost-related information is provided, consumers may not focus on each piece of information equally, and this study posited that the framing had lower priority than chunks of the retail price, markup, and production costs. This result suggests that the most effective way to disclose cost structure is to present it along with the conventional markup and that the message framing may not have significant effects.
Comparing consumers’ evaluations of the two price promotions, notably showing conventional markup along with the firm’s markup, showed the same effect on price fairness perceptions as that of a 70% discount. This point was very intriguing since it implies that fashion brands emphasizing sustainable principles could choose to unveil their markup strategically instead of compromising it. By adopting the disclosure strategy, brands can keep the original markup and minimize the side effects of heavy discounts while encouraging sales. Also, in the product attractiveness perception, presenting a reference point along with the brand’s markup was the most effective, whereas the low discount rate and revealing the brand’s markup without a reference point showed the lowest product attractiveness. That is, it is important to offer a discount rate to meet consumers’ expectations, and a low discount may instead result in negative responses. Similarly, the result suggested that unveiling the firm’s markup did not necessarily induce a favorable response. Instead, it is more important to deliver a reasonable sense of pricing, and therefore, marketers should consider ways to highlight the firm’s reasonable markup by using a reference point strategically. Since unveiling the firm’s markup can be a risky decision, it may hinder setting large margins and achieving price premiums [8,9]. Indeed, the benefits of disclosing the markup should exceed the risks by capitalizing on a reference point.

6. Conclusions

With the recent emphasis on sustainable business management, the fashion industry is urging transparent disclosure of its impacts on the environment and society and imposing heavy fines on companies that violate sustainable principles [59,62]. Nonetheless, the issue of unsold items, even those produced in sustainable ways, remains a serious social concern. Corresponding to societal needs, global luxury brands are introducing various technologies for accurate demand forecasting and efficient inventory management beyond the existing inventory burning methods (e.g., the Kering group invests in inventory tracking AI technology, LVMH introduces an inventory tracking system), and they are selling the remaining inventory at low prices to their internal stakeholders [2]. However, neither the introduction of the latest technology nor the sale of in-house executives and employees is feasible for fashion brands with relatively low capital and small-scale sales. Effective use of price promotion strategies that are relatively easy to introduce and implement is essential to solving the corporate profitability and inventory handling problems of the majority of small- and medium-sized fashion brands. In this vein, the results of this study can provide important guidelines for setting up effective price promotion strategies, particularly for small- and medium-sized sustainable fashion brands.
Academically, the effectiveness of price promotion was verified, built on the theoretical foundations of the reference point and regulatory focus theories, which have been widely used in social psychology studies, and these findings can contribute to knowledge accumulation in related disciplines such as marketing, advertising, and consumer behavior. More importantly, this study empirically proved the effectiveness of the price promotions of sustainable fashion brands to whom quality and trustworthiness are greatly important, extending the academic originality of this study. Although many firms are eager to promote sustainable production, they tend to overlook the importance of selling and disposing of unsold inventory in sustainable ways. When they are offered at improper discount prices, it could deteriorate consumers’ perceptions toward product quality, fair labor treatment, and pricing policies, which may ultimately deteriorate the firm’s trustworthiness. In this regard, the findings of this study provided brand-specific guidelines, which previous price promotion studies rarely focused on.
Since this study was one of the earliest attempts to examine the price promotion of brands that list sustainability as a core philosophy, many similar future studies are expected. Although this study embraced ethical operations, workers’ welfare and high product quality to define sustainable fashion brands, future studies can refine the definition of sustainable brands by covering wider areas such as animal welfare, environmental protection and so on. To minimize the design influences on consumer responses, this study employed a basic cashmere sweater as the focal product, and the prices were adopted based on market prices for comparable items. However, given that the effectiveness of advertising messages is largely dependent on consumers’ involvement levels [62,63], a wide range of product prices, as well as product categories that are associated with different involvement levels, can be employed in subsequent studies. For example, the role of involvement in the message can be empirically tested by comparing consumer reactions in the case of low pricing (i.e., low involvement) and premium pricing (i.e., high involvement) for the same ethically produced items. In addition, this study used a fictitious brand in the experimental stimuli, but future studies may adopt real sustainable fashion brands (e.g., Everlane) as well as interactive elements of the website such as consumer reviews to create a real-like shopping environment. The findings can also be generalized through cross-cultural validations as this study limitedly employed Korean consumers to provide deeper insights for proper price promotional tactics.

Author Contributions

Conceptualization, S.J. and S.H.L.; methodology, S.J. and M.J.K.; formal analysis, S.J.; investigation, S.H.L. and M.J.K.; visualization, M.J.K.; writing-original draft, S.J. and S.H.L.; writing-review & editing, S.J.; project administration, S.J.; funding acquisition, S.J. All authors have read and agreed to the published version of the manuscript.

Funding

This work was supported by the Ministry of Education of the Republic of Korea and the National Research Foundation of Korea (NRF- 2022S1A5A8053944).

Institutional Review Board Statement

The study was conducted according to the guidelines of the Declaration of Helsinki, and approved by the Institutional Review Board (or Ethics Committee) of Kyung Hee University (KHSIRB-23-067(EA), 24 February 2023).

Informed Consent Statement

Informed consent was obtained from all subjects involved in the study.

Data Availability Statement

Data is unavailable due to privacy or ethical restrictions.

Conflicts of Interest

The authors declare that this study received funding from the Ministry of Education of the Republic of Korea and the National Research Foundation of Korea. The funder was not involved in the study design, collection, analysis, interpretation of data, the writing of this article, or the decision to submit it for publication.

Appendix A

Figure A1. Example of developed stimulus (Group 9: The reference condition).
Sustainability 16 06456 g0a1
Table A1. Summary of the research design and analysis methods.
HypothesesAnalyzed ConditionsAnalysis Method
Price discount H1Price discount rate effect1–7Three-way MANOVA
H2Message framing X Regulatory focus group effect1–7
H3Discount rate X Message framing X Regulatory focus group effect1-7
Cost disclosureH4Reference point effect7–9One-way MANOVA
H5Message framing X Regulatory focus group effect9–11Two-way MANOVA
Table A2. Summary of hypotheses testing.
HypothesesResults
Price discount H1Discount rate effect → price fairness, product attractivenessSupported
H2Regulatory fit effect → product attractiveness, quality perceptionPartially supported
H3Discount rate X regulatory fit effect Not supported
Cost disclosureH4Reference point effect → price fairness, product attractiveness, brand trustPartially supported
H5Regulatory fit effectNot supported

References

  1. Chung, J. Effect of quality uncertainty, regulatory focus, and promotional strategies on perceived savings for sustainable marketing. Sustainability 2020, 12, 5653. [Google Scholar] [CrossRef]
  2. France 24. French Luxury Houses Give Unsold Goods a Second Chance. 2022. Available online: https://www.france24.com/en/live-news/20220206-french-luxury-houses-give-unsold-goods-a-second-chance (accessed on 16 May 2024).
  3. BBC. Burberry Burns Bags, Clothes and Perfume Worth Millions. 2018. Available online: https://www.bbc.com/news/business-44885983 (accessed on 16 May 2024).
  4. Paton, E. Burberry to Stop Burning Clothing and Other Goods It Can’t Sell. 2018. Available online: https://www.nytimes.com/2018/09/06/business/burberry-burning-unsold-stock.html (accessed on 16 May 2024).
  5. Pinnock, O. No One in Fashion Is Surprised Burberry Burnt ₤28 Million of Stock. 2018. Available online: https://www.forbes.com/sites/oliviapinnock/2018/07/20/no-one-in-fashion-is-surprised-burberry-burnt-28-million-of-stock/?sh=6206bf444793 (accessed on 16 May 2024).
  6. Allender, W.; Richards, T. Brand loyalty and price promotion strategies: An empirical analysis. J. Retail. 2012, 88, 323–342. [Google Scholar] [CrossRef]
  7. Villarejo-Ramos, A.F.; Sanchez-Franco, M.J. The impact of marketing communication and price promotion on brand equity. J. Brand Manag. 2005, 12, 431–444. [Google Scholar] [CrossRef]
  8. Kuah, A.T.H.; Weerakkody, V. Is cost transparency necessarily good for consumers? Eur. J. Mark. 2015, 49, 1980–1986. [Google Scholar] [CrossRef]
  9. Singh, N. “What’s behind the price tag: Understanding cost transparency? ” Eur. J. Mark. 2015, 49, 1987–1991. [Google Scholar] [CrossRef]
  10. Jung, S.; Cho, H.J.; Jin, B.E. Does effective cost transparency increase price fairness? An analysis of apparel brand strategies. J. Brand Manag. 2020, 27, 495–507. [Google Scholar] [CrossRef]
  11. Mohan, B.; Buell, R.W.; John, L.K. Lifting the veil: The benefits of cost transparency. Mark. Sci. 2020, 39, 1105–1121. [Google Scholar] [CrossRef]
  12. Kang, J.; Hustvedt, G. Building trust between consumers and corporations: The role of consumer perceptions of transparency and social responsibility. J. Bus. Ethics 2014, 125, 253–265. [Google Scholar] [CrossRef]
  13. Werner, K.M.; Zank, H. A revealed reference point for prospect theory. Econ. Theory. 2019, 67, 731–773. [Google Scholar] [CrossRef]
  14. Kahneman, D.; Tversky, A. Prospect theory: An analysis of decision under risk. Econom. Soc. 1979, 47, 263–291. [Google Scholar] [CrossRef]
  15. Blount, S.; Thomas-Hunt, M.C.; Neale, M.A. The price is right—Or is it? A reference point model of two-party price negotiations. Organ. Behav. Hum. Decis. Process. 1996, 68, 1–12. [Google Scholar] [CrossRef]
  16. Morgado, A.V. Customers’ expectations and perceptions of reference marketing programs. J. Bus. Ind. Mark. 2021, 26, 2176–2186. [Google Scholar] [CrossRef]
  17. Higgins, E.T.; Pinelli, F. Regulatory focus and fit effects in organizations. Annu. Rev. Organ. Psychol. Organ. Behav. 2020, 7, 25–48. [Google Scholar] [CrossRef]
  18. Lee, H.C.; Liu, S.F.; Cheng, Y.C. Positive or negative? The influence of message framing, regulatory focus, and product type. Int. J. Commun. 2018, 12, 18. [Google Scholar]
  19. Barari, M.; Ross, M.; Surachartkumtonkum, J. Negative and positive customer shopping experience in an online context. J. Retail. Consum. Serv. 2020, 53, 101985. [Google Scholar] [CrossRef]
  20. Higgins, E.T.; Nakkawita, E.; Cornwell, J.F.M. Beyond outcomes: How regulatory focus motivates consumer goal pursuit processes. Consum. Psychol. Rev. 2019, 3, 76–90. [Google Scholar] [CrossRef]
  21. Zou, L.W.; Chan, R.Y.K. Why and when do consumers perform green behaviors? An examination of regulatory focus and ethical ideology. J. Bus. Res. 2019, 94, 113–127. [Google Scholar] [CrossRef]
  22. Fazeli, Z.; Shukla, P.; Perks, K. Digital buying behavior: The role of regulatory fit and self-construal in online luxury goods purchase intentions. Psychol. Mark. 2020, 37, 15–26. [Google Scholar] [CrossRef]
  23. Hsu, C.L.; Yu, L.C.; Chang, K.C. Exploring the effects of online customer reviews, regulatory focus and product type on purchase intention: Perceived justice as moderator. Comput. Hum. Behav. 2017, 69, 335–346. [Google Scholar] [CrossRef]
  24. Luan, J.; Fllieri, R.; Xiao, J.; Han, Q.; Zhu, B.; Wang, T. Product information and green consumption: An integrated perspective of regulatory focus, self-construal and temporal distance. Info. Manag. 2023, 60, 103746. [Google Scholar] [CrossRef]
  25. Chang, K.C.; Cheng, Y.S. How online service recovery reviews influence behavioral intentions in the hospitality context: Regulatory focus and loss aversion perspectives. J. Hosp. Tour. Manag. 2021, 46, 440–455. [Google Scholar] [CrossRef]
  26. Kordrostami, M.; Kordrostami, E. Secore or fearful, who will be more resentful? Investigating the interaction between regulatory focus and attachment style. J. Prod. Brand Manag. 2019, 28, 671–683. [Google Scholar] [CrossRef]
  27. Ahmad, F.; Guzman, F. Consumer skepticism about online reviews and their decision-making process: The role of review self-efficacy and regulatory focus. J. Consum. Mark. 2021, 38, 587–600. [Google Scholar] [CrossRef]
  28. Khan, H.; Sararueangpong, P.; Mathmann, F.; Wang, D. Consumers’ promotion focus mitigates the negative effects of chatbots on purchase likelihood. J. Consum. Behav. 2023, 23, 1528–1539. [Google Scholar] [CrossRef]
  29. Kuo, K.; Chuang, S.; Huang, M.; Wu, P. Fit or not? Bringing regulatory fit into the frame on health food preferences. Asia Pac. J. Mark. Logist. 2019, 31, 1388–1404. [Google Scholar] [CrossRef]
  30. Hong, J.M.; Lim, R.E.; Atkinson, L. Doing good versus being good: The interplay between pride appeals and regulatory-focused messages in green advertising. J. Appl. Soc. Psychol. 2021, 51, 1089–1108. [Google Scholar] [CrossRef]
  31. Bodor, H.O.; Klein, N.M.; Arora, N. Online price search: Impact of price comparison sites on offline price evaluations. J. Retail. 2015, 91, 125–139. [Google Scholar] [CrossRef]
  32. Wang, R.J.-H.; Malthouse, E.C.; Krishnamamurthi, L. On the go: How mobile shopping affects customer purchase behavior. J. Retail. 2015, 91, 217–234. [Google Scholar] [CrossRef]
  33. Guha, A.; Biswas, A.; Grewal, D.; Verma, S.; Banerjee, S.; Nordfält, J. Reframing the discount as a comparison against the sale price: Does it make the discount more attractive? J. Mark. Res. 2018, 55, 339–351. [Google Scholar] [CrossRef]
  34. Buyukdag, N.; Soysal, A.N.; Kitapci, O. The effect of specific discount pattern in terms of price promotions on perceived price attractiveness and purchase intention: An experimental research. J. Retail. Consum. Serv. 2020, 55, 102112. [Google Scholar] [CrossRef]
  35. Calvo-Porral, C.; Lévy-Mangin, J. Store brands’ purchase intention: Examining the role of perceived quality. Eur. J. Manag. Bus. Econ. 2017, 23, 90–95. [Google Scholar] [CrossRef]
  36. Kim, J. The impact of different price promotions on customer retention. J. Retail. Consum. Serv. 2018, 46, 95–102. [Google Scholar] [CrossRef]
  37. Zhang, J.; Chiang, W.Y.K. Durable goods pricing with reference price effects. Omega 2020, 91, 102018. [Google Scholar] [CrossRef]
  38. Mukherjee, A.; Jha, S.; Smith, R.J. Regular price $299; pre-order price $199: Price promotion for a pre-ordered product and the moderating role of temporal orientation. J. Retail. 2017, 93, 201–211. [Google Scholar] [CrossRef]
  39. Li, W.; Hardesty, D.M.; Craig, A.W. The impact of dynamic bundling on price fairness perceptions. J. Retail. Consum. Serv. 2018, 40, 204–212. [Google Scholar] [CrossRef]
  40. Chatterjee, S. Signaling service quality through price and certifications. Glob. Bus. Rev. 2020, 21, 279–293. [Google Scholar] [CrossRef]
  41. He, Y.; Oppewal, H. See how much we’ve sold already! Effects of displaying sales and stock level information on consumers’ online product choices. J. Retail. 2018, 94, 45–57. [Google Scholar] [CrossRef]
  42. Simintiras, A.C.; Dwivedi, Y.K.; Kaushik, G.; Rana, N.P. “Should consumers request cost transparency?” Cost transparency in consumer markets. Eur. J. Mark. 2015, 49, 1992–1998. [Google Scholar]
  43. Lee, J.E.; Chen-Yu, J.H. Effects of price discount on consumers’ perceptions of savings, quality, and value of apparel products: Mediating effect of price discount affect. Fash. Text. 2018, 5, 13. [Google Scholar] [CrossRef]
  44. Ashraf, A.; Razzaque, M.A.; Thongpapanl, N. The role of customer regulatory orientation and fit in online shopping across cultural contexts. J. Bus. Res. 2016, 69, 6040–6047. [Google Scholar] [CrossRef]
  45. Shirai, M. Effects of price reframing tactics on consumer perceptions. J. Retail. Consum. Serv. 2017, 34, 82–87. [Google Scholar] [CrossRef]
  46. Huang, H.C.; Chang, Y.T.; Yeh, C.Y.; Liao, C.W. Promote the price promotion: The effects of price promotions on customer evaluations in coffee chain stores. Int. J. Contemp. Hosp. Manag. 2014, 26, 1065–1082. [Google Scholar] [CrossRef]
  47. Abraham, A.T.; Hamilton, R. When does partitioned pricing lead to more favorable consumer preferences? Meta-analytic evidence. J. Mark. Res. 2018, 55, 686–703. [Google Scholar] [CrossRef]
  48. Ferguson, J.L.; Ellen, P.S. Transparency in pricing and its effect on perceived price fairness. J. Prod. Brand Manag. 2013, 22, 404–412. [Google Scholar] [CrossRef]
  49. Suri, R.; Manchanda, R.V.; Kohli, C.S. Comparing fixed price and discounted price strategies: The role of affect on evaluations. J. Prod. Brand Manag. 2002, 11, 160–173. [Google Scholar] [CrossRef]
  50. Wu, M.; Ran, Y.; Zhu, S.X. Optimal pricing strategy; How to sell to strategic consumers? Int. J. Prod. Econ. 2022, 244, 108367. [Google Scholar] [CrossRef]
  51. Das, G.; Mukherjee, A.; Smith, R.J. The perfect fit: The moderating role of selling cutes on hedonic and utilitarian product types. J. Retail. 2018, 94, 203–216. [Google Scholar] [CrossRef]
  52. Ramanathan, S.; Dhar, S. The effect of sales promotions on the size and composition of the shopping basket: Regulatory compatibility from framing and temporal restrictions. J. Mark. Res. 2010, 47, 542–552. [Google Scholar] [CrossRef]
  53. Higgins, E.T.; Friedman, R.S.; Harlow, R.E.; Idson, L.C.; Ayduk, O.N.; Taylor, A. Achievement orientations from subjective histories of success: Promotion pride versus prevention pride. Eur. J. Soc. Psychol. 2001, 31, 3–23. [Google Scholar] [CrossRef]
  54. Ohanian, R. Construction and validation of a scale to measure celebrity endorsers’ perceived expertise, trustworthiness, and attractiveness. J. Advert. 1990, 19, 39–52. [Google Scholar] [CrossRef]
  55. Purohit, D.; Srivastava, J. Effect of manufacturer reputation, retailer reputation, and product warranty on consumer judgments of product quality: A cue diagnosticity framework. J. Consum. Psychol. 2001, 10, 123–134. [Google Scholar] [CrossRef]
  56. Hair, J.F., Jr.; Black, W.C.; Babin, B.J.; Anderson, R.E. Multivariate Data Analysis, 7th ed.; Pearson Prentice Hall: Upper Saddle River, NJ, USA, 2009. [Google Scholar]
  57. Fornell, C.; Larcker, D.F. Evaluating structural equation models with unobservable variables and measurement error. J. Mark. Res. 1981, 18, 39–50. [Google Scholar] [CrossRef]
  58. Lockwood, P.; Jordan, C.H.; Kunda, Z. Motivation by positive or negative role models: Regulatory focus determines who will best inspire us. J. Pers. Soc. Psychol. 2002, 83, 854. [Google Scholar] [CrossRef] [PubMed]
  59. Hu, H.F.; Krishen, A.S. When is enough, enough? Investigating product reviews and information overload from a consumer empowerment perspective. J. Bus. Res. 2019, 100, 27–37. [Google Scholar] [CrossRef]
  60. Ramsey, F.L.; Schafer, D.W. The Statistical Sleuth; Brooks/Cole: Belmont, CA, USA, 2002. [Google Scholar]
  61. Aaker, J.L.; Lee, A.Y. Understanding regulatory fit. J. Mark. Res. 2006, 43, 15–19. [Google Scholar] [CrossRef]
  62. Petro, G. Sustainable Movement Closes in on Clueless Fashion Industry. 2022. Available online: https://www.forbes.com/sites/gregpetro/2022/02/11/sustainable-movement-closes-in-on-clueless-fashion-industry/ (accessed on 16 May 2024).
  63. Dardis, F.E.; Shen, F. The influence of evidence type and product involvement on message-framing effects in advertising. J. Consum. Behav. 2008, 7, 222–238. [Google Scholar] [CrossRef]
Figure 1. Regulatory fit effects on product attractiveness and quality perception. Note. a,b denotes group differences within each dominant regulatory focus group as a result of planned contrast tests.
Sustainability 16 06456 g001
Table 1. Experimental conditions and price/cost information.
GroupConditionInformation
Price discount groups1. 10% discountUSD 300→USD 270 (10% off)
2. 10%-positiveUSD 300→USD 270 (10% off)
You may gain USD 30 if you purchase it now.
3. 10%-negativeUSD 300→USD 270 (10% off)
You may lose USD 30 if you do not purchase it now.
4. 70% discountUSD 300→USD 90 (70% off)
5. 70%-positiveUSD 300→USD 90 (70% off)
You may gain USD 210 if you purchase it now.
6. 70%-negativeUSD 300→USD 90 (70% off)
You may lose USD 210 if you do not purchase it now.
Control group7. Retail priceUSD 300
Cost disclosure groups8. MarkupUSD 150 (production cost) × 200% (our markup) = USD 300
9. ReferenceUSD 150 (production cost) × 200% (our markup) = USD 300
USD 150 (production cost) × 500% (conventional markup) = USD 750
10. Reference-positiveUSD 150 (production cost) × 200% (our markup) = USD 300
USD 150 (production cost) × 500% (conventional markup) = USD 750
You may gain USD 450 if you purchase it now.
11. Reference-negativeUSD 150 (production cost) × 200% (our markup) = USD 300
USD 150 (production cost) × 500% (conventional markup) = USD 750
You may lose USD 450 if you do not purchase it now.
Note. Information was developed by referring to actual brand cases.
Table 2. Results of confirmatory factor analysis.
Standardized
Factor Loading
t-Value
Prevention focus (Cronbach’s α = 0.81, CR = 0.65, AVE = 0.59)
Growing up, did you ever act in ways that your parents thought was objectionable? (R)0.81-
Did you get on your parents’ nerves often when you were growing up? (R)0.7820.32
Growing up, would you ever “cross the line” by doing things that your parents would not tolerate?0.7119.66
Promotion focus (Cronbach’s α = 0.76, CR = 0.70, AVE = 0.45)
How often have you accomplished things that you got you “psyched” to work even harder?0.72-
Do you often do well at different things that you try?0.7016.61
I feel like I have made progress toward being successful in my life.0.6816.44
When it comes to achieving things that are important to me, I find that I do not perform as well as I ideally would like to do. (R)0.5814.56
Price fairness (Cronbach’s α = 0.96, CR = 0.92, AVE = 0.89)
This price is acceptable.0.96-
This price is fair.0.9566.00
This price is reasonable.0.9256.40
Product attractiveness (Cronbach’s α = 0.95, CR = 0.92, AVE = 0.82)
This product is...
dislikable (1)–likable (7)
0.96-
bad (1)–good (7)0.9255.98
unappealing (1)–appealing (7)0.9153.68
unfavorable (1)–favorable (7) 0.8340.67
Quality perception (Cronbach’s α = 0.90, CR = 0.88, AVE = 0.69)
This product is most likely going to be of high quality.
strongly disagree (1)–strongly agree (7)
0.92-
My overall impression of this product is...
very bad (1)–very good (7)
0.9040.48
Compared to other products, the quality of this product is ...
much lower than average (1)–much higher than average (7)
0.7730.62
This product is likely to be durable.
not very likely (1)–very likely (7)
0.7026.26
Brand trust (Cronbach’s α = 0.97, CR = 0.95, AVE = 0.85)
This brand is reliable.0.94-
This brand is honest.0.9254.71
This brand is dependable.0.9254.26
This brand is sincere.0.9253.35
This brand is trustworthy.0.9152.52
Note. All values are significant at the 0.001 level. (R): reversed item
Table 3. Results of correlation analysis.
Mean (SD)123456
1. Prevention focus4.33 (1.27)0.77 *
2. Promotion focus4.59 (.90)0.15 **0.67
3. Price fairness3.06 (1.40)0.030.000.94
4. Product attractiveness3.92 (1.18)0.020.020.58 **0.91
5. Quality perception4.78 (.98)0.07 *0.000.32 **0.51 **0.83
6. Brand trust4.22 (1.14)0.08 *0.030.54 **0.54 **0.56 **0.92
Note. Diagonal values in bold are square roots of AVEs. * p < 0.05, ** p < 0.001.
Table 4. Results of the three-way MANOVA test (H1–H3).
Roy’s CriterionFHypothesis dfError dfpη2
Discount rate0.2943.104592.00.000.23
Regulatory focus X Message framing (i.e., regulatory fit)0.022.854592.00.020.02
Discount rate X
Regulatory focus X Message framing
0.011.334592.00.260.01
Disclaimer/Publisher’s Note: The statements, opinions and data contained in all publications are solely those of the individual author(s) and contributor(s) and not of MDPI and/or the editor(s). MDPI and/or the editor(s) disclaim responsibility for any injury to people or property resulting from any ideas, methods, instructions or products referred to in the content.

