Article

Assessment of Nitrate and Phosphate Concentrations in Discharge Water from Ditch Networks across Different Peatland Use Types: Implications for Sustainable Peatland Use Management

1
School of Food Science and Environmental Health, Technological University Dublin, City Campus, Grangegorman, D07 ADY7 Dublin, Ireland
2
Nanolab Research Centre, Physical to Life Sciences Hub, Technological University Dublin, D08 CKP1 Dublin, Ireland
3
Radiation and Environmental Science Centre, Physical to Life Sciences Hub, Technological University Dublin, D08 CKP1 Dublin, Ireland
*
Author to whom correspondence should be addressed.
Sustainability 2024, 16(15), 6463; https://doi.org/10.3390/su16156463 (registering DOI)
Submission received: 23 March 2024 / Revised: 4 July 2024 / Accepted: 23 July 2024 / Published: 28 July 2024
(This article belongs to the Section Pollution Prevention, Mitigation and Sustainability)

Abstract

:
Peat soils, when drained and transformed for different land uses, can release pollutants such as nitrate and phosphate into nearby water bodies and ecosystems through ditch networks. However, there have been limited studies to ascertain the extent and impact of these nutrient releases under various peatland use types. A total of fifty-four water samples were collected between October 2021 and January 2022 from five industrial cutaway bogs, twenty-five grasslands, and twenty-four forest plantations. The water samples were subsequently examined for nitrate–nitrogen and phosphate–phosphorus using the HACH DR890 colorimeter. This study showed that the nitrate–nitrogen concentration of the discharge water ranged from 6.9 mg/L from forestry to 10.52 mg/L from grassland. The phosphate–phosphorus concentration ranged from 0.43 mg/L from forestry to 0.78 mg/L from grassland. The nitrate–nitrogen and phosphate–phosphorus concentrations in the drainage channel exhibited by the grassland and the cutover did not differ significantly (p > 0.05). Upon comparing the results obtained with the established safety limits set by the European Union (EU) and World Health Organization (WHO), it was observed that phosphate–phosphorus and nitrite–nitrogen concentration in the surface water (specifically, discharge water) exceeded the permissible threshold concentrations in surface water. The nutrient pollution index revealed that the discharge water from the ditch networks across the studied peatland use type was highly polluted, with a trend following the order of grassland > cutover > forestry. These results are in line with the broader issue of excessive nutrient inputs in freshwater ecosystems, which can lead to eutrophication. This study promotes sustainable water resources and peatland management practices by determining nitrate–nitrogen and phosphate–phosphorus concentrations in discharge water from ditch networks associated with different peatland use types: grassland, forestry, and cutover. This research emphasizes the critical need for sustainable peatland management to improve water quality in the river basin districts under the Water Framework Directive.

1. Introduction

Peatlands cover 4.23 million km2, accounting for 2.84% of the Earth’s land area, and play a crucial role in ecosystem functions such as carbon storage, biodiversity, water retention, water quality, and supporting livelihoods [1,2,3]. It is estimated that human land use has directly altered 50 million hectares of peatlands across most European countries. In Ireland, for instance, peat soils cover 1,564,650 hectares of the total land area [1], but only 38% of these peatlands are known to remain in their natural state [4]. Increasing anthropogenic activities, particularly the conversion of natural peatlands to other land use types such as forestry and grassland through drainage has been facilitated by the construction of ditch networks, originally intended to improve waterlogging and support agricultural, industrial peat extraction, and forestry activities [5,6,7]. Nevertheless, once drained, peat soils, enriched with organic matter and nutrients, unleash a cascade of biochemical processes that cause the release of pollutants like nitrate (NO3) and phosphate (PO43−) into nearby water bodies and other ecosystems [8].
The conversion of peatland into alternative land use types can induce substantial removal of vegetation cover, thereby exerting pronounced effects on nutrient uptake and cycling processes within the peatland ecosystem [1]. The removal of native vegetation and the introduction of non-native species can significantly disrupt nutrient cycling, leading to increased nutrient flow within the peatland system [9,10]. As the vegetation decreases, the delicate equilibrium of nutrient cycling is disrupted, potentially leading to shifts in the availability and distribution of crucial nutrients, such as nitrate and phosphate, in the porewater [11]. These alterations not only impact the immediate peatland environment but also have downstream consequences, affecting water quality and the health of connected aquatic ecosystems [12,13,14]. High nitrate and phosphate concentrations in water bodies have been scientifically substantiated to engender a suite of environmental predicaments [15]. From an environmental standpoint, eutrophication—an excessive nutrient enrichment in water bodies—may be a trigger for algal blooms and subsequent hypoxic conditions, decimating aquatic life and destabilizing aquatic ecosystems [16]. These oxygen-depleted conditions can be destructive for aquatic life, as many fish and mobile invertebrates may experience mortality or be forced to relocate, while sessile organisms are particularly vulnerable [17].
A range of studies have assessed the nitrate and phosphate concentration of porewater in peatland ecosystems [18,19,20]. For instance, Tiemeyer et al. [14] and Monaghan et al. [15] reported high nitrate and phosphate concentrations, respectively, in degraded peatlands and drained pastures. Meanwhile, Joensuu et al. [20] observed increased pH, electrical conductivity, and base cation concentrations following ditch maintenance, with no major changes in nitrate and phosphate concentrations. Nonetheless, there is a persistent knowledge gap as none of the studies to date have reported on the nitrate and phosphate concentrations in discharge water from a ditch network under various temperate peatland use types.
In 2000, the European Union passed the Water Framework Directive (WFD) aimed at enhancing the quality and sustainability of water resources across Europe. One of the key goals of the WFD is to achieve “good ecological status” for all water bodies by setting standards for water quality and ecosystem health [21,22]. In relation to nutrients, the WFD targets the reduction of elevated levels of nitrogen and phosphorus compounds, which are significant contributors to water pollution and eutrophication. The WFD mandates member states to identify sources of nutrient pollution, implement monitoring programs, and adopt measures to mitigate these pollutants from agricultural runoff, urban wastewater, and other sources [22].
Therefore, this study addresses the knowledge gaps by investigating the impact of different peatland use types (forestry, semi-improved grassland, improved grassland, and cutover bog) on nitrate and phosphate levels in discharge water, offering valuable insights for the management of peatland to minimize negative environmental impacts, specifically eutrophication, and improve water quality. This investigation is crucial because different land uses, such as forestry and grasslands, can lead to distinct patterns of nutrient release. For instance, forestry practices may alter vegetation composition and introduce nutrients through activities like fertilization, potentially affecting nutrient dynamics differently from grasslands influenced by agricultural practices and fertilizer application [23]. Cutover bogs, which are undergoing post-extraction restoration or abandonment, present unique conditions that can influence nutrient dynamics in the ditch network [24].
By addressing these issues, this study contributes to the UN Sustainable Development Goal (SDG) 6, which aims to ensure the availability and sustainable management of water and sanitation for all. Specifically, the findings can inform future management strategies to prevent water pollution by controlling the release of nutrients into water bodies, thus enhancing water quality and preventing further deterioration. Moreover, the research aligns with SDG 15, which seeks to protect, restore, and promote sustainable use of terrestrial ecosystems, sustainably manage forests, combat desertification, and halt and reverse land degradation and halt biodiversity loss. By understanding the impacts of different land uses on nutrient dynamics in peatlands, this study supports the sustainable management and restoration of these critical ecosystems, thereby fostering biodiversity and mitigating negative environmental impacts.

2. Materials and Methods

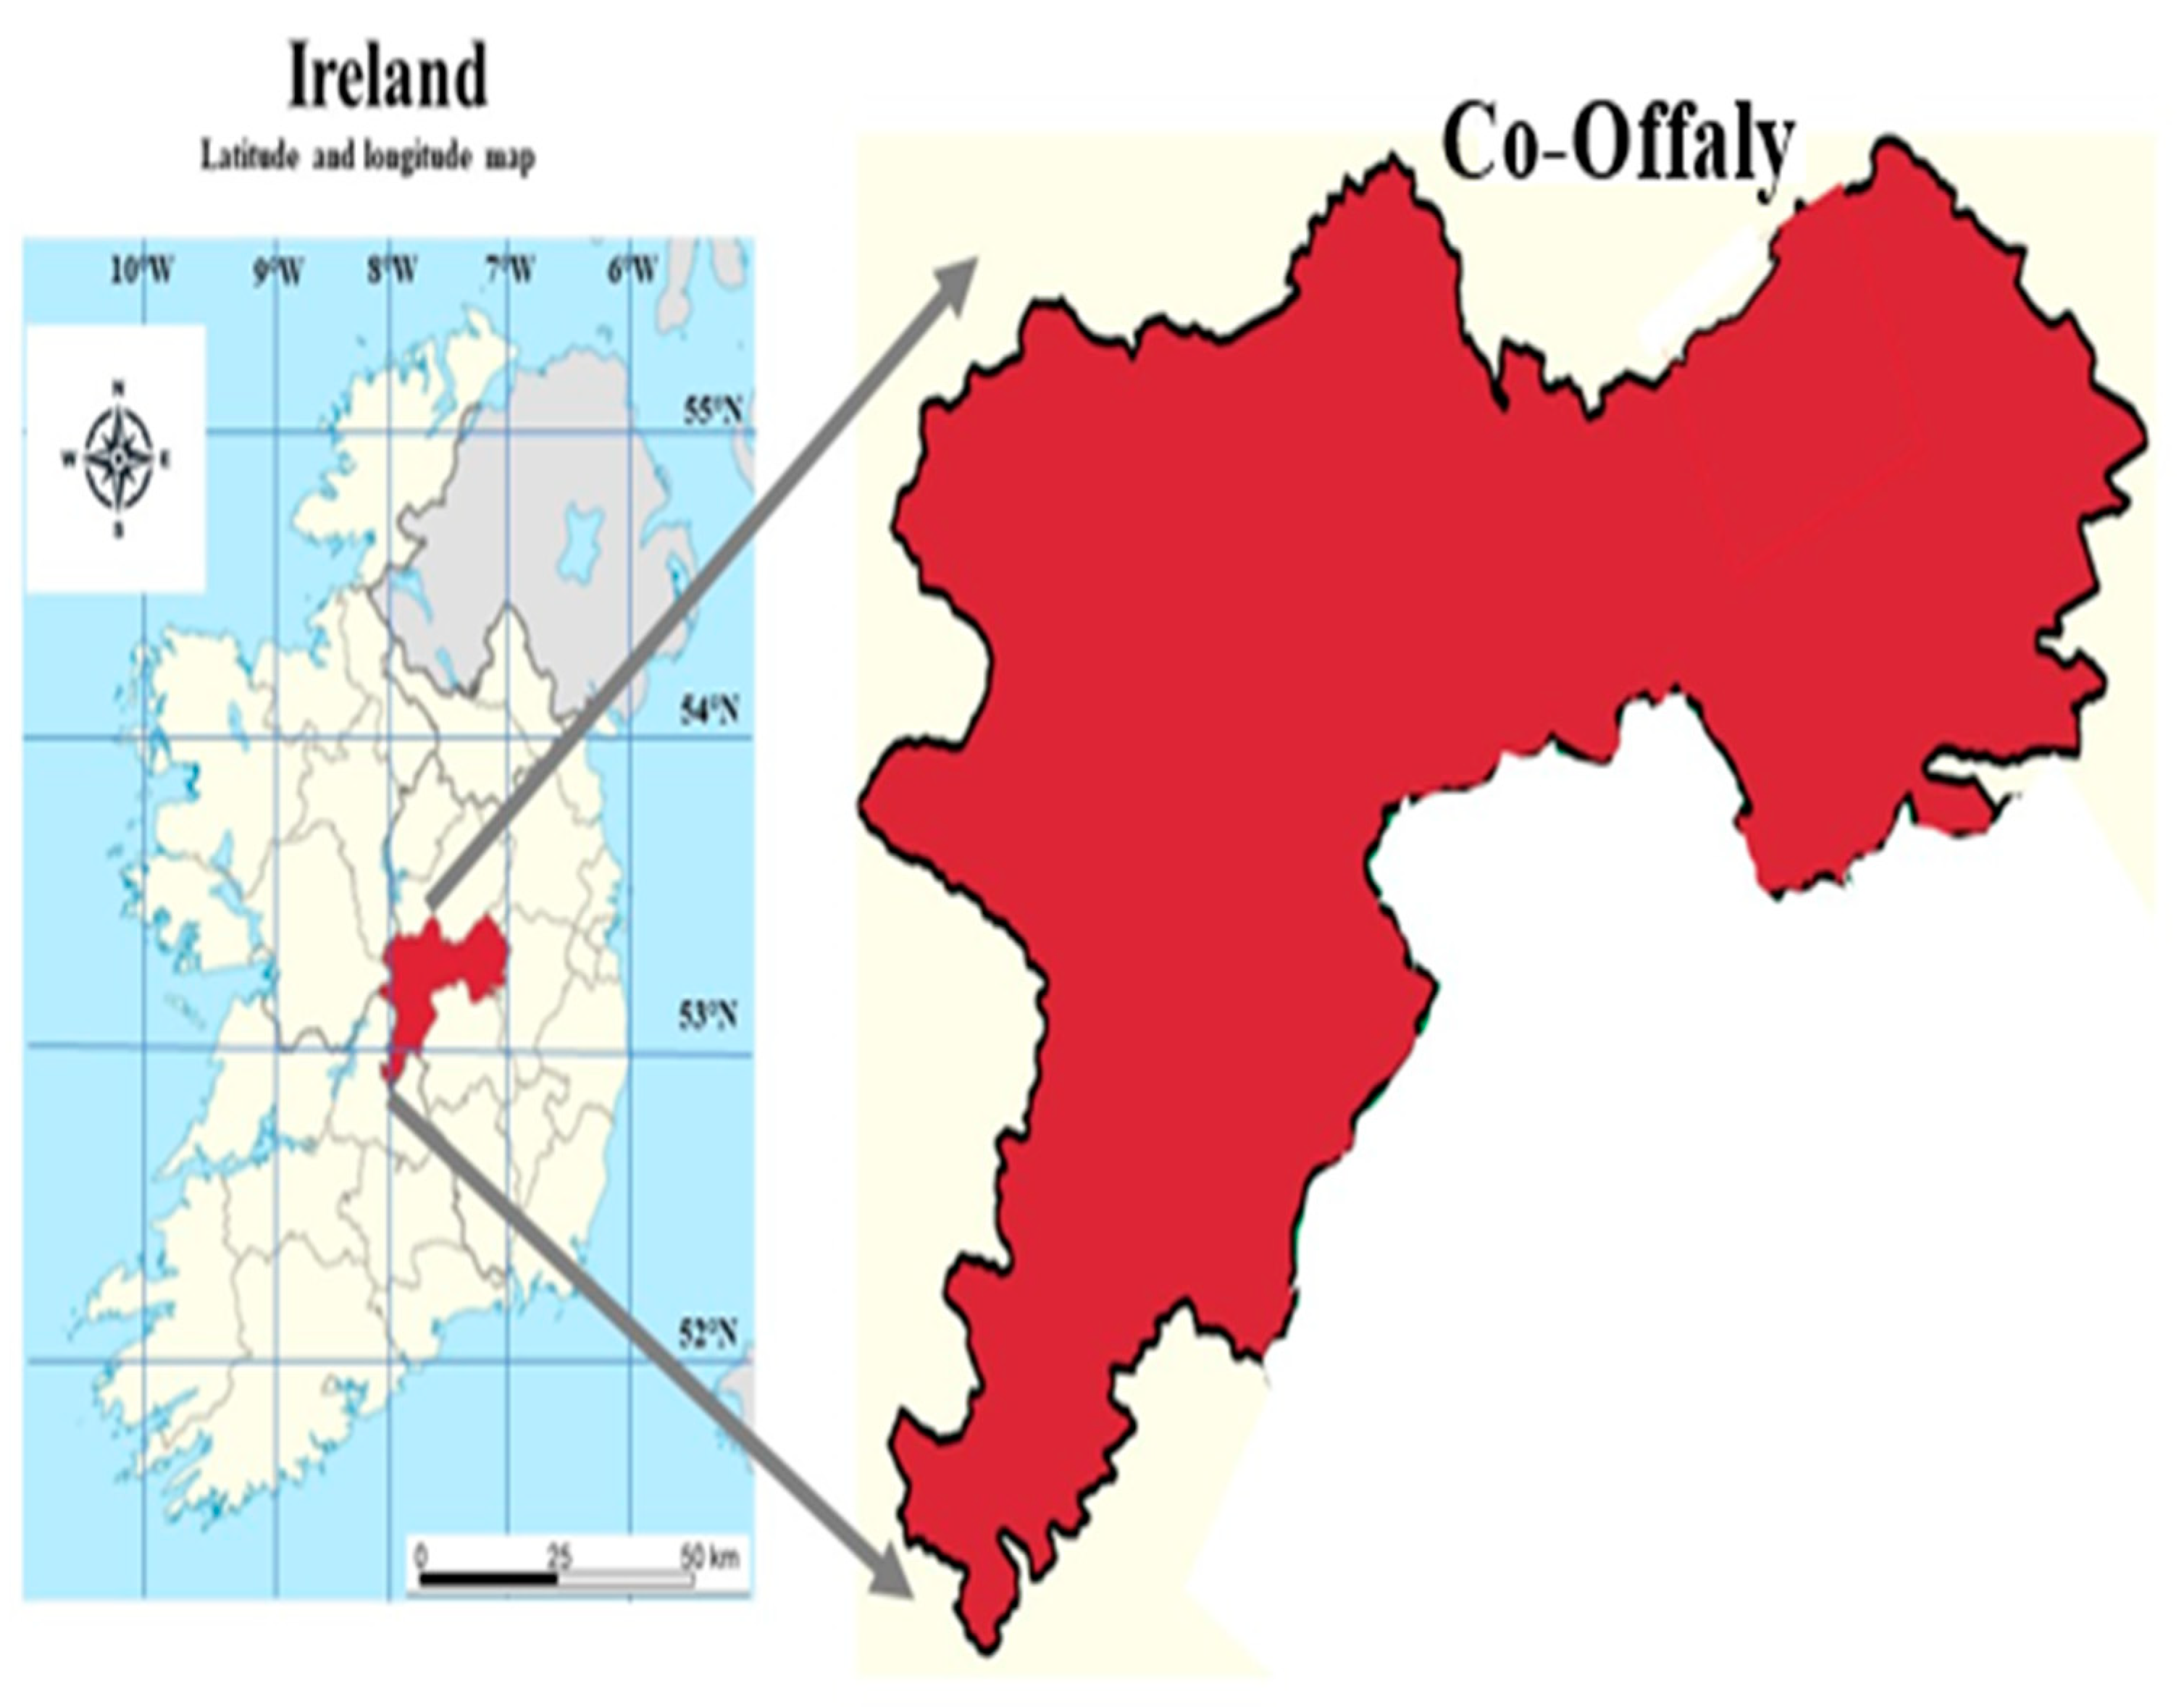
2.1. Study Area and Sample Collection

The research was carried out at Co. Offaly, situated in the midlands of the Republic of Ireland, specifically in the drainage channel of an industrial cutaway bog, grassland, and forest plantation (Figure 1). The county effectively exemplifies raised bogs, which are a distinct characteristic of the midlands landscape. Since the 1980s, the landscape has undergone significant changes because of human activities. Specifically, the native land has been converted into grassland, forest, and industrial cutaway areas to meet the growing demand for energy sources and horticultural purposes. This transformation has been achieved by implementing drainage systems to lower the water level in the region [25,26]. The grassland is primarily composed of perennial ryegrass, Lolium perenne, to which farmers regularly apply nitrogen sources such as slurry or inorganic fertilizers at a rate of 100 kg/ha [27]. The forest stands consist of plantations of pine, spruce, ash, and sycamore, all of which were established more than a decade ago. Conversely, the cutaway bogs originated from a formally raised bog that was subjected to industrial peat extraction predominantly for power production in a condensing power facility. Although the extraction activities in these bogs have since ceased, earlier activities have resulted in the substantial removal of peat.
A total of fifty-four water samples were collected between October 2021 and January 2022 from five industrial cutaway bogs, twenty-five grasslands, and twenty-four forest plantations. The drainage channels from which the samples were taken are still functional; they are wider than 1 m and deeper than 1.5 m, and they hold water at a depth of more than 0.5 m. Over the four months of water sampling from the ditch network, humidity ranged from 91.62% in October 2021 to 95.94% in December 2021. The temperature exhibited variations, with the lowest exhibited at 4.79 °C in January 2022 and the highest at 10.99 °C in October 2021. Meanwhile, precipitation was higher in October, and wind speed was higher in December (Figure 2). In each specific drainage channel, one composite set of water samples was collected to adequately represent the respective sampling sites. Each sample was collected using a 2 L polyethene container, ensuring that the vessel was filled approximately 30 cm beneath the water’s surface. Following collection, the containers were securely sealed to maintain sample integrity and promptly transported to the laboratory for subsequent analysis.

2.2. Water Analysis

Drainage water samples were filtered with a 0.45 μm membrane filter, and the filtrate was analyzed using absorption spectrophotometry for the determination of nitrate–nitrogen, phosphate, and nitrite–nitrogen [28]. Specifically, the ascorbic acid method was used to determine phosphates using Phosver 3 Phosphate Reagent Powder Pillows with HACH DR890 colorimeter. A 10 mg/L standard solution (Hach Company, Loveland, CO, USA) was used to ensure accuracy and performance. The method detection limit was estimated to be 0.07 mg/L PO43−. The 8171-cadmium reduction and 8507 diazotization methods were used to measure nitrate–nitrogen and nitrite–nitrogen, respectively, with a HACH DR890 colorimeter. Accuracy and performance were checked with a 10 mg/L standard solution (Hach Company, Loveland, CO, USA). The method detection limits for nitrate–nitrogen and nitrite–nitrogen were 0.2 mg/L and 0.005 mg/L, respectively. Electrical conductivity and total dissolved solids (TDSs) were measured using a benchtop conductivity meter (Mettler-Toledo, Columbus, OH, USA) [29].

2.3. Nutrient Pollution Index (NPI)

Discharge originating from these drainage channels frequently contains a heightened concentration of nutrients, specifically nitrogen (N) and phosphorus (P), resulting in the pollution of water bodies with excessive nutrients. The nutrient pollution index (NPI) has been developed to quantify the level of nutrient pollution and provides a standardized metric that assesses the concentration of these nutrients. Higher NPI values indicate a greater potential for nutrient pollution, which can result in unfavorable ecological outcomes, such as eutrophication, reduced biodiversity, and degraded water quality. The NPI is calculated using the equation below [30]:
N P I = N N M P C + P P M P C
where N and P are the mean concentration of nitrate–nitrogen (Figure 3a) and phosphate–phosphorus (Figure 3c) in the surface water, respectively. NMPC and PMPC represent the nitrate–nitrogen maximum permissible concentration (NMPC) and phosphate–phosphorus maximum permissible concentration (PMPC) in surface water surface or water that enters streams, respectively. In accordance with the guidelines established by the European Union (EU, Directive 2000/60/EC), the recommended concentration for nitrate–nitrogen in surface water is set at 11.3 mg/L [21], and the recommended concentration for phosphate–phosphorus is 0.05 mg/L, as recommended by the U.S. Environmental Protection Agency (USEPA) for surface water that enters streams [31]. The nutrient pollution index (NPI) classification is divided into four categories: NPI values below 1 indicate no pollution, NPI values between 1 and 3 indicate moderate pollution, NPI values between 3 and 6 indicate considerable pollution, and NPI values above 6 indicate very high pollution [30].

2.4. Data Analysis

The data from this study were subjected to statistical analysis using one-way analysis of variance (ANOVA) in the GraphPad Prism 10.1.0 software [32]. A post hoc analysis, specifically the Tukey test, was conducted with a significance level (α) of 0.05 to evaluate the statistical significance of the data pertaining to the discharge water from grassland, industrial cutaway bog, and forest plantation drainage channels. The coefficient of variation (CV%) was calculated as the percentage ratio of the standard deviation (SDV) to the mean. Variation was classified into three categories: little variation (CV% < 20), moderate variation (CV% = 20–50), and high variation (CV% > 50).
Principal component analysis (PCA) was performed using the measured chemical properties of discharge water from ditch networks under different temperate peatland use types. PCA was performed using the prcomp functions from R’s built-in stats package [33]. The results were presented using the factoextra package [34], FactoMineR, and ggbiplot2 [35]. Similarly, correlation analysis was performed between the measured chemical properties of discharge water from ditch networks using OriginPro 2024b learning edition software [36].

3. Results and Discussion

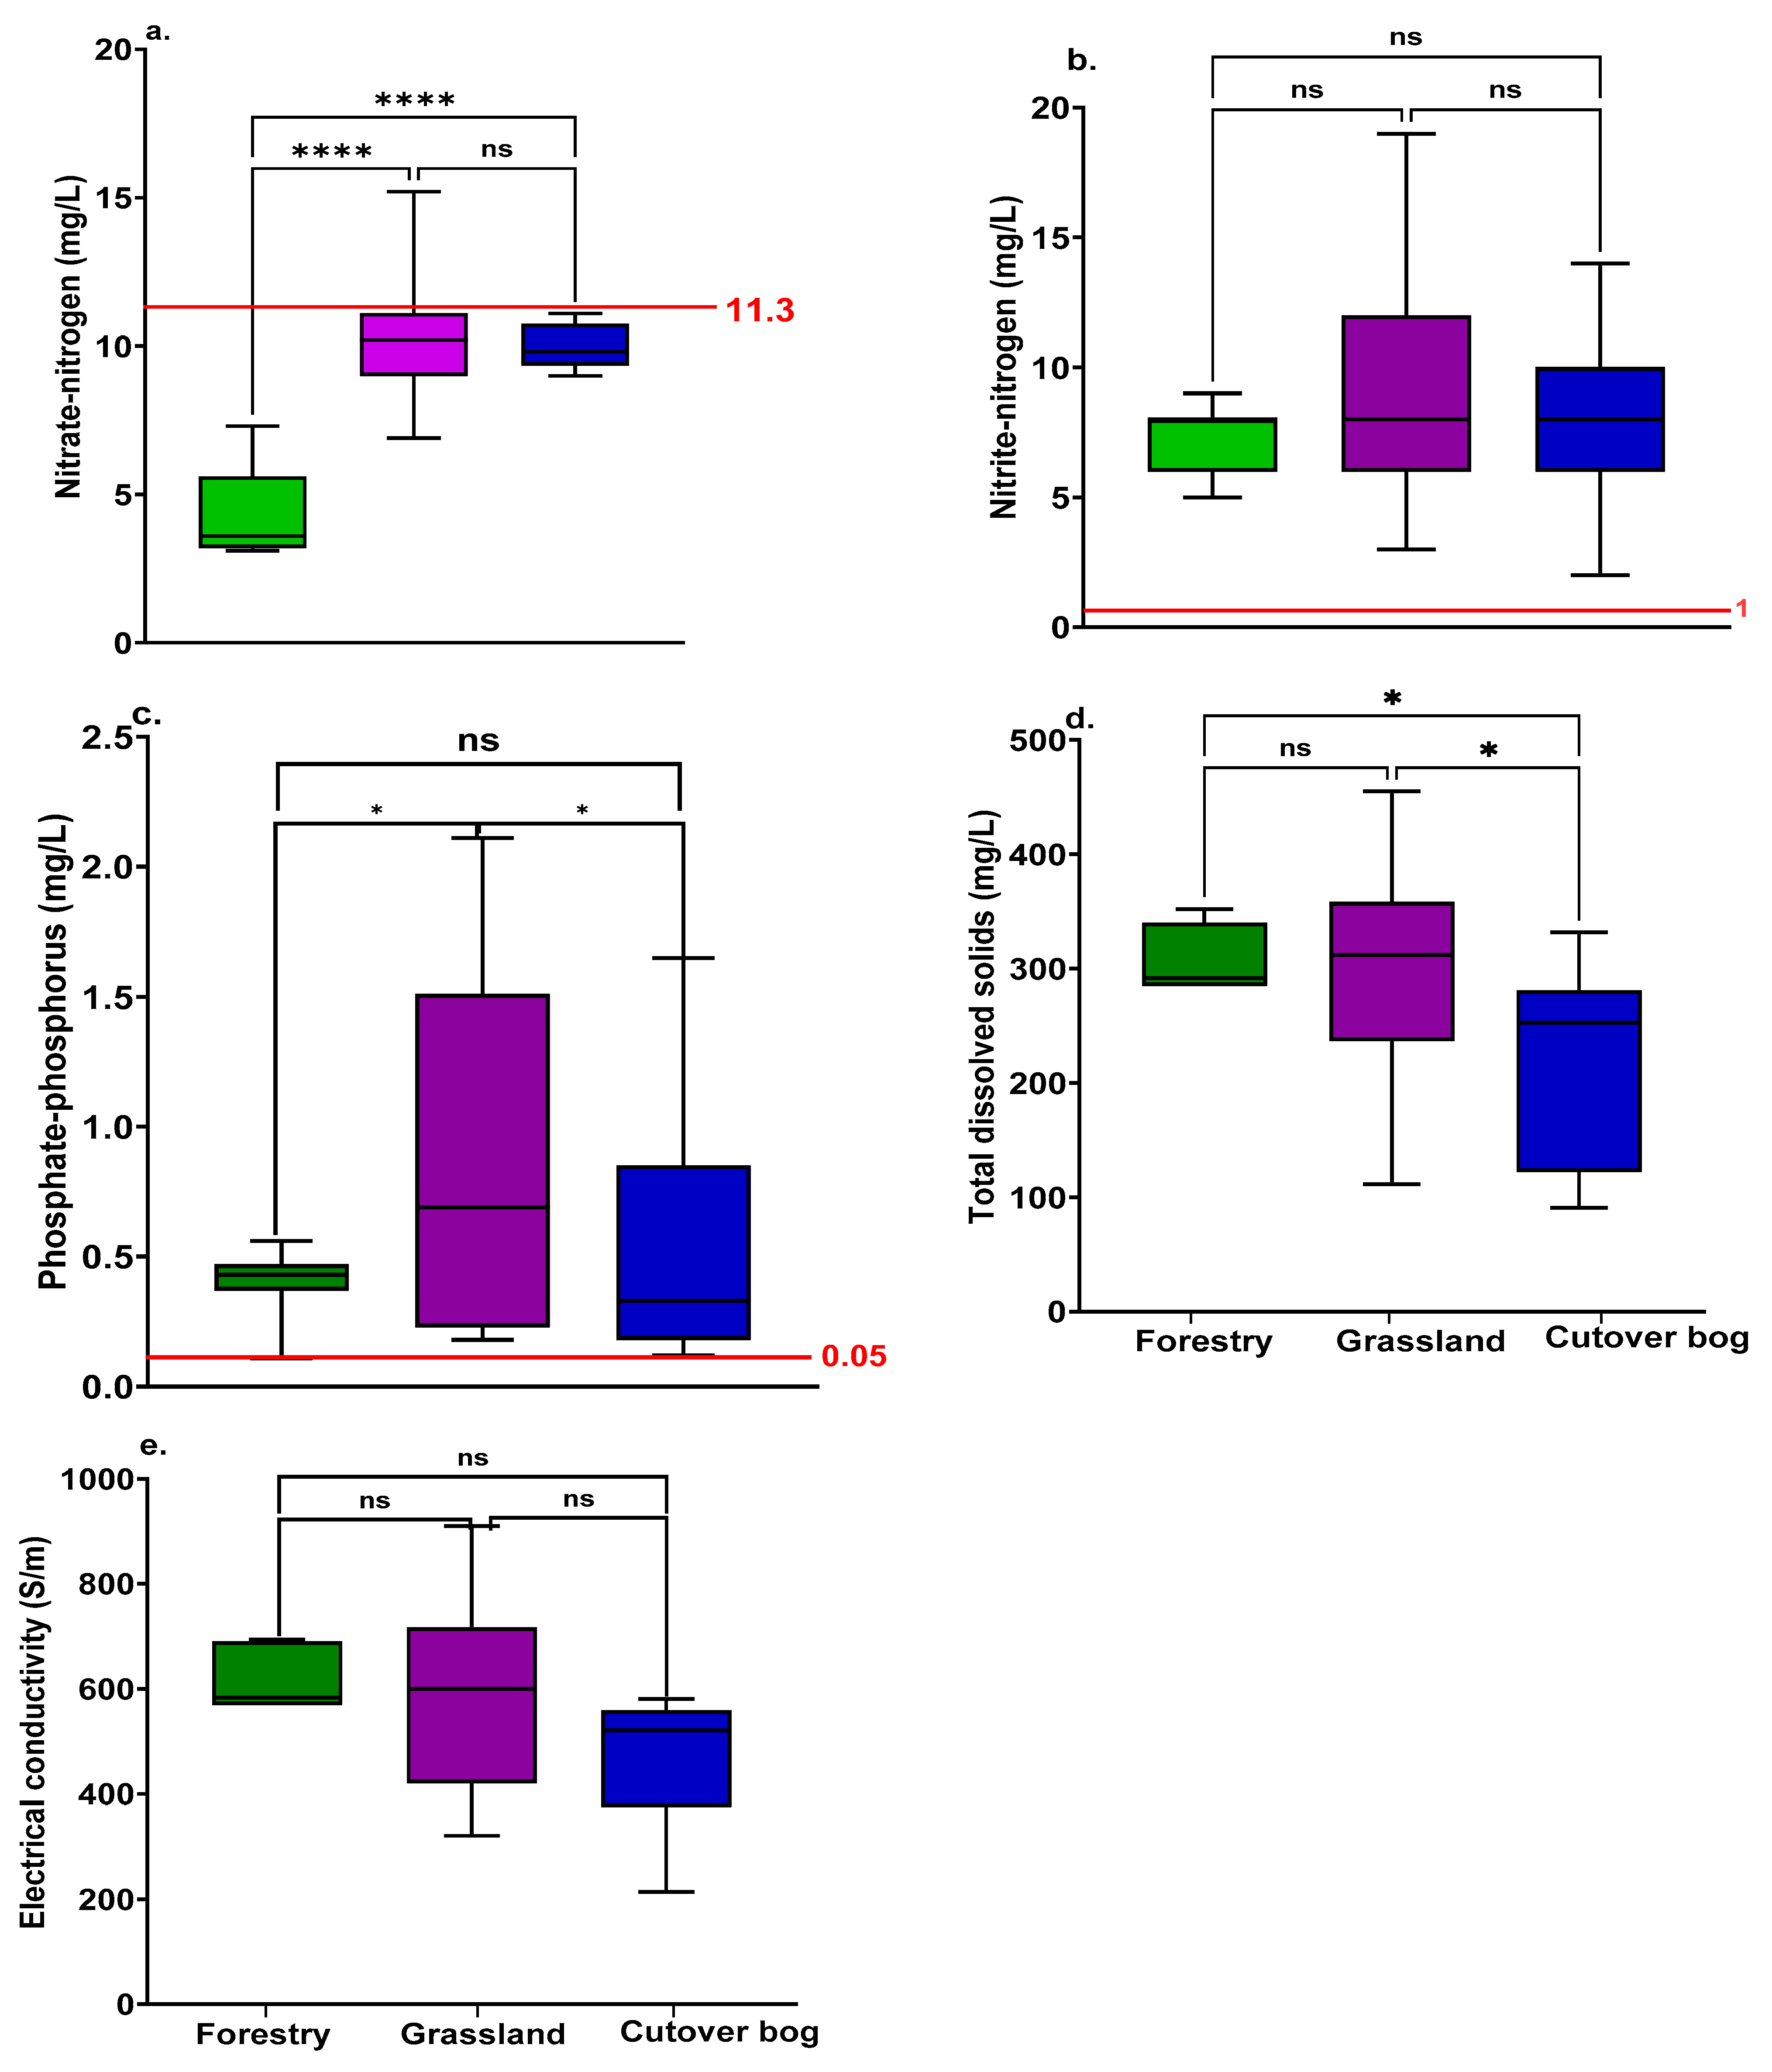
3.1. Nutrient Concentration (Nitrite, Nitrate–Nitrogen, and Phosphate–Phosphorus), Electrical Conductivity, and Total Dissolved Solids of Discharge Water from Ditch Networks of Altered Peatlands Ecosystems

The mean and the standard deviation for nitrate–nitrogen and phosphate–phosphorus of the discharge water from the ditch networks of peatlands are presented in Table 1. The nitrate–nitrogen was between 3.1 mg/L and 15.2 mg/L, with a mean value of 9.05 mg/L. Compared with other research, our results exhibited a relatively higher nitrate–nitrogen concentration in discharge water from ditch networks. For instance, Lambert et al. [15] reported a nitrate–nitrogen concentration between 1.2 and 2.82 mg/L within 5 m of a ditch network. The nitrate–nitrogen concentration of the discharged water was below the NMPC in surface water, which may reach lakes or reservoirs recommended by the European Union (EU).
The nitrite–nitrogen concentration was between 2 mg/L and 19 mg/L, with a mean of 8.03 mg/L, exceeding the maximum permissible limits according to WHO standards for surface water entering streams [37]. The phosphate–phosphorus in the discharge water ranged from 0.03 mg/L to 2.11 mg/L, with a mean value of 0.59 mg/L. The phosphate–phosphorus concentrations in the discharge water exceeded the PMPC for surface water that enters streams provided by the USEPA [31]. Peatland degradation often leads to the mineralization of organic phosphorus compounds, which are subsequently absorbed onto Fe(III)-hydroxides, resulting in temporary immobilization [38], explaining why the phosphate–phosphorus exceeded the PMPC.
The assessment of electrical conductivity indicates the presence of ions, encompassing the measurement of total dissolved solids and ionized species within aquatic environments [39]. The electrical conductivity of the discharge water of the altered peatland was between 213 μS/cm and 910 μS/cm, with a mean value of 532.76 μS/cm, while the total dissolved solids ranged between 90 mg/L and 455 mg/L, with a mean value of 272.57 mg/L (Table 1). The electrical conductivity result obtained in this current study was higher than the results (26.4 to 48.4 μS/cm) found by Walpen [40] in porewater for ombrotrophic bogs. The coefficient of variation (CV) is a useful statistic for determining the spatial variability of the discharge [41]. The phosphate–phosphorus exhibited the highest CV, followed by nitrite–nitrogen, nitrate–nitrogen, total dissolved solids, and electrical conductivity (Table 1).

3.2. Nutrient Concentration (Nitrite–Nitrogen, Nitrate–Nitrogen, and Phosphate–Phosphorus), Electrical Conductivity and Total Dissolved Solids of Discharge Water from Ditch Networks under Different Peatland Use Types

The nitrate–nitrogen concentration differed significantly among the forestry, grassland, and cutover bog. The nitrate–nitrogen concentration ranged from 6.9 mg/L to 10.52 mg/L, with the lowest and the highest values observed by the forestry and the grassland, respectively (Figure 3a). The nitrate–nitrogen levels that the grassland and cutover bog exhibited did not differ significantly (p > 0.05). The nitrate–nitrogen concentration in the discharge water from the cutover bog varied between 6.9 mg/L and 14.2 mg/L, with a mean value of 10.0 mg/L. The grassland areas under investigation frequently experience agricultural practices, including the application of synthetic or organic fertilizers [42]. For instance, net nitrogen (N) mineralization rates of 360 kg N ha−1 have been observed in peatlands that have undergone extensive drainage and are utilized for intensive grassland purposes [43]. Consequently, these conditions have resulted in nitrogen losses of up to 135 kg NO3 N ha−1 [44]. These practices can result in high levels of nitrate–nitrogen in the soil, which leach into ditches and surface waters through runoff and drainage.
On the contrary, implementing forestry practices in degraded peatlands often entails reduced nitrogen inputs, albeit some nitrogen deposition from atmospheric sources may still occur [45]. However, the nitrogen inputs in this context are typically lower than those associated with agricultural activities. Therefore, the potential explanation for the observed high nitrate–nitrogen concentration in the discharge water from the ditch networks in the grassland system could be attributed to the nitrogen supply through fertilization in addition to the drainage effects.
The nitrite–nitrogen concentration did not differ significantly among the forestry, grassland, and cutover bog (Figure 3b). The water in the grassland ditch network exhibited nitrite–nitrogen concentrations between 3 mg/L and 19 mg/L, with a mean value of 9 mg/L (Figure 3b), whereas the cutover bog and forestry exhibited nitrite–nitrogen concentrations of 8 mg/L and 9 mg/L, respectively. The nitrite–nitrogen concentration recorded under the different peatland use types exceeded the maximum acceptable concentrations of nitrite–nitrogen concentration (0.9 mg/L) for drinking water or surface water that enters streams proposed by WHO [37].
The mean phosphate–phosphorus concentration ranged from 0.43 mg/L by the forestry to 0.78 mg/L by the grassland. The phosphate–phosphorus concentration of the cutover did not differ significantly from that of the forestry, as it measured a mean value of 0.56 mg/L (Figure 3c). The high phosphate–phosphorus concentration observed in the discharge water from grassland ditch networks compared with cutover and forestry areas can be attributed to both the mineralization of peat resulting from drainage activities and the application of fertilizers as part of grassland management practices aimed at enhancing productivity. The activities (peat extraction) carried out on the cutover bog did not increase the phosphate–phosphorus and nitrate–nitrogen concentration of the discharge water in the ditch network compared with the grassland.
The mean total dissolved solids ranged from 223.48 mg/L to 299.44 mg/L, with the lowest and highest levels exhibited by cutover and grassland, respectively. The forestry showed total dissolved solids of 283.85 mg/L, which did not differ significantly from the grassland (Figure 3d). The grassland regions have fertilizers, pesticides, and other chemical substances introduced, which can potentially increase the total dissolved solid (TDS) concentration in surface water runoff from the ditch network. The significance of these inputs may be greater in grassland regions than in the cutover bog, where such inputs are limited. Like the nitrite–nitrogen, the electrical conductivity did not differ significantly among the forestry, cutover, and grassland (Figure 3e).

3.3. Nutrient Pollution Index (NPI) of Discharge Water from Ditch Networks under Different Peatland Use

The nutrient pollution index (NPI) was used to assess the overall quality of nutrient concentrations in surface water, specifically nitrate–nitrogen and phosphate–phosphorus [30]. All the discharge water from the ditch networks across the studied peatland use type was highly polluted (Table 2), implying that when discharged water enters water bodies through runoff, it has the potential to induce eutrophication [46]. The symptoms of eutrophication exhibit variability across various types of water bodies. However, the primary sources of public concern are the excessive proliferation of aquatic weeds and phytoplankton, resulting in murky waters, the occurrence of harmful and toxic algal blooms, and the subsequent impacts on fish populations [47].

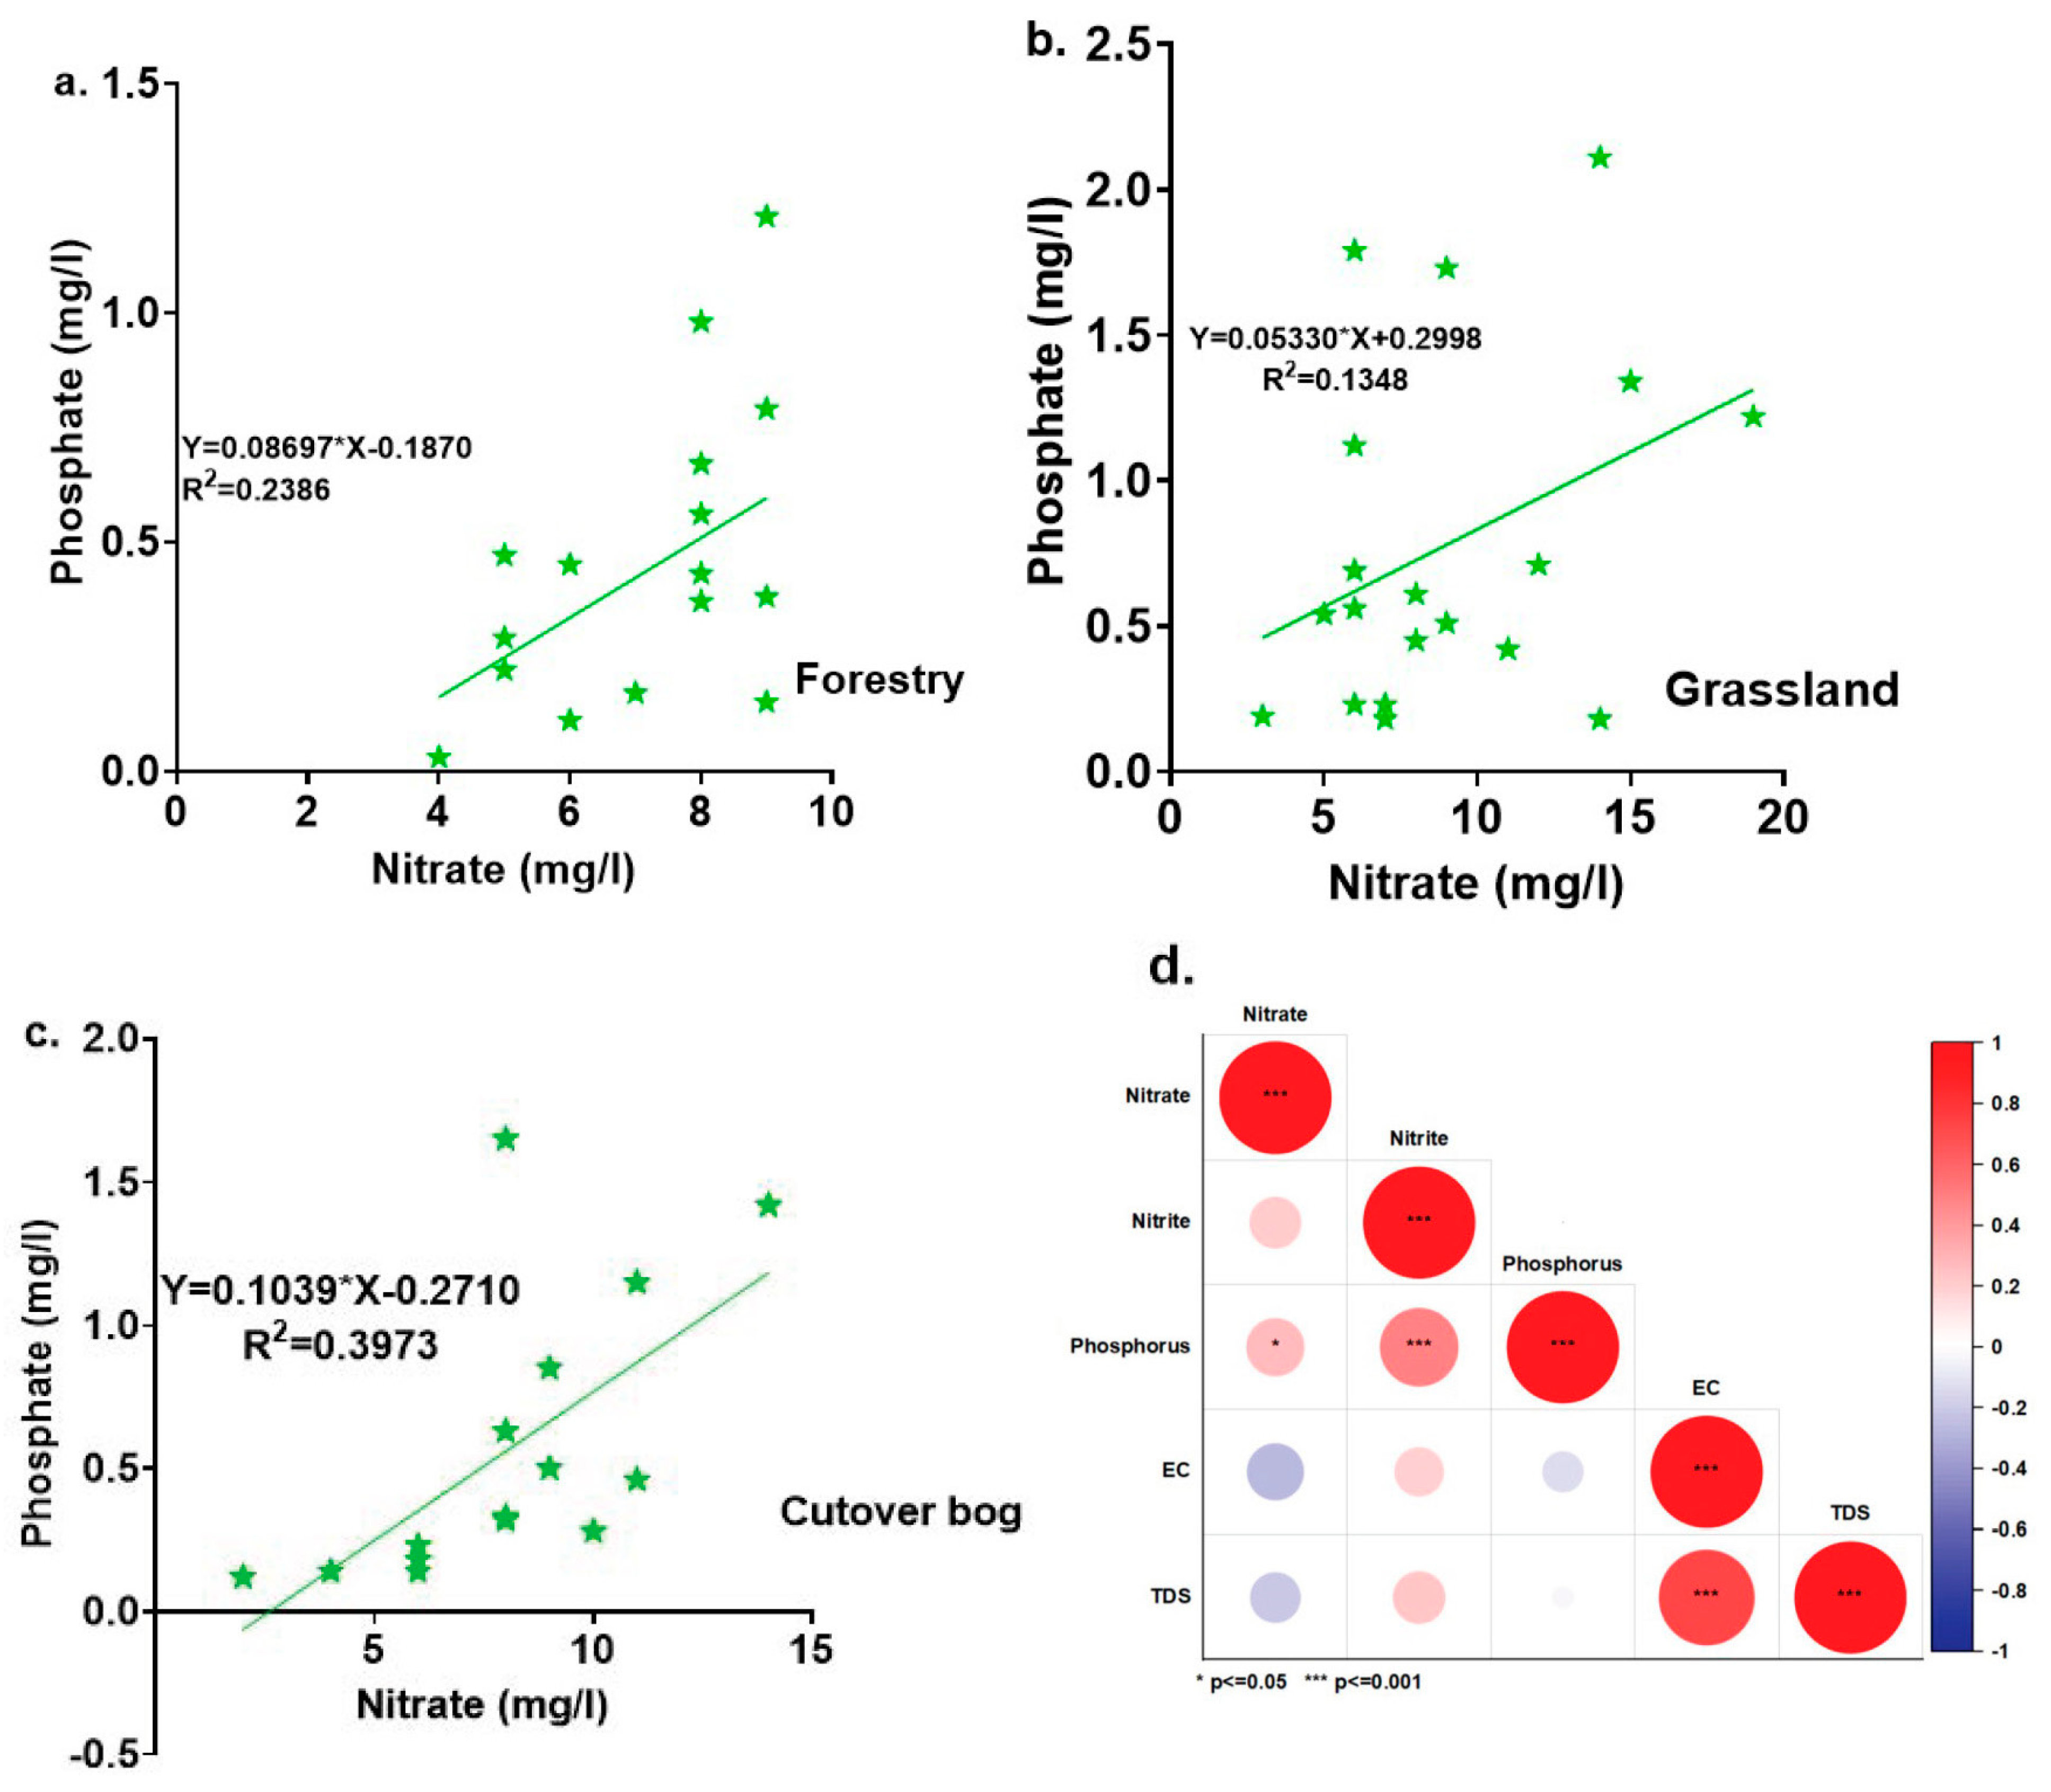
3.4. Correlation and Principal Component Analysis

The relationship between the nitrate–nitrogen and phosphate–phosphorus concentration of the discharge water from the ditch networks of the degraded peatland was examined using linear regression analysis (Figure 4). The linear relationship classification system was to help researchers and analysts determine the strength and direction of linear associations between factors. The linear classification systems are the following: (1). R2 = 0 indicates no linear relationship between variables; (2). R2 values between 0 and 0.40 indicate a weak positive linear relationship; (3). R2 values between 0.40 and 0.80 indicate a moderate positive linear relationship; (4). R2 value of between 0.80 and +1 indicates a strong positive linear relationship. In our study, nitrate–nitrogen and phosphate–phosphorus concentrations of the discharge water from ditch networks of the forestry (Figure 4a), grassland (Figure 4b) and cutover (Figure 4c) were weakly positive, with an R2 value greater than 0.135 indicating similar contamination sources for the peatland use types [30].
The Pearson correlation was also used to identify the interrelationship between phosphate (phosphate–phosphorus), nitrate (nitrate–nitrogen), nitrite (nitrite–nitrogen), total dissolved solids (TDSs) and electrical conductivity (EC), and the results are presented in Figure 4d. The TDS exhibited an insignificant negative correlation with nitrate–nitrogen (r = −0.21, p > 0.05) and phosphate–phosphorus (r = −0.04, p > 0.05) and a significant positive correlation with EC (r = 0.73, p < 0.05) (Figure 4d). EC had an insignificant negative correlation with nitrate–nitrogen (r = −0.26, p > 0.05) and phosphate–phosphorus (r = −0.14, p < 0.05) and an insignificant positive correlation with nitrite–nitrogen (r = 0.20, p > 0.05) (Figure 4d).
The scree plot in Figure 5a showed that the first five dimensions represented data variability, with the first two dimensions with an eigenvalue greater than one accounting for 72% of the total variation. The first dimension explained 38.4% of variance, with the data variation described by the nitrite (nitrite–nitrogen), total dissolved solids, and electrical conductivity. The grouping of the TDS and EC indicates their interconnectedness. The linear relationship between TDS and EC can (Figure 5b,d) be attributed to the presence of charged ionic species in solution. Therefore, as the concentration of dissolved ions increases, so does the water’s electrical conductivity [48]. However, the relationship can become non-linear at high TDS concentrations due to ion-pair formation and non-ionized solutes [49]. The second dimension accounted for a variance of 33.4%, indicating that the variation in the data was primarily influenced by nitrate (nitrate–nitrogen) and phosphate (phosphate–phosphorus) (Figure 5b,d). The coordinates of the quantitative variables revealed that the primary factors contributing to the variation in the first dimension were EC and TDS. Conversely, the variation in the second dimension was more effectively accounted for by nitrite–nitrogen and phosphate–phosphorus (Figure 5c).
Our study revealed substantial nutrient pollution in the discharge water from ditch networks in different peatland use types. Upon comparing the results with the safety limits established by the European Union (EU) and the World Health Organization (WHO), it became clear that the levels of phosphate–phosphorus and nitrite–nitrogen in the surface water exceeded the acceptable thresholds for surface water quality. This signifies a concerning level of nutrient pollution, which can have detrimental effects on aquatic ecosystems and water quality. The nutrient pollution index revealed that the discharged water exhibited significant pollution, with the level of pollution varying depending on the type of land use. Grasslands showed the highest levels of nutrient pollution, followed by cutover bogs and then forestry areas. This trend indicates that specific land use has a significant impact on the amount of nutrients that are released into nearby water bodies. The nutrient concentrations in discharge water were most significantly affected by grasslands, possibly as a result of agricultural practices and the application of fertilizers. Cutover bogs, which are either being restored or abandoned, also make a significant contribution to nutrient pollution, although to a lesser degree than grasslands. Among the various types of land use studied, forestry areas demonstrated the lowest levels of nutrient pollution, although they still made a contribution.

3.5. Sustainable Management

To mitigate nitrate and phosphate pollution in surface water discharging from drainage channels under the studied peatland use types, the implementation of Best Management Practices (BMPs) specific to each land use type and policies is essential. In the forested peatland, establishing controlled buffer zones along drainage channels minimizes nutrient runoff into the ditches by filtering and retaining nutrients before reaching the ditches through surface runoff [50,51,52]. For grasslands, adopting precision nutrient management through soil testing and application of fertilizers based on grass species requirements can significantly reduce excessive application of fertilizers, reducing nutrients from leaching into the drainage channels [53]. Meanwhile, implementing rotational grazing practices can prevent overgrazing and maintain vegetation cover, which aids in nutrient retention and minimizes soil erosion [54,55].
Additionally, the implementation of targeted conservation and restoration programs can help rehabilitate these peatlands, specifically, the improved grassland and the industrial cutaway bog, enhancing their natural capacity to filter nutrients. To address the specific issue of ditches contributing to nutrient discharge, a policy directive could involve the strategic blocking of ditches [1,56,57]. This can impede the direct transport of nitrate and phosphate into surface waters, promoting the retention and filtration of nutrients within the peatland ecosystem [58].
Public awareness campaigns and stakeholder engagement are vital components of any successful strategy, fostering collective responsibility for peatland conservation [59]. Collaborative efforts between government agencies, industries, and local communities are necessary to ensure the effective implementation of these strategies [60]. By integrating these policies and strategies, a multifaceted approach can be adopted to reduce or halt nitrate and phosphate pollution, ultimately preserving the ecological integrity of peatlands and surface water bodies.

4. Conclusions and Recommendations

This study comprehensively evaluated the concentration levels of nitrate–nitrogen and phosphate–phosphorus in discharge water from ditch networks in various peatland use types, including grassland, forestry, and cutover. The water samples from the grassland ditch network exhibited the highest levels of nitrate–nitrogen and phosphate–phosphorus due to the grassland management practices, including the application of synthetic or organic fertilizers, followed by cutover and forestry, respectively. Comparing the obtained results for the phosphate–phosphorus and nitrite–nitrogen with the EU and WHO established limits for surface water quality, it was evident that the concentrations of phosphate–phosphorus and nitrite–nitrogen in the discharge water exceeded the permissible thresholds across the studied peatland use types. Also, this study showed that the discharge water from the ditch networks across the studied peatland use type was highly polluted based on the NPI, implying that when this discharged water enters water bodies through runoff, it has the potential to induce eutrophication.
To reduce nitrate and phosphate pollution in surface water discharged from drainage channels in forested peatland, controlled buffer zones along drainage channels can be established to minimize nutrient runoff into ditches. Precision nutrient management and rotational grazing practices in grasslands can prevent overgrazing while also maintaining vegetation cover, which aids in nutrient retention and reduces soil erosion. Sustainable land management practices are essential for maintaining the ecological health of peatlands, improving water quality, and contributing to the achievement of the global challenges that we face for sustainability.
While the study on “nitrate and phosphate concentration of discharge water from ditch networks under different temperate peatland use types” provided valuable insights into the nutrient dynamics of peatland discharge water, the temporal scale of the measurements may not fully capture seasonal variations that can have a significant impact on nutrient flux. Nitrate and phosphate levels can vary greatly between seasons due to temperature, precipitation, vegetation growth cycles, and agricultural practices. To gain a more comprehensive understanding of nutrient dynamics in peatland discharge waters, long-term monitoring is recommended.

Author Contributions

Conceptualization, S.O.A.; methodology, S.O.A.; software, S.O.A.; validation, S.O.A.; formal analysis, S.O.A.; investigation, S.O.A.; resources, writing—original draft preparation, S.O.A.; writing—review and editing, S.O.A., J.D., M.G. and F.T.; supervision, J.D., M.G. and F.T.; project administration, F.T. All authors have read and agreed to the published version of the manuscript.

Funding

This research received no external funding.

Institutional Review Board Statement

The study was conducted in accordance with the Declaration of Technological University Dublin and was approved by the Institutional Review Board of Technological University Dublin (protocol code REIC-21-229, approval date: 27 October 2022). It is important to note that this study does not involve animals or human subjects.

Informed Consent Statement

Not applicable.

Data Availability Statement

The data presented in this study are available in this published paper.

Conflicts of Interest

The authors declare that the research was conducted in the absence of any commercial or financial relationships that could be construed as a potential conflict of interest.

References

  1. Apori, S.O.; Mcmillan, D.; Giltrap, M.; Tian, F. Mapping the Restoration of Degraded Peatland as a Research Area: A Scientometric Review. Front. Environ. Sci. 2022, 10, 942788. [Google Scholar] [CrossRef]
  2. Hergoualc’h, K.; Verchot, L.V. Greenhouse Gas Emission Factors for Land Use and Land-Use Change in Southeast Asian Peatlands. Mitig. Adapt. Strateg. Glob. Chang. 2014, 19, 789–807. [Google Scholar] [CrossRef]
  3. Limpens, J.; Berendse, F.; Blodau, C.; Canadell, J.G.; Freeman, C.; Holden, J.; Roulet, N.; Rydin, H.; Schaepman-Strub, G. Peatlands and the Carbon Cycle: From Local Processes to Global Implications—A Synthesis. Biogeosciences 2008, 5, 1475–1491. [Google Scholar] [CrossRef]
  4. Tarnocai, C.; Stolbovoy, V. Northern Peatlands: Their Characteristics, Development and Sensitivity to Climate Change. Dev. Earth Surf. Process. 2006, 9, 17–51. [Google Scholar]
  5. Holden, J.; Chapman, P.J.; Labadz, J.C. Artificial Drainage of Peatlands: Hydrological and Hydrochemical Process and Wetland Restoration. Prog. Phys. Geogr. 2004, 28, 95–123. [Google Scholar] [CrossRef]
  6. Kalisz, B.; Lachacz, A.; Glazewski, R. Effects of Peat Drainage on Labile Organic Carbon and Water Repellency in NE Poland. Turk. J. Agric. For. 2015, 39, 20–27. [Google Scholar] [CrossRef]
  7. Renou-Wilson, F.; Barry, C.; Müller, C.; Wilson, D. The Impacts of Drainage, Nutrient Status and Management Practice on the Full Carbon Balance of Grasslands on Organic Soils in a Maritime Temperate Zone. Biogeosciences 2014, 11, 4361–4379. [Google Scholar] [CrossRef]
  8. Serafin, A.; Pogorzelec, M.; Bronowicka-Mielniczuk, U. The Influence of Shallow Peatland Water Quality on Characteristics of the Occurrence of Selected Herb Species in the Peatlands of Eastern Poland. Int. J. Environ. Res. Public Health 2023, 20, 2788. [Google Scholar] [CrossRef] [PubMed]
  9. Marttila, H.; Karjalainen, S.-M.; Kuoppala, M.; Nieminen, M.L.; Ronkanen, A.-K.; Kløve, B.; Hellsten, S. Elevated Nutrient Concentrations in Headwaters Affected by Drained Peatland. Sci. Total Environ. 2018, 643, 1304–1313. [Google Scholar] [CrossRef] [PubMed]
  10. Kreutzweiser, D.P.; Hazlett, P.W.; Gunn, J.M. Logging Impacts on the Biogeochemistry of Boreal Forest Soils and Nutrient Export to Aquatic Systems: A Review. Environ. Rev. 2008, 16, 157–179. [Google Scholar] [CrossRef]
  11. Minayeva, T.Y.; Bragg, O.; Sirin, A.A. Towards Ecosystem-Based Restoration of Peatland Biodiversity. Mires Peat 2017, 19, 1–36. [Google Scholar]
  12. Macrae, M.L.; Devito, K.J.; Strack, M.; Waddington, J.M. Effect of Water Table Drawdown on Peatland Nutrient Dynamics: Implications for Climate Change. Biogeochemistry 2013, 112, 661–676. [Google Scholar] [CrossRef]
  13. Wang, S.; Fan, H.; He, H.; Tang, L.; Tao, X. Effect of Particle Shape and Roughness on the Hydrophobicity of Low-Rank Coal Surface. Int. J. Coal Prep. Util. 2020, 40, 876–891. [Google Scholar] [CrossRef]
  14. Xu, F.; Wang, S.; Kong, R.; Wang, C. Synergistic Effects of Dodecane-Castor Oil Acid Mixture on the Flotation Responses of Low-Rank Coal: A Combined Simulation and Experimental Study. Int. J. Min. Sci. Technol. 2023, 33, 649–658. [Google Scholar] [CrossRef]
  15. Lambert, S.J.; Davy, A.J. Water Quality as a Threat to Aquatic Plants: Discriminating between the Effects of Nitrate, Phosphate, Boron and Heavy Metals on Charophytes. New Phytol. 2011, 189, 1051–1059. [Google Scholar] [CrossRef]
  16. Bali, M.; Gueddari, M. Removal of Phosphorus from Secondary Effluents Using Infiltration–Percolation Process. Appl. Water Sci. 2019, 9, 54. [Google Scholar] [CrossRef]
  17. Breitburg, D. Effects of Hypoxia, and the Balance between Hypoxia and Enrichment, on Coastal Fishes and Fisheries. Estuaries 2002, 25, 767–781. [Google Scholar] [CrossRef]
  18. Tiemeyer, B.; Frings, J.; Kahle, P.; Köhne, S.; Lennartz, B. A Comprehensive Study of Nutrient Losses, Soil Properties and Groundwater Concentrations in a Degraded Peatland Used as an Intensive Meadow–Implications for Re-Wetting. J. Hydrol. 2007, 345, 80–101. [Google Scholar] [CrossRef]
  19. Monaghan, R.M.; Paton, R.J.; Drewry, J.J. Nitrogen and Phosphorus Losses in Mole and Tile Drainage from a Cattle-grazed Pasture in Eastern Southland. N. Z. J. Agric. Res. 2002, 45, 197–205. [Google Scholar] [CrossRef]
  20. Joensuu, S.; Ahti, E.; Vuollekoski, M. Effects of Ditch Network Maintenance on the Chemistry of Run-off Water from Peatland Forests. Scand. J. For. Res. 2002, 17, 238–247. [Google Scholar] [CrossRef]
  21. Directive 2006/118/EC of the European Parliament and of the Council of 12 December 2006 on the Protection of Groundwater against Pollution and Deterioration; 2006; Volume 372. Available online: https://eur-lex.europa.eu/legal-content/EN/TXT/?uri=CELEX:32006L0118 (accessed on 15 January 2024).
  22. Directive-2000/60-EN-Water Framework Directive-EUR-Lex. Available online: https://eur-lex.europa.eu/eli/dir/2000/60/oj (accessed on 9 July 2024).
  23. Deshmukh, C.S.; Julius, D.; Evans, C.D.; Susanto, A.P.; Page, S.E.; Gauci, V.; Laurén, A.; Sabiham, S.; Agus, F.; Asyhari, A. Impact of Forest Plantation on Methane Emissions from Tropical Peatland. Glob. Chang. Biol. 2020, 26, 2477–2495. [Google Scholar] [CrossRef] [PubMed]
  24. Obeng, A.S.; Dunne, J.; Giltrap, M.; Tian, F. Soil Organic Matter Carbon Chemistry Signatures, Hydrophobicity and Humification Index Following Land Use Change in Temperate Peat Soils. Heliyon 2023, 9, e19347. [Google Scholar] [CrossRef] [PubMed]
  25. Rochefort, L. Management of the Margins in Cutover Bogs: Ecological Conditions and Effects of Afforestation. Wetl. Ecol. Manag. 2017, 25, 177–190. [Google Scholar]
  26. Hammond, R.F.; Brennan, L.E. Soils of Co. Offaly. Soil Surv. Bull. 2003, 43, 1–186. [Google Scholar]
  27. Creamer, R.; O’Sullivan, L. The Soils of Ireland; Springer: Berlin/Heidelberg, Germany, 2018; pp. 1–299. [Google Scholar]
  28. Fadiran, A.O.; Dlamini, S.C.; Mavuso, A. A Comparative Study of the Phosphate Levels in Some Surface and Ground Water Bodiesof Swaziland. Bull. Chem. Soc. Ethiop. 2008, 22, 197–206. [Google Scholar] [CrossRef]
  29. Landaverde, A.C.; Shreckhise, J.H.; Altland, J.E. Storage Procedures Affect pH, Electrical Conductivity, and Nutrient Concentrations of Pour-through Leachate from Pine Bark and Peat-Based Substrates. HortScience 2020, 55, 1597–1604. [Google Scholar] [CrossRef]
  30. Isiuku, B.O.; Enyoh, C.E. Pollution and Health Risks Assessment of Nitrate and Phosphate Concentrations in Water Bodies in South Eastern, Nigeria. Environ. Adv. 2020, 2, 100018. [Google Scholar] [CrossRef]
  31. Book, E.G. Quality Criteria for Water; American Fisheries Society: Bethesda, MD, USA, 1986; Volume 464, p. 465. [Google Scholar]
  32. Home—GraphPad. Available online: https://www.graphpad.com/ (accessed on 27 January 2024).
  33. R Core Team. R: A Language and Environment for Statistical Computing; R Foundation for Statistical Computing; R Core Team: Vienna, Austria, 2010; ISBN 978-3-900051-07-5. [Google Scholar]
  34. Kassambara, A. Practical Guide to Principal Component Methods in R: PCA, M (CA), FAMD, MFA, HCPC, Factoextra; Sthda: Online, 2017; ISBN 978-1-975721-13-8. [Google Scholar]
  35. Vincent, Q.V. Ggbiplot: A Ggplot2 Based Biplot, R Package Version; R Core Team: Vienna, Austria, 2011. [Google Scholar]
  36. OriginPro Learning Edition. Available online: https://www.originlab.com/OriginProLearning.aspx (accessed on 22 March 2024).
  37. World Health Organization. Nitrate and Nitrite in Drinking-Water: Background Document for Development of WHO Guidelines for Drinking-Water Quality; World Health Organization: Geneva, Switzerland, 2003. [Google Scholar]
  38. Zak, D.; Gelbrecht, J.; Steinberg, C.E.W. Phosphorus Retention at the Redox Interface of Peatlands Adjacent to Surface Waters in Northeast Germany. Biogeochemistry 2004, 70, 357–368. [Google Scholar] [CrossRef]
  39. Jonnalagadda, S.B.; Mhere, G. Water Quality of the Odzi River in the Eastern Highlands of Zimbabwe. Water Res. 2001, 35, 2371–2376. [Google Scholar] [CrossRef] [PubMed]
  40. Walpen, N.; Getzinger, G.J.; Schroth, M.H.; Sander, M. Electron-Donating Phenolic and Electron-Accepting Quinone Moieties in Peat Dissolved Organic Matter: Quantities and Redox Transformations in the Context of Peat Biogeochemistry. Environ. Sci. Technol. 2018, 52, 5236–5245. [Google Scholar] [CrossRef] [PubMed]
  41. Ozgoz, E.; Gunal, H.; Acir, N.; Gokmen, F.; Birol, M.; Budak, M. Soil Quality and Spatial Variability Assessment of Land Use Effects in a Typic Haplustoll. Land Degrad. Dev. 2013, 24, 277–286. [Google Scholar] [CrossRef]
  42. Smith, K.A.; McTaggart, I.P.; Tsuruta, H. Emissions of N2O and NO Associated with Nitrogen Fertilization in Intensive Agriculture, and the Potential for Mitigation. Soil Use Manag. 1997, 13, 296–304. [Google Scholar] [CrossRef]
  43. Okruszko, H. Wirkung der Bodennutzung auf die Niedermoorbodenentwicklung. Ergebnisse eines langjährigen Feldversuches. Z. Kulturtech. Landentwickl. 1989, 30, 167–176. [Google Scholar]
  44. Behrendt, A.; Mundel, G.; Schalitz, G.; Hölzel, D. Jahre Lysimeterforschung in Paulinenaue Und Neukonzipierung Der Untersuchungen 1992. ZALF-Berichte 1996, 26, 6–27. [Google Scholar]
  45. Corre, M.D.; Beese, F.O.; Brumme, R. Soil Nitrogen Cycle in High Nitrogen Deposition Forest: Changes under Nitrogen Saturation and Liming. Ecol. Appl. 2003, 13, 287–298. [Google Scholar] [CrossRef]
  46. Withers, P.J.; Neal, C.; Jarvie, H.P.; Doody, D.G. Agriculture and Eutrophication: Where Do We Go from Here? Sustainability 2014, 6, 5853–5875. [Google Scholar] [CrossRef]
  47. Janse, J.H.; Van Puijenbroek, P.J. Effects of Eutrophication in Drainage Ditches. In Nitrogen, the Confer-Ns; Elsevier: Amsterdam, The Netherlands, 1998; pp. 547–552. [Google Scholar]
  48. Iyasele, J.U.; Idiata, D.J. Investigation of the Relationship between Electrical Conductivity and Total Dissolved Solids for Mono-Valent, Di-Valent and Tri-Valent Metal Compounds. Int. J. Eng. Res. Rev. 2015, 3, 40–48. [Google Scholar]
  49. Rebello, L.R.B.; Siepman, T.; Drexler, S. Correlations between TDS and Electrical Conductivity for High-Salinity Formation Brines Characteristic of South Atlantic Pre-Salt Basins. Water SA 2020, 46, 602–609. [Google Scholar]
  50. Herzon, I.; Helenius, J. Agricultural Drainage Ditches, Their Biological Importance and Functioning. Biol. Conserv. 2008, 141, 1171–1183. [Google Scholar] [CrossRef]
  51. Strock, J.S.; Kleinman, P.J.; King, K.W.; Delgado, J.A. Drainage Water Management for Water Quality Protection. J. Soil Water Conserv. 2010, 65, 131A–136A. [Google Scholar] [CrossRef]
  52. Kumwimba, M.N.; Meng, F.; Iseyemi, O.; Moore, M.T.; Zhu, B.; Tao, W.; Liang, T.J.; Ilunga, L. Removal of Non-Point Source Pollutants from Domestic Sewage and Agricultural Runoff by Vegetated Drainage Ditches (VDDs): Design, Mechanism, Management Strategies, and Future Directions. Sci. Total Environ. 2018, 639, 742–759. [Google Scholar] [CrossRef] [PubMed]
  53. Higgins, S.; Schellberg, J.; Bailey, J.S. Improving Productivity and Increasing the Efficiency of Soil Nutrient Management on Grassland Farms in the UK and Ireland Using Precision Agriculture Technology. Eur. J. Agron. 2019, 106, 67–74. [Google Scholar] [CrossRef]
  54. Eaton, D.P.; Santos, S.A.; Santos, M.D.C.A.; Lima, J.V.B.; Keuroghlian, A. Rotational Grazing of Native Pasturelands in the Pantanal: An Effective Conservation Tool. Trop. Conserv. Sci. 2011, 4, 39–52. [Google Scholar] [CrossRef]
  55. Jacobo, E.J.; Rodríguez, A.M.; Bartoloni, N.; Deregibus, V.A. Rotational Grazing Effects on Rangeland Vegetation at a Farm Scale. Rangel. Ecol. Manag. 2006, 59, 249–257. [Google Scholar] [CrossRef]
  56. Howie, S.A.; Whitfield, P.H.; Hebda, R.J.; Munson, T.G.; Dakin, R.A.; Jeglum, J.K. Water Table and Vegetation Response to Ditch Blocking: Restoration of a Raised Bog in Southwestern British Columbia. Can. Water Resour. J. 2009, 34, 381–392. [Google Scholar] [CrossRef]
  57. Armstrong, A.; Holden, J.; Kay, P.; Francis, B.; Foulger, M.; Gledhill, S.; McDonald, A.T.; Walker, A. The Impact of Peatland Drain-Blocking on Dissolved Organic Carbon Loss and Discolouration of Water; Results from a National Survey. J. Hydrol. 2010, 381, 112–120. [Google Scholar] [CrossRef]
  58. Peacock, M.; Jones, T.G.; Airey, B.; Johncock, A.; Evans, C.D.; Lebron, I.; Fenner, N.; Freeman, C. The Effect of Peatland Drainage and Rewetting (Ditch Blocking) on Extracellular Enzyme Activities and Water Chemistry. Soil Use Manag. 2015, 31, 67–76. [Google Scholar] [CrossRef]
  59. Fleming, A.; Agrawal, S.; Fransisca, Y.; Graham, L.; Lestari, S.; Mendham, D.; O’Connell, D.; Paul, B.; Po, M.; Rawluk, A. Reflections on Integrated Research from Community Engagement in Peatland Restoration. Humanit. Soc. Sci. Commun. 2021, 8, 199. [Google Scholar] [CrossRef]
  60. Lees, K.J.; Carmenta, R.; Condliffe, I.; Gray, A.; Marquis, L.; Lenton, T.M. Protecting Peatlands Requires Understanding Stakeholder Perceptions and Relational Values: A Case Study of Peatlands in the Yorkshire Dales. Ambio 2023, 52, 1282–1296. [Google Scholar] [CrossRef] [PubMed]
Figure 1. Location of the study area in the Republic of Ireland [27].
Sustainability 16 06463 g001
Figure 2. Weather characteristics of Co-Offaly. (Weather data downloaded from https://power.larc.nasa.gov/ (accessed on 1 February 2024)).
Sustainability 16 06463 g002
Figure 3. Peatland use type on discharge water chemistry: nitrate–nitrogen (a), nitrite–nitrogen (b), phosphate–phosphorus (c), total dissolve solute (d), and electrical conductivity (e); ns—non-significant; * p ≤ 0.05; **** p ≤ 0.0001 using Tukey HSD at the 0.05 significance level; boxes represent the interquartile range; whiskers indicate the minimum and maximum values; horizontal line in the box indicates mean. The added line indicates the benchmark value above which there is pollution.
Sustainability 16 06463 g003
Figure 4. Relationship between nitrate–nitrogen (x) and phosphate–phosphorus (y) concentrations in discharge water from ditch networks of forestry (a), grassland (b), and cutover (c). Pearson correlation matrix of the studied chemical properties of the discharge water from the ditch networks (d). TDS = total dissolved solids, EC = electrical conductivity, Phosphate = phosphate–phosphorus, Nitrate = nitrate–nitrogen, Nitrite = nitrite–nitrogen.
Sustainability 16 06463 g004
Figure 5. PCA of selected chemical properties of discharge water from ditch networks under different temperate peatland use types: (a) scree plot indicating the number of dimensions retained after PCA, (b) contribution of variable groups to the first two dimensions, and (c) plot of the contribution of variables to the first five dimensions for all measured chemical properties of the discharge water from ditch networks. The scale adjacent to the plot indicates the cos2 values of the corresponding variables. (d) Contribution of variables being categorized under different peatland use types to the first two dimensions for all the measured chemical properties of the discharge water from ditch networks. TDS = total dissolved solids, EC = electrical conductivity, Phosphate = phosphate-phosphorus, Nitrate = nitrate–nitrogen, Nitrite = nitrite–nitrogen.
Sustainability 16 06463 g005
Table 1. Nutrient concentrations (nitrate–nitrogen and phosphate–phosphorus) in ditchwater.
Descriptive StatisticsNitrite–Nitrogen
(mg/L)
Nitrate–Nitrogen
mg/L
Phosphate–Phosphorus
(mg/L)
Electrical Conductivity (EC) (μS/cm)Total Dissolved Solids (mg/L)
Mean8.029.050.59532.76272.57
SD3.132.940.49146.8377.10
Minimum2.013.100.03213.0490.80
Maximum19.0015.202.11910.02455.00
CV%39.0332.4983.0527.5628.29
MPC0.9011.300.05n.an.a
SD = standard deviation; CV(%) = coefficient of variation; Number of samples = 64; n.a = non-available; MPC = maximum permissible concentration for drinking water or surface water that enters streams [21,37].
Table 2. Nutrient pollution index of discharge water from ditch networks.
Land Use ChangeNPIRemark
Grassland16.53Very highly polluted
Forestry9.21Very highly polluted
Cutover bog12.08Very highly polluted
NPI values below 1 indicate no pollution, NPI values between 1 and 3 indicate moderate pollution, NPI values between 3 and 6 indicate considerable pollution, and NPI values above 6 indicate very high pollution [30].
Disclaimer/Publisher’s Note: The statements, opinions and data contained in all publications are solely those of the individual author(s) and contributor(s) and not of MDPI and/or the editor(s). MDPI and/or the editor(s) disclaim responsibility for any injury to people or property resulting from any ideas, methods, instructions or products referred to in the content.

