Article

Subsurface Drainage and Nitrogen Fertilizer Management Affect Fertilizer Fate in Claypan Soils

1
Harpreet Kaur: Statistical Programs, University of Idaho, Moscow, ID 83844, USA
2
Division of Plant Sciences, University of Missouri, Columbia, MO 65201, USA
*
Author to whom correspondence should be addressed.
Sustainability 2024, 16(15), 6477; https://doi.org/10.3390/su16156477 (registering DOI)
Submission received: 3 June 2024 / Revised: 25 July 2024 / Accepted: 26 July 2024 / Published: 29 July 2024
(This article belongs to the Section Environmental Sustainability and Applications)

Abstract

:
Sustainable nitrogen (N) fertilizer management practices in the Midwest U.S. strive to optimize crop production while minimizing N gas emission losses and nitrate-N (NO3-N) losses in subsurface drainage water. A replicated site in upstate Missouri from 2018 to 2020 investigated the influence of different N fertilizer management practices on nutrient concentrations in drainage water, nitrous oxide (N2O) emissions, and ammonia (NH3) volatilization losses in a corn (Zea mays, 2018, 2020)–soybean (Glyince max, 2019) rotation. Four N treatments applied to corn included fall anhydrous ammonia with nitrapyrin (fall AA + NI), spring anhydrous ammonia (spring AA), top dressed SuperU and ESN as a 25:75% granular blend (TD urea), and non-treated control (NTC). All treatments were applied to subsurface-drained (SD) and non-drained (ND) replicated plots, except TD urea, which was only applied with SD. Across the years, NO3-N concentration in subsurface drainage water was similar for fall AA + NI and spring AA treatments. The NO3-N concentration in subsurface drainage water was statistically (p < 0.0001) lower with TD urea (9.1 mg L−1) and NTC (8.9 mg L−1) compared to fall AA + NI (14.6 mg L−1) and spring AA (13.8 mg L−1) in corn growing years. During corn years (2018 and 2020), cumulative N2O emissions were significantly (p < 0.05) higher with spring AA compared to other fertilizer treatments with SD and ND. Reduced corn growth and plant N uptake in 2018 caused greater N2O loss with TD urea and spring AA compared to the NTC and fall AA + NI in 2019. Cumulative NH3 volatilization was ranked as TD urea > spring AA > fall AA + NI. Due to seasonal variability in soil moisture and temperature, gas losses were higher in 2018 compared to 2020. There were no environmental benefits to applying AA in the spring compared to AA + NI in the fall on claypan soils. Fall AA with a nitrification inhibitor is a viable alternative to spring AA, which maintains flexible N application timings for farmers.

1. Introduction

The corn (Zea mays L.) belt in the Midwest U.S. and central Canada is one of the world’s most important food-producing areas, with a large inherent capacity to generate nitrous oxide (N2O) emissions. Higher emissions have been linked to high annual precipitation, poorly drained soils, and high nitrogen (N) fertilizer application rates for corn compared to other crops [1]. In addition, soils in this region are medium-to-heavy texture with high organic matter and high water holding capacity [2]. Subsurface drainage (SD) is installed to help remove excess soil water in the spring to allow workability of the soil, timely field operations, and soil aeration. Subsequently, a portion of the applied N fertilizer can be lost through nitrate (NO3) leaching [3,4]. Gaseous losses through ammonia (NH3) volatilization [5,6,7], denitrification, and nitrous oxide (N2O) emissions [8,9] due to saturated soils can lower N use efficiency. These losses can exacerbate several negative environmental effects, which include surface water eutrophication from NO3 [10], soil acidification [11], and the formation of air pollutants due to NH3 and N2O emissions [12].
Artificial agricultural SD networks are used in many areas of North America because of poor soil drainage to meet crop production goals [13,14]. However, N management within drained landscapes is particularly challenging due to the mobility of NO3 through the soil profile. Intensive research efforts over recent decades have enabled the identification of fertilizer management options capable of reducing N losses. Nitrogen fertilizer rate, source, placement, and timing (4Rs) are deemed to be important factors influencing environmental N losses, which can contribute to enhancing N use efficiency. To increase grain yield production and reduce N losses while increasing yield, the 4R nutrient stewardship concept (right fertilizer source, amount, time, and place) is recommended for farmers and fertilizer managers [15].
Nitrogen fertilizer application amount and timing are primary factors affecting the grain yield, crop N uptake, and residual soil NO3 concentrations in the soil profile and consequently affecting NO3 losses during the fallow winter period [16,17]. Fall application of anhydrous ammonia (AA) is a common practice in the Midwest U.S. because of its lower cost, supply challenges in the spring, and the advantage of reducing workload requirements in spring to allow timely planting. However, there is a higher potential for N leaching loss in well-drained soils or gaseous emissions in poorly drained soils, particularly during wet springs. A commonly recommended option to reduce the risk of N loss is to synchronize soil N supply to crop N demand [18]. This can be achieved by applying N in the spring before planting or splitting the N application between planting and the beginning of rapid crop growth when N uptake (stages V6–V8) is greatest. Another method to synchronize crop N uptake with inorganic N availability in the soil can include using a controlled-release enhanced efficiency fertilizer technology. Nitrapyrin is a nitrification inhibitor (NI) that can be applied with ammonium (NH4+)-containing fertilizers that limits the conversion of NH4+ to NO3, which is susceptible to leaching and denitrification losses [19,20]. Numerous studies in Midwest corn–soybean cropping systems reported variable results from nitrapyrin application on water quality with an increase or no effect on flow-weighted NO3-N concentration in subsurface drainage water flow [21,22]. Several comprehensive meta-analyses and studies have observed that nitrapyrin reduces gas emission losses in corn and other cereal grain systems compared to N fertilizer without nitrapyrin [20,23,24,25]. While the use of nitrapyrin in the fall is a BMP, no knowledge is available compared to other practices such as spring AA or an enhanced efficiency urea fertilizer application on gaseous losses [26,27].
Several enhanced efficiency fertilizers that control the release of N have been used to mitigate N losses and have been available in the U.S. fertilizer market for several years, including two commonly used fertilizers, ESN (Nutrien, Saskatoon, SK, Canada) and SuperU (Koch Agronomic Services, Wichita, KS, USA) [28]. The polymer-coated properties of ESN control N release gradually during the growing season [29]. The stabilized urea source, SuperU, contains urease [N-(n-butyl)-thiophosphoric triamide] and nitrification (dicyandiamide) inhibitors that are uniformly distributed throughout the granule during the manufacturing process [30]. The use of a urease inhibitor is common and has been shown to reduce NH3 volatilization compared to non-treated urea by slowing urea hydrolysis [31]. However, the efficiency of enhanced efficiency fertilizers is influenced by the application amount, weather, soil moisture, and soil texture [32,33,34]. Despite substantial evidence showing that soil drainage affects crop–soil N dynamics, little has been carried out to quantify the direct effects of different 4R fertilizer management systems on environmental losses in SD and ND soils. The purpose of this study was to evaluate gaseous (N2O and NH3) losses in SD and ND soils and compare nutrient (NO3, TP, and TK) concentrations in subsurface drainage water with different N fertilizer management practices in a corn–soybean rotation.

2. Material and Methods

2.1. Site Description and Experimental Design

A field experiment was conducted during the years corn (2018 and 2020) and soybean (2019) were planted at the University of Missouri Greenley Research Center (40.022659° N, 92.190994° W) near Novelty, MO, USA. The soil series was a Putnam silt loam (fine, smectitic, mesic Vertic Albaqualfs) with a claypan layer at a depth of 60 cm (https://soilseries.sc.egov.usda.gov/OSD_Docs/P/PUTNAM.html, accessed on 25 July 2024). Subsurface drainage and control structures (AgriDrain Corporation, Adair, IA, USA) were installed in August of 2009. The drainage pipes were installed at a 0.6 m depth (claypan layer) with a 6 m spacing [35]. The plot sizes were 9.1 by 61 m in replication one and 9.1 m by 91 m in replication two. Each plot was separated by a plastic lining buried 0.7 m deep in the soil with berms on the surface to inhibit any movement of N fertilizer or water laterally between plots.
The field trial was a randomized complete block design with two replications. Treatments consisted of different nitrogen management treatments, including a typical 190 kg N ha−1 anhydrous ammonia (AA) + nitrapyrin (Corteva Inc., Midland, MI, USA) at 0.36 kg ai ha−1 fall applied) (Fall AA + NI), enhanced (190 kg N ha−1 AA preplant) (Spring AA), and topdress (TD urea) application of 42 kg ha−1 SuperU (Koch Agronomic Services, Wichita, KS, USA) and 126 kg ha−1 ESN (Nutrien, Saskatoon, SK, Canada) as a 25:75% granular blend, which was considered an advanced 4R N management practice. Each treatment was replicated with no drainage (ND) or subsurface drainage (SD), except the TD urea management practice. A non-treated control (NTC) was included in each replication as a baseline reference of gaseous N emission. The study site was in a corn–soybean rotation, with corn planted in 2018 and 2020 while soybeans were planted in 2019. The fall N application dates for 2018 and 2020 were 10 October 2017 and 7 November 2019, respectively. The spring preplant N application dates were 19 April 2018 and 10 April 2020. The TD urea was applied on 24 May 2018 and 16 June 2020. DKC64-89RIB was planted on 19 April 2018 at 82,745 seeds ha−1, and DKC65-95RIB was planted on 21 April 2019 at 77,298 seeds ha−1. The maintenance fertilizer was applied at 14-73-129 (N-P-K) kg ha−1 on 11 April 2018 and at 26-67-90 (N, P, K) kg ha−1 on 10 April 2020. Corn was harvested on 22 August 2018 and 22 September 2020. Soybean, AG36X6, was planted on 5 June 2019 and harvested on 18 October. All plots were maintained weed-free, and specific management information is available in ref. [33]. The precipitation data were collected from the Greenley Research Center weather station (Campbell Scientific, Logan, UT, USA) located near the research site. The cumulative precipitation was calculated separately for each growing season from 1 November to 31 October (Figure 1). Long-term (2006–2016) 10-year cumulative average precipitation was calculated for growing months.

2.2. Data Collection and Analysis

2.2.1. Gas Emission Measurements

In-field measurements of soil N2O flux were determined following the USDA-ARS GRACEnet Chamber-based Trace Gas Flux Measurement Protocol [36]. In this study, a static ring chamber design was implemented, and chambers were constructed using PVC pipe sections with removable rubber PVC pipe caps. The chambers had a diameter of 20 cm and a height of 14 cm. They were installed 10 cm deep into the soil, with 4 cm of the chamber remaining above the soil surface, and two chambers were placed approximately 30 m from the end of each plot. The chambers were installed a day after N fertilizer was applied in the fall of 2017 and remained in place throughout the year until harvest in 2020. The rings were temporarily removed approximately for 1 day at the time of AA application and planting. Soil temperature (Digi-Sense Dual JTEK, Eutech Instruments, Singapore) data were collected every time at a 10 cm soil depth along with gas sampling. Gas sampling occurred every week from the fall N application in 2017 until corn was harvested in 2020. Gas samples were taken at 0, 30, and 60 min intervals after capping. A 10 mL sample of gas was removed from the chamber and injected into 5 mL evacuated glass serum vials (Wheaton Science Products, Millville, NJ, USA) that over-pressured the vials, as suggested in the GRACEnet protocol [36]. The collected gas samples were analyzed using a gas chromatograph (Model 910, Iluck Scicntific, Inc., Norwalk, CT, USA) equipped with a steel, Porapak Q column with a helium carrier gas and an electron capture detector (ECD) set at 300 °C. Detailed gas flux analysis, calibration procedure, and calculation details are given in ref. [37].
In-field NH3 flux was determined using a semi-open static system similar to ref. [38], which consisted of a clear plexiglass chamber and polyurethane foam sorbers. Two chambers were installed in each plot and placed in the inner planted rows adjacent to the N2O chambers. A chamber was placed in between the row that corresponded to above the AA application band and between the band that represented 33 and 67% of the applied area. Each chamber had a 13 cm diameter and 75 cm height and were driven 15 cm deep into the soil. The 2.5 cm thick polyurethane foam sorbers were washed with 0.73 M phosphoric acid, rinsed with deionized water, and then infused with 35 mL of a 0.73 M phosphoric acid/33% glycerol solution. The foam sorbers were placed into each chamber 0 and 15 cm from the top of each chamber and were replaced weekly. The foam sorber at top of the chamber absorbed ambient NH3, and the bottom sorber trapped NH3 gas emissions from the soil. The collected foams were soaked overnight in 100 mL of a 2 M potassium chloride (KCl) solution, drained into a sample bottle, and stored at 5 °C before analysis. An automated ion analyzer (Lachat Quik Chem 8000, Loveland, CO, USA) was used to analyze samples for NH4-N concentrations (QuikChem 12-107-06-2-A). A blank sample of KCl was analyzed every time as a quality control check.
Cumulative N2O and NH3 emissions were calculated by adding the weekly flux for each replication for each year from fall N application until corn harvest. The fertilizer treatment effects on grain yield from this experiment were analyzed by ref. [33]. The corn grain yield reported in [33] was used to calculate yield-scaled N2O (g N2O-N mg−1) loss as cumulative N2O gas (g N2O ha−1) emission over the growing season per mg of grain yield (mg ha−1) produced.

2.2.2. Soil Sampling and Analysis

In 2018 and 2020, soil samples were collected following corn harvest at a 0–15 cm depth using a Giddings probe (Windsor, CO, USA). The collected samples were analyzed by the MU Soil and Plant Testing Lab using standard soil testing analytical procedures for Missouri [39]. Soil pH was determined in a 0.01 M CaCl2 solution [40], and extractable cations, including Ca, Mg, Na, and K, were determined by using an ammonium acetate extractant [41]. The loss on ignition method was used to calculate organic matter (OM) in soil at a minimum heating temperature of 105 °C [42]. The proportions of sand, silt, and clay in soil were quantified by the hydrometer method [43].

2.2.3. Water Sample Collection and Analysis

Portable automated samplers (Teledyne ISCO, Lincoln, NE, USA), along with liquid level actuators, were used to collect a subsurface drainage water sample every six hours during rainfall events. A total of 37, 25, and 14 rainfall events were collected in 2018, 2019, and 2020, respectively. Water samples were combined into a daily composite sample. The collected samples were refrigerated at 4 °C prior to being analyzed. The University of Missouri Soil and Plant Testing Lab was used to determine nitrate-N (NO3-N), total potassium (TK), and total phosphorus (TP) concentrations. A filtered (1.5 μm, 934-AH; Whatman Glass Microfiber, GE Healthcare Bio-Sciences, Pittsburgh, PA, USA) sample was taken to analyze NO3-N concentration using an automated ion analyzer (Quick Chem 8000, Lachat Instruments, Milwaukee, WI, USA). The TP concentration in subsurface drainage water was analyzed using a PerkinElmer Lambda 25 UV/Vis spectrophotometer (PerkinElmer Inc, Waltham, MA, USA) using the ascorbic acid method (4500PE). The total K concentration in drainage water was measured using ion chromatography using a Dionex ICS-3000 system (Thermo Fisher Scientific, Waltham, MA, USA).

2.3. Statistical Analysis

Cumulative gas emission data were analyzed separately for each year using the generalized linear mixed model in SAS (SAS Institute, v9.4, Cary, NC, USA). The data were analyzed with the combined fertilizer and drainage treatment (drainage fertilizer) as a fixed effect and replication as a random effect. Prior to analysis, the data were analyzed for the assumption of normality using the Shapiro–Wilk statistic, and homogeneity of variance was verified using residual plots. Nutrient concentrations in water samples collected from subsurface drained plots were analyzed using a generalized linear mixed model. In this analysis, fertilizer treatment was considered a fixed effect, and replication was a random effect. For comparison of means, all variables were analyzed using Tukey–Kramer grouping, and least-squares means were calculated at a 0.1 significance level.

3. Results and Discussion

3.1. Weather

The weekly average soil temperature data from 0–15 cm soil depth during 2018, 2019, and 2020 are presented in Figure 1a. The soil temperature was in the range of −3 °C in the winter to 31 °C in the summer. In 2018, relatively high soil temperature data from April to mid-July were observed, along with reduced rainfall compared to 2020. In 2019, a peak in soil temperature was observed from June to July, with temperatures in the range of 25 to 30 °C. The early spring months (February to April) in 2019 had comparatively colder soils than in 2018 and 2020. The average 10-year precipitation from 2006 to 2016 during the crop growing year (November–October) was 960 mm. The total amount of rainfall when corn was produced in 2018 and 2020 was 622 and 702 mm, respectively (Figure 1b,d). Both corn growing years had precipitation levels below the 10-year average by 35% in 2018 and 25% in 2020. During August and September of 2018, 46% higher rainfall occurred than during the same period in 2020. The cumulative rainfall when soybean was produced in 2019 was 1345 mm, which was 28% higher than the 10-year average (Figure 1c).

3.2. Nutrient Loss in Subsurface Drainage Water

3.2.1. Corn Season

A significant treatment (p < 0.0001), year (p < 0.0001), and treatment × year (p = 0.026) interaction effect was observed on NO3-N concentrations in subsurface drainage water (Table 1). In 2018 and 2020, fall AA + NI and spring AA resulted in increased NO3-N concentrations in drainage water (34–43%) compared to TD urea and the NTC. Reduced NO3-N concentrations with TD urea were due to delayed N application and a lower N application amount, which led to reduced leaching of N in early spring with heavy precipitation (Figure 1). In the same study, [33] reported higher crop N uptake at R6 with TD urea compared to other N fertilizer treatments. This probably resulted in increased overall N use efficiency and reduced nutrient concentrations in drainage water. In 2018, the NO3-N concentration in drainage water was 26–34% higher with the fall AA + NI and spring AA applications than in 2020. This was due to a reduced overall grain yield [33] in 2018, which resulted in more N being available in the soil solution. In addition, soil NO3-N concentration and losses are affected by dry and wet climatic cycles [44]. More intensive rainfall and greater soil temperatures were observed from March to April in 2018 than in 2020 (Figure 1). Nitrapyrin hydrolysis increases at elevated soil water contents and at higher soil temperatures [45]. Therefore, higher N application and increased nitrapyrin hydrolysis in fall AA + NI contributed to higher N concentrations in subsurface drainage water. In this study, we did not observe a benefit from fall AA + NI compared to spring AA in terms of reducing NO3-N concentration in subsurface drainage water in the corn growing season. This was similar to other studies in Illinois [21] and Minnesota [46], which reported a fall application of NI did not reduce NO3-N concentrations in subsurface drainage water compared to spring AA.
The total P concentration in drainage water had a significant drainage (fertilizer) treatment effect over the years (p = 0.0954) (Table 1). In 2018, a 25% higher TP concentration in subsurface drainage water was observed with the fall AA + NI and TD urea compared to the NTC and spring AA. The early season availability of N with spring AA could have enhanced corn root growth, resulting in increased P uptake compared to other N fertilizer treatments. The total K water concentrations were significantly (p = 0.0001) lower for all N fertilizer treatments compared to the NTC. The TK concentrations in drainage water from different treatments were ranked as spring AA < fall AA + NI < TD urea < NTC. This could be attributed to improved crop growth, greater K uptake by the plants, and higher grain nutrient removal with fertilizer treatments compared to the NTC [33]. A higher N application amount and increased availability of NH4+ with spring AA might have enhanced K uptake by the plants [47]. Due to their similar valence and size properties, NH4+ and K+ compete for the same exchangeable and non-exchangeable sites of soil particles [48]. Thus, the K+ concentration in the soil solution may increase following the AA application, which subsequently increased the K concentration in drainage water. A significant year (p = 0.0001) effect showed 80% higher K concentrations in 2018 compared to 2020 due to lower plant populations, plant uptake, and grain yield in 2018 than in 2020. In 2020, no difference among treatments was observed in the total K concentration in subsurface drainage water.

3.2.2. Soybean Season

Subsurface drainage water samples were collected during the soybean growing season in 2019 to evaluate the influence of different N treatments on the nutrient concentration of drainage water. No significant effect of N fertilizer treatments was observed on TP (p = 0.3548) or TK (p = 0.1909) concentration in drainage water (data not presented). A significant difference in mean NO3-N (p < 0.0001) concentrations in drainage water among treatments was observed. The average NO3-N concentration in drainage water was 5–6.8 mg L−1 higher for all fertilizer treatments (TD urea = 11.9 mg L−1, spring AA = 11.4 mg L−1, and fall AA + NI = 10.1 mg L−1) compared to the NTC (5.1 mg L−1). No differences among N fertilizer treatments were observed in terms of NO3-N concentration in the drainage water. This indicates no difference in leaching loss would be expected and emphasizes that there was a carryover effect of N fertilizer from the previous corn crop, irrespective of the N fertilizer source, following a drought in the corn year. Moreover, a comparison of N losses during the corn (2018) (Table 1) and soybean growing periods showed similar NO3-N concentration values in drainage water with the TD urea treatment over the years. This highlights the increased soil N buildup due to lower N uptake in the previous corn crop due to dry growing conditions [33]. Similar results were observed by [49], showing no difference in NO3-N leaching loss during the soybean season with no N fertilizer application in a corn–soybean rotation. This was in contradiction to studies showing a lower NO3-N concentration in subsurface drainage water in the soybean season following corn [21,50]. This emphasizes that precipitation amounts in the corn-growing season of a corn–soybean rotation can greatly influence NO3-N loss the following year, regardless of the N source or timing. As in this experiment, lower precipitation in 2018 resulted in reduced corn N uptake and increased N in the soil solution. Similarly, [22] observed greater N loss during the soybean year when a wet year followed a dry year. These results highlight that it is crucial to evaluate N management not only for corn but also for the rotational crop the following year to increase N use efficiency and reduce overall N loss mechanisms. In addition, adjusting fertilizer inputs based on soil N content and weather predictions for a given year can also aid in reducing N losses in subsurface drainage water [34].

3.3. Soil Nitrous Oxide Flux and Cumulative Emissions

Corn Season

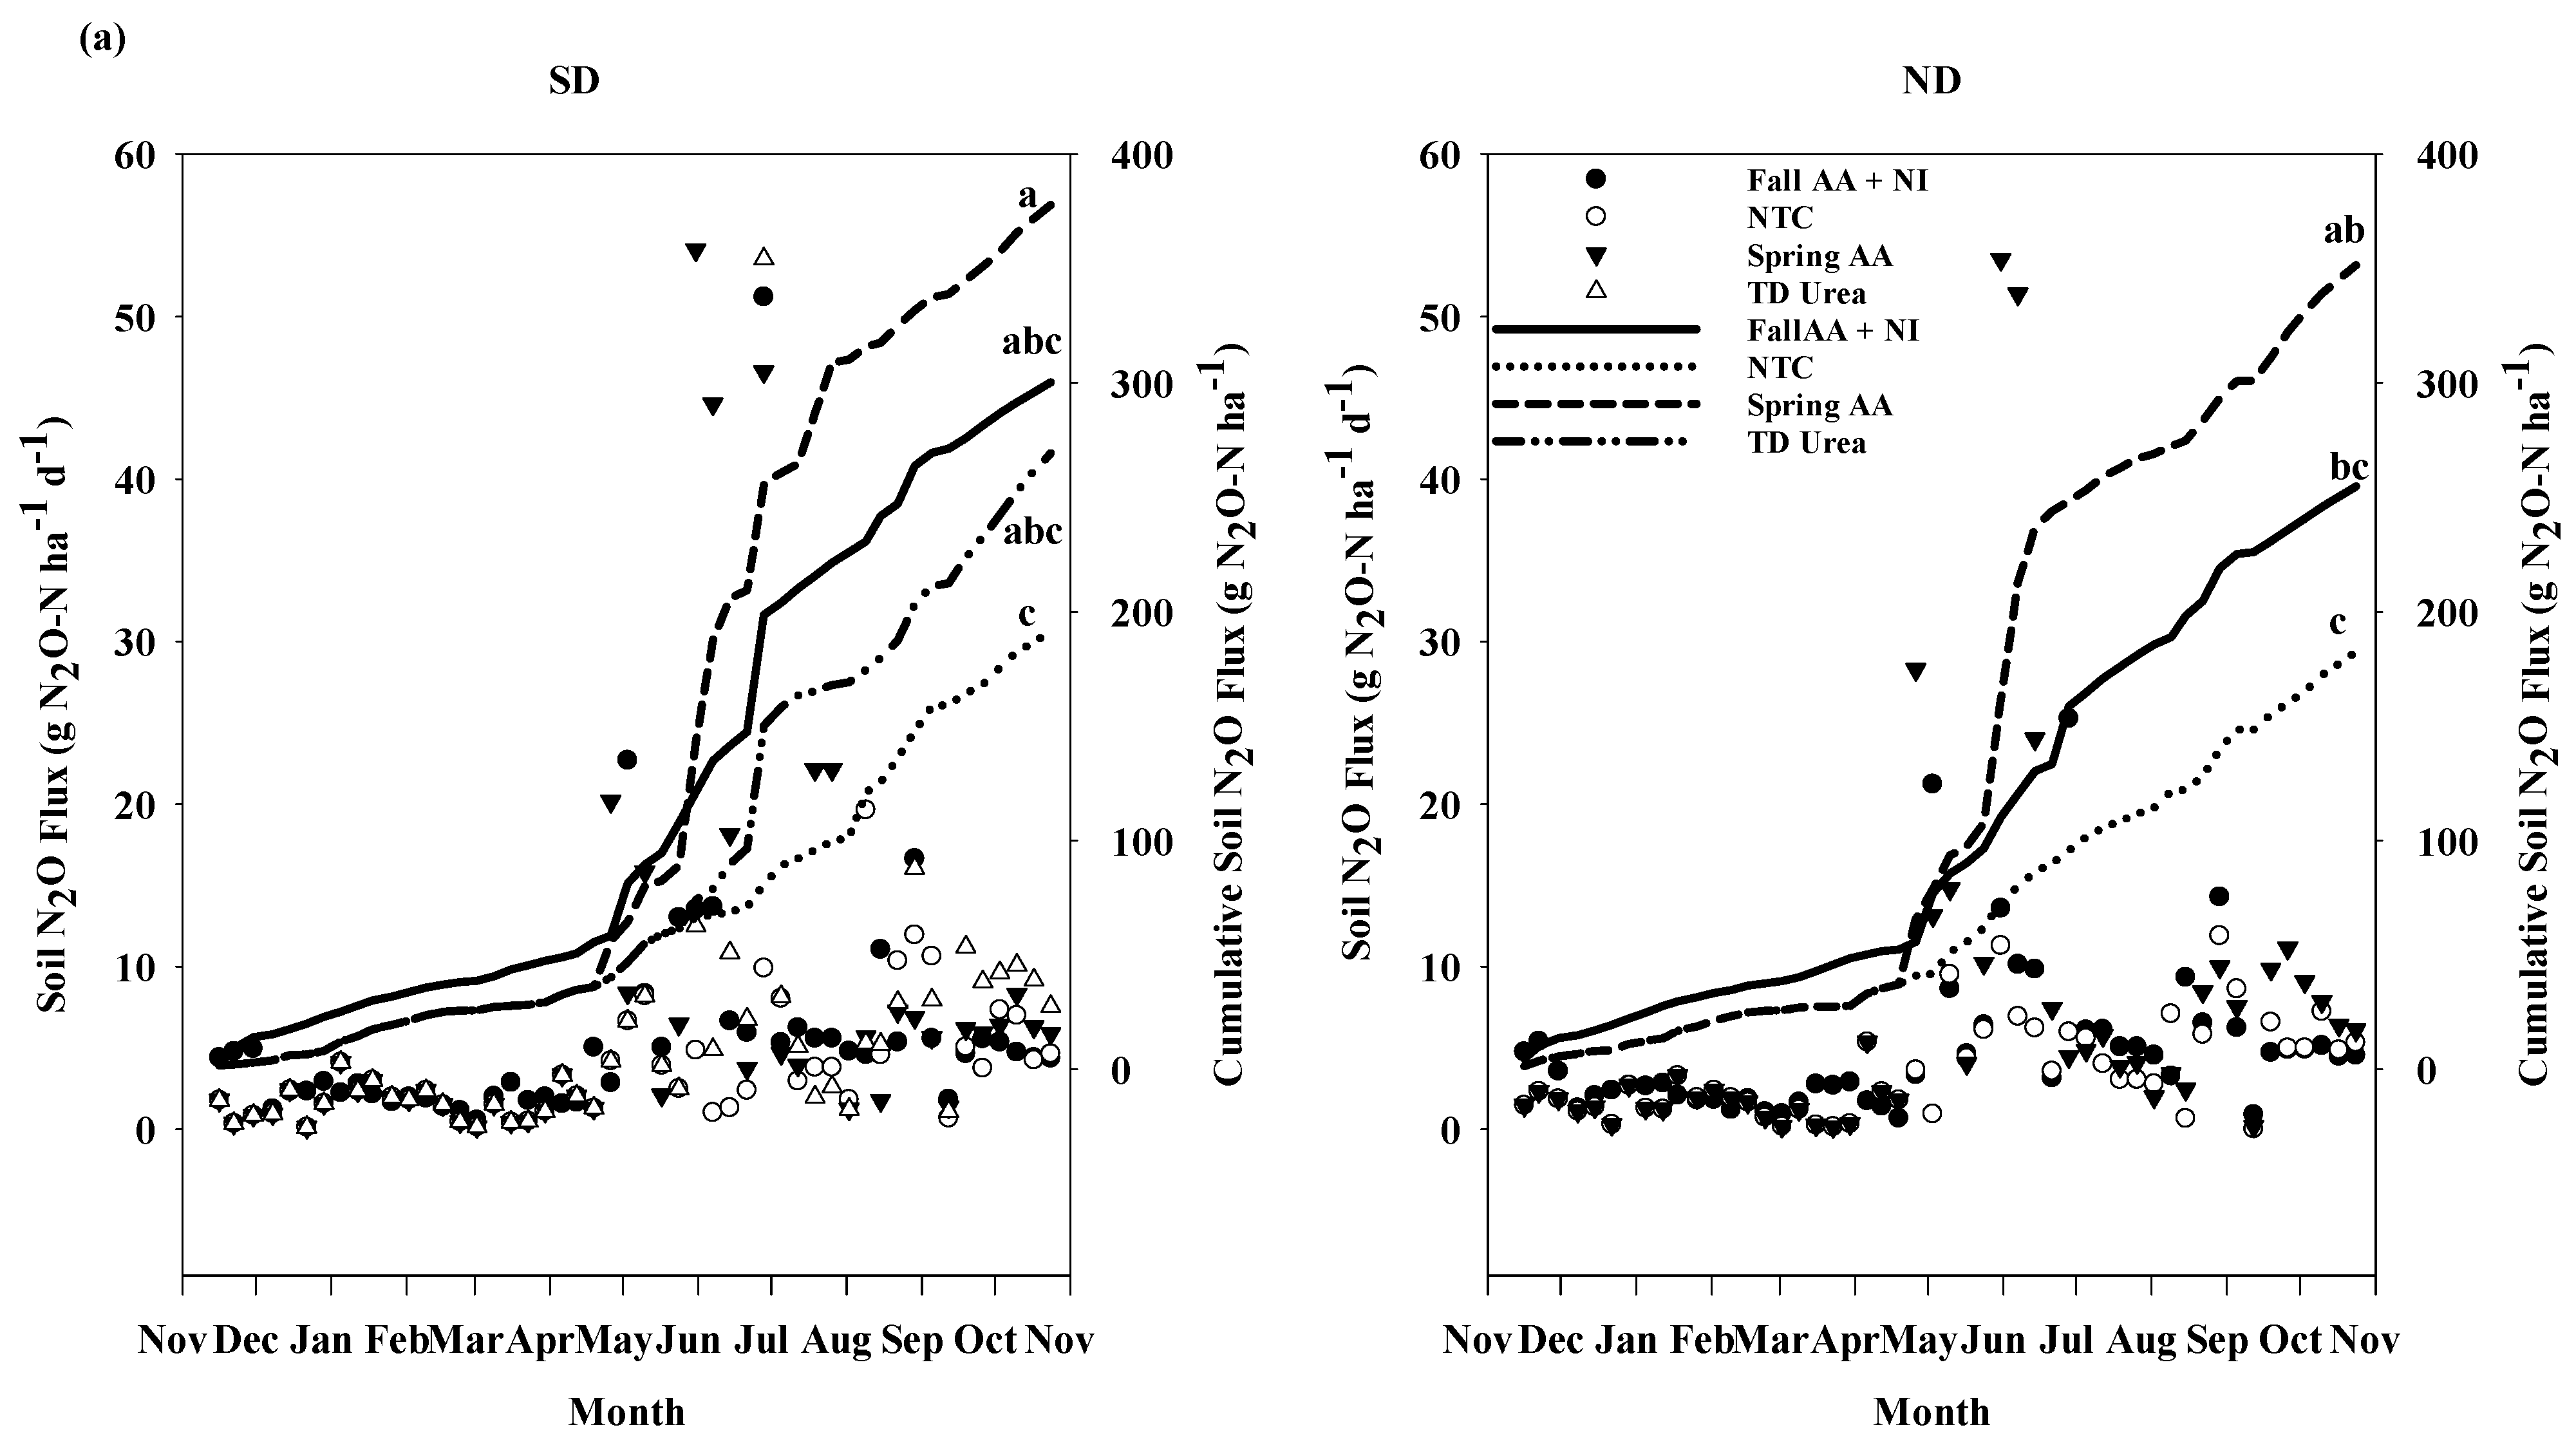
Nitrous oxide flux from each fertilizer treatment in SD and ND soils over the 2018 and 2020 sampling periods are shown in Figure 2a,b, respectively. In 2018 and 2020, temporal response differences in weekly N2O fluxes were observed with a slight increase in fall AA + NI following the November application. With increasing temperatures in May and June, there was a rapid increase in N mineralization, resulting in larger peaks of N2O flux from both SD and ND treatments. Large spikes in N2O flux were observed from April to July following the spring AA and TD urea applications. Emissions with fall AA + NI increased from May to June. On 28 June 2018, N2O loss was 50% higher with fall AA + NI in SD soils compared to ND soils. However, this event was accompanied by 12.5 mm of rainfall, resulting in rapid wetting of soil. Higher N2O emissions following drying and wetting cycles have been attributed to periods of enhanced microbial activity because of nitrification/denitrification occurring at the boundary of oxic/noxic conditions [51]. The soil water content and oxygen fluctuations determine the magnitude and temporal development of N2O. Also, ND soils remain saturated for prolonged periods compared to SD soils, while nitrification inhibitor efficacy has been found to increase under high soil moisture [45]. The daily N2O flux peaked 7 days after the spring AA application, with 80% higher emissions compared to the NTC. The highest peak with spring AA was observed 49 days after application, with 91% greater N2O emission losses compared to the NTC. However, this event was followed by rainfall, where relatively higher emissions were observed following all fertilizer treatments with SD compared to ND. Thus, increased temperature and soil moisture can enhance the nitrification of AA, which resulted in increased N2O loss with higher soil NO3 levels.
The TD urea treatment had N2O emissions that were maximized (54 g N2O kg−1 day−1) 28 days after treatment on 28 June, which could be attributed to soil wetness following a rainfall event. Several researchers have reported that peak N2O fluxes were delayed when using a controlled release fertilizer [52,53,54]. However, the effectiveness of this delay depends on seasonal precipitation events. The temporal variation in N2O emissions in 2020 showed a typical pattern of generally low fluxes punctuated by a few peak events. However, the magnitude of weekly N2O fluxes were lower in 2020. The highest flux was observed with spring AA 56 days after application, with emissions reaching 32 g N2O-N ha−1 d−1. The lower number of spikes in 2020 could be due to lower soil temperatures from March through June compared to 2018.
In this experiment, a significant difference in cumulative gas emissions was observed among different fertilizer treatments (Figure 2a,b). Cumulative N2O emissions were significantly higher with spring AA compared to the NTC in 2018 (p = 0.0453) and 2020 (p = 0.1144) in SD and ND soils. In both years, cumulative N2O gas losses were ranked as spring AA > fall AA + NI > TD urea > NTC. In 2018, a 48% higher N2O loss over the year was observed with spring AA compared to the NTC in SD and ND soils. In 2020, the application of spring AA resulted in 35% greater N2O than the NTC in SD soils. The ND soils had no differences in cumulative N2O losses between fertilizer treatments. This suggests that the inclusion of a nitrification inhibitor with spring-applied AA may be needed to reduce N2O losses. In this experiment, no significant difference in cumulative emissions between TD urea and fall AA + NI treatments occurred compared to the NTC. This could be due to the persistence of nitrapyrin with fluctuating soil moisture and temperature levels. Increased gas losses in 2018 compared to 2020 might be due to elevated soil temperature from April to June accompanied with increased soil N levels due to fertilizer application. Also, variability in weather conditions may have contributed to differences in nitrification inhibitor efficacy, which affected N2O emissions. No significant difference was observed with fall AA + NI compared to spring AA and TD treatments, indicating that fall-applied AA with a nitrification inhibitor had no greater risk of N2O loss than spring AA or a reduced rate TD urea application. Similarly, previous meta-analysis studies showed that N fertilizers containing nitrification inhibitors were effective in reducing N2O loss by 42–61% compared to conventional fertilizers [23,55]. Similarly, a study by ref. [56] observed reduced early spring N2O emissions with fall-applied AA and nitrapyrin, but annual emissions were not significantly reduced.

3.4. Soybean Season

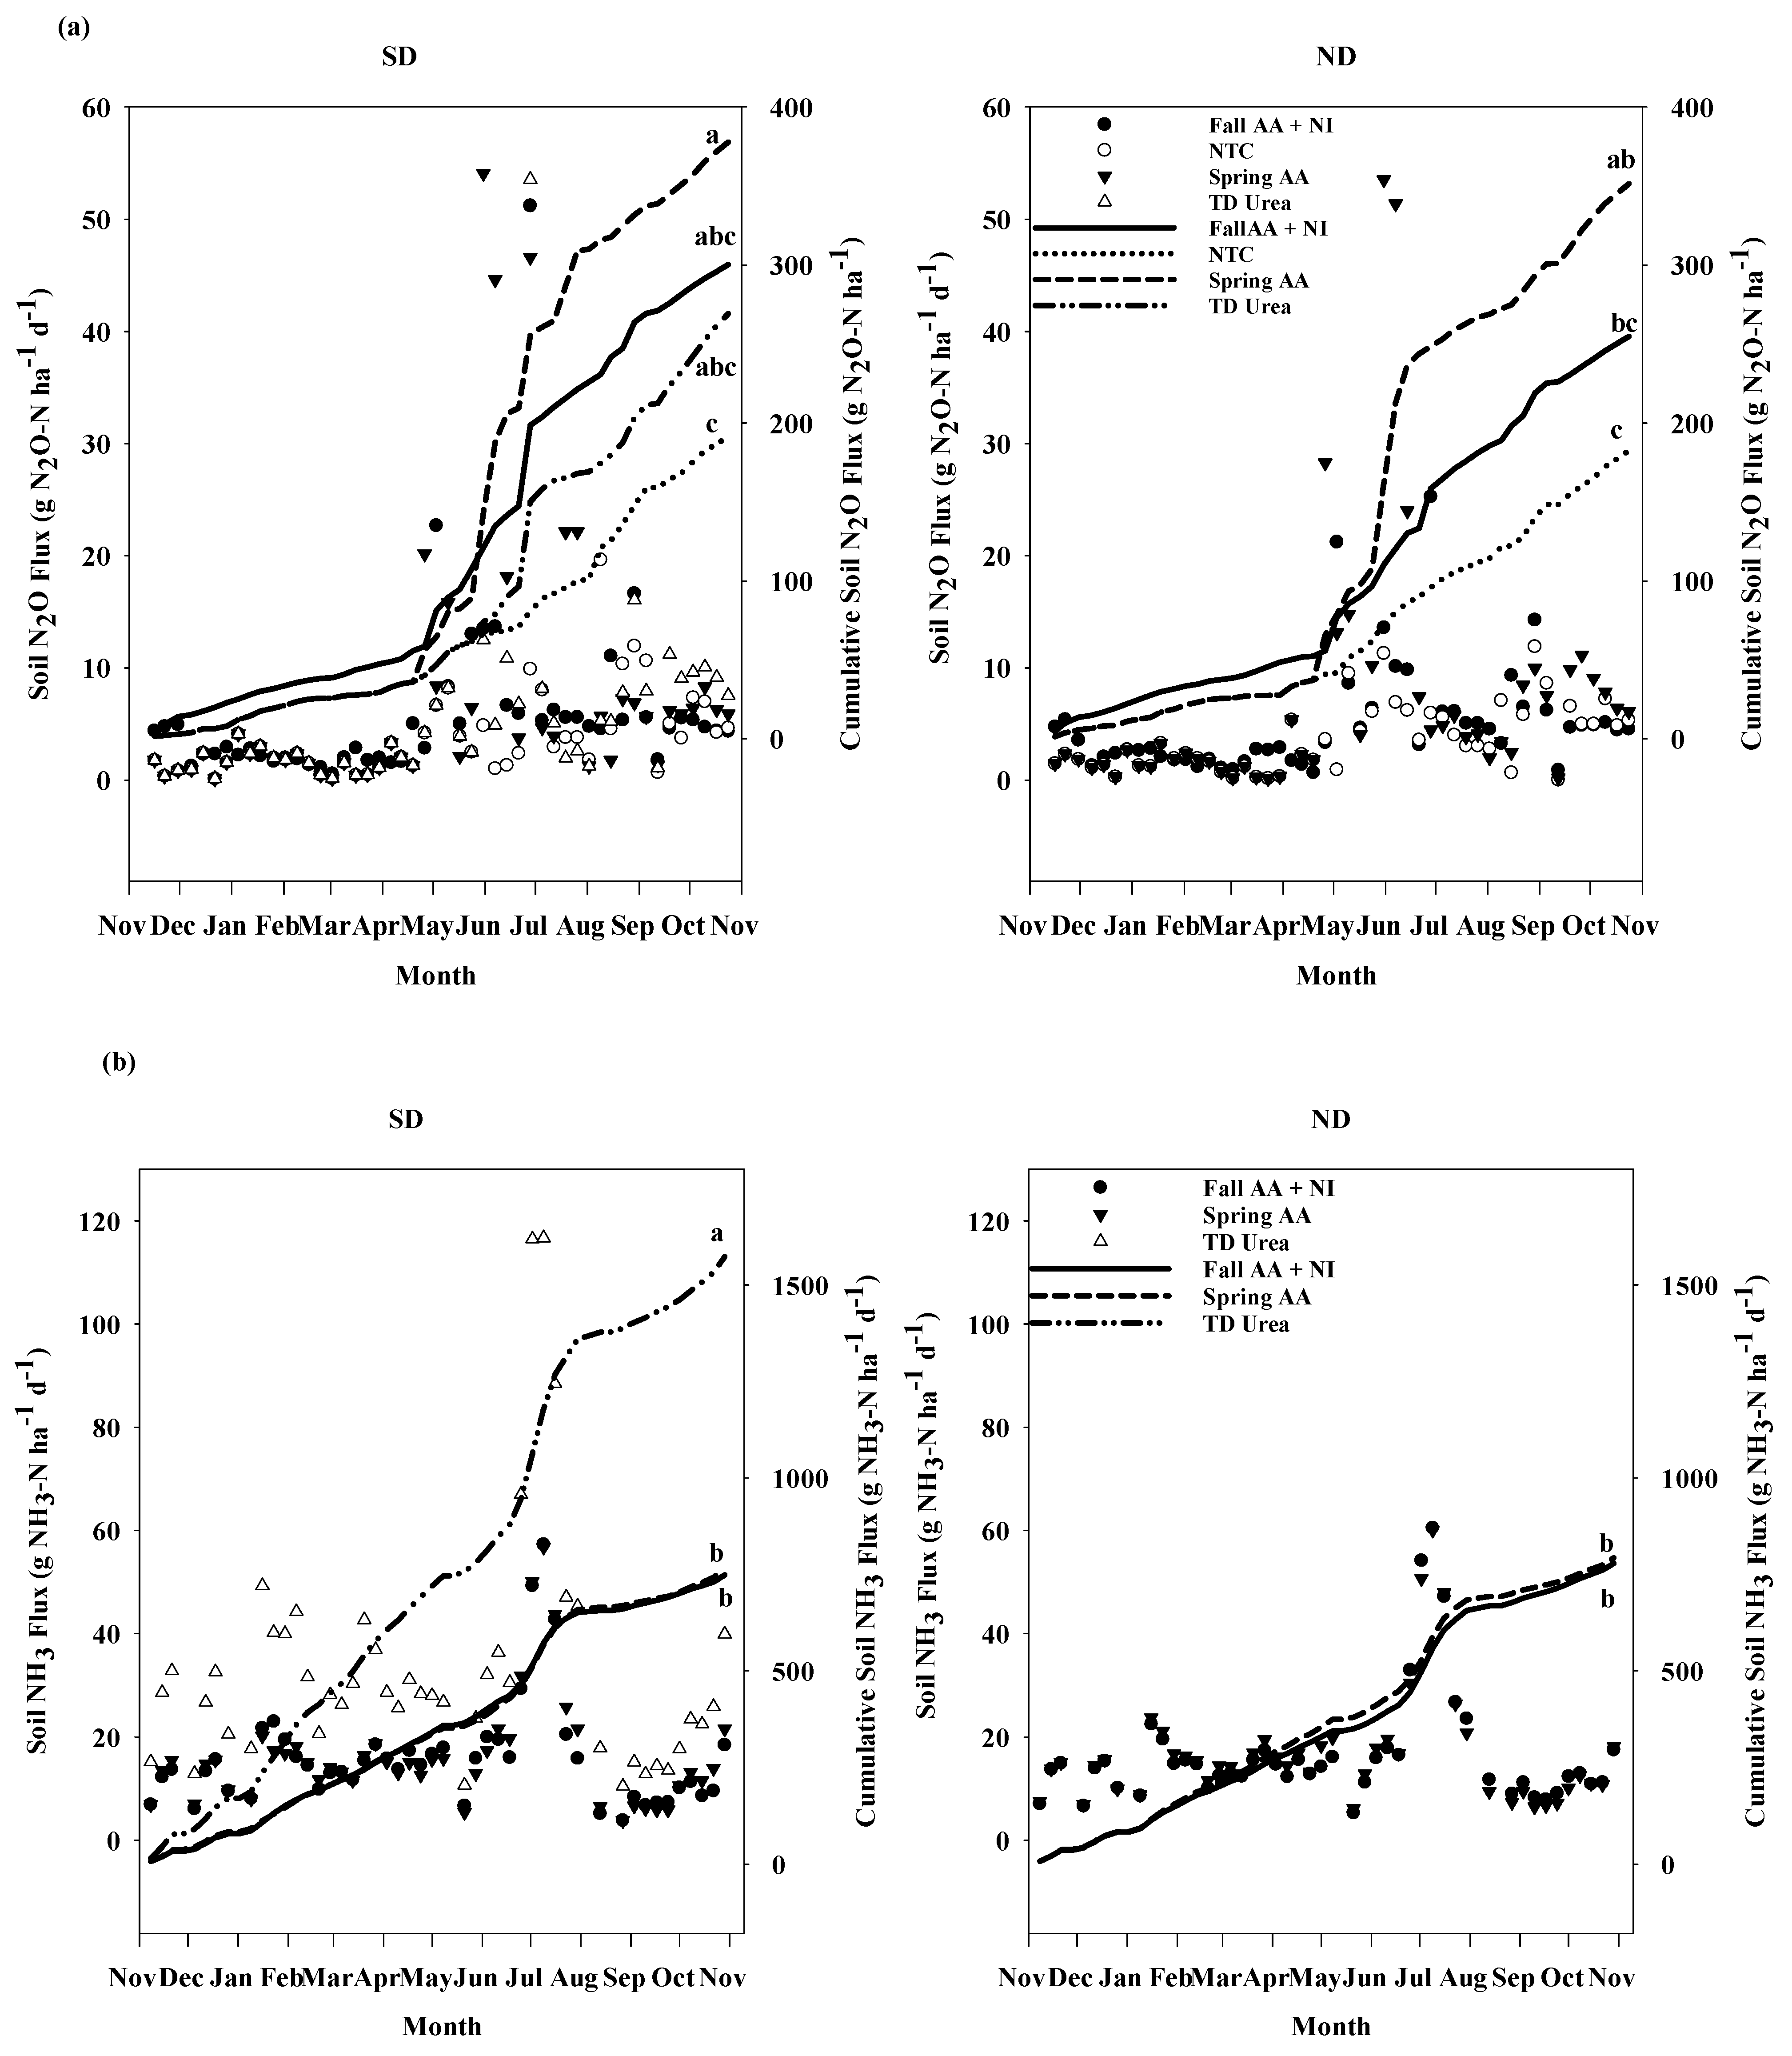
Several studies have analyzed the impact of corn N fertilizer management on environmental loss during the growing season, but the N management effects on N loss in the rotational crop are unknown. The N2O emissions were evaluated after corn harvest through the soybean growing period from November 2018 to October 2019. During the soybean season, the N2O emissions per event followed a similar pattern in all the fertilizer treatments in SD and ND soils (Figure 3a). A slight peak with TD urea and spring AA treatments was observed after corn harvest in November 2018. This resulted in increased residue N availability in the topsoil, which was subjected to environmental losses. Pronounced temporal fluctuations in N2O emissions were observed in SD and ND soils with spring-applied AA. The largest peaks in the months of May–July were observed in response to warming soils and soil disturbances due to soybean planting. Saturated soil conditions and increased soil temperatures in the period of May to July caused peaks in N2O emissions in the ND soils with fall AA + NI and spring AA treatments compared to SD soils. The temporal difference in N2O emissions among different N fertilizer treatments was due to variation in N application amount and variability in crop residue N [33]. Soil inorganic N plays a vital role in controlling the mineralization of soil organic N and crop residue N [57]. Thus, the coexistence of plant residues and soil N was probably a reason for high N2O fluxes with spring AA and TD urea treatments in the soybean season.
To better understand the N2O gaseous losses during the soybean season, cumulative N2O emissions were calculated for each treatment. The cumulative N2O loss was significantly (p = 0.0137) influenced by the drainage (fertilizer) effect (Figure 3a). In SD soils, a 25–27% higher annual N2O loss occurred with the TD urea and spring AA treatments compared to the fall AA + NI and NTC. Similarly, a 30–36% greater N2O loss in ND soils was observed with spring AA than fall AA + NI and the NTC. Overall, no significant difference among fertilizer treatments was observed in SD soils compared to ND soils. The higher annual N2O emissions from soybean with spring AA and TD urea were related to large emission peaks observed during late fall and early spring after corn was harvested. In this study, N2O emissions during the soybean season were greatly impacted by climatic conditions and N management in the previous corn crop. This research shows that more field-scale studies with a corn–soybean rotation in SD and ND soils are needed to better explain the effect of corn N management strategies on environmental losses during the rotational crop year.

3.5. Yield-Scaled N2O Loss

We determined yield-scaled emissions based on the grain yields and cumulative emission of N2O-N for the corn (2018 and 2020) and soybean (2019) growing periods. The corn and soybean yield responses to N fertilizer treatments in SD and ND soils are presented in [33]. The yield-scaled N2O emission during the corn-growing years (2018 and 2020) was in the range of 21–80 g N2O-N Mg−1 grain (Table 2). These values were similar to the range of 46 to 100 g N2O mg−1 grain reported by [58] in a long-term tillage and N management study in Minnesota. In 2018 and 2020, significantly higher yield-scaled N2O emissions were observed in all the fertilizer treatments compared to the NTC (Table 2). In 2018, a 37% greater (p = 0.0797) yield-scaled N2O loss was observed with the fall AA + NI and spring AA treatments compared to TD urea in SD soils. However, a 36% greater N2O loss per mg of grain yield occurred with spring AA in ND soils compared to the NTC. This indicates that an application of NI with the fall AA application could be a viable alternative to spring AA in poorly drained soils. Contradictory results were observed in 2020 (p = 0.0002), with a 37–50% greater yield-scaled N2O loss observed with the NTC compared to fertilizer treatments in SD and ND soils. This clearly indicates the importance of precipitation influencing crop yields and a reduction in overall emissions mg−1 grain produced. The wetter soil conditions and a 60–75% lower grain yield in the NTC compared to the fertilizer treatments caused an increase in yield-based N2O loss in the absence of adequate fertility. A comparison of the NTC in SD and ND soils showed a 37% greater yield-scaled emission loss in ND soils than SD soils. This was in line with previous studies showing greater N2O losses in poorly drained soils due to limited O2 availability.
In the soybean crop (2019), N2O yield-scaled emissions (52.9 to 85.3 g N2O-N mg−1) were not affected by drainage or N fertilizer (p = 0.1439) treatments (Table 2). Overall, yield-based N2O loss was lower in SD soils compared to ND soils for all fertilizer treatments. This was due to higher grain yields with SD compared ND irrespective of the N fertilizer treatment [33]. This implies that N management in the previous corn-growing season did not impact the yield-scaled N2O emissions during the rotation crop season.

3.6. Ammonia Volatilization and Cumulative Losses

3.6.1. Corn Season

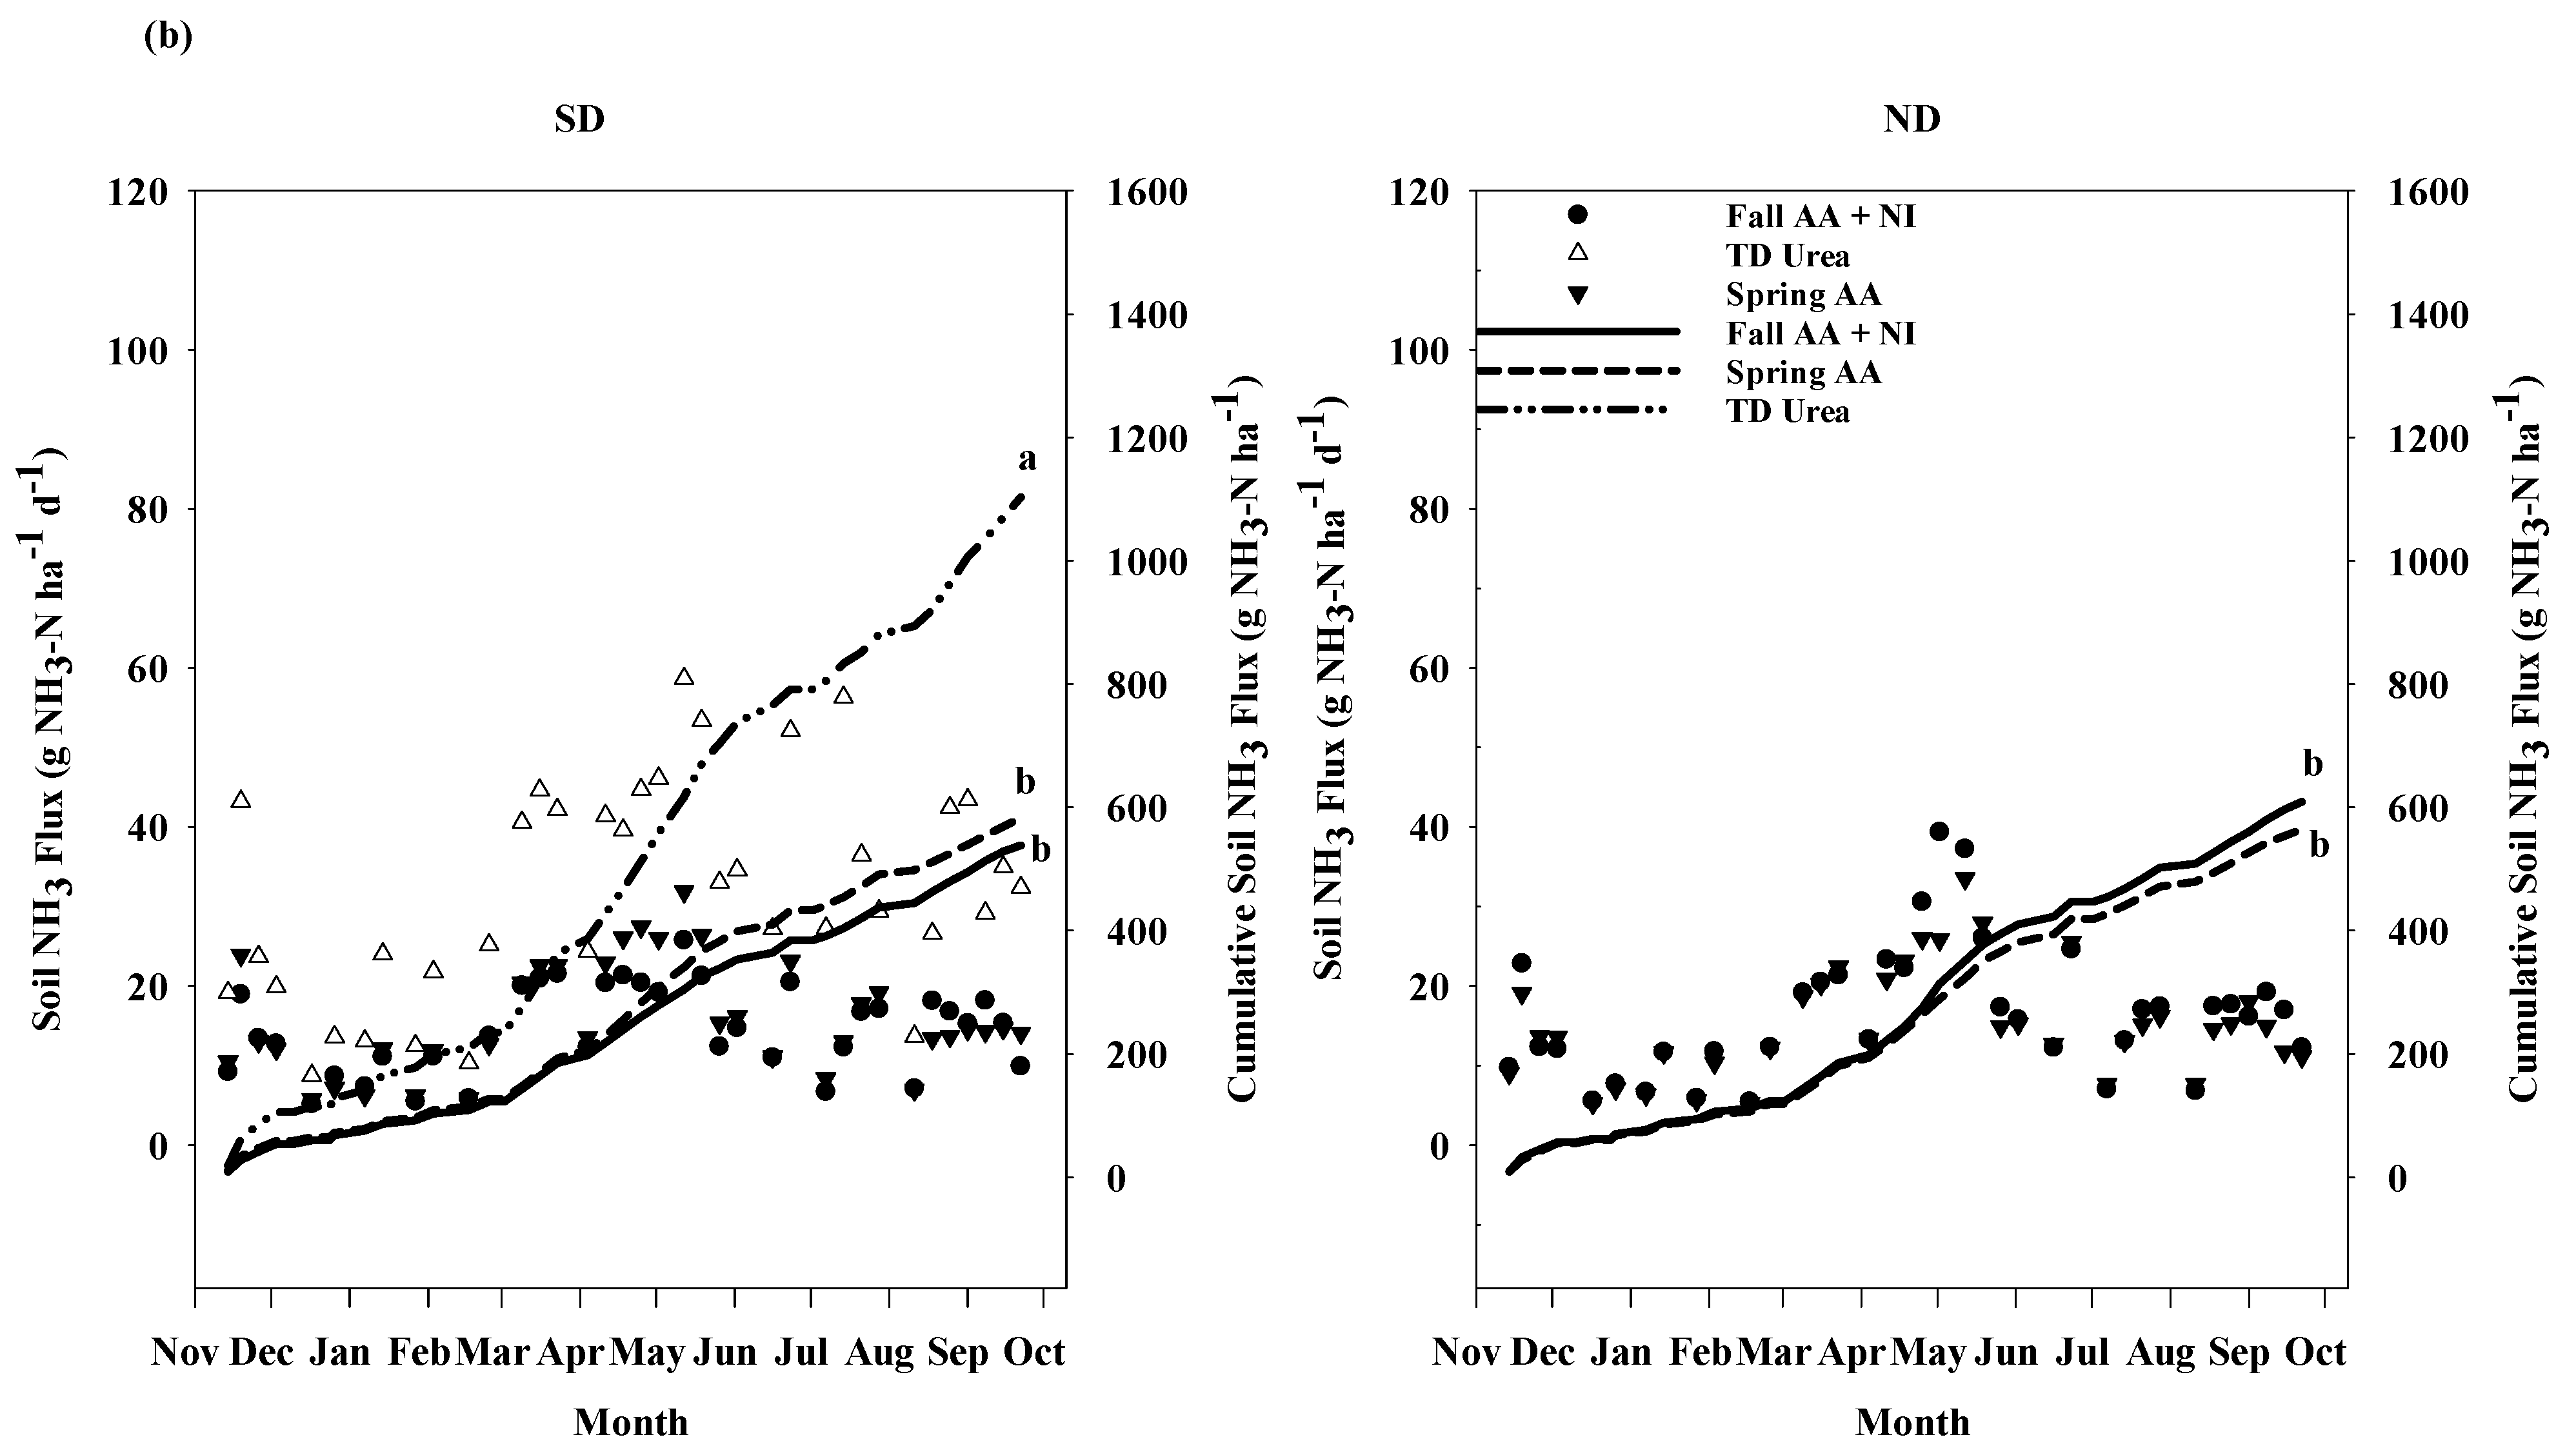
Ammonia volatilization losses were evaluated to identify differences among losses for different N fertilizer treatments. In 2018 and 2020, NH3 volatilization losses were low after the fall AA + NI treatment application (Figure 4a,b). However, NH3 emissions with spring AA and TD treatments were greater in early spring compared to fall AA + NI. This could be a combined result of natural emission differences and NH3 losses from decomposing crop residues grown in 2019. Lower NH3 losses with fall AA + NI may be due to some soil disturbances caused by injecting AA, which slightly incorporated crop residue into soils. However, conditions that favor the gaseous loss of NH3 include high crop residues [59], warm temperatures, and drying soil surfaces [60]. A study by ref. [61] reported that as plant biomass decays on the soil surface, 5–16% of plant N can volatilize during the winter months. Nevertheless, NH3 volatilization from crop residues can be considerably reduced by its incorporation into the soil before decomposition begins. Similarly, ref. [5] observed a 25% increase in NH3 volatilization with residue retention.
In 2020, no peaks of NH3 gas emissions were observed with spring AA compared to fall AA + NI (Figure 4b). The temporal variation in NH3 was nearly the same for different N fertilizer treatments in SD and ND soils. Volatilization losses were greater in 2018 from May to July due to favorable soil conditions, including increased soil temperature and dry soil surface. The TD urea application resulted in a 50% increase in NH3 losses 7 to 35 days after application in 2020. Similarly, spikes in NH3 losses were observed 50 days after application in 2018 (Figure 4a). The delayed occurrence of peak NH3 volatilization was due to fertilizer injection or the presence of urease inhibitors, along with the controlled release properties of ESN. The TD urea application in 2020 was followed by precipitation, which enhanced the solubilization of SuperU and ESN, which might have affected NH3 emissions 7 days after application.
Cumulative NH3 volatilization losses were significantly affected by N management treatments (Figure 4). Top-dressed urea had significantly greater NH3 losses than the fall- or spring-injected AA in both years (Figure 1). In 2018, NH3 losses were comparatively higher in all the treatments compared to 2020, which was due to higher soil temperature in the early summer. In 2018, TD urea increased cumulative NH3 losses by 58% and 45% compared to fall AA + NI and spring AA, respectively. Similarly, there were 51% and 47% greater cumulative losses with the TD urea treatment compared to fall AA + NI and spring AA in 2020, respectively. Other studies in similar climatic regions have shown increased NH3 volatilization after N fertilizer, which was associated with reduced corn yield and N use efficiency [62].
Increased volatilization losses with TD urea compared to AA could be due to the difference in fertilizer placement and source. Temperature and soil moisture have affected the rate of urea N released from ESN [63]. Thus, variation in NH3 losses between years was due to seasonal variability in soil moisture and temperature. The N fertilizer placement method was considered the main factor affecting NH3 volatilization losses. Injecting AA into soils increased the sorption of NH4+ cations on clay particles, which reduced the availability of ammonia subjected to volatilization losses [64]. The broadcast application of TD urea is more susceptible to volatilization losses after release of urea N.
The nitrapyrin application with fall AA reduced cumulative NH3 losses by 24% compared to spring AA in 2018. No significant difference in NH3 losses between fall AA + NI and spring AA were observed in 2020. Nitrapyrin retards or reduces the nitrification process by interfering with the metabolism of nitrifying bacteria, which retains N in the ammonium form in soil, which is less mobile in the soil and less likely to undergo volatilization [19]. Variability over years with nitrapyrin could be due to the relationship between nitrapyrin and volatilization, which is affected by environmental and soil conditions, including temperature, wind, soil pH, and moisture [65].

3.6.2. Soybean Season

The focus of corn N management is to ensure adequate N supply when demand by the corn plant is greatest and prevent excess N accumulation in the soil, which is critical in minimizing environmental N loss opportunities. We are not aware of any prior studies assessing the effect of corn N management on N loss in the following crop in drained and non-drained soils. In this study, NH3 volatilization losses were evaluated during soybean season in 2019 following corn in 2018 (Figure 3b). The NH3 volatilization losses were cumulative over the growing period of soybeans following corn. The NH3 volatilization per event with fall AA + NI and spring AA was in a range of 4–57 g NH3-N ha−1 d−1 and 5–60 g NH3-N ha−1 d−1 in SD and ND soils, respectively. The range of NH3 volatilization per event with TD urea was 10–116 g NH3-N ha−1 d−1 in SD soils. Higher NH3 fluxes per event were observed in the fall after corn harvest with TD urea compared to fall AA + NI and spring AA in SD soils. This shows that a surface application of N source at V6 and lower N uptake by corn due to dry growing conditions resulted in increased soil residual N in the topsoil. Moreover, warm fall conditions and N availability provided conditions conducive to volatilization losses. This highlights that a delayed application of N fertilizer and lower overall plant N uptake can increase volatilization losses compared to injected N fertilizer. In the same experiment, ref. [47] reported increased soil NO3-N in the profile during the soil sampling after corn harvest in 2018. A peak in volatilization loss was observed with all the N fertilizer treatments in June. This could have resulted from the combined effect of increased soil temperature as well soil disturbance during soybean planting with a no-till drill.
Annual cumulative NH3 loss (p < 0.0001) with fall AA + NI and spring AA in SD soils was 748 g ha−1 and 764 g ha−1, respectively. In ND soils, cumulative NH3 loss with fall AA + NI and spring AA in FD soils was 778 g ha−1 and 792 g ha−1, respectively. The NH3 loss was 50% higher in SD soils with TD urea and NTC treatments compared to fall AA + NI and spring AA applications. The authors of [33] reported reduced soybean yield in 2019 with TD urea (8.5 mg ha−1) compared to fall AA + NI (11.5 mg ha−1) and spring AA (11.4 mg ha−1) treatments in SD soils. The reduced crop growth and soil conditions were more conducive for NH3 volatilization loss which resulted in greater NH3 loss over the year. In addition, organic matter mineralization, crop residue quality, and decomposition at the soil surface probably affected cumulative NH3 loss differently among treatments.

4. Conclusions

This study provides an improved evidence foundation for evaluating the impact of different corn N management strategies in SD and ND soils on N environmental losses in a corn–soybean rotation. Nutrient concentration in subsurface drainage water and gaseous N loss were evaluated for each corn and soybean growing year. During the corn-growing years (2018 and 2020), NO3-N concentration in drainage water was 4–7 mg L−1 higher with fall AA + NI and spring AA compared to TD urea and NTC treatments. The NO3-N concentration in subsurface drainage water was significantly higher for all the fertilizer treatments compared to the NTC. Cumulative N2O loss during the corn-growing years (2018 and 2020) was ranked as spring AA > Fall AA + NI > TD urea > NTC, while cumulative NH3 volatilization loss among different treatments ranked TD urea > spring AA > Fall AA + NI. However, total N2O and NH3 loss in the soybean-growing year was highest with TD urea, followed by spring AA and fall AA + NI. The TD urea application resulted in lower NO3-N concentrations in drainage water compared to the spring and fall AA applications, but there was an increase in NH3 volatilization losses. This research indicates that fall AA + NI or TD urea applications were environmentally a better choice for managing the N concentration in drainage water than the spring AA application. Nonetheless, variable weather conditions after fertilizer application can influence fertilizer fate. Therefore, farmers should evaluate fertilizer sources, application time, and consider the prevailing weather conditions in their region. In this study region, fall AA + NI did not increase gas or leaching loss potential based on drainage water nutrient concentrations compared to a spring AA application. Therefore, using a nitrification inhibitor had similar environmental implications as spring–applied AA, which is useful for the policy and decision makers in encouraging the use of enhanced efficiency fertilizer technology as a tool to manage N fertilizer loss in a corn–soybean rotation. In variable climatic conditions, crop rotations may need to be modified or cover crops can be planted in the winter fallow season to minimize N losses in the rotational crop and capture unused N in the soil profile. This is particularly important based on the placement, timing, and N source selection. Subsequent research in this region should address the effect of enhanced efficiency fertilizer technology (i.e., spring-applied AA with a nitrification inhibitor) on N losses in conjunction with enhanced drainage water management practices in a corn–soybean rotation.

Author Contributions

H.K.: Data curation; writing—original draft. K.A.N.: Data curation; funding acquisition; investigation; project administration; supervision; writing—review and editing. All authors have read and agreed to the published version of the manuscript.

Funding

This research was funded by Foundation for Food and Agriculture Research, grant/award number: 534655, and the 4R Research Fund, grant/award number: IPNI-2017-USA-4RF01.

Institutional Review Board Statement

Not applicable

Informed Consent Statement

Not applicable

Data Availability Statement

Data will be made available on request.

Acknowledgments

The authors would like to thank the Foundation for Food and Agriculture Research, grant/award number: 534655, and the 4R Research Fund, grant/award number: IPNI-2017-USA-4RF01 for their financial support of this research. We would also like to thank the technicians, students, and support staff for their help with this research.

Conflicts of Interest

The authors declare no conflicts of interest.

References

  1. Sharratt, B.S.; Zandlo, J.; Spoden, G. Frequency of Precipitation across the Northern U.S. Corn Belt. J. Appl. Meteorol. 2001, 40, 183–191. [Google Scholar] [CrossRef]
  2. Jarecki, M.K.; Hatfield, J.L.; Barbour, W. Modeled Nitrous Oxide Emissions from Corn Fields in Iowa Based on County Level Data. J. Environ. Qual. 2015, 44, 431–441. [Google Scholar] [CrossRef] [PubMed]
  3. Sebilo, M.; Mayer, B.; Nicolardot, B.; Pinay, G.; Mariotti, A. Long-term fate of nitrate fertilizer in agricultural soils. Proc. Natl. Acad. Sci. USA 2013, 110, 18185–18189. [Google Scholar] [CrossRef] [PubMed]
  4. Drury, C.; Reynolds, W.; Parkin, G.; Lauzon, J.; Saso, J.; Zhang, T.; Yang, X.; Tan, C.; Liu, K.; Calder, W.; et al. Solute dynamics and the Ontario nitrogen index: II. Nitrate leaching. Can. J. Soil Sci. 2016, 96, 122–135. [Google Scholar] [CrossRef]
  5. Pan, B.; Lam, S.K.; Mosier, A.; Luo, Y.; Chen, D. Ammonia volatilization from synthetic fertilizers and its mitigation strategies: A global synthesis. Agric. Ecosyst. Environ. 2016, 232, 283–289. [Google Scholar] [CrossRef]
  6. Drury, C.F.; Yang, X.; Reynolds, W.D.; Calder, W.; Oloya, T.O.; Woodley, A.L. Combining Urease and Nitrification Inhibitors with Incorporation Reduces Ammonia and Nitrous Oxide Emissions and Increases Corn Yields. J. Environ. Qual. 2017, 46, 939–949. [Google Scholar] [CrossRef] [PubMed]
  7. Woodley, A.L.; Drury, C.F.; Yang, X.Y.; Phillips, L.A.; Reynolds, D.W.; Calder, W.; Oloya, T.O. Ammonia volatilization, nitrous oxide emissions, and corn yields as influenced by nitrogen placement and enhanced efficiency fertilizers. Soil Sci. Soc. Am. J. 2020, 84, 1327–1341. [Google Scholar] [CrossRef]
  8. Reay, D.S.; Davidson, E.A.; Smith, K.A.; Smith, P.; Melillo, J.M.; Dentener, F.; Crutzen, P.J. Global agriculture and nitrous oxide emissions. Nat. Clim. Change 2012, 2, 410–416. [Google Scholar] [CrossRef]
  9. Shcherbak, I.; Millar, N.; Robertson, G.P. Global metaanalysis of the nonlinear response of soil nitrous oxide (N2O) emissions to fertilizer nitrogen. Proc. Natl. Acad. Sci. USA 2014, 111, 9199–9204. [Google Scholar] [CrossRef]
  10. Le Moal, M.; Gascuel-Odoux, C.; Ménesguen, A.; Souchon, Y.; Étrillard, C.; Levain, A.; Moatar, F.; Pannard, A.; Souchu, P.; Lefebvre, A.; et al. Eutrophication: A new wine in an old bottle? Sci. Total Environ. 2019, 651, 1–11. [Google Scholar] [CrossRef]
  11. Guo, J.H.; Liu, X.J.; Zhang, Y.; Shen, J.L.; Han, W.X.; Zhang, W.F.; Christie, P.; Goulding, K.W.T.; Vitousek, P.M.; Zhang, F.S. Significant Acidification in Major Chinese Croplands. Science 2010, 327, 1008–1010. [Google Scholar] [CrossRef] [PubMed]
  12. An, Z.; Huang, R.-J.; Zhang, R.; Tie, X.; Li, G.; Cao, J.; Zhou, W.; Shi, Z.; Han, Y.; Gu, Z.; et al. Severe haze in northern China: A synergy of anthropogenic emissions and atmospheric processes. Proc. Natl. Acad. Sci. USA 2019, 116, 8657–8666. [Google Scholar] [CrossRef] [PubMed]
  13. Blann, K.L.; Anderson, J.L.; Sands, G.R.; Vondracek, B. Effects of Agricultural Drainage on Aquatic Ecosystems: A Review. Crit. Rev. Environ. Sci. Technol. 2009, 39, 909–1001. [Google Scholar] [CrossRef]
  14. Skaggs, R.W.; Brevé, M.A.; Gilliam, J.W. Hydrologic and water quality impacts of agricultural drainage∗. Crit. Rev. Environ. Sci. Technol. 1994, 24, 1–32. [Google Scholar] [CrossRef]
  15. Flis, S. The 4Rs in crop nitrogen research. Crop. Soils 2017, 50, 18–20. [Google Scholar] [CrossRef]
  16. Dinnes, D.L.; Karlen, D.L.; Jaynes, D.B.; Kaspar, T.C.; Hatfield, J.L.; Colvin, T.S.; Cambardella, C.A. Nitrogen Management Strategies to Reduce Nitrate Leaching in Tile-Drained Midwestern Soils. Agron. J. 2002, 94, 153–171. [Google Scholar] [CrossRef]
  17. Christianson, L.E.; Harmel, R.D. 4R Water Quality Impacts: An Assessment and Synthesis of Forty Years of Drainage Nitrogen Losses. J. Environ. Qual. 2015, 44, 1852–1860. [Google Scholar] [CrossRef] [PubMed]
  18. Robertson, G.P.; Vitousek, P.M. Nitrogen in Agriculture: Balancing the Cost of an Essential Resource. Annu. Rev. Environ. Resour. 2009, 34, 97–125. [Google Scholar] [CrossRef]
  19. Timilsena, Y.P.; Adhikari, R.; Casey, P.; Muster, T.; Gill, H.; Adhikari, B. Enhanced efficiency fertilisers: A review of formulation and nutrient release patterns. J. Sci. Food Agric. 2015, 95, 1131–1142. [Google Scholar] [CrossRef]
  20. Wolt, J.D. A meta-evaluation of nitrapyrin agronomic and environmental effectiveness with emphasis on corn production in the Midwestern USA. Nutr. Cycl. Agroecosystems 2004, 69, 23–41. [Google Scholar] [CrossRef]
  21. Pittelkow, C.M.; Clover, M.W.; Hoeft, R.G.; Nafziger, E.D.; Warren, J.J.; Gonzini, L.C.; Greer, K.D. Tile Drainage Nitrate Losses and Corn Yield Response to Fall and Spring Nitrogen Management. J. Environ. Qual. 2017, 46, 1057–1064. [Google Scholar] [CrossRef] [PubMed]
  22. Vetsch, J.A.; Randall, G.W.; Fernández, F.G. Nitrate Loss in Subsurface Drainage from a Corn–Soybean Rotation as Affected by Nitrogen Rate and Nitrapyrin. J. Environ. Qual. 2019, 48, 988–994. [Google Scholar] [CrossRef] [PubMed]
  23. Thapa, R.; Chatterjee, A.; Awale, R.; McGranahan, D.A.; Daigh, A. Effect of Enhanced Efficiency Fertilizers on Nitrous Oxide Emissions and Crop Yields: A Meta-analysis. Soil Sci. Soc. Am. J. 2016, 80, 1121–1134. [Google Scholar] [CrossRef]
  24. Ma, Y.; Sun, L.; Zhang, X.; Yang, B.; Wang, J.; Yin, B.; Yan, X.; Xiong, Z. Mitigation of nitrous oxide emissions from paddy soil under conventional and no-till practices using nitrification inhibitors during the winter wheat-growing season. Biol. Fertil. Soils 2012, 49, 627–635. [Google Scholar] [CrossRef]
  25. Akiyama, H.; Yan, X.; Yagi, K. Evaluation of effectiveness of enhanced-efficiency fertilizers as mitigation options for N2O and NO emissions from agricultural soils: Meta-analysis. Glob. Change Biol. 2010, 16, 1837–1846. [Google Scholar] [CrossRef]
  26. Kim, D.-G.; Saggar, S.; Roudier, P. The effect of nitrification inhibitors on soil ammonia emissions in nitrogen managed soils: A meta-analysis. Nutr. Cycl. Agroecosystems 2012, 93, 51–64. [Google Scholar] [CrossRef]
  27. Lam, S.K.; Suter, H.; Mosier, A.R.; Chen, D. Using nitrification inhibitors to mitigate agricultural N2O emission: A double-edged sword? Glob. Change Biol. 2017, 23, 485–489. [Google Scholar] [CrossRef] [PubMed]
  28. Stewart, M. Fertilizer sources for irrigated corn. In Fertilizer Sources for Irrigated Corn; International Plant Nutrition Institute: Peachtree Corners, GA, USA, 2008; pp. 13–18. [Google Scholar]
  29. Halvorson, A.D.; Del Grosso, S.J.; Alluvione, F. Nitrogen Source Effects on Nitrous Oxide Emissions from Irrigated No-Till Corn. J. Environ. Qual. 2010, 39, 1554–1562. [Google Scholar] [CrossRef] [PubMed]
  30. Halvorson, A.D.; Del Grosso, S.J.; Alluvione, F. Tillage and Inorganic Nitrogen Source Effects on Nitrous Oxide Emissions from Irrigated Cropping Systems. Soil Sci. Soc. Am. J. 2010, 74, 436–445. [Google Scholar] [CrossRef]
  31. Sommer, S.G.; Schjoerring, J.K.; Denmead, O. Ammonia Emission from Mineral Fertilizers and Fertilized Crops. Adv. Agron. 2004, 82, 557–622. [Google Scholar] [CrossRef]
  32. Nelson, K.A.; Scharf, P.C.; Bundy, L.G.; Tracy, P. Agricultural Management of Enhanced-Efficiency Fertilizers in the North-Central United States. Crop Manag. 2008, 7, 1–12. [Google Scholar] [CrossRef]
  33. Kaur, H.; Nelson, K.A.; Singh, G.; Kaur, G. Subsurface drainage and nitrogen management affects corn and soybean yield in claypan soils in upstate Missouri. Agron. J. 2023, 116, 153–169. [Google Scholar] [CrossRef]
  34. Kaur, H.; Nelson, K.A.; Wikle, C.K.; Ferguson, R.; Singh, G. Nitrogen fertilizer and pronitridine rates for corn production in the Midwest U.S. Field Crop. Res. 2024, 306, 109200. [Google Scholar] [CrossRef]
  35. USDA NRCS (Natural Resources Conservation Service). National Conservation Practice Standards; USDA Natural Resources Conservation Service: Washington, DC, USA, 2016. Available online: http://www.nrcs.usda.gov/wps/portal/nrcs/detail/national/technical/?cid=NRCSDEV11_001020 (accessed on 25 July 2024).
  36. Parkin, T.; Mosier, A.; Smith, J.; Venterea, R.; Johnson, J.; Reicosky, D.; Doyle, G.; McCarty, G.; Baker, J. USDA-ARS GRACEnet Chamber-Based Trace Gas Flux Measurement Protocol; USDA: Washington, DC, USA, 2003. Available online: http://www.ars.usda.gov/SP2UserFiles/person/31831/2003GRACEnetTraceGasProtocol.pdf (accessed on 24 April 2003).
  37. Nash, P.R.; Motavalli, P.P.; Nelson, K.A. Nitrous Oxide Emissions from Claypan Soils Due to Nitrogen Fertilizer Source and Tillage/Fertilizer Placement Practices. Soil Sci. Soc. Am. J. 2012, 76, 983–993. [Google Scholar] [CrossRef]
  38. Griggs, B.R.; Norman, R.J.; Wilson, C.E.; Slaton, N.A. Ammonia Volatilization and Nitrogen Uptake for Conventional and Conservation Tilled Dry-Seeded, Delayed-Flood Rice. Soil Sci. Soc. Am. J. 2007, 71, 745–751. [Google Scholar] [CrossRef]
  39. Nathan, M.; Sun, Y. Methods for plant analysis. In A Guide for Conducting Plant Analysis in Missouri; University of Missouri-Columbia: Columbia, MO, USA, 2006. [Google Scholar]
  40. Coleman, M.V.; Thomas, D.J.D. The Structure of Silicon Oxide Films. Phys. Status Solidi (b) 1967, 22, 593–602. [Google Scholar] [CrossRef]
  41. Chapman, H.D. Cation-exchange capacity. In Methods of Soil Analysis: Part 2 Chemical and Microbiological Properties; Amer Society of Agronomy: Madison, WI, USA, 1965; Volume 9, pp. 891–901. Available online: https://www.scirp.org/reference/referencespapers?referenceid=1485982 (accessed on 25 July 2024).
  42. Ball, D.F. Loss-on-ignition as an estimate of organic matter and organic carbon in non-calcareous soils. J. Soil Sci. 1964, 15, 84–92. [Google Scholar] [CrossRef]
  43. Miller, C.J.; Mi, H.; Yesiller, N. experimental analysis of desiccation crack propagation in clay liners. JAWRA J. Am. Water Resour. Assoc. 1998, 34, 677–686. [Google Scholar] [CrossRef]
  44. Randall, G.W.; Mulla, D.J. Nitrate Nitrogen in Surface Waters as Influenced by Climatic Conditions and Agricultural Practices. J. Environ. Qual. 2001, 30, 337–344. [Google Scholar] [CrossRef]
  45. Hendrickson, L.L.; Walsh, L.M.; Keeney, D.R. Effectiveness of Nitrapyrin in Controlling Nitrification of Fall and Spring-Applied Anhydrous Ammonia. Agron. J. 1978, 70, 704–708. [Google Scholar] [CrossRef]
  46. Randall, G.W.; Vetsch, J.A.; Huffman, J.R. Nitrate Losses in Subsurface Drainage from a Corn–Soybean Rotation as Affected by Time of Nitrogen Application and Use of Nitrapyrin. J. Environ. Qual. 2003, 32, 1764–1772. [Google Scholar] [CrossRef]
  47. Kaur, H. Drainage Water Management Practices Affect Water Quality, Soil Properties, and Crop Production. Doctoral Dissertation, University of Missouri-Columbia, Columbia, MO, USA, 2023. [Google Scholar]
  48. Bar-Tal, A. The effects of nitrogen form on interactions with potassium. In Nitrogen and Potassium Interactions; International Potash Institute: Zug, Switzerland, 2011; p. 9. [Google Scholar]
  49. Jaynes, D.; Colvin, T.; Karlen, D.; Cambardella, C.; Meek, D. Nitrate Loss in Subsurface Drainage as Affected by Nitrogen Fertilizer Rate. J. Environ. Qual. 2001, 30, 1305–1314. [Google Scholar] [CrossRef]
  50. Lawlor, P.A.; Helmers, M.J.; Baker, J.L.; Melvin, S.W.; Lemke, D.W. Nitrogen Application Rate Effect on Nitrate-Nitrogen Concentration and Loss in Subsurface Drainage for a Corn-Soybean Rotation. Trans. ASABE 2008, 51, 83–94. [Google Scholar] [CrossRef]
  51. Baldwin, D.S.; Mitchell, A.M. The effects of drying and re-flooding on the sediment and soil nutrient dynamics of lowland river–floodplain systems: A synthesis. Regul. Rivers Res. Manag. Int. J. Devoted River Res. Manag. 2000, 16, 457–467. [Google Scholar] [CrossRef]
  52. Drury, C.F.; Reynolds, W.D.; Yang, X.M.; McLaughlin, N.B.; Welacky, T.W.; Calder, W.; Grant, C.A. Nitrogen Source, Application Time, and Tillage Effects on Soil Nitrous Oxide Emissions and Corn Grain Yields. Soil Sci. Soc. Am. J. 2012, 76, 1268–1279. [Google Scholar] [CrossRef]
  53. Halvorson, A.D.; Del Grosso, S.J.; Reule, C.A. Nitrogen, Tillage, and Crop Rotation Effects on Nitrous Oxide Emissions from Irrigated Cropping Systems. J. Environ. Qual. 2008, 37, 1337–1344. [Google Scholar] [CrossRef]
  54. Parkin, T.B.; Hatfield, J.L. Enhanced Efficiency Fertilizers: Effect on Nitrous Oxide Emissions in Iowa. Agron. J. 2014, 106, 694–702. [Google Scholar] [CrossRef]
  55. Feng, J.; Li, F.; Deng, A.; Feng, X.; Fang, F.; Zhang, W. Integrated assessment of the impact of enhanced-efficiency nitrogen fertilizer on N2O emission and crop yield. Agric. Ecosyst. Environ. 2016, 231, 218–228. [Google Scholar] [CrossRef]
  56. Parkin, T.; Hatfield, J. Influence of nitrapyrin on N2O losses from soil receiving fall-applied anhydrous ammonia. Agric. Ecosyst. Environ. 2010, 136, 81–86. [Google Scholar] [CrossRef]
  57. Wu, T.-Y.; Ma, B.L.; Liang, B.C. Quantification of seasonal soil nitrogen mineralization for corn production in eastern Canada. Nutr. Cycl. Agroecosystems 2007, 81, 279–290. [Google Scholar] [CrossRef]
  58. Venterea, R.T.; Maharjan, B.; Dolan, M.S. Fertilizer Source and Tillage Effects on Yield-Scaled Nitrous Oxide Emissions in a Corn Cropping System. J. Environ. Qual. 2011, 40, 1521–1531. [Google Scholar] [CrossRef]
  59. Abalos, D.; Recous, S.; Butterbach-Bahl, K.; De Notaris, C.; Rittl, T.F.; Topp, C.F.; Petersen, S.O.; Hansen, S.; Bleken, M.A.; Rees, R.M.; et al. A review and me-ta-analysis of mitigation measures for nitrous oxide emissions from crop residues. Sci. Total Environ. 2022, 828, 154388. [Google Scholar] [CrossRef] [PubMed]
  60. Al-Kanani, T.; MacKenzie, A.F.; Barthakur, N.N. Soil Water and Ammonia Volatilization Relationships with Surface-Applied Nitrogen Fertilizer Solutions. Soil Sci. Soc. Am. J. 1991, 55, 1761–1766. [Google Scholar] [CrossRef]
  61. de Ruijter, F.; Huijsmans, J.; Rutgers, B. Ammonia volatilization from crop residues and frozen green manure crops. Atmos. Environ. 2010, 44, 3362–3368. [Google Scholar] [CrossRef]
  62. Ma, B.L.; Wu, T.Y.; Tremblay, N.; Deen, W.; Morrison, M.J.; Mclaughlin, N.B.; Gregorich, E.G.; Stewart, G. Nitrous oxide fluxes from corn fields: On-farm assessment of the amount and timing of nitrogen fertilizer. Glob. Change Biol. 2009, 16, 156–170. [Google Scholar] [CrossRef]
  63. Fujinuma, R.; Balster, N.J.; Norman, J.M. An Improved Model of Nitrogen Release for Surface-applied Controlled-release Fertilizer. Soil Sci. Soc. Am. J. 2009, 73, 2043–2050. [Google Scholar] [CrossRef]
  64. Stamper, J.D. Evaluation of Method of Placement, Timing, and Rate of Application for Anhydrous Ammonia in No-till Corn Production. Doctoral Dissertation, Kansas State University, Manhattan, KS, USA, 2009. [Google Scholar]
  65. Woodward, E.E.; Edwards, T.M.; Givens, C.E.; Kolpin, D.W.; Hladik, M.L. Widespread Use of the Nitrification Inhibitor Nitrapyrin: Assessing Benefits and Costs to Agriculture, Ecosystems, and Environmental Health. Environ. Sci. Technol. 2021, 55, 1345–1353. [Google Scholar] [CrossRef]
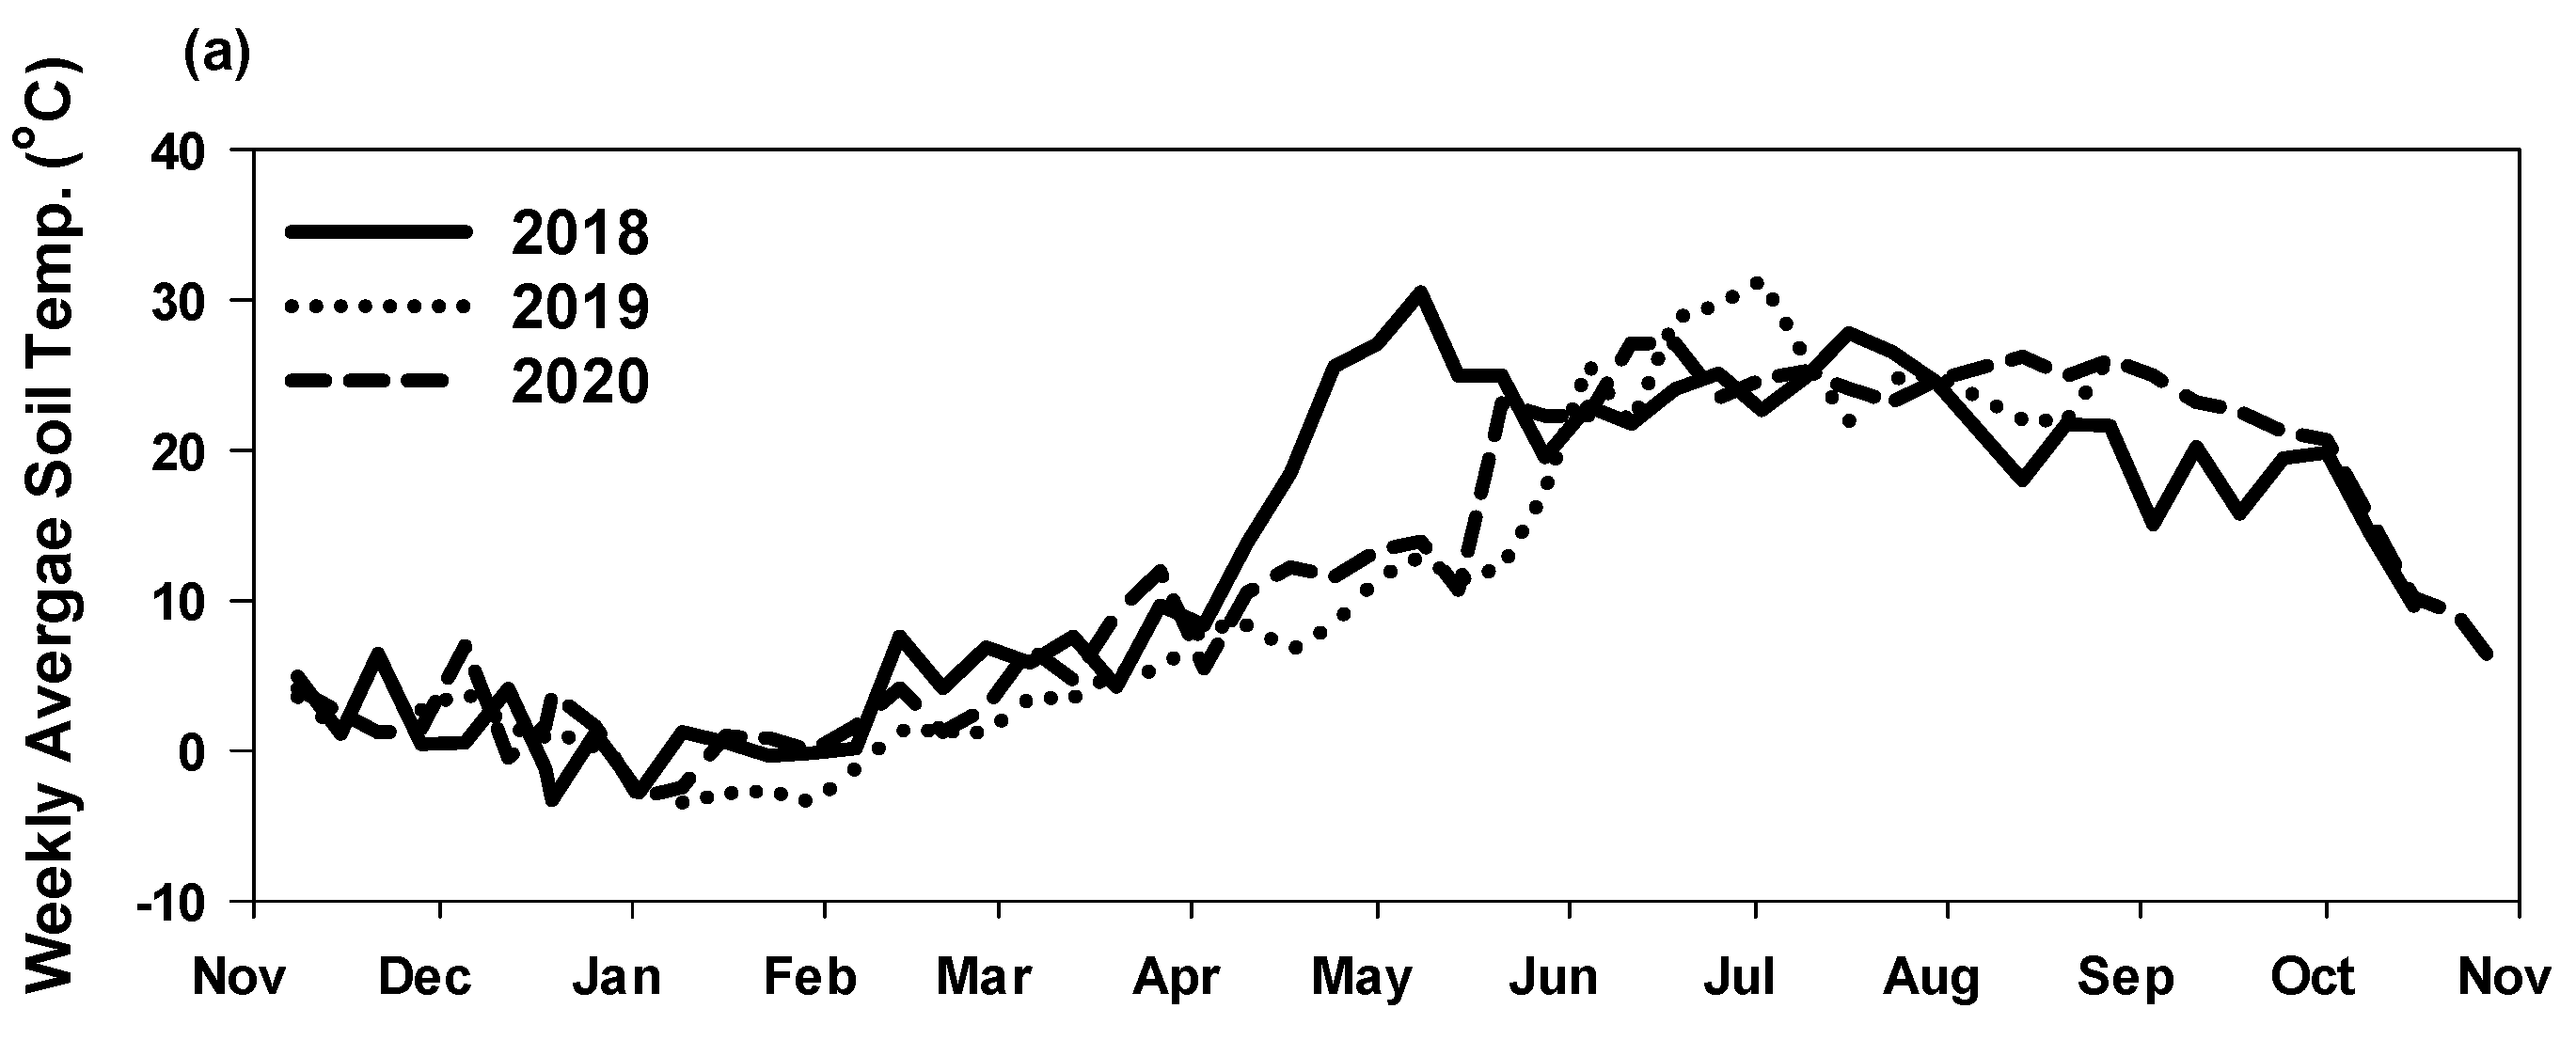
Figure 1. Daily soil temperature (a) from November to October in 2018, 2019, and 2020. Daily (bars) and cumulative (lines) precipitation from November to October at the University of Missouri Greenley Research Center in (b) 2018, (c) 2019, and (d) 2020.
Sustainability 16 06477 g001aSustainability 16 06477 g001b
Figure 2. Nitrogen fertilizer (non-treated control = NTC; SuperU and ESN top dress application = TD; fall anhydrous ammonia + nitrapyrin = Fall AA + NI; and pre-plant anhydrous ammonia = spring AA) effects on soil N2O flux and cumulative emission in subsurface-drained (SD) and non-drained (ND) soil from November to October in (a) 2018 and (b) 2020. Letters following cumulative loss from N fertilizer treatments represent significant (p < 0.1) differences among treatments within a year.
Sustainability 16 06477 g002aSustainability 16 06477 g002b
Figure 3. Nitrogen fertilizer source (non-treated control = NTC; SuperU and ESN top dress application = TD; fall anhydrous ammonia + nitrapyrin = Fall AA + NI; and pre-plant anhydrous ammonia = spring AA) effects on soil (a) N2O and (b) NH3 flux, and cumulative emissions in subsurface-drained (SD) and non-drained (ND) soil from November 2018 to October 2019 during soybean. Letters following cumulative loss from N source represent significant (p < 0.1) differences among treatments within a year.
Sustainability 16 06477 g003
Figure 4. Nitrogen fertilizer source (non-treated control = NTC; SuperU and ESN top dress application = TD; fall anhydrous ammonia + nitrapyrin = Fall AA+NI; and pre-plant anhydrous ammonia = spring AA) effects on soil NH3 flux and cumulative emission in subsurface-drained (SD) and non-drained (ND) soil from November to October in (a) 2018 and (b) 2020. Letters following cumulative loss from N source represent significant (p < 0.1) differences among treatments within a year.
Sustainability 16 06477 g004aSustainability 16 06477 g004b
Table 1. Average concentrations of nitrate-N (NO3-N), total phosphorus (TP), and total potassium (TK) in subsurface drainage water from non-treated control (NTC), SuperU and ESN top dress application (TD urea), fall anhydrous ammonia + nitrapyrin (fall AA + NI), and pre-plant anhydrous ammonia (spring AA). Within a column, different letters indicate significant differences at α = 0.1.
Fertilizer YearNO3-NTPTK
--------------mg L−1-------------
NTC 8.9 b1 ab4.5 c
TD urea 9.1 b1.1 a4.3 a
Fall AA + NI 14.6 a1.1 a3.7 bc
Spring AA 13.8 a0.9 b2.5 ab
p-value <0.00010.03740.0001
201813.2 a0.3 a6.3 a
202010 b1.7 b1.2 b
p-value<0.0001<0.0001<0.0001
NTC20189 bc0.3 c7.8 c
TD urea201810.4 bc0.4 b7.2 a
Fall AA + NI201817.6 a0.4 b6.2 a
Spring AA201815.8 a0.3 c3.8 b
NTC20208.8 bc1.8 a1.2 d
TD urea20207.8 c1.8 a1.3 d
Fall AA + NI202011.6 b1.8 a1.2 d
Spring AA202011.7 b1.5 a1.2 d
p-value 0.0260.09540.0007
Table 2. Corn (2018 and 2020) and soybean (2019) yield-scaled N2O (g N2O-N mg−1) emissions analyzed by the main effect of drainage and N fertilizer source. Means followed by different letters in a column indicate significant differences at α = 0.1.
Treatment Fertilizer 201820192020
-----------g N2O-N mg−1-----------
SDNTC47.7 bc56.6 bc43.2 b
TD urea43.3 c79.4 abc27.1 c
Fall AA + NI68.7 ab52.9 c21.8 c
Spring AA68.8 ab70.6 abc25.2 c
NDNTC50.7 bc83.9 ab68.9 a
Fall AA + NI60.7 abc63.4 abc28.6 c
Spring AA80.1 a85.3 a22.5 c
p-value 0.07970.14390.0002
SD, subsurface drainage; ND, no drainage. NTC, non-treated control; TD urea, SuperU and ESN top dress (25:75%) application; Fall AA + NI, fall anhydrous ammonia + nitrapyrin; and Spring AA, pre-plant anhydrous ammonia.
Disclaimer/Publisher’s Note: The statements, opinions and data contained in all publications are solely those of the individual author(s) and contributor(s) and not of MDPI and/or the editor(s). MDPI and/or the editor(s) disclaim responsibility for any injury to people or property resulting from any ideas, methods, instructions or products referred to in the content.