Article

Spatiotemporal Characterization of the Three-Dimensional Morphology of Urban Buildings Based on Moran’s I

School of Geomatics and Urban Spatial Information, Beijing University of Civil Engineering and Architecture, Beijing 100044, China
*
Authors to whom correspondence should be addressed.
Sustainability 2024, 16(15), 6540; https://doi.org/10.3390/su16156540
Submission received: 5 June 2024 / Revised: 19 July 2024 / Accepted: 29 July 2024 / Published: 31 July 2024

Abstract

:
The three-dimensional morphological analysis of urban buildings constitutes a pivotal component of urban planning and sustainable development. Nevertheless, the majority of current research is two-dimensional in nature, which constrains the comprehensive understanding of urban spatial–temporal evolution. The existing body of three-dimensional studies frequently fails to consider the temporal dimension of architectural change and lacks a detailed examination of micro areas such as communities and streets. In order to accurately identify the patterns of spatial–temporal evolution in urban architectural morphology, this study focuses on the Yau Tsim Mong District in Hong Kong, utilizing three-dimensional data. By innovatively integrating temporal factors, constructing a spatial–temporal weight matrix, and applying the spatial–temporal Moran’s I, this study conducts an in-depth quantitative analysis of Coverage, Staggeredness, and Duty Cycle at the community scale, neighborhood scale, and urban scale. From 2014 to 2023, the global spatial–temporal Moran’s I of key urban morphology indicators in Yau Tsim Mong District has exhibited a marked increase, underscoring the close interrelationship and significant optimization between urban morphology and overall development. The findings illustrate that urban architecture is undergoing a process of agglomeration and high homogeneity, with strategic shifts emphasizing efficient spatial utilization and refined design. The analysis at the neighborhood scale is of particular importance, as its independent and complete spatial structure effectively captures local dynamics, revealing high-value agglomeration and low-value dispersion characteristics. This suggests that buildings in the Yau Tsim Mong District are being constructed in a more compact manner at the neighborhood level, which reflects the precision and efficiency of urban planning and the rationality of spatial planning. These significant findings provide valuable references for the development planning and governance of sustainable cities. They enhance urban governance capabilities and promote the optimization of urban development strategies, ensuring steady progress on the path of efficiency, harmony, and sustainability.

1. Introduction

The rapid acceleration of large-scale urbanization processes worldwide is driving cities to expand vertically as well as horizontally, due to the surge in urban populations and the scarcity of land resources [1,2]. The continuous expansion of urban areas, the rise of megacities, and the swift development of high-rise buildings are collectively shaping a more modern and three-dimensional urban landscape [3]. Consequently, there is an increasing demand from the international community for higher standards to be applied to urban development. This has led to a greater emphasis on the scientific assessment of urban development, the planning of urban structures and the assurance of sustainability and livability [4,5].
The discipline of urban morphology is concerned with the physical form and structure of cities [6]. By examining a range of indicators pertinent to urban morphology, it is possible to express the spatial structure and internal relationships of cities in quantitative terms [7]. An examination of urban morphology from a sustainability perspective, coupled with an evaluation of urban architecture, facilitates the formulation of urban planning strategies and provides robust support for sustainable urban development [8,9].
Since the concept of sustainable development was introduced, it has attracted considerable attention from scholars engaged in research on the built environment and cities [8]. The analysis of changes in urban morphology constitutes a fundamental reference point for the pursuit of sustainable urbanization [1]. Historically, a significant proportion of research on urban morphology has concentrated on the two-dimensional aspect, which is inadequate for meeting the needs of modern cities [10].
In recent years, the rapid advancements in computer technology and data acquisition techniques have facilitated a new phase of academic exploration of urban morphology [11,12,13,14,15,16,17,18,19,20]. A considerable number of scholars have engaged in regional analysis of urban three-dimensional morphology, precise measurement of residential space morphology, and in-depth analysis of the spatial–temporal differentiation of urban three-dimensional morphology, thereby significantly enriching the research in this field [21,22,23,24,25,26,27,28,29,30,31,32,33,34,35,36]. It is noteworthy that morphological indicators, which are of great importance in urban planning research, are widely employed to elucidate the intrinsic logic and mechanisms of urban spatial development. They provide substantial support for the analysis of urban development changes [36,37,38,39,40,41,42,43,44,45,46,47,48].
Concurrently, the scope of urban morphology research has been progressively extended. Scholars have broadened their perspectives beyond the morphology itself to encompass various aspects of urban development [17,22,23,24,25]. This has led to a closer link between urban morphology and issues such as traffic congestion, environmental quality and social equity. This has resulted in interdisciplinary and multidimensional comprehensive discussions [37,49,50,51]. This shift is indicative of the contemporary value and social significance of urban morphology research.
A substantial corpus of accumulated research evidence provides compelling evidence of the close link between urban morphology and the quality of the urban environment and sustainable development patterns [8]. The quantitative analysis of urban morphology indicators enables the scientific assessment of urban development sustainability, thereby providing a robust theoretical foundation for the construction of green, low-carbon, and livable urban environments [14,15,16,17,18,19,20,21,22,23,24,25,26,27,43]. Furthermore, this provides a highly valuable reference point and guidance for optimizing urban planning and layout [4,5,6,7,8,9]. The findings of this series of research studies not only enhance our comprehension of urban morphology but also indicate potential avenues for fostering more harmonious and sustainable urban development.
Notwithstanding the current emphasis on the evolving nature of urban spatial structures, there remains a notable research gap in the exploration of the specific changes in urban architectural forms over time [7,27,28,29,30,31,32,33,34,35,36,38,51,52,53]. Although some studies have sought to integrate spatial and temporal factors, they frequently adopt a macro-level perspective when examining the evolutionary patterns of cities, thereby overlooking the intricate changes occurring at the micro level, such as those observed in streets and communities [42,43,44,45,46,47,54]. This limitation constrains our comprehensive understanding of the complexity of urban architectural morphology and also fails to precisely capture and reveal the critical details that shape the unique characteristics of cities. It is therefore imperative that future research should seek to strengthen the detailed analysis of urban architecture over time, while balancing macro and micro perspectives.
In order to address the aforementioned research gap, this study employs the Spatial–temporal Moran’s I as an analytical tool in order to conduct a detailed quantitative analysis of urban morphology indicators across multiple scales, including the community scale, the neighborhood scale and the urban scale. This study aims to provide a detailed and comprehensive exploration of the spatial–temporal evolution patterns of urban architectural three-dimensional morphology at different spatial scales. The objective is to depict the dynamic characteristics and complex structures of urban architectural morphology in a more accurate and precise manner. The objective of this research is to enhance urban architectural morphology in a manner that reinvigorates sustainable urban development, optimizes resource utilization, enhances the quality of life for residents and contributes to the creation of greener, more livable and harmonious urban environments.

2. Study Area and Data Source
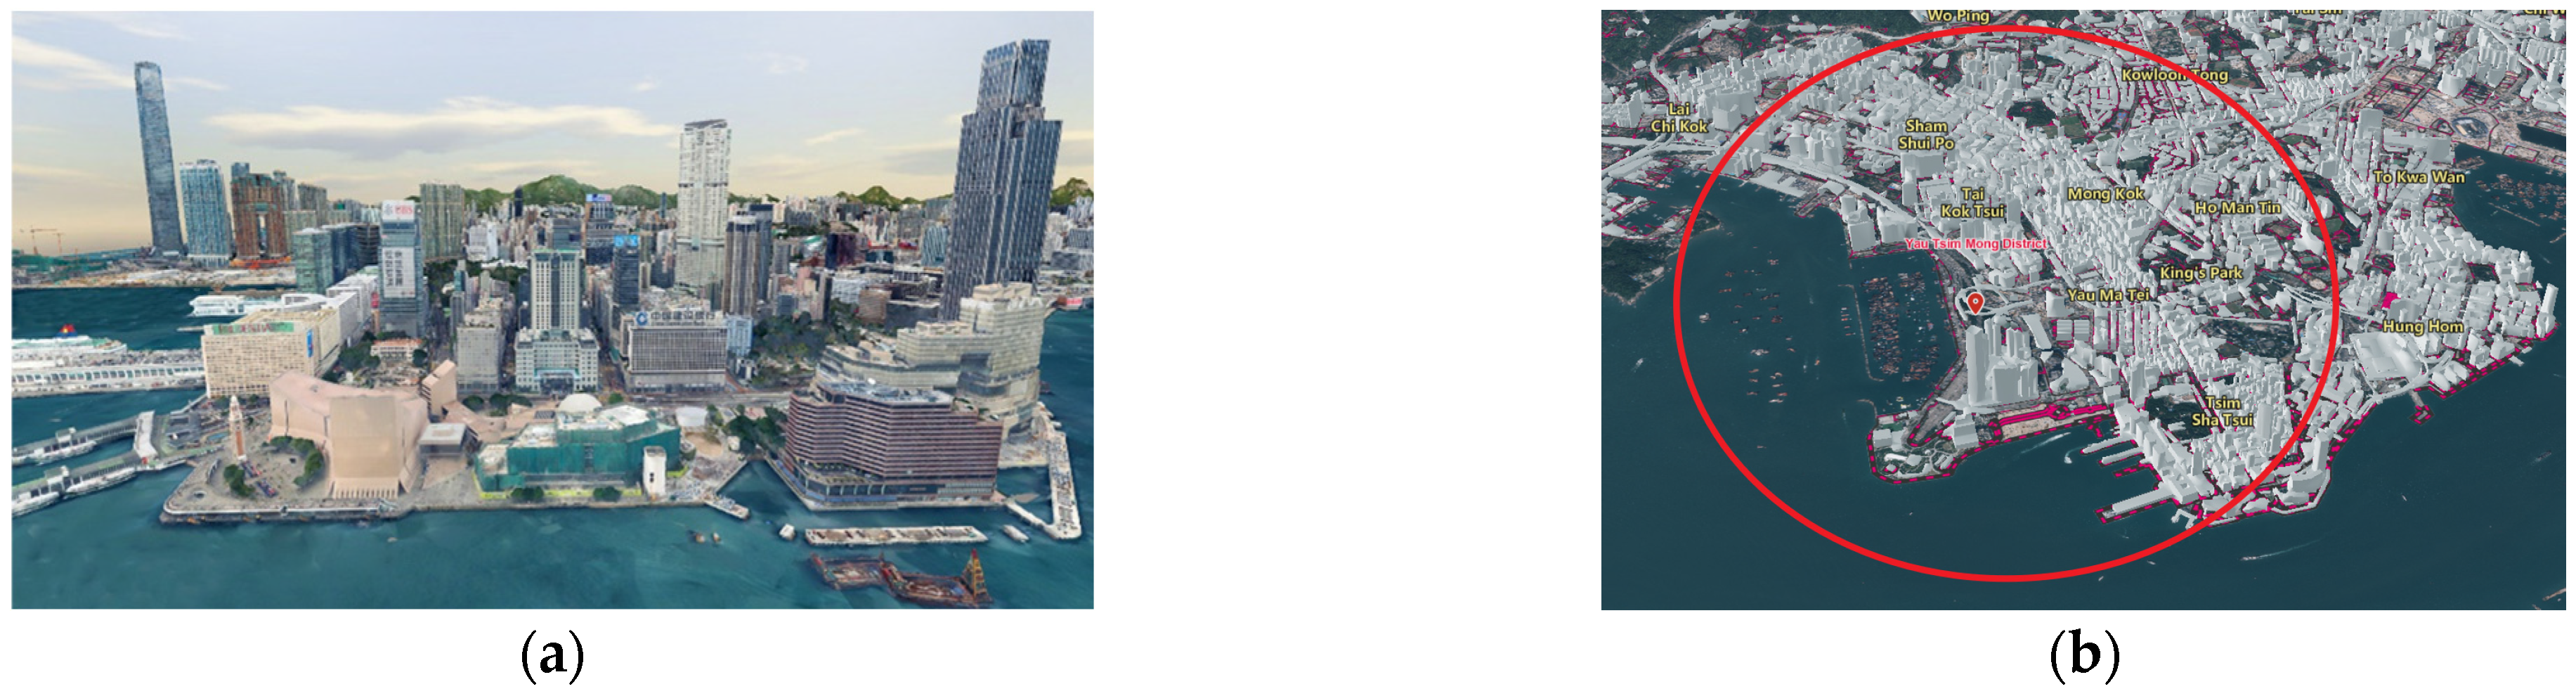
2.1. Study Area

The Yau Tsim Mong District is situated at the dynamic southern extremity of the Kowloon Peninsula and represents one of Hong Kong’s most emblematic areas, largely due to its distinctive geographical location and rich cultural heritage (Figure 1). This district is a densely populated area comprising the vibrant commercial districts of Yau Ma Tei, Tsim Sha Tsui, and Mong Kok. Each of these areas has a distinctive historical legacy and a contemporary urban character. The architectural space morphology within Yau Tsim Mong District is characterized by a high degree of complexity and variety. It encompasses a diverse array of building types, including historic traditional structures and contemporary skyscrapers, which collectively contribute to the formation of the district’s distinctive urban landscape. An examination of the spatial characteristics of these buildings is essential for a more profound comprehension of the structure, function, and evolution of Hong Kong’s urban space.
Furthermore, the cultural facilities within Yau Tsim Mong District, such as museums, art galleries, and theatres, are fundamental elements in the study of urban space. Such facilities not only enrich the cultural and spiritual lives of residents but also facilitate cultural exchange and dissemination. In the planning of future urban spaces, it is of the utmost importance to give full consideration to the layout and functions of these cultural facilities. This will ensure that they contribute to sustainable urban development while creating a more diverse and higher quality living experience for citizens [55].

2.2. Data Sources

The data employed in this study are principally derived from the Hong Kong Special Administrative Region Planning Department and Google Earth’s photorealistic 3D data service. The dataset includes oblique photogrammetric models from 2014 to 2023, which provide detailed three-dimensional representations of the built environment in the Yau Tsim Mong District, illustrating the temporal changes that have occurred (Figure 2). Concurrently, data on urban land use types and spatial information during the same period were collected, thereby providing a scientific basis for understanding the distribution and changes in different land use types in the Yau Tsim Mong District.

3. Methodology

3.1. Urban Morphology Indicators

This study builds upon existing research to further explore the spatiotemporal characteristics of urban architectural 3D morphology in the Yau Tsim Mong District of Hong Kong through a quantitative analysis of urban morphology indicators [1,4,5,6,7,8,9,22]. In order to meet the research objectives, four relevant urban morphology indicators (Table 1) were selected with great care to provide a comprehensive and accurate representation of the urban architectural morphology characteristics of the area in question. In particular, the “Staggeredness” index, defined as the ratio of Building Height Standard Deviation to Building Height, was introduced to visually illustrate the distribution differences in building heights. Furthermore, the concepts of “Duty Cycle” and “Coverage” offer a novel interpretation of traditional measures such as Building Volume Density and Building Floor Area Ratio [7,29]. Table 1 provides detailed descriptions of each indicator, offering clear and standardized references for subsequent analysis and citation purposes.

3.2. Moran’s I

The objective of spatial autocorrelation studies is to investigate the correlation between the observation values of a given attribute within disparate spatial regions. This is achieved by focusing on the spatial structural characteristics of variables, with the aim of elucidating the inherent connections between regions [56,57]. The concept is divided into two main categories: global and local autocorrelation. Global autocorrelation typically employs statistics such as Moran’s I to quantify the overall spatial correlation, whereas local autocorrelation utilizes metrics like the local Moran’s I and Getis-Ord Gi/Gi* to elucidate local spatial heterogeneity [27].
In this study, Moran’s I is employed in conjunction with a time factor to construct a spatiotemporal weight matrix, thereby enabling the innovative calculation of global and local spatial–temporal Moran’s I. This approach is applied in the analysis of urban architectural morphology, enabling a profound exploration of the spatiotemporal correlation patterns of building forms. It provides an accurate delineation of spatial agglomeration and dispersion characteristics across different scales, offering a unique perspective and valuable reference for studies on temporally sensitive architectural morphology.

3.2.1. Global Moran’s I

Global Moran’s I statistic provides a precise assessment of the similarity of attributes between adjacent study units, thereby revealing their spatial correlation [58]. Furthermore, it effectively identifies the overall spatial distribution patterns of these attributes. The mathematical expression is concise and intuitive, as demonstrated by Equations (1) and (2):
I = n i = 1 n   j = 1 n   W i j i = 1 n   j = 1 n   W i j ( a i a ¯ ) ( a j a ¯ ) i = 1 n   ( a i a ¯ ) 2
a ¯ = 1 n i = 1 n   a i
In the aforementioned equation, n represents the total number of study units, a i denotes the observed value of the research element within the i-th study unit, a ¯ is the mean observation value of the research element, and W i j represents the spatial weight matrix indicating adjacency relationships between study units.
Global Moran’s I statistic ranges from −1 to 1, with negative values indicating dispersion and positive values indicating clustering. In the context of research, it is essential to select an appropriate spatial weight matrix that takes into account both adjacency and distance-based types [59]. The adjacency matrix is based on the assumption of binary adjacency, whereby spatial interaction is presumed to occur exclusively between adjacent sub-regions. The aforementioned adjacency relationships can be exemplified by the Bishop (point contact), Rook (edge contact), and Queen (edge and point contact) patterns, as illustrated in Figure 3, which provide a precise spatial relationship framework for analysis.
Distance-based matrices are instrumental in characterizing the distance relationships between sub-regions, and are therefore of paramount importance in the context of spatial autocorrelation analysis. The most common types are inverse distance weight matrices and binary geographical distance weight matrices. The spatial weight matrix, represented by the symbol W i j , can be expressed by the following Formula (3):
Distance W i j = 1 , d { i j } < d 0 , d { i j } d
In this context, d i j represents the distance between sub-regions i and j .

3.2.2. Local Moran’s I

Local Moran’s I provides a more detailed examination of the local relationships and heterogeneity of spatial attribute values, presenting the distribution characteristics of elements at a local scale in a visual format. The results are presented in the form of scatter plots, with specific clustering types listed in Table 2. This comprehensive approach reveals the intricate relationships between spatial units [60]. This analysis not only enhances understanding of spatial relationships but also captures local autocorrelation phenomena that may be missed by Global Moran’s I. The principles are detailed in Formulas (4)–(6).
I i = Z i S 2 j 1 n   w i j Z j
Z j = y j y ¯
s 2 = 1 n ( y i y ¯ ) 2
In the aforementioned equation, the variable I i represents the local Moran’s I for the i-th region, n denotes the total number of study areas, and W i is the spatial weight for region i . The spatial weight, represented by W i j , is the measure of the relationship between regions i and j . The attribute values for regions i and j , represented by y i and y j , respectively, are the observed values. The mean attribute value, represented by y ¯ , is the overall value.

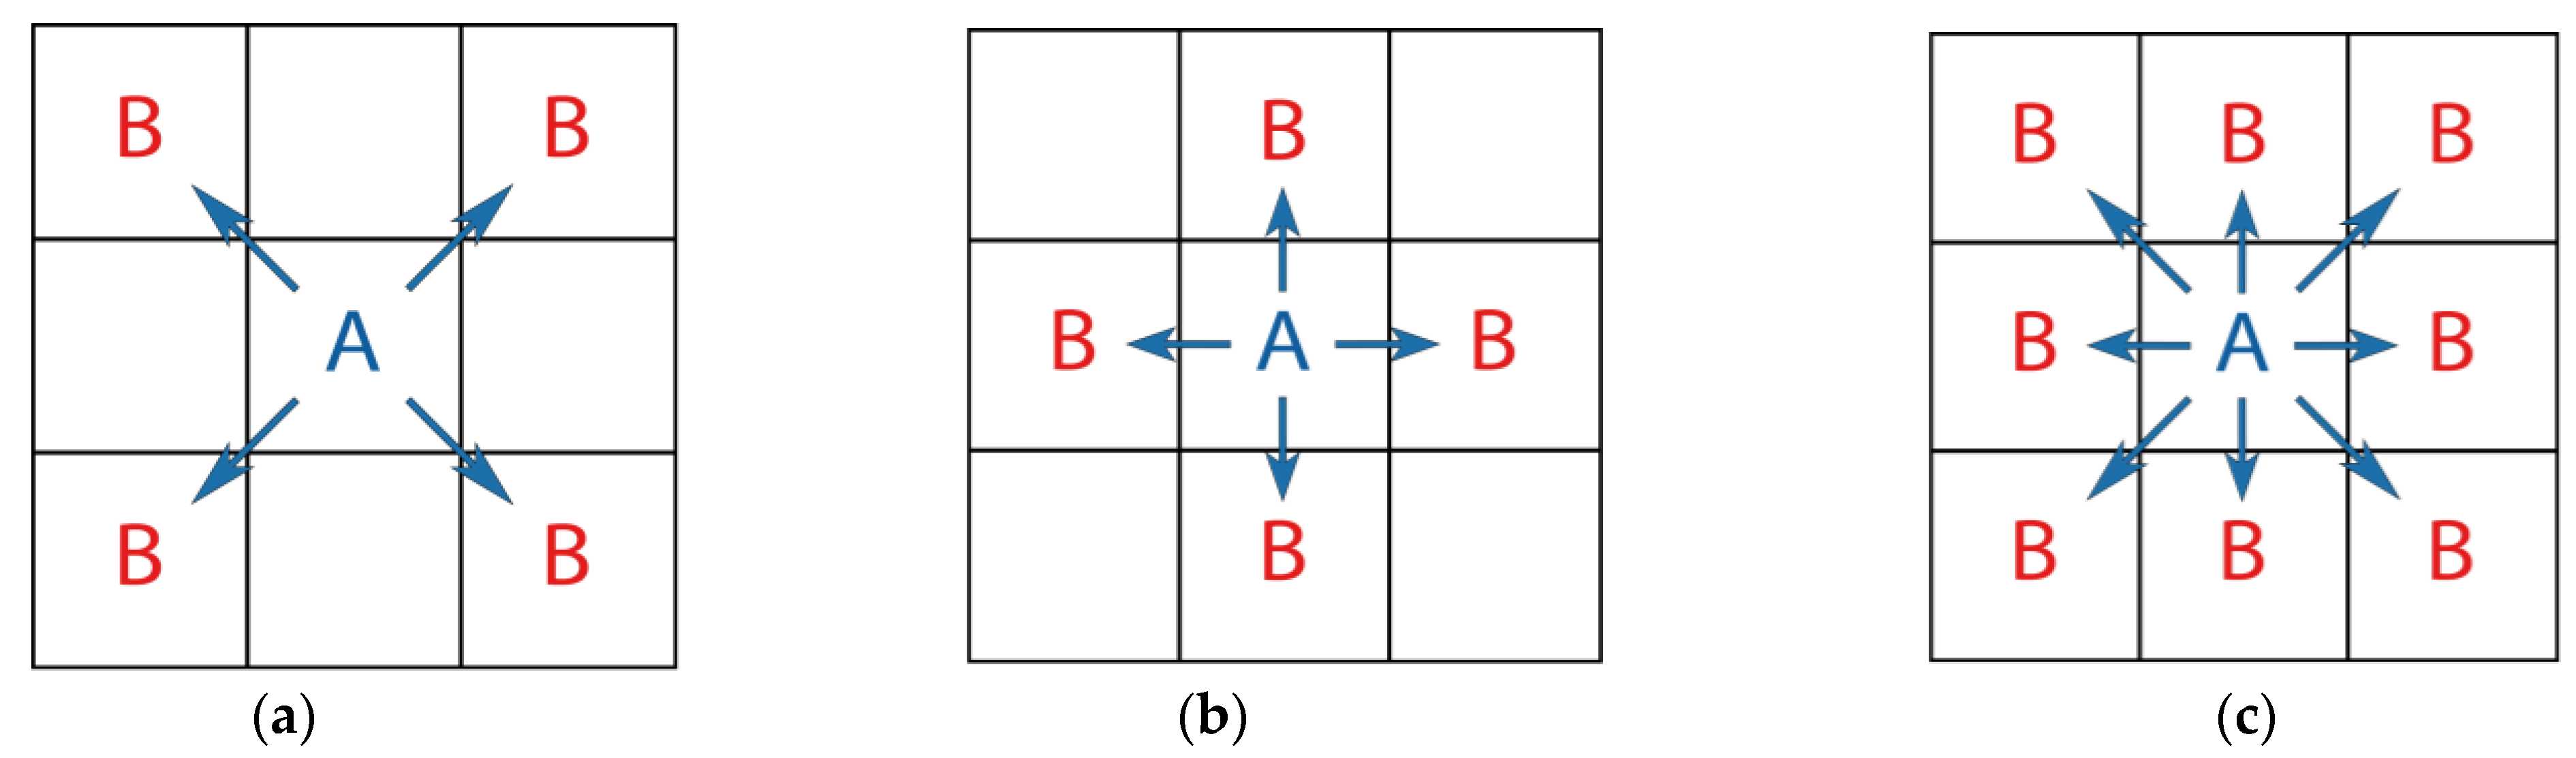
3.3. Spatiotemporal Weighting Matrix

The construction of a spatiotemporal weight matrix requires the integration of spatial and temporal dimensions in order to accurately depict the evolution of geographical phenomena over time and space. The matrix is of size n × n , where n is the number of spatial units, and the elements reflect the spatiotemporal proximity between units.
In this study, Inverse Distance Weighting is employed to quantify spatial weights, whereas temporal weights are derived from the disparities in time series. Adjacent time points are assigned a weight of 1, while non-adjacent points are assigned a weight of 0, thereby ensuring temporal continuity. To illustrate, temporal weights are set to 1 for consecutive years and 0 for non-consecutive years when data from 2014, 2019, and 2023 are employed. By integrating oblique model data from the study area, the spatial weights of urban buildings are precisely defined using the IDW method. This configuration considers both spatial distance and temporal continuity, thereby accurately capturing the dynamic changes and evolution patterns of urban architectural morphology over time and space.
The generation of the spatiotemporal weight matrix, designated as W , necessitates the consideration of the interrelationships between spatial locations and time series. The input data is a two-dimensional array, with rows representing spatial locations and columns representing time points. Consequently, the dimensions of the W matrix are n × t × n × t , where n is the number of spatial locations and t is the length of the time series. The following section provides a brief overview of the four-layer loop employed for the construction of the W matrix (Figure 4).
  • The outer loop iterates through all spatial locations, designated as i ;
  • The inner loop one traverses all time points, designated as j ;
  • The outer loop is then executed again, traversing all spatial locations, designated as k and comparing the location designated as i ;
  • The innermost loop traverses all time points, designated as l and compares the time point designated as j ;
For each combination of spatial locations ( i , k ) and time points ( j , l ) the value of W is calculated based on the spatial distance and time difference. This process comprehensively covers all possible spatiotemporal combinations, thus ensuring that the resulting matrix W , reflects both the spatial adjacency and temporal sequence relationships.

3.4. Spatial–Temporal Moran’s I

This study broadens the application of Global Moran’s I to encompass the spatiotemporal dimension. This is achieved by defining the spatiotemporal object, denoted as S T ( a , i ) , which incorporates information pertaining to both the spatial location a and the time point i . The construction of the spatiotemporal weight matrix is based on the principle that two spatiotemporal objects are considered to be spatiotemporally adjacent if they are both spatially and temporally adjacent. In such cases, the corresponding weight matrix element, designated as W ( a , i ) ( b , j ) , is set to a value of 1; otherwise, it is set to 0.
Global spatial–temporal Moran’s I is calculated using this weight matrix, with its positive or negative values directly reflecting the overall spatiotemporal evolution characteristics of the three-dimensional morphology of buildings within the study area. The calculation formula for this index is provided in Equation (7), which allows for a comprehensive analysis and quantification of the impact of spatiotemporal adjacency relationships on the dynamic changes in building morphology.
l = n t i = 1 n   a = 1 t   j = 1 n     b = 1 t   W ( a , i ) ( b , j ) ( y ( a , i ) y ¯ ) ( y ( q , j ) y ¯ ) i = 1 n   a = 1 t   j = 1 n   b = 1 t   W ( a , i ) ( b , j ) i = 1 n   a = 1 t   ( y ( a , i ) y ¯ ) 2
Local spatial–temporal Moran’s I is an extension of the global version that is capable of taking values beyond the range of [ 1 ,   1 ] , thereby allowing for a more flexible reflection of spatiotemporal correlations. In the local analysis of the spatiotemporal object, denoted by S T ( a , i ) , the results of this study indicate that positive values signify a positive correlation between the object and its surrounding area, with the strength of this correlation increasing as the value rises. Conversely, negative values indicate a negative correlation, with the negative correlation strength intensifying as the absolute value increases. A value of 0, on the other hand, denotes the absence of a spatiotemporal correlation. This calculation takes into account both local spatial and temporal relationships in a comprehensive manner. The specific formulas are provided in Equations (8)–(10), which offer a robust tool for in-depth analysis of the spatiotemporal evolution of three-dimensional building morphology.
I ( a , i ) = Z ( a , i ) W Z ( a , i )
W z ( a , i ) = a = 0 n   Σ j = 0 t w ( a , i ) ( b , j ) Z ( b , j ) a = 0 n   j = 0 t   w ( a , i ) ( b , j )
Z ( a , i ) = ( y ( a , i ) y ¯ ) s 2

4. Results

4.1. Analysis of Multiscale Spatial–Temporal Variations in Urban Buildings Three-Dimensional Morphology

In examining the evolution of urban buildings spatial morphology, Coverage serves as a principal indicator for assessing building density and spatial utilization. Its trajectory reveals significant implications at different spatial scales. As illustrated in Figure 5, the global spatial–temporal Moran’s I for Coverage demonstrates a notable upward trajectory from 2014 to 2023, discernible at various spatial scales.
At the community scale, the Coverage index demonstrated a gradual increase from 0.248 to 0.393 (Table 3), indicating a tendency towards greater building density within communities and a shift towards more intensive spatial utilization patterns. As the smallest units of urban space, optimized and compact building layouts within communities provide a solid foundation for enhancing residents’ quality of life and the efficient use of urban space.
At the neighborhood scale, the Coverage index also demonstrated an upward trajectory (Table 4), increasing from 0.317 to 0.426. This shift towards balanced and dense building coverage within neighborhoods indicates a trend towards overall functionality and spatial optimization.
From a macro perspective, the significant increase in the Coverage index (Table 5), from 0.085 to 0.223, directly reflects the accelerated urbanization process at the urban scale. The aggregation and distribution of urban buildings over a larger area not only shape the unique spatial patterns and landscapes of the city but also enhance the optimized allocation and efficient utilization of urban spatial resources, thereby providing a strong impetus for sustainable urban development.
As a pivotal indicator for gauging disparities in building height and assessing the coherence of spatial layouts, an in-depth examination of Staggeredness is imperative. Figure 5 presents a variation curve of Staggeredness, which illustrates the evolution of building height differences and spatial layout harmony.
At the community scale, Global Moran’s I for Staggeredness exhibited a slight increase from 0.389 to 0.407 (Table 3), reflecting a gradual reduction in building height differences and the harmonious unification of spatial layouts within communities. This transformation serves to enhance the overall aesthetic appeal and visual attractiveness of the community.
At the neighborhood scale, the alterations in Staggeredness manifest in a more intricate manner (Table 4). A slight increase in the Staggeredness index results in a more balanced and coordinated height distribution of buildings within neighborhoods, thereby enhancing the spatial hierarchy and visual impact of the neighborhood.
From a macro perspective at the urban scale (Table 5), the rapid growth of the Staggeredness index demonstrates the richness and diversity in the city’s skyline height levels. The staggered arrangement of high-rise and low-rise buildings not only creates a distinctive urban skyline but also reflects the meticulous planning and design of urban spaces in terms of height levels, thereby demonstrating the efficacy of such an approach.
As illustrated in Figure 5, alterations in Duty Cycle also manifest notable discrepancies across a range of spatial scales. As a principal indicator for the assessment of building footprint and spatial utilization efficiency, the variations in this index are of critical importance for the evaluation of the optimized allocation of urban spatial resources and sustainable development.
At the community scale, the considerable increase in the Duty Cycle index (Table 3), from 0.359 to 0.479, directly reflects the enhancement in land use efficiency and the optimization of building layouts within communities. This optimization provides residents with a more spacious and comfortable living environment.
At the neighborhood scale, the alterations in the Duty Cycle index (Table 4) provide further evidence of the effective integration and utilization of spatial resources. As the Duty Cycle index increases, the spatial aggregation of building footprints within neighborhoods is enhanced, thereby promoting the coordinated development of neighborhood functions.
From a macro perspective at the urban scale (Table 5), the increase in the Duty Cycle index demonstrates the optimized layout and efficient use of building footprints over a larger spatial extent. The implementation of scientific spatial planning and rational architectural design strategies has enabled the precise matching and efficient integration of building footprints with spatial resources, thereby establishing a robust foundation for the sustainable development of the city.

4.2. Spatial–Temporal Analysis of Urban Buildings 3D Morphological Features at the Neighborhood Scale

In light of the preceding discussion concerning the findings of global spatial–temporal Moran’s I analysis, this study concentrates on the neighborhood scale with the objective of elucidating the spatiotemporal transformations in urban edifices within the Yau Tsim Mong District in greater detail. The neighborhood scale, with its relatively independent and complete spatial structure, is more effective in capturing phenomena of agglomeration, dispersion, and heterogeneity, thereby providing a precise perspective for urban planning and management. Figure 6 provides a clear illustration of the dynamic changes in the number and percentage of scatter points for the Coverage, Duty Cycle, and Staggeredness indices at the community, neighborhood, and urban scales from 2014 to 2023 in terms of local Spatial–temporal Moran’s I. In this chart, the height of the bar graph represents the number of local Spatial–temporal Moran’s I scatter points, with specific values referenced by the primary vertical axis (left). The line graph indicates the proportion of local Spatial–temporal Moran’s I scatter points, with specific values referenced by the secondary axis (right). The horizontal charts represent different urban morphology indicators and the vertical charts describe the quadrants where local Spatial–temporal Moran’s I scatter points are located.
With regard to the Coverage index, the continuous increase in the number of scatter points in the first quadrant (H-H) from 111 to 131 clearly indicates a significant agglomeration of high-Coverage units at the neighborhood scale. This agglomeration not only reflects efficient land use but also indicates a trend towards concentrated urban development. The reduction in the number of scatter points in the second quadrant (L-H) from 48 to 31 indicates a gradual decline in the prevalence of low-Coverage units situated adjacent to high-Coverage units. This may be attributed to the implementation of urban planning and renewal policies. Although the number of scatter points in the third quadrant (L-L) has increased from 80 to 88, the percentage rise indicates that while the number of low-Coverage units has grown, their relative importance within the entire study area has not significantly increased. The increase in the number of scatter points in the fourth quadrant (H-L) from 27 to 34 illustrates alterations in the spatial relationship between High- and low-Coverage units, offering vital insights to urban planners into regional development disparities.
A detailed examination of the Staggeredness-related charts (Figure 6) reveals the presence of distinct trends across the four quadrants. The scatter plot in the first quadrant (H-H) demonstrates an initial increase from 79 in 2014 to 92 in 2019, followed by a decline to 87 by 2023. This pattern indicates that units with comparable height disparities tend to form relatively stable clusters at the neighborhood scale. However, over time, some areas may undergo readjustments or redevelopment, which could result in a slight decrease in clustering intensity.
Concurrently, the second quadrant (L-H) demonstrates an increase from 33 to 45 points, indicating an augmented spatial heterogeneity between low- and high-Staggeredness units. This reflects the diversity and complexity of urban spatial morphology. Conversely, the third quadrant (L-L) demonstrates a decline from 115 to 110 points, indicating a spatial dispersion trend among low-Staggeredness units. The fourth quadrant (H-L) demonstrates an increase from 34 to 41 points, indicating a heightened encirclement of high-Staggeredness units by low-Staggeredness ones.
It is also important to consider Duty Cycle, which is a crucial indicator of building spatial efficiency. The notable rise in scatter points in the initial quadrant (H-H), from 92 to 136, underscores the pronounced clustering of high-Duty Cycle units at the neighborhood scale. This directly indicates urban spatial compactness and efficiency. The second quadrant (L-H) exhibits minor fluctuations from 56 to 52 points, indicating an increase in the percentage of low-Duty Cycle units in proximity to high-Duty Cycle units. This may be attributed to historical urban layout issues or specific planning requirements. The reduction in scatter points in the third quadrant (L-L) from 103 to 93 and the relative stability in the fourth quadrant (H-L) from 28 to 27 provide further insight into the characteristics of Duty Cycle spatial distribution.
In conclusion, local Spatial–temporal Moran’s I analysis of building characteristics at the neighborhood scale demonstrates the complexity and dynamism of Staggeredness, Coverage, and Duty Cycle in spatial distribution. The occurrence of phenomena such as high-value clustering and low-value dispersion, enhanced heterogeneity, and changes in spatial relationships collectively illustrate the existence of a diverse urban spatial structure. These findings not only provide valuable data support for urban planners but also offer essential references for optimizing urban development strategies and enhancing urban governance.

5. Discussion

The close connection between urban morphology and sustainable urban development has become a topic of considerable interest and debate in academic circles. The potential of in-depth research into urban morphology to inform the construction of sustainable urban pathways is both profound and complex [8,61,62,63]. This study builds upon existing research to identify four key urban morphology indicators, including Building Height Standard Deviation, Building Height, Building Volume Density, and Building Floor Area Ratio. It is noteworthy that Staggeredness is defined as the ratio of Building Height Standard Deviation to building height. Similarly, Duty Cycle and Coverage represent Building Volume Density and Building Floor Area Ratio, respectively. These indicators provide a comprehensive assessment of the dynamic changes in urban buildings in both the horizontal and vertical spatial dimensions.
Prior research has amply demonstrated the efficacy of morphology indicators in analyzing a range of urban phenomena, including urban development expansion, urban heat island effects, and environmental impacts [47,54,55,56,57,62]. This study further applies these methods to the Yau Tsim Mong District, utilizing Moran’s I for quantitative analysis, thereby achieving a deep integration of morphological indicators with spatiotemporal dynamics. The findings demonstrate a notable increase in Coverage, Staggeredness, and Duty Cycle at the urban scale, with Duty Cycle exhibiting a particularly pronounced rise of approximately 178%. This serves to illustrate the extent of the spatial optimization achievements of the Yau Tsim Mong District in the context of urban planning and design. These findings are consistent with those of numerous domestic and international studies, which demonstrate the intimate connection between urban development and spatial utilization [41,46,47,48,49,50,51,52].
It is notable that this study identifies an upward trajectory in indicator values at three distinct geographical scales: community, neighborhood and urban. This reflects a growing phenomenon of building agglomeration and a tendency towards reduced differences in building heights in the Yau Tsim Mong District. This change can be attributed to a number of factors, including adjustments in urban development strategies, urban renewal initiatives, and population mobility. Additionally, it aligns with the global trend of high-rise building intensification in urbanization processes [1]. At the neighborhood scale, the high values of local Spatial–temporal Moran’s I indicating clustering and low values indicating dispersion serve to further underscore the complexity of the rapid spatial evolution of the three-dimensional urban structure over time.
By incorporating the temporal dimension and employing quantitative analysis of urban spatial morphology indicators based on Spatial–temporal Moran’s I, this study represents a methodological innovation, markedly enhancing the precision with which spatiotemporal characteristics of urban buildings dynamics can be captured. Notwithstanding the absence of significant differences in the evaluation results across different scales, they consistently indicate an increase in urban buildings density and convergence in average height, thereby providing new insights into the understanding of urban morphological evolution.
In conclusion, this study contributes to the theoretical framework of the relationship between urban morphology and sustainable development. By employing a refined scale division and spatiotemporal dynamic analysis, this study provides a scientific basis for urban planning and management. These findings are of crucial reference value for government decision-makers, urban planners, and architects, aiding them in more accurately grasping the nuances of urban development and promoting sustainable and harmonious urban growth in future urban planning and construction endeavors [5].

6. Conclusions

This study employs a comprehensive approach utilizing Global and local Spatial–temporal Moran’s I to conduct a quantitative analysis of urban morphology indicators (Coverage, Staggeredness and Duty Cycle) in the Yau Tsim Mong District of Hong Kong across the community, neighborhood and urban scales. The research is focused on the examination of spatial morphology and its evolving trends within this geographical area. The multilevel spatial–temporal analysis yielded the following principal conclusions:
  • Between 2014 and 2023, there were notable enhancements in Coverage, Staggeredness, and Duty Cycle in global spatial–temporal Moran’s I, suggesting robust spatial correlations between the examined urban morphology indicators and the overall urban development in Yau Tsim Mong District. This trend reflects a notable optimization of urban buildings forms and spatial utilization throughout the district’s urbanization process.
  • A comparison of trends across different scales reveals a shift in urban development strategies. A notable trend is the aggregation of buildings and the gradual reduction in height differences, which suggests that urban planning is increasingly focused on overall spatial efficiency and refined architectural design with clear regional functional divisions.
  • The application of global spatial–temporal Moran’s I reveals that, in comparison to city-wide and community-level scales, the neighborhood scale exhibits a relatively autonomous and comprehensive spatial configuration. This scale is an effective means of capturing clustering, dispersion, or heterogeneity phenomena in local areas. It is therefore reasonable and necessary to conduct a local spatial–temporal analysis at the neighborhood scale, as this provides detailed information on the internal spatial structure of the city and enhances our comprehensive understanding of urban morphological changes.
  • At the neighborhood scale, the local Spatial–temporal Moran’s I for Coverage, Staggeredness, and Duty Cycle demonstrates a notable clustering of high values and a dispersion of low values. This finding provides further evidence of the trend of building expansion at the neighborhood level in Yau Tsim Mong, whereby buildings are gradually clustering horizontally and converging vertically in height. This phenomenon reflects the district’s commitment to rational spatial planning within compact urban environments, thereby demonstrating the efficacy and precision of urban planning.
This study employs a multiscale analytical approach to examine the overall development trends in Yau Tsim Mong District. In addition, it investigates the neighborhood level, providing comprehensive and accurate discussions on the three-dimensional morphology of urban buildings. This multiscale analytical approach facilitates a more comprehensive understanding of the spatiotemporal evolution of urban buildings characteristics, providing a more nuanced perspective and a richer foundation for urban planning and management. The research emphasizes the necessity of incorporating spatial heterogeneity and diversity into urban planning in order to achieve scientifically sound planning layouts.
In conclusion, this study, which employs a multiscale approach and combines global and local spatial–temporal indices analysis, offers valuable insights and theoretical support for understanding the spatiotemporal evolution of urban buildings characteristics in Yau Tsim Mong District, Hong Kong. The findings contribute to the existing body of knowledge on urban morphology, and provide valuable insights that can inform future urban planning, land use, and sustainable urban development.

Author Contributions

Conceptualization, T.S. and L.H.; methodology, W.Z.; software, S.Y.; validation, T.S., W.Z. and S.Y.; formal analysis, T.S.; investigation, W.Z.; resources, S.Y.; data curation, W.Z.; writing—original draft preparation, T.S.; writing—review and editing, T.S.; visualization, W.Z.; supervision, T.S.; project administration, T.S.; funding acquisition, L.H. All authors have read and agreed to the published version of the manuscript.

Funding

This work was supported by the Key R&D Program of Shanxi Province (Project No. 202202010101005).

Institutional Review Board Statement

Not applicable.

Informed Consent Statement

Not applicable.

Data Availability Statement

The raw data supporting the conclusions of this article will be made available by the authors on request.

Conflicts of Interest

The authors declare no conflict of interest.

References

  1. Domingo, D.; van Vliet, J.; Hersperger, A.M. Long-term changes in 3D urban form in four Spanish cities. Landsc. Urban Plan. 2023, 230, 104624. [Google Scholar] [CrossRef]
  2. Wu, W.; Chen, M.; Wang, N.; Chen, D. Research Progress on the Spatial-Temporal Heterogeneity of Urban Land Expansion in China. Geogr. Geo-Inf. Sci. 2017, 33, 57–63. [Google Scholar] [CrossRef]
  3. Long, Y.; Li, P.; Hou, J. Analysis of urban form types based on three-dimensional block morphology: A case study of major cities in China. Shanghai Urban Plan. Rev. 2019, 3, 10–15. [Google Scholar]
  4. Liu, Y.; Meng, Q.; Zhang, J.; Zhang, L.; Allam, M.; Hu, X.; Zhan, C. Evaluation of Urban Spatial Structure from the Perspective of Socioeconomic Benefits Based on 3D Urban Landscape Measurements: A Case Study of Beijing, China. Remote Sens. 2022, 14, 5511. [Google Scholar] [CrossRef]
  5. Liang, F.; Liu, J.; Liu, M.; Zeng, J.; Yang, L.; He, J. Scale-Dependent Impacts of Urban Morphology on Commercial Distribution: A Case Study of Xi’an, China. Land 2021, 10, 170. [Google Scholar] [CrossRef]
  6. Wang, Y.; Pan, W.; Liao, Z. Impact of Urban Morphology on High-Density Commercial Block Energy Consumption in Severe Cold Regions. Sustainability 2024, 16, 5795. [Google Scholar] [CrossRef]
  7. Liu, B.; Guo, X.; Jiang, J. How Urban Morphology Relates to the Urban Heat Island Effect: A Multi-Indicator Study. Sustainability 2023, 15, 10787. [Google Scholar] [CrossRef]
  8. Mobaraki, A.; Oktay Vehbi, B. A Conceptual Model for Assessing the Relationship between Urban Morphology and Sustainable Urban Form. Sustainability 2022, 14, 2884. [Google Scholar] [CrossRef]
  9. Zhu, S.; Ma, C.; Wu, Z.; Huang, Y.; Liu, X. Exploring the Impact of Urban Morphology on Building Energy Consumption and Outdoor Comfort: A Comparative Study in Hot-Humid Climates. Buildings 2024, 14, 1381. [Google Scholar] [CrossRef]
  10. Xie, Q.; Chang, Z. Spatial structure and driving factors of public cultural facilities in Jiangsu Province: From quantitative statistics to efficiency evaluation. J. Nanjing Normal Univ. 2023, 46, 50–59. [Google Scholar]
  11. Xiong, L.; Tang, G.; Yang, X.; Li, F. Geomorphology-oriented digital terrain analysis: Progress and perspectives. Acta Geogr. Sin. 2021, 76, 595–611. [Google Scholar] [CrossRef]
  12. Duan, Y. Research on the Multi-Scale Expression Method of Feature-Driven Urban 3D Models. Master’s Thesis, Beijing University of Civil Engineering and Architecture, Beijing, China, 2022. [Google Scholar]
  13. Liu, W. Study on the Spatiotemporal Evolution of Floor Area Ratio of Urban Residential Communities. Master’s Thesis, Liaoning Normal University, Dalian, China, 2021. [Google Scholar]
  14. Hou, F. Study on the Spatiotemporal Differentiation and Limit Evaluation of Land Development Intensity in Xi’an Based on GIS. Master’s Thesis, Chang’an University, Xi’an, China, 2019. [Google Scholar]
  15. Yang, Y.; Yu, C.; Fu, A.; Sun, Z.; Zhou, K. Investigation of the relationship between urban three-dimensional landscape patterns and the spatial-temporal distribution of atmospheric pollution: A case study of Changsha. J. Hunan Normal Univ. 2024, 47, 12–21. [Google Scholar] [CrossRef]
  16. Ranjbar, H.R.; Gharagozlou, A.R.; Nejad, A. 3D Analysis and Investigation of Traffic Noise Impact from Hemmat Highway Located in Tehran on Buildings and Surrounding Areas. J. Geogr. Inf. Syst. 2012, 4, 322–334. [Google Scholar] [CrossRef]
  17. Zhu, R.; Wong, M.S.; You, L.; Santi, P.; Nichol, J.; Ho, H.C.; Lu, L.; Ratti, C. The effect of urban morphology on the solar capacity of three-dimensional cities. Renew. Energy 2020, 153, 1111–1126. [Google Scholar] [CrossRef]
  18. He, W. Study on the Three-Dimensional Openness Based on the Urban Digital Elevation Model. Master’s Thesis, Nanjing Normal University, Nanjing, China, 2013. [Google Scholar]
  19. Lu, X. Study on the Spatial form and Thermal Environment of the Central Urban Area of Jinan based on UDEM. Master’s Thesis, Shandong Jianzhu University, Jinan, China, 2020. [Google Scholar]
  20. Qu, X. Study on the 3D Visual Analysis Method of Urban Space based on UDEM. Master’s Thesis, Liaoning Normal University, Dalian, China, 2018. [Google Scholar]
  21. Guo, C. Study on the Spatiotemporal Dynamic Simulation of Urban Spatial Growth based on XGBoost-CA. Master’s Thesis, Liaoning Normal University, Dalian, China, 2023. [Google Scholar]
  22. Silva, I.; Santos, R.; Lopes, A.; Araújo, V. Morphological Indices as Urban Planning Tools in Northeastern Brazil. Sustainability 2018, 10, 4358. [Google Scholar] [CrossRef]
  23. Gao, J.; Liu, C.; He, Q.; Chen, M.; Gan, L. Application and Exploration of 3D Real Scene Technology in Ecological Environment. Urban Surv. Mapp. 2024, 1, 16–19. [Google Scholar] [CrossRef]
  24. Li, P.; Sun, Y. Research and application of real-scene 3D and multi-source data fusion technology. Bull. Surv. Mapp. 2019, S1, 133–136. [Google Scholar]
  25. Li, L.; Liu, X.; Ou, J.; Niu, N. Analysis of the spatiotemporal changes and mechanisms of three-dimensional characteristics of urban expansion based on the random forest model. Geogr. Geo-Inf. Sci. 2019, 35, 53–60. [Google Scholar]
  26. Cheng, Q. Study on the Scale Effect of the Relationship between Urban Sky View Factor and Surface Temperature. Master’s Thesis, Beijing University of Civil Engineering and Architecture, Beijing, China, 2023. [Google Scholar]
  27. Jin, A.; Ge, Y.; Zhang, S. Spatial Characteristics of Multidimensional Urban Vitality and Its Impact Mechanisms by the Built Environment. Land 2024, 13, 991. [Google Scholar] [CrossRef]
  28. Lin, C.; Li, G.; Zhou, Z.; Li, J.; Wang, H.; Liu, Y. Enhancing Urban Land Use Identification Using Urban Morphology. Land 2024, 13, 761. [Google Scholar] [CrossRef]
  29. Li, J.; Wang, H.; Cai, X.; Liu, S.; Lai, W.; Chang, Y.; Qi, J.; Zhu, G.; Zhang, C.; Liu, Y. Quantifying Urban Spatial Morphology Indicators on the Green Areas Cooling Effect: The Case of Changsha, China, a Subtropical City. Land 2024, 13, 757. [Google Scholar] [CrossRef]
  30. Ibrahim, S.; Younes, A.; Abdel-Razek, S.A. Impact of Neighborhood Urban Morphologies on Walkability Using Spatial Multi-Criteria Analysis. Urban Sci. 2024, 8, 70. [Google Scholar] [CrossRef]
  31. Wang, H.; Shan, Y.; Xia, S.; Cao, J. Traditional Village Morphological Characteristics and Driving Mechanism from a Rural Sustainability Perspective: Evidence from Jiangsu Province. Buildings 2024, 14, 1302. [Google Scholar] [CrossRef]
  32. Du, S.; Wu, Y.; Guo, L.; Fan, D.; Sun, W. How Does the 2D/3D Urban Morphology Affect the Urban Heat Island across Urban Functional Zones? A Case Study of Beijing, China. ISPRS Int. J. Geo-Inf. 2024, 13, 120. [Google Scholar] [CrossRef]
  33. Zou, C.; Tang, X.; Tan, Q.; Feng, H.; Guo, H.; Mei, J. Constructing Ecological Networks for Mountainous Urban Areas Based on Morphological Spatial Pattern Analysis and Minimum Cumulative Resistance Models: A Case Study of Yongtai County. Sustainability 2024, 16, 5559. [Google Scholar] [CrossRef]
  34. Shi, T.; Zhao, L.; Liu, F.; Zhang, M.; Li, M.; Peng, C.; Li, H. Conditional Diffusion Model for Urban Morphology Prediction. Remote Sens. 2024, 16, 1799. [Google Scholar] [CrossRef]
  35. Li, F.; Zhou, T.; Dong, Y.; Zhou, W. Design of the 3D Digital Reconstruction System of an Urban Landscape Spatial Pattern Based on the Internet of Things. Int. J. Inf. Technol. Syst. Approach 2023, 16, 1–14. [Google Scholar] [CrossRef]
  36. Cheng, G.; Li, Z.; Xia, S.; Gao, M.; Ye, M.; Shi, T. Research on the Spatial Sequence of Building Facades in Huizhou Regional Traditional Villages. Buildings 2023, 13, 174. [Google Scholar] [CrossRef]
  37. Zhou, R.; Xu, H.; Zhang, H.; Zhang, J.; Liu, M.; He, T.; Gao, J.; Li, C. Quantifying the Relationship between 2D/3D Building Patterns and Land Surface Temperature: Study on the Metropolitan Shanghai. Remote Sens. 2022, 14, 4098. [Google Scholar] [CrossRef]
  38. Yu, Z.; Chen, L.; Li, L.; Zhang, T.; Yuan, L.; Liu, R.; Wang, Z.; Zang, J.; Shi, S. Spatiotemporal Characterization of the Urban Expansion Patterns in the Yangtze River Delta Region. Remote Sens. 2021, 13, 4484. [Google Scholar] [CrossRef]
  39. Gapeyenko, M.; Moltchanov, D.; Andreev, S.; Heath, R.W. Line-of-Sight Probability for mmWave-Based UAV Communications in 3D Urban Grid Deployments. IEEE Trans. Wirel. Commun. 2021, 20, 6566–6579. [Google Scholar] [CrossRef]
  40. Tang, L.; Ying, S.; Li, L.; Biljecki, F.; Zhu, H.; Zhu, Y.; Yang, F.; Su, F. An Application-Driven LOD Modeling Paradigm for 3D Building Models. ISPRS J. Photogramm. Remote Sens. 2020, 161, 194–207. [Google Scholar] [CrossRef]
  41. Zaki, S.A.; Othman, N.E.; Syahidah, S.W.; Yakub, F.; Muhammad-Sukki, F.; Ardila-Rey, J.A.; Shahidan, M.F.; Mohd Saudi, A.S. Effects of Urban Morphology on Microclimate Parameters in an Urban University Campus. Sustainability 2020, 12, 2962. [Google Scholar] [CrossRef]
  42. Li, S.; Wu, C.; Lin, Y.; Li, Z.; Du, Q. Urban Morphology Promotes Urban Vibrancy from the Spatiotemporal and Synergetic Perspectives: A Case Study Using Multisource Data in Shenzhen, China. Sustainability 2020, 12, 4829. [Google Scholar] [CrossRef]
  43. Xu, Y.; Liu, M.; Hu, Y.; Li, C.; Xiong, Z. Analysis of Three-Dimensional Space Expansion Characteristics in Old Industrial Area Renewal Using GIS and Barista: A Case Study of Tiexi District, Shenyang, China. Sustainability 2019, 11, 1860. [Google Scholar] [CrossRef]
  44. Shukla, A.; Jain, K. Critical Analysis of Spatial-Temporal Morphological Characteristic of Urban Landscape. Arab. J. Geosci. 2019, 12, 112. [Google Scholar] [CrossRef]
  45. Yang, T. A Study on Spatial Structure and Functional Location Choice of the Beijing City in the Light of Big Data. In Proceedings of the 10th Space Syntax Symposium, London, UK, 13–17 July 2015. [Google Scholar]
  46. Qiao, W.; Wang, Y.; Ji, Q.; Hu, Y.; Ge, D.; Cao, M. Analysis of the Evolution of Urban Three-Dimensional Morphology: The Case of Nanjing City, China. J. Maps 2019, 15, 30–38. [Google Scholar] [CrossRef]
  47. Lai, P.-C.; Chen, S.; Low, C.-T.; Cerin, E.; Stimson, R.; Wong, P.Y.P. Neighborhood Variation of Sustainable Urban Morphological Characteristics. Int. J. Environ. Res. Public Health 2018, 15, 465. [Google Scholar] [CrossRef] [PubMed]
  48. Zhang, Q.; Huang, X.; Zhang, G. Urban Area Extraction by Regional and Line Segment Feature Fusion and Urban Morphology Analysis. Remote Sens. 2017, 9, 663. [Google Scholar] [CrossRef]
  49. Wang, T. Urban Spatial Analysis and Visualization System Construction from the Perspective of Public Transportation. Master’s Thesis, Beijing Jiaotong University, Beijing, China, 2023. [Google Scholar]
  50. Liu, Y. Study on the Evaluation of Socioeconomic Benefits of Urban Spatial Structure Based on 2D and 3D Landscape Quantitative Analysis. Master’s Thesis, Liaoning Technical University, Fuxin, China, 2023. [Google Scholar]
  51. Yu, X.; Xu, G.; Liu, Y.; Xiao, R. The impact of three-dimensional urban building morphology on the surface thermal environment in the Yangtze River Delta region. Chin. Environ. Sci. 2021, 41, 5806–5816. [Google Scholar]
  52. Li, B.; Peng, M.; Tan, R. Analysis of the Evolution Characteristics and Driving Factors of Urban 3D Spatial Morphology: A Case Study of the Main Urban Area of Wuhan. J. Wuhan Univ. (Inf. Sci. Ed.) 2023, 48, 1–13. [Google Scholar] [CrossRef]
  53. Qu, Y.; Chi, Y.; Gao, J.; Zhang, Z.; Liu, Z.; Wang, Y.-P. Measuring the Multi-Scale Landscape Pattern of China’s Largest Archipelago from a Dual-3D Perspective Based on Remote Sensing. Remote Sens. 2023, 15, 5627. [Google Scholar] [CrossRef]
  54. He, Q. Analysis of the Spatial Impact of Urban Vitality on Carbon Emissions Integrating Multi-Source Data. Ph.D. Thesis, China University of Mining and Technology, Beijing, China, 2024. [Google Scholar]
  55. Zhang, L.; Qing, A.; Kakar, S.; Cui, M. 3D Accessibility Evaluation of Public Space in Three-dimensional Urban Design: A Case Study of Taikoo Place, Hong Kong. New Archit. 2021, 4, 48–54. [Google Scholar] [CrossRef]
  56. Long, L. Research on Spatial Autocorrelation Analysis Methods and Applications. Ph.D. Thesis, Kunming University of Science and Technology, Yunnan, China, 2016. [Google Scholar]
  57. Zhang, X.; Lin, P.; Chen, H.; Yan, R.; Zhang, J.; Yu, Y.; Liu, E.; Yang, Y.; Zhao, W.; Lv, D.; et al. Understanding land use and cover change impacts on run-off and sediment load at flood events on the Loess Plateau, China. Hydrol. Process. 2018, 32, 576–589. [Google Scholar] [CrossRef]
  58. Zhang, L. Research on the Geographically Weighted Regression Modeling Method Based on Flow Data. Ph.D. Thesis, Wuhan University, Wuhan, China, 2021. [Google Scholar]
  59. Yue, X.; Mingxing, C. Population evolution at the prefecture-level city scale in China: Change patterns and spatial correlations. J. Geogr. Sci. 2022, 32, 1281–1296. [Google Scholar]
  60. Wang, X. Analysis of Accessibility and Layout Optimization of Urban Medical Institutions. Master’s Thesis, Nanjing University of Posts and Telecommunications, Nanjing, China, 2023. [Google Scholar]
  61. Hillier, B.; Hanson, J. The Social Logic of Space; Cambridge University Press: Cambridge, UK, 1984. [Google Scholar]
  62. Sheng, Q.; Liu, N. Comparing the Use of Actual Space and Virtual Space: A Case Study on Beijing’s Wangfujing Area. In Proceedings of the 10th Space Syntax Symposium, London, UK, 13–17 July 2015. [Google Scholar]
  63. Sheng, Q.; Jiao, J. Understanding the Impact of Street Patterns on Pedestrian Distribution: A Case Study in Tianjin. In Proceedings of the 12th Space Syntax Symposium, Beijing, China, 8–13 July 2019. [Google Scholar]
Figure 1. Study Area Yau Tsim Mong District, Hong Kong, China.
Sustainability 16 06540 g001
Figure 2. (a) The slope model display of Yau Tsim Mong District in Hong Kong; (b) the corresponding three-dimensional model data.
Sustainability 16 06540 g002
Figure 3. (a) Bishop adjacency; (b) Rook adjacency; (c) Queen adjacency.
Sustainability 16 06540 g003
Figure 4. Spatiotemporal weight matrix construction process.
Sustainability 16 06540 g004
Figure 5. Sequential trend graphs of the global spatial–temporal Moran’s I for Coverage (a), Staggeredness (b), and Duty Cycle (c).
Sustainability 16 06540 g005
Figure 6. The horizontal charts represent urban morphology indicators: (ad) for Coverage, (eh) for Staggeredness, and (il) for Duty Cycle. The vertical charts indicate the quadrants of the scatter points, such as (a,e,i) for the first quadrant.
Sustainability 16 06540 g006
Table 1. Urban morphology indicators.
NameMorphology IndicatorsDefinitionSignificance
StaggerednessBuilding Height Standard DeviationHeight of all buildings in the space unit standard deviationEvaluating the vertical development status of urban areas, a larger Staggeredness value indicates more significant height differences among urban buildings.
Building HeightThe average height of buildings in the area
Duty CycleBuilding Volume DensityThe ratio of building volume to the total volume within a space unitThis metric illustrates the volume disparity among building entities within an urban area; a larger value reflects a higher building density in the region.
CoverageBuilding Floor Area RatioThe ratio of gross floor area to building land area in a spatial unitThis metric measures the proportion of building footprint area relative to the area of each study unit within an urban region.
Table 2. Types of clustering and their meanings for the local Moran’s I.
Cluster TypeHidden Meaning
High–High ClusteringHigh-value regions are also surrounded by high-value regions, showing a positive spatial correlation
High–Low ClusteringHigh-value regions are surrounded by low-value regions, showing a negative spatial correlation
Low–Low ClusteringLow-value regions are also surrounded by low-value regions, showing a positive spatial correlation
Low–High ClusteringLow-value regions are surrounded by high-value regions, showing negative spatial correlation
Table 3. Global spatial–temporal Moran’s I for Coverage, Staggeredness, and Duty Cycle at the Community Scale in the years 2014, 2019, and 2023.
YearCoverageStaggerednessDuty Cycle
20140.2480.3890.359
20190.3240.3960.455
20230.3930.4070.479
Table 4. Global spatial–temporal Moran’s I for Coverage, Staggeredness, and Duty Cycle at the Neighborhood Scale in the years 2014, 2019, and 2023.
YearCoverageStaggeredness Duty Cycle
20140.3170.2440.219
20190.4080.2610.438
20230.4260.2690.446
Table 5. Global spatial–temporal Moran’s I for Coverage, Staggeredness, and Duty Cycle at the Urban Scale in the years 2014, 2019, and 2023.
YearCoverageStaggerednessDuty Cycle
20140.0850.0700.108
20190.1660.1370.256
20230.2230.1890.300
Disclaimer/Publisher’s Note: The statements, opinions and data contained in all publications are solely those of the individual author(s) and contributor(s) and not of MDPI and/or the editor(s). MDPI and/or the editor(s) disclaim responsibility for any injury to people or property resulting from any ideas, methods, instructions or products referred to in the content.

