Abstract
Data centers (DCs) require continuous cooling throughout the year and produce a large amount of low-grade waste heat. Free cooling and waste heat recovery techniques are promising approaches to reduce DC energy consumption. Although previous studies have explored diverse waste heat utilization strategies, there is a significant gap in combining waste heat recovery with lake water cooling in DCs. Therefore, this study proposed a system integrating lake water cooling with waste heat recovery for DCs. To evaluate the energy-saving performance of the suggested system, the influence of waste heat recovery locations and volumes has been investigated. An analysis of the improvement in system parameters is also conducted. The study’s findings highlight that targeted recovery of waste heat from sources like chilled water or air in server rooms can significantly reduce the cooling energy demand of the system. The results show that recovering heat from the return air of IT equipment can yield a remarkable power usage effectiveness (PUE) and coefficient of performance (COP) of 1.19 and 10.17, and the energy consumption of the cooling system is reduced to 10.06%. Moreover, the outcomes reveal the potential for substantial energy savings of up to 26.05% within the proposed system by setting the chilled water and air supply temperatures to 16 and 20 °C, respectively.
1. Introduction
DCs house the information technology equipment that supports the digitalization of society, and the industry is rapidly growing to keep pace with it [1,2,3]. It has led to an exponential increase in demand for DCs, and it is estimated that the growth rate will reach 12–14% over the next 2–5 years [4]. Notably, DCs represent substantial energy consumers, with their energy consumption per unit area surpassing that of conventional buildings by approximately 100 times [5]. Additionally, DCs currently contribute around 4.5% to the global electricity supply in 2025 [6,7]. Projections indicate that the expansion of the DC market coupled with advancements in power-density server components will result in annual increments in power demand ranging from 15% to 20% [8]. The energy consumption of the cooling system accounts for approximately 38% of the total energy consumption of the DC, with the remaining 52% attributed to the energy consumption of IT equipment [9,10]. It is reported that up to 97% of electricity consumed by IT equipment is transformed into heat [11]. In this context, employing free cooling and waste heat recovery technologies has become necessary.
Free cooling technology harnesses low-temperature air or water as a cost-effective cooling source, replacing mechanical refrigeration and dissipating heat from DCs [12,13]. This technology is typically categorized into two primary types based on the cooling source: fresh air and water [14]. The effectiveness of these technologies in saving energy hinges upon the geographical location of DCs. In regions characterized by hot summers and warm winters, adopting open cooling towers has proven effective in reducing the energy consumption of cooling systems. Research indicates that compared to traditional mechanical refrigeration, the system’s COP can increase by 23.7%, achieving an energy-saving rate of 19.2% [15]. However, the performance of the cooling tower is more relevant to the air temperature, and the water resource is more abundant and stable. Some DCs have capitalized on this by utilizing low-temperature lake water as a free cooling source, exemplified by the Qiandao Lake DC in Zhejiang and the Dongjiang Lake DC in Chenzhou, China. Their cooling energy consumption and PUE are dramatically reduced. Consequently, for DCs situated near lakes, integrating lake water to fulfill a portion of their cooling requirements emerges as both a favorable and sustainable option.
As mentioned above, DCs generate a large amount of heat. If left unutilized, the heat is typically dissipated outdoors by cooling systems, contributing to thermal pollution. Researchers have studied different utilization strategies for integrating waste heat recovery in DC operations, such as building heating [16,17,18], domestic water heating [19], power generation [20], desalination [21], swimming pool heating [22], and even DC cooling [23,24]. Due to its low-grade characteristics, the waste heat used for building heating is often considered the most efficient and likely to be promoted method [25]. It is reported that a 54-rack DC used to heat a 416 m2 office can save 20.8 MWh of electricity per year [26]. The potential for substantial energy savings was highlighted by heating a science park, with the net present value (NPV) reaching CNY 10.7 million and covering a heating area of up to 103,450 m2 [27]. For the majority of waste heat applications, a temperature of 70 °C and above is needed. However, the temperature of waste heat harvested from the hot air aisle in the air-cooled system of DC and chilled water ranges from 25 to 35 °C and 10–20 °C [28], respectively. Therefore, the increasing adoption of heat pumps (HPs) as an energy transfer medium between DCs and heated buildings is gaining attention as a promising solution. Specifically, the HPs have the dual benefit of providing space heating and removing the heat generated by DCs [29]. Murphy and Fung’s study illustrated that HPs could yield significant benefits when used for both cooling a 4 MW DC and heating a multi-unit residential building of 110,000 m2 [30]. Accordingly, the waste heat from DCs is a very valuable resource, and HPs are the link in transforming ‘waste’ into a valuable heat resource.
Given the substantial thermal management requirements, researchers have increasingly focused on the operational parameters influencing cooling efficiency in DCs. Recent studies have highlighted the significance of air supply temperature (SAT) in server rooms. To analyze the interactions of internal and external factors in cooling systems comprehensively, a multi-criteria assessment of increasing SAT in the air-cooled DCs was proposed. It reported that as SAT increases from 20 °C to 32 °C, the PUE decreases by 16.8–19.3% [31]. One study specifically focusing on the effect of SAT on the air-side economizer cooling system revealed that the lowest energy consumption was observed at a supply air temperature setting of 18–23 °C [32]. Additionally, Cho [33] investigated DC row-based cooling strategies under fault conditions, suggesting that setting the SAT of row-based cooling to 22 °C or lower and installing a thermal buffer tank in the chilled water system could effectively delay downtime. However, apart from SAT, numerous other operational parameters of the cooling system are closely associated with DC thermal management, such as chilled water supply temperature and the temperature difference between chilled water and SAT. Despite their importance, there is limited research addressing these factors. Further exploration into these aspects is warranted to enhance understanding and improve the DC cooling systems.
Overall, existing studies have unequivocally demonstrated the significance and feasibility of employing free cooling and waste heat recovery techniques to achieve energy savings in DCs. However, there remains a paucity of studies analyzing the synergistic benefits of integrating lake water cooling and waste heat recovery in the DC system. In addition, there is relatively little analysis of the factors that affect the effective recovery of waste heat, such as the location, volume, and extraction method of waste heat recovery, which is necessary. Therefore, this paper suggested a system integrating lake water cooling with waste heat recovery for DCs. We evaluated the potential of the proposed system and the influence of the waste heat recovery positions, volumes, and heat collection methods that are related to the effectiveness of waste heat recovery inherently. Furthermore, an analysis of system parameters closely linked to the operational behavior was conducted. The remainder of this article is organized as follows. Section 2 introduces the details of the system and models. Section 3 shows the simulation results and analysis. Section 4 presents the conclusions.
2. Modeling System
2.1. System Description
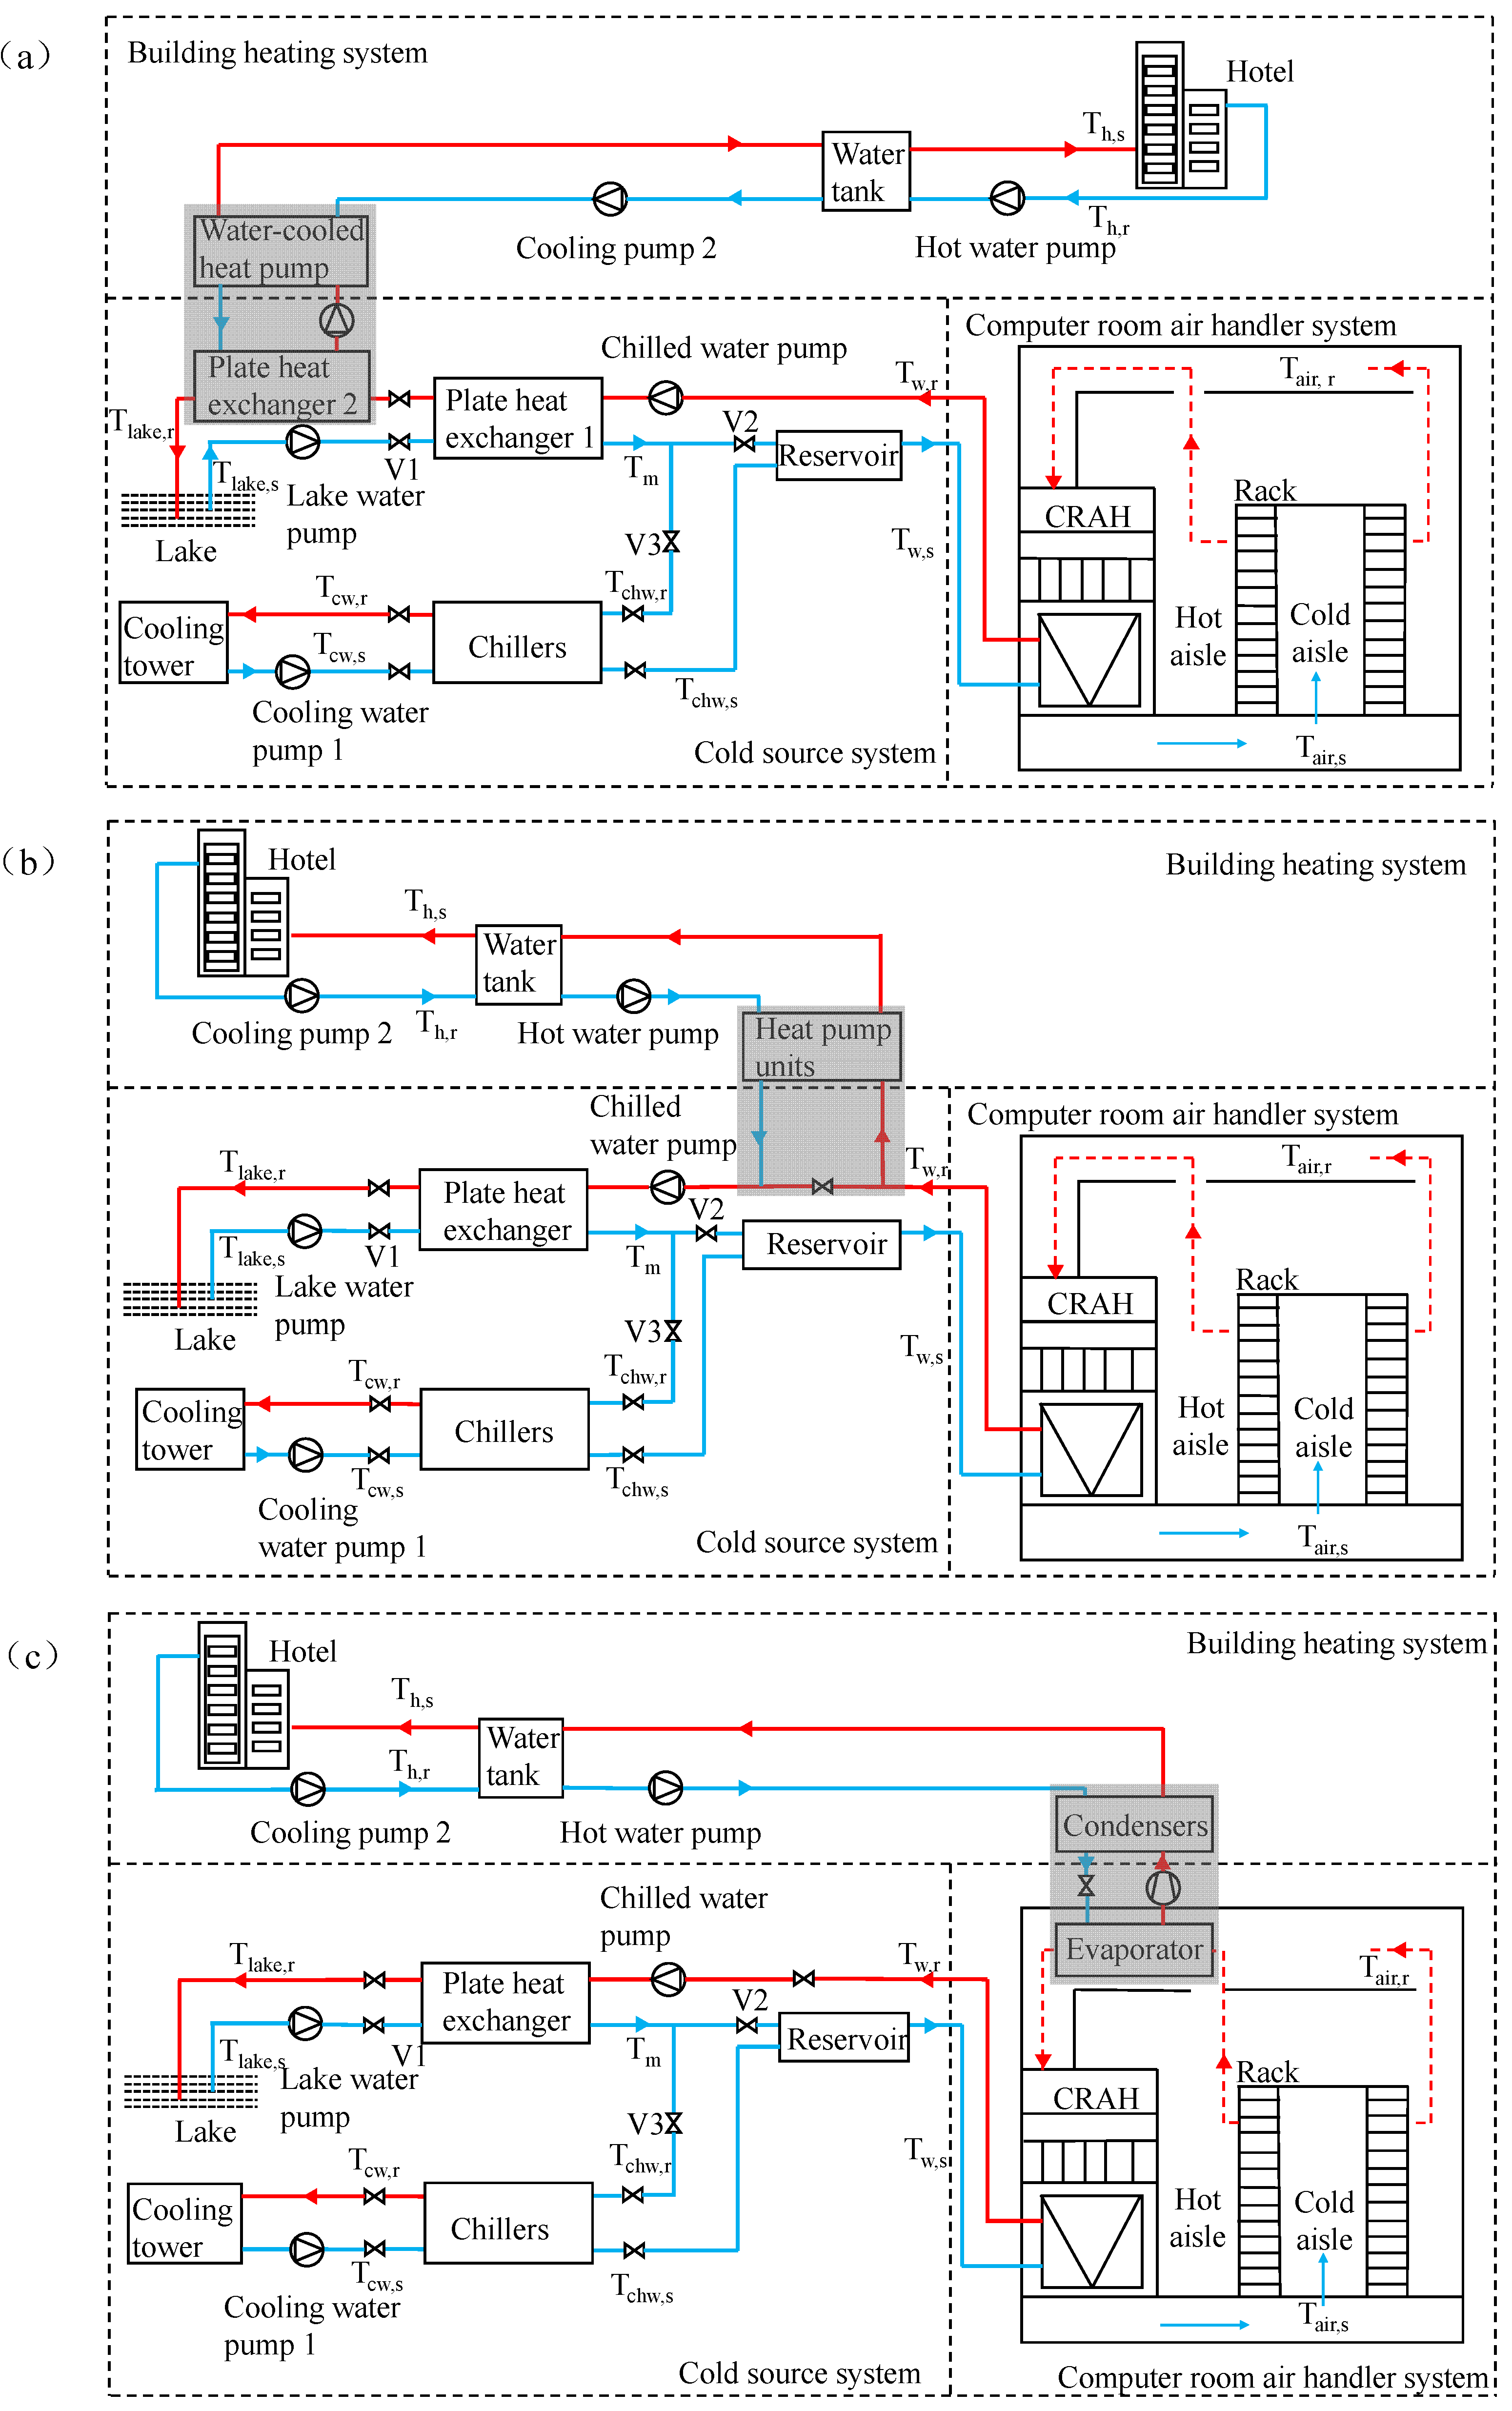
A hybrid cooling system with low-temperature lake water integrated with chiller units as the cooling sources coupled with a waste heat recovery system is designed to improve the energy efficiency for DCs, as shown in Figure 1.
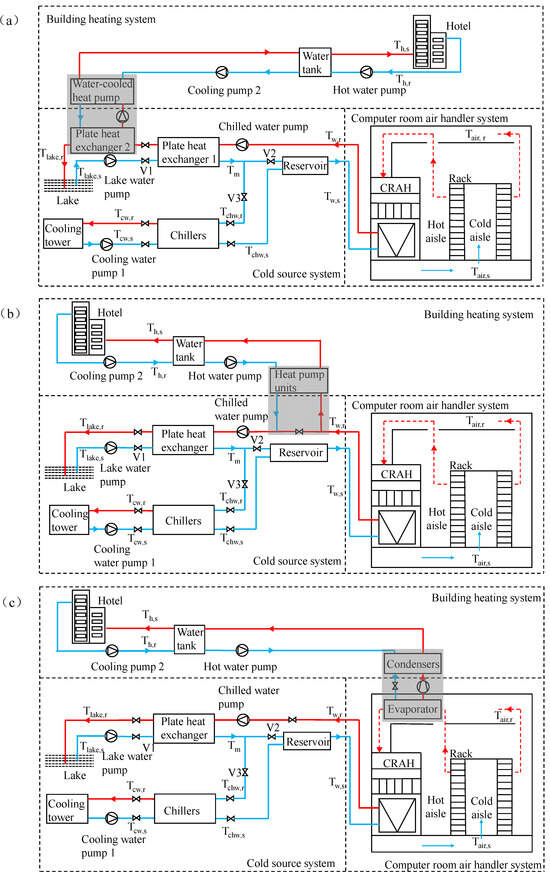
Figure 1.
Schematic diagram of the lake water cooling coupled with three kinds of waste heat recovery positions: (a) lake water, (b) chilled water, and (c) air in server rooms.
Specifically, the hybrid cooling system can offer three distinct operational modes achieved through on–off control of relevant components, including the free cooling mode, hybrid cooling mode, and mechanical cooling mode. The operation mode is determined by the lake water temperature with a rule-based control method as follows: (1) The free cooling mode is engaged when the chilled water return temperature is lower than the temperature of the lake water. During this mode, the lake water supply undergoes a heat exchange with the chilled water returned to the heat exchanger. Subsequently, the chilled water is directed back to the computer room air handlers (CRAHs) without additional cooling processes. (2) The hybrid cooling mode comes into effect when the chilled water return temperature is lower than the temperature of the lake water, yet the cooling capacity of the lake water is insufficient. Here, the lake water supply initially absorbs a portion of the heat from the chilled water, followed by the entry of cooling water from the cooling tower into the chiller to further extract heat from the chilled water. (3) The mechanical cooling mode is activated when the return temperature of chilled water exceeds that of the lake water. In this mode, the chilled water return is directed straight into the chiller for cooling. This dynamic operational framework ensures adaptive and efficient cooling performance contingent upon the prevailing temperature conditions of the lake water.
Furthermore, the waste heat recovery systems are designed to integrate with the hybrid cooling system. Compared to ordinary industrial waste heat, DCs have a large amount of lower-quality heat. Therefore, the HP system is used to improve the quality of temperature to satisfy the temperature requirements of space heating and hot water in the hotel building [34]. In the cooling system process, three places can be used for waste heat recovery as follows: the lake water, the chilled return water, and the return air of IT equipment, as shown in Figure 1a–c, respectively. Figure 1a displays heat extraction from lake water after heat exchange with chilled return water (free cooling mode and hybrid cooling mode). Figure 1b shows the extraction of heat from the chilled return water after heat exchange with the IT equipment return air. Figure 1c indicates heat extraction from the return air of IT equipment. The temperature of waste heat at several locations is different. The temperature of the return air is the highest, followed by the chilled return water, and the temperature of the lake water is the lowest. Generally, the higher the temperature, the higher the efficiency of the waste heat recovery system, but the impact of waste heat recovery on the cooling system varies at different locations. The impact of waste heat recovery location on the overall performance of heating and cooling systems is comprehensively evaluated in this study.
2.2. Load Calculation Models
Most of the DC’s cooling load comes from IT equipment. In addition, the heat transfer of the envelope and the heat dissipation of lighting also need to be considered. It is common to disregard the relatively minor contributions to the cold load from personnel and infiltration. Therefore, the cold load of the DC can be calculated by Equation (1).
where LDC,cooling(i) is the cold load of the DC at the time of i, kW; Lenvelope(i) is the cold load caused by the enclosure structure at the time of i, kW; Llighting(i) is the cold load caused by the lighting at the time of i, kW; LIT(i) is the cold load caused by the operation of IT equipment at the time of i, kW.
The cold load caused by the enclosure of the server rooms depends on the heat transfer coefficient of the enclosure, the heat transfer area, and the temperature difference between indoors and outdoors:
where Kenvelope is the heat transfer coefficient of the enclosure structure of the server room, W/(m2·K), taking 1.26 [35]; A is the heat transfer area of the enclosure structure, m2; toutdoor is the dry-bulb temperature of the outdoor air, °C; tindoor is the temperature of the server rooms, °C.
The cold load attributed to the lighting in the server rooms is calculated using the unit area illuminance low:
where q is the heat flux from lighting, kW/m2.
Most of the IT equipment cooling load comes from servers. The 380 V AC input should be stored in the uninterruptible power supply (UPS) first and then be stepped down to 220 V AC in the power distribution unit (PDU) before entering the racks. There is a certain power loss during the power distribution process, which will be converted into heat dissipation. Accordingly, the calculation formula is Equation (4).
where Lservers is server heat dissipation, kW; LPDUs is PDU heat loss, kW; LUPSs is UPS heat loss, kW.
During the operation of servers, most of the electrical power consumed is converted into heat dissipation. The power consumed by servers is influenced by the servers’ utilization and inlet air temperature [36]. Therefore, the cooling load of the servers can be calculated with Equation (5).
where Nserver is the number of servers; PFpower is the correlation factor [37], %; Pfull is the full load power of the servers, kW; α is the rate of change of heat dissipation of the server; Tair, s is the temperature of the air supply to the server rooms, °C; userver is the server utilization. In this study, the hourly values shown in Table 1 were used as an example, which were obtained by testing servers in a rack at full utilization for a day [36].

Table 1.
Hourly average utilization of servers in a day [36].
The heat loss of both PDUs and UPSs is related to the server heat dissipation, which is mainly composed of two parts: no-load heat loss and partial heat loss [35]:
where, LPDUidle and LUPSidle are the heat loss of the PDUs and UPSs under no load, kW; LPDUs and LUPSs are the total heat loss of the PDUs and UPSs, kW; πPDU and πUPS are the loss coefficients of the PDUs and UPSs, 0.000075 and 0.05, respectively [35].
In addition to modeling the cooling load of the DC, it is also necessary to obtain the heating characteristics of the building. Accordingly, a hotel with heating demand near the DC is selected as the simulation object, and the air conditioning data are obtained by DeST. Additionally, the hot water demand is determined following the guidelines outlined in the Standard for Design of Building Water Supply and Drainage (GB 50015-2019 [38]).
2.3. Simulation Model
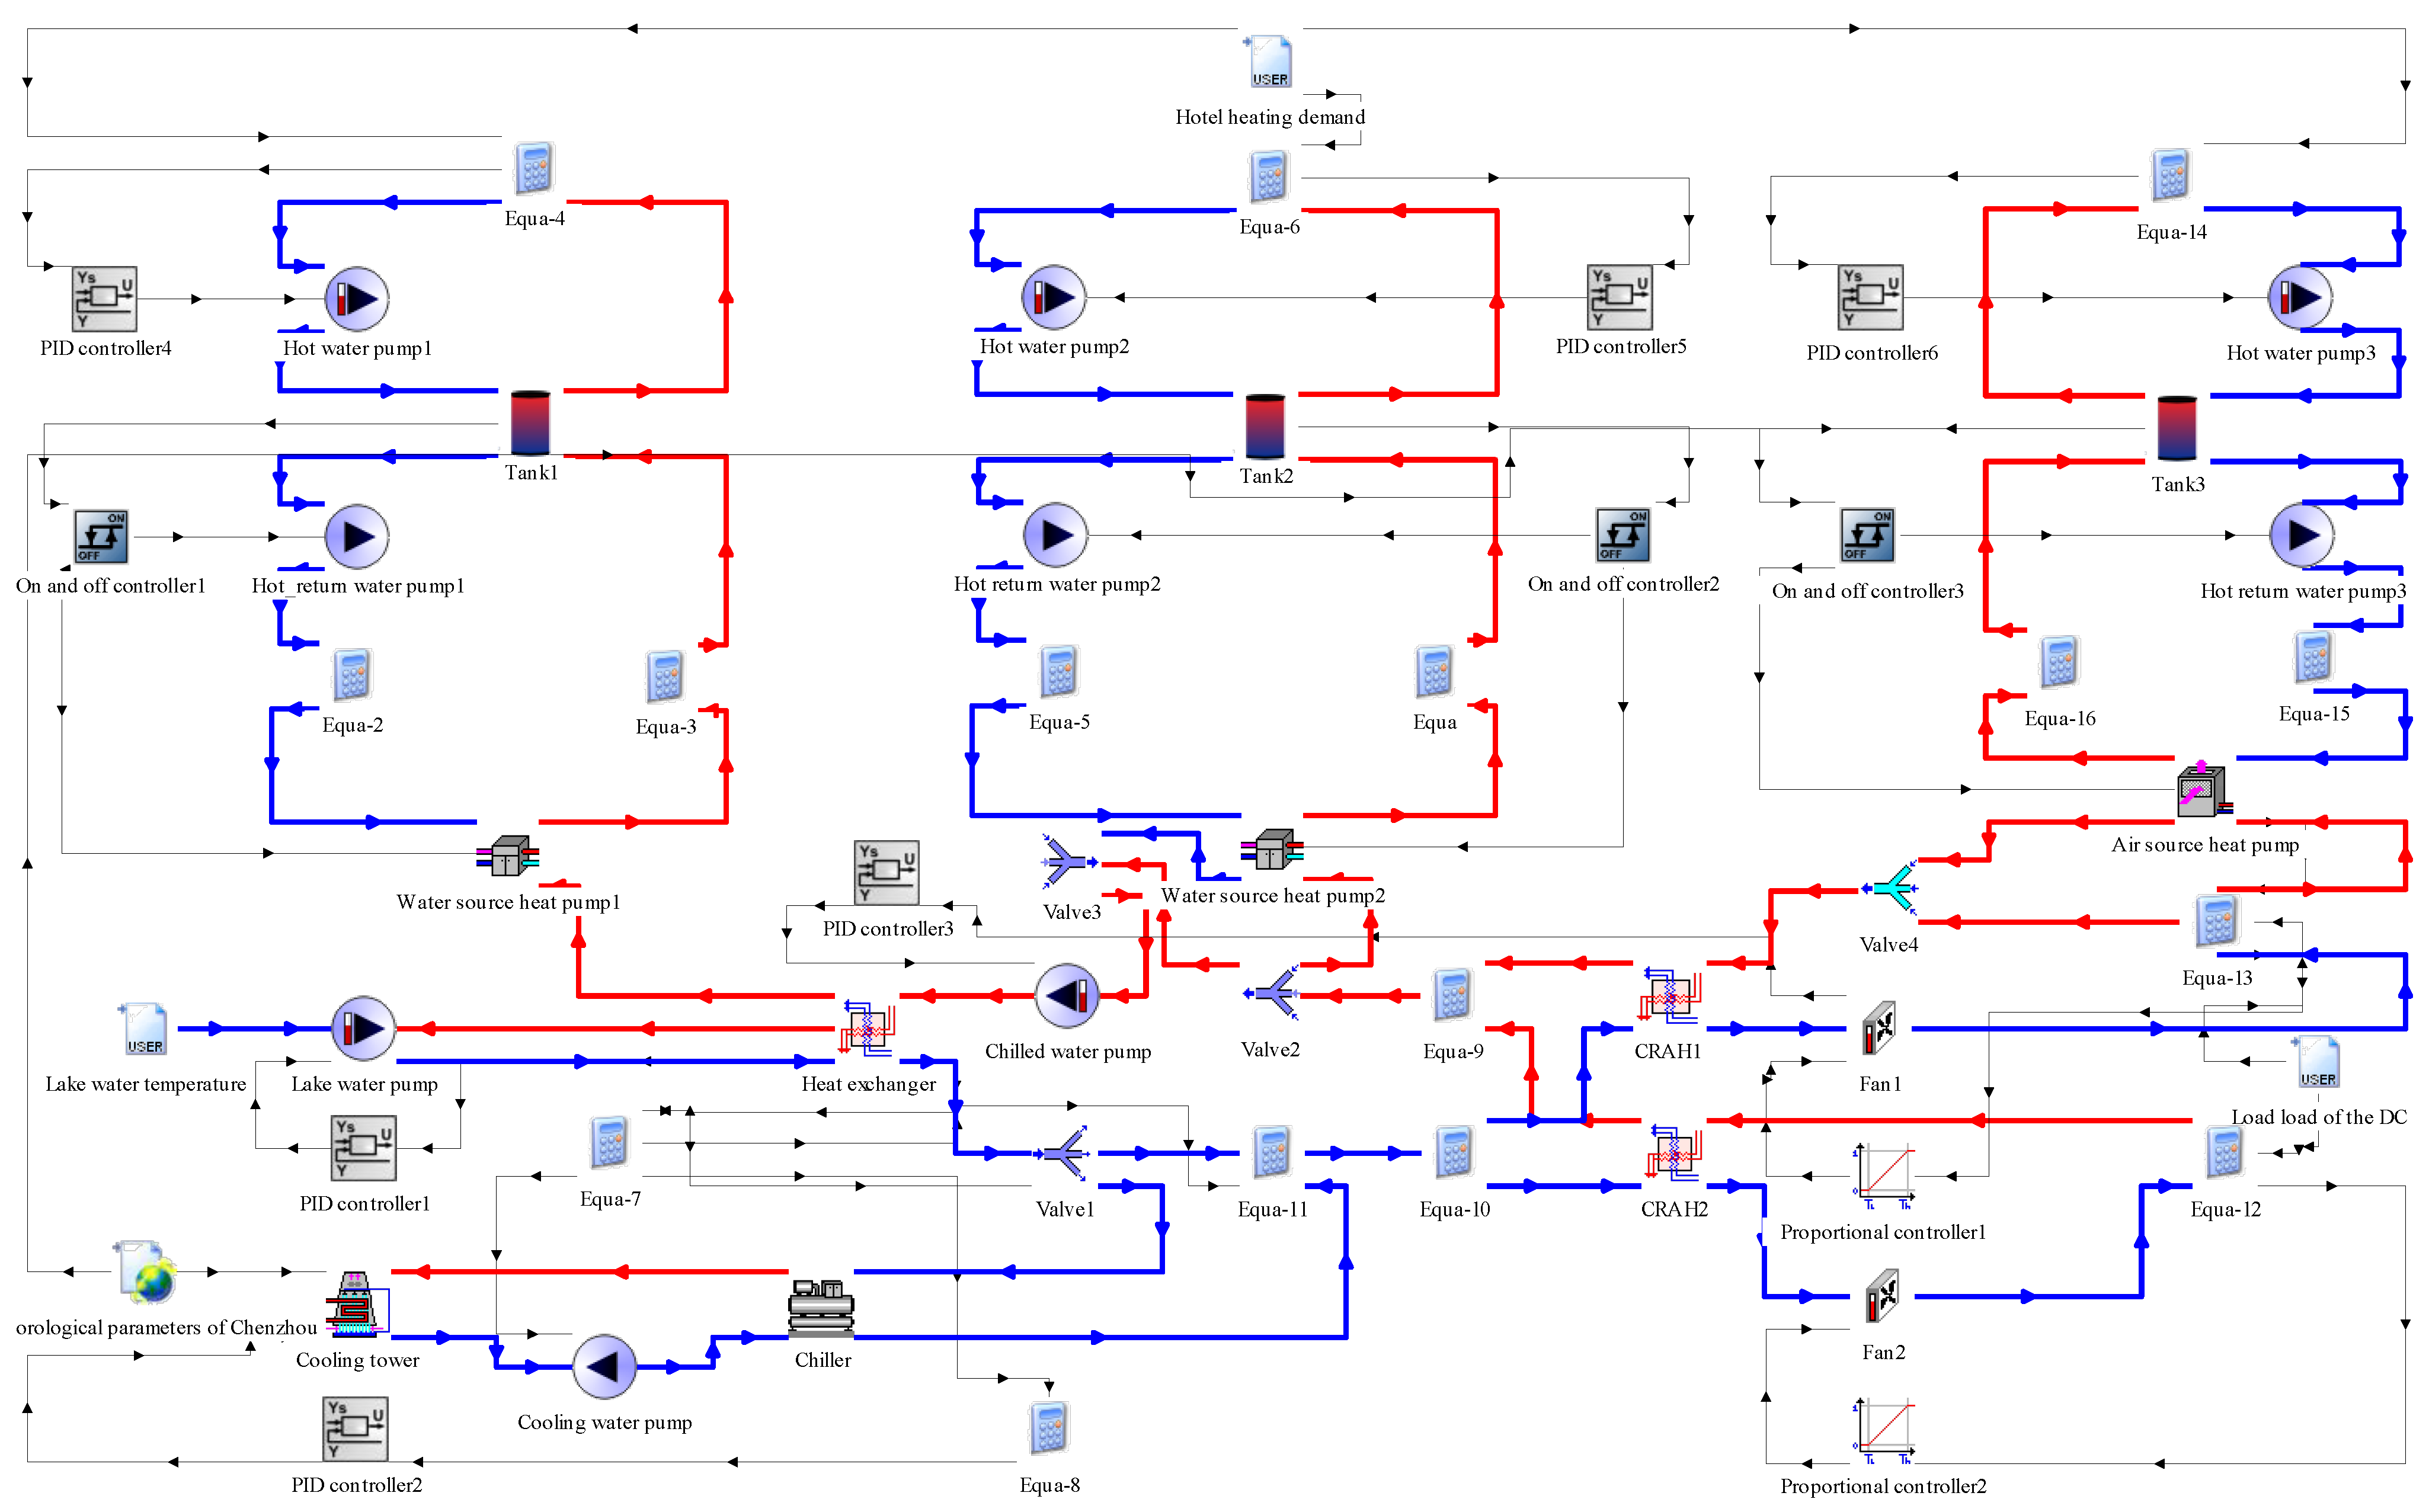
A dynamic simulation model is developed for the integrated energy system of the DC, facilitated using TRNSYS. The schematic representation of the constructed simulation model is depicted in Figure 2. Key components such as the cooling tower, chilled water pump, and hot water pumps are regulated employing PID control. Specifically, in the cooling system, the lake water pump is regulated to maintain the chilled water supply temperature at 15 °C during the free cooling mode. Conversely, in other modes, the cooling tower fan is controlled to maintain a 5 °C temperature difference between the supply and return of the cooling water. The frequency-controlled chilled water pump ensures an air supply temperature of 22 °C for the server rooms while linearly controlling the CRAH fans to ensure that the temperature of the return air does not exceed 35 °C. In the heating system, the hot water pump is governed to sustain a 20 °C temperature differential between the supply and return of the hot water, and the HPs are activated or deactivated to supply hot water at 50~55 °C for the hotel. The device models in the integrated system are developed based on the TRNSYS component library. The main components of the system and the corresponding key parameters are listed in Table 2.
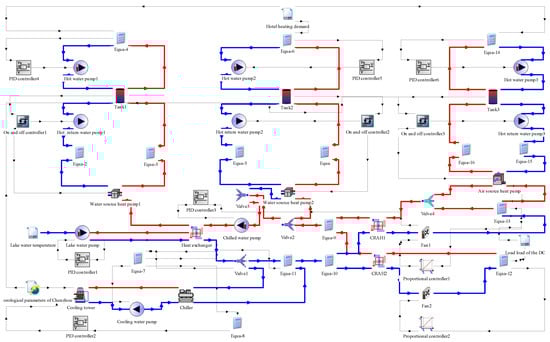
Figure 2.
TRNSYS model of the proposed system.
Table 2.
Technical parameters for the device model of the studied system.
2.4. PUE Analysis
An important metric that is used to determine the productivity level of the DC is the PUE index. It is the most common benchmark for measuring the power effectiveness of the DC. The PUE index indicates the ratio of total power consumed by the DC to the power consumption of the IT equipment [39]. It can be calculated using Equation (12).
where Ptotal is the total energy consumption of the DC, kWh; PIT is the energy consumption of IT equipment, kWh. In addition to the energy consumption attributed to IT equipment, the total energy consumption of a DC encompasses the energy utilized by its cooling system. It includes energy consumed by components such as cooling towers, the cooling water pump, the chiller, the chilled water pump, the lake water pump, and fans.
2.5. COP Analysis
COP refers to the cooling capacity that can be obtained per unit of power consumption and is a significant technical indicator of refrigeration systems. A high coefficient of refrigeration performance indicates a high energy utilization efficiency of the refrigeration system. It can be calculated using Equation (13).
where LDC,cooling is the cooling load of the DC, kWh; Pcooling is the energy consumption of the cooling system of the DC, kWh.
3. Results and Discussion
This section delves into the analysis of three factors affecting waste heat recovery. Initially, it examines the effect of diverse heat recovery locations on the efficiency of waste heat recovery based on the scenario of no-waste heat recovery. Subsequently, multiple levels of waste heat recovery volumes are designed to investigate the energy-saving trends associated with recovering waste heat from the DC at varying capacities. Following this, it assesses the influence of different approaches to acquiring IT equipment waste heat on the potential for energy conservation. Additionally, it evaluates the effects of several critical parameters on system operation.
The studied DC with four server rooms is located near Dongjiang Lake, Chenzhou City, China, which belongs to the hot summer and cold winter zone. The detailed specifications and parameters of the server rooms are provided in Table 3. According to the temperature monitoring results of Dongjiang Lake from 2022 to 2023, the lake water temperature remains within the range of 10.86 to 16.66 °C throughout the year, as shown in Figure 3. Therefore, Dongjiang Lake contains abundant cooling resources. Due to the location of the DC in a 5A-level scenic area, hotel construction is planned and it requires year-round heating. The hotel has 130 rooms with an area of 5840 m2, and when calculating its heating load, it is assumed that its occupancy rate is 100%. Simulation condition parameters are listed in Table 4. In this paper, METEONORM 8 software is used to export the dry-bulb temperature, wet-bulb temperature, and other data for typical meteorological years in Chenzhou, and the meteorological component in TRNSYS is employed to read them. The heat loss, pipeline resistance loss, and equipment performance degradation are ignored. It is worth noting that we have tested the case DC and the calculated PUE based on the test data, and the simulation results are close.
Table 3.
Related parameters of the DC.
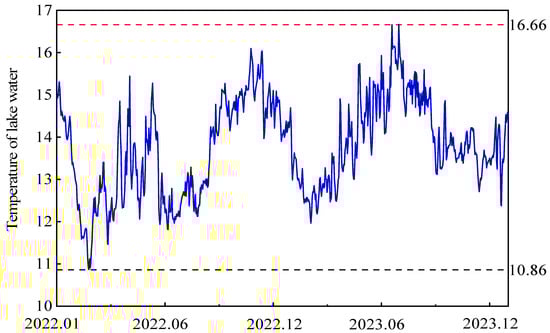
Figure 3.
Water temperature in Dongjiang Lake from January 2022 to December 2023.
Table 4.
Simulation condition settings.
3.1. Comparative Analysis of Energy Consumption of Waste Heat Recovery Locations
Since there is no centralized large-scale heating in Chenzhou, the air source heat pump (ASHP), as a clean and efficient heating system, is currently the main method for building heating and hotel hot water supply in this city. Hence, this study designs a heat pump heating system as a comparison case (Scenario a1). Scenarios a2 and a3 entail waste heat recovery from the lake water and chilled water employing water source heat pumps (WSHPs). It is worth noting that the heating system recovers waste heat from the lake water return in Scenario a2, and the lake water is discharged back into the lake, so it will not affect the cooling system. The heating system in Scenario a3 utilizes the waste heat from the chilled water return, which will affect the performance of the cooling system. Scenario a4 entails waste heat from the air in the server rooms utilizing ASHPs. Therefore, the heating system in Scenarios a1 and a2 operates independently from the cooling system. In contrast, Scenarios a3 and a4 involve the recovery of low-temperature waste heat, wherein the cooling provision to the DC prompts alterations in the operation of the cooling system.
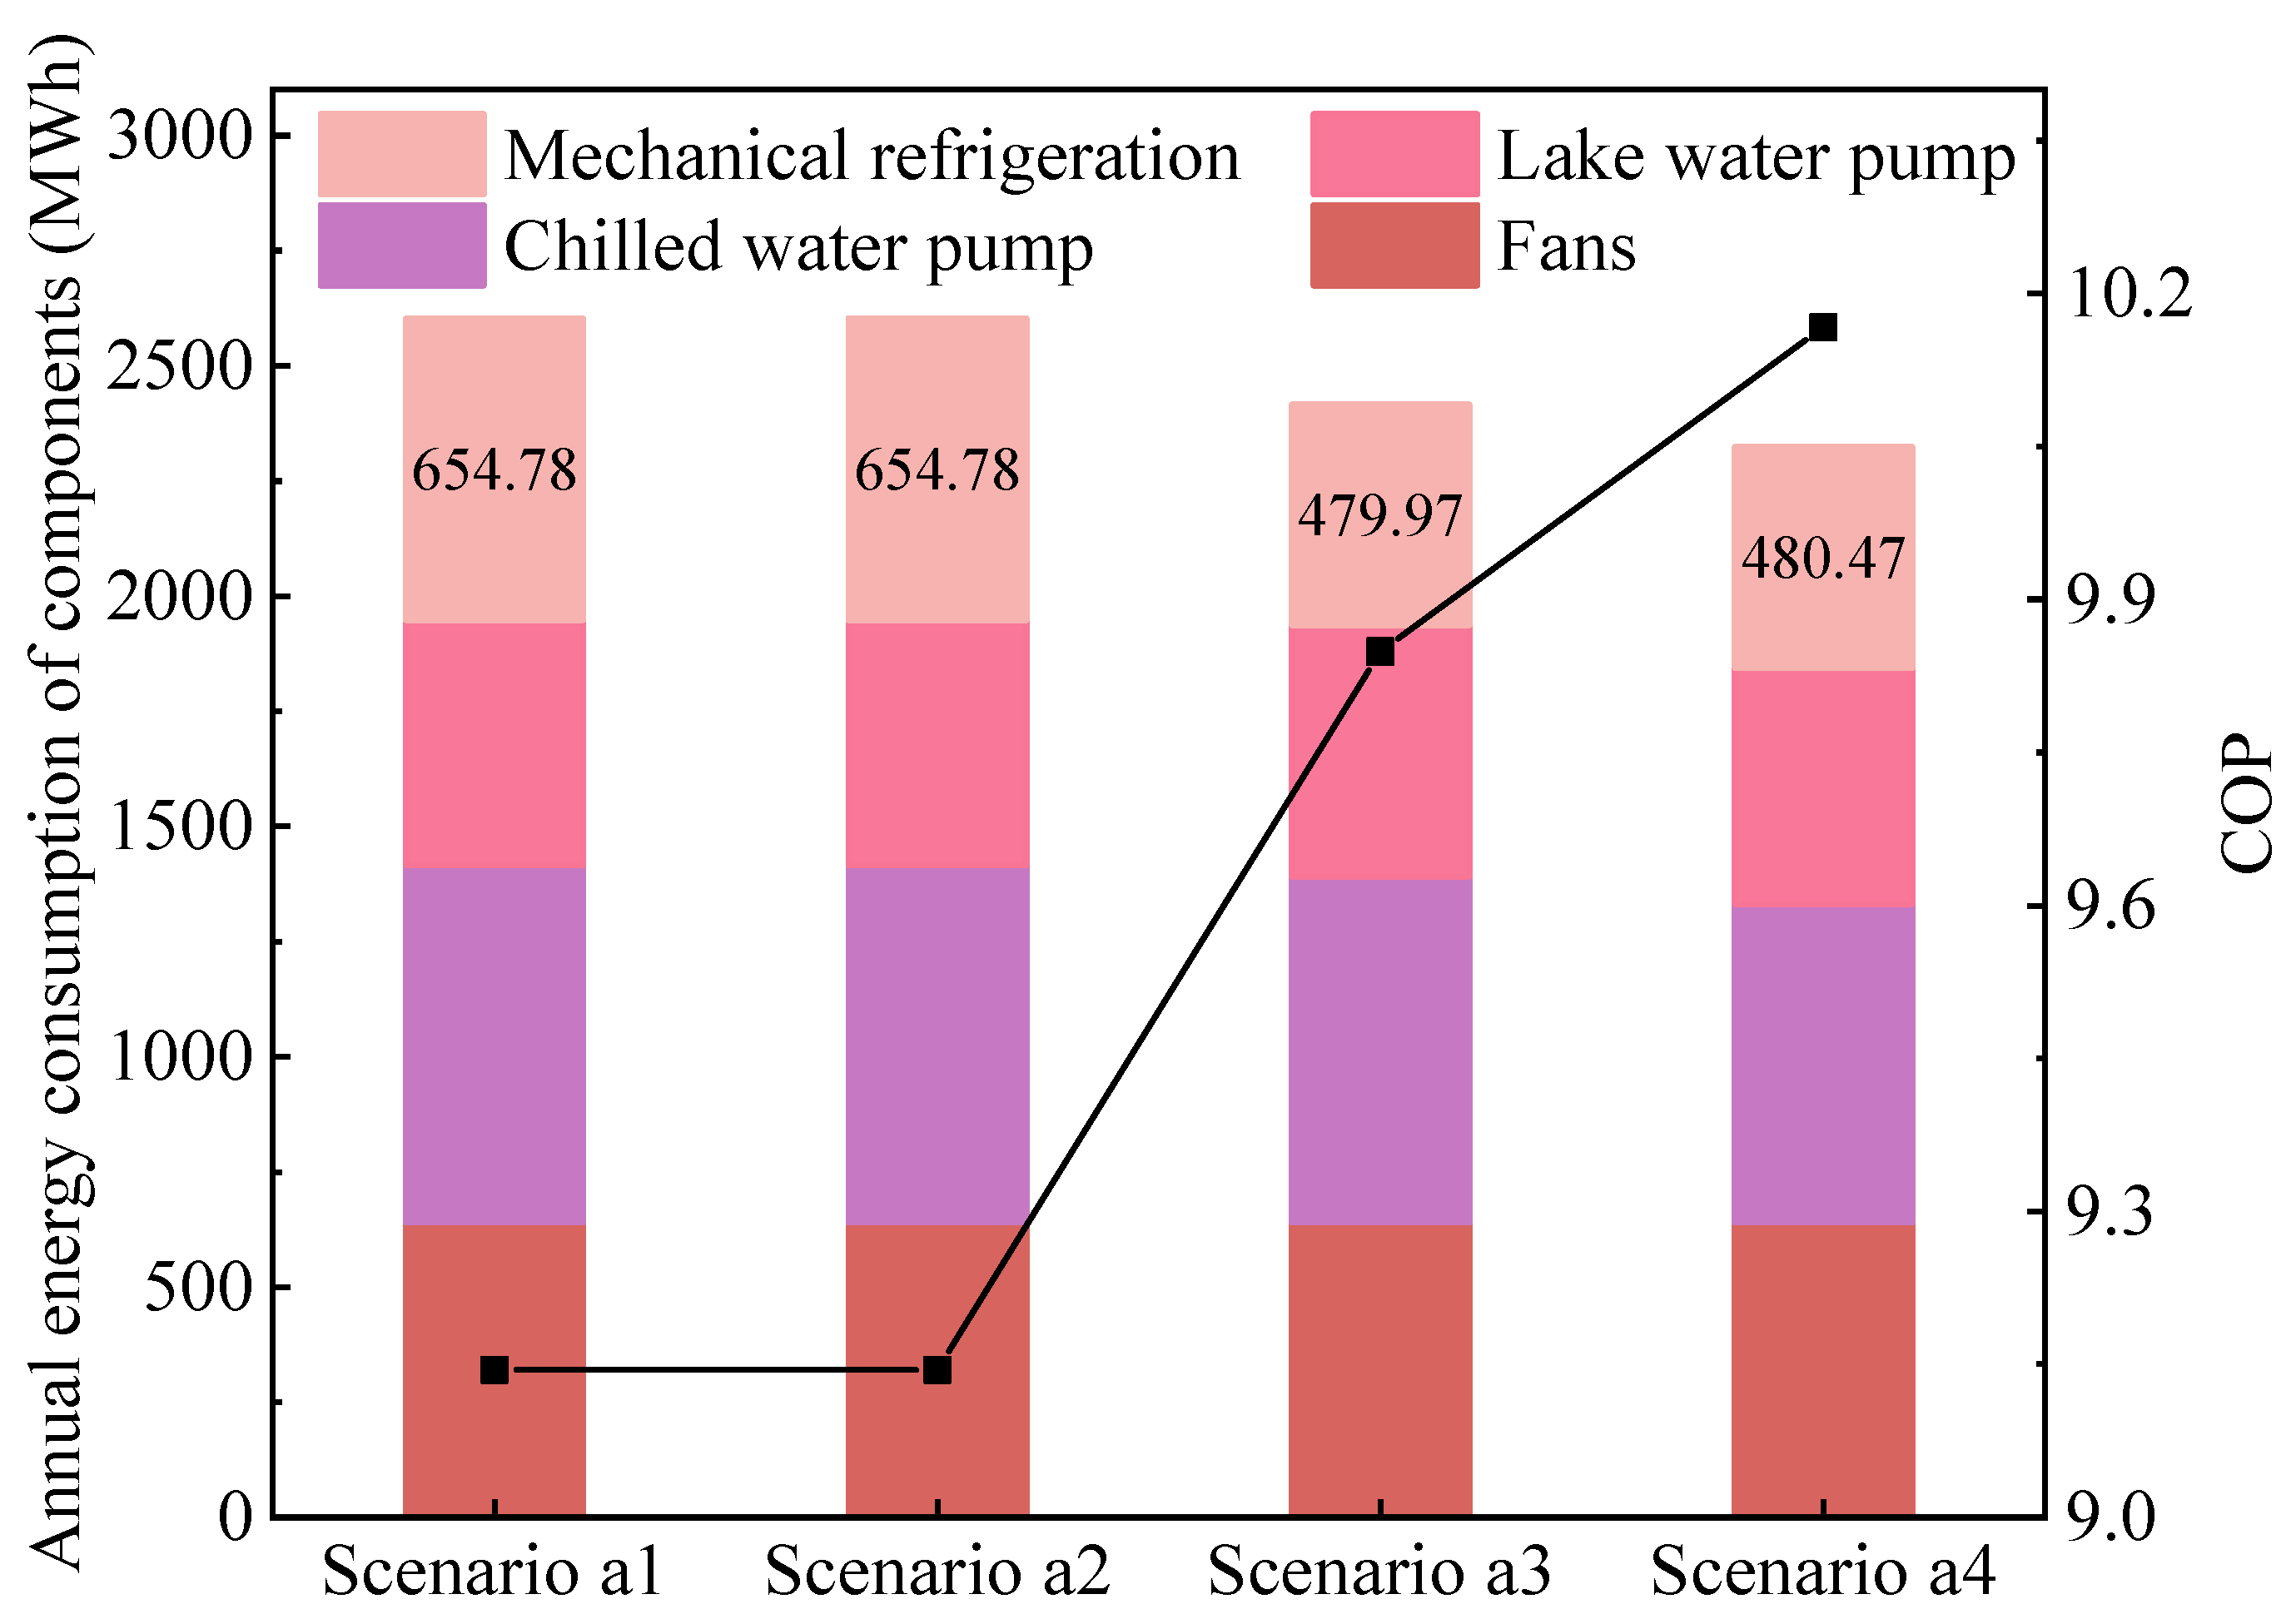
Figure 4 illustrates the energy consumption for components of the cooling system in four scenarios. The findings reveal that the energy consumption of components of the cooling system remains consistent in Scenarios a1 and a2, indicating that waste heat recovery in Scenario a2 does not impact the cooling system. Conversely, in Scenarios a3 and a4, HPs effectively recuperate waste heat and transfer cooling capacity to the cooling system, consequently diminishing cooling energy consumption, with the latter exhibiting more pronounced reductions. The main reason for energy conservation in these two scenarios is to reduce the energy consumption of mechanical refrigeration. The energy consumption of mechanical refrigeration is defined as the sum of the energy consumption of the cooling tower, the cooling water pump, and the chiller. The energy consumption associated with mechanical cooling primarily hinges on the operational durations of the three modes. The operational time of the free cooling mode in Scenarios a1 and a2 amounts to 4031 h, while the operational time of the free cooling mode in Scenarios a3 and a4 is 5144 and 5267 h, reduced by 58.72% and 60.13%, respectively. The mechanical cooling energy consumption of Scenarios a1 and a2 reaches 654.78 MWh, while that of Scenarios a3 and a4 is 479.97 MWh and 480.47 MWh, respectively. Furthermore, compared to Scenario a3, the heating system in Scenario a4 recovers the waste heat from the return air of the IT equipment, resulting in a decrease in return air temperature and subsequently reducing chilled water flow and chilled water pump energy consumption. The energy consumption of the chilled water pump is notably lower, totaling 776 MWh, which marks a 10.83% decrease compared to Scenario a1. Furthermore, the COP of the cooling system in Scenarios a1 and a2 is 9.14, while Scenarios a3 and a4 achieve COPs of 9.85 and 10.17, respectively, due to the recovery of waste heat from the cooling system.

Figure 4.
The COP and energy consumption of components of the cooling system in four scenarios.
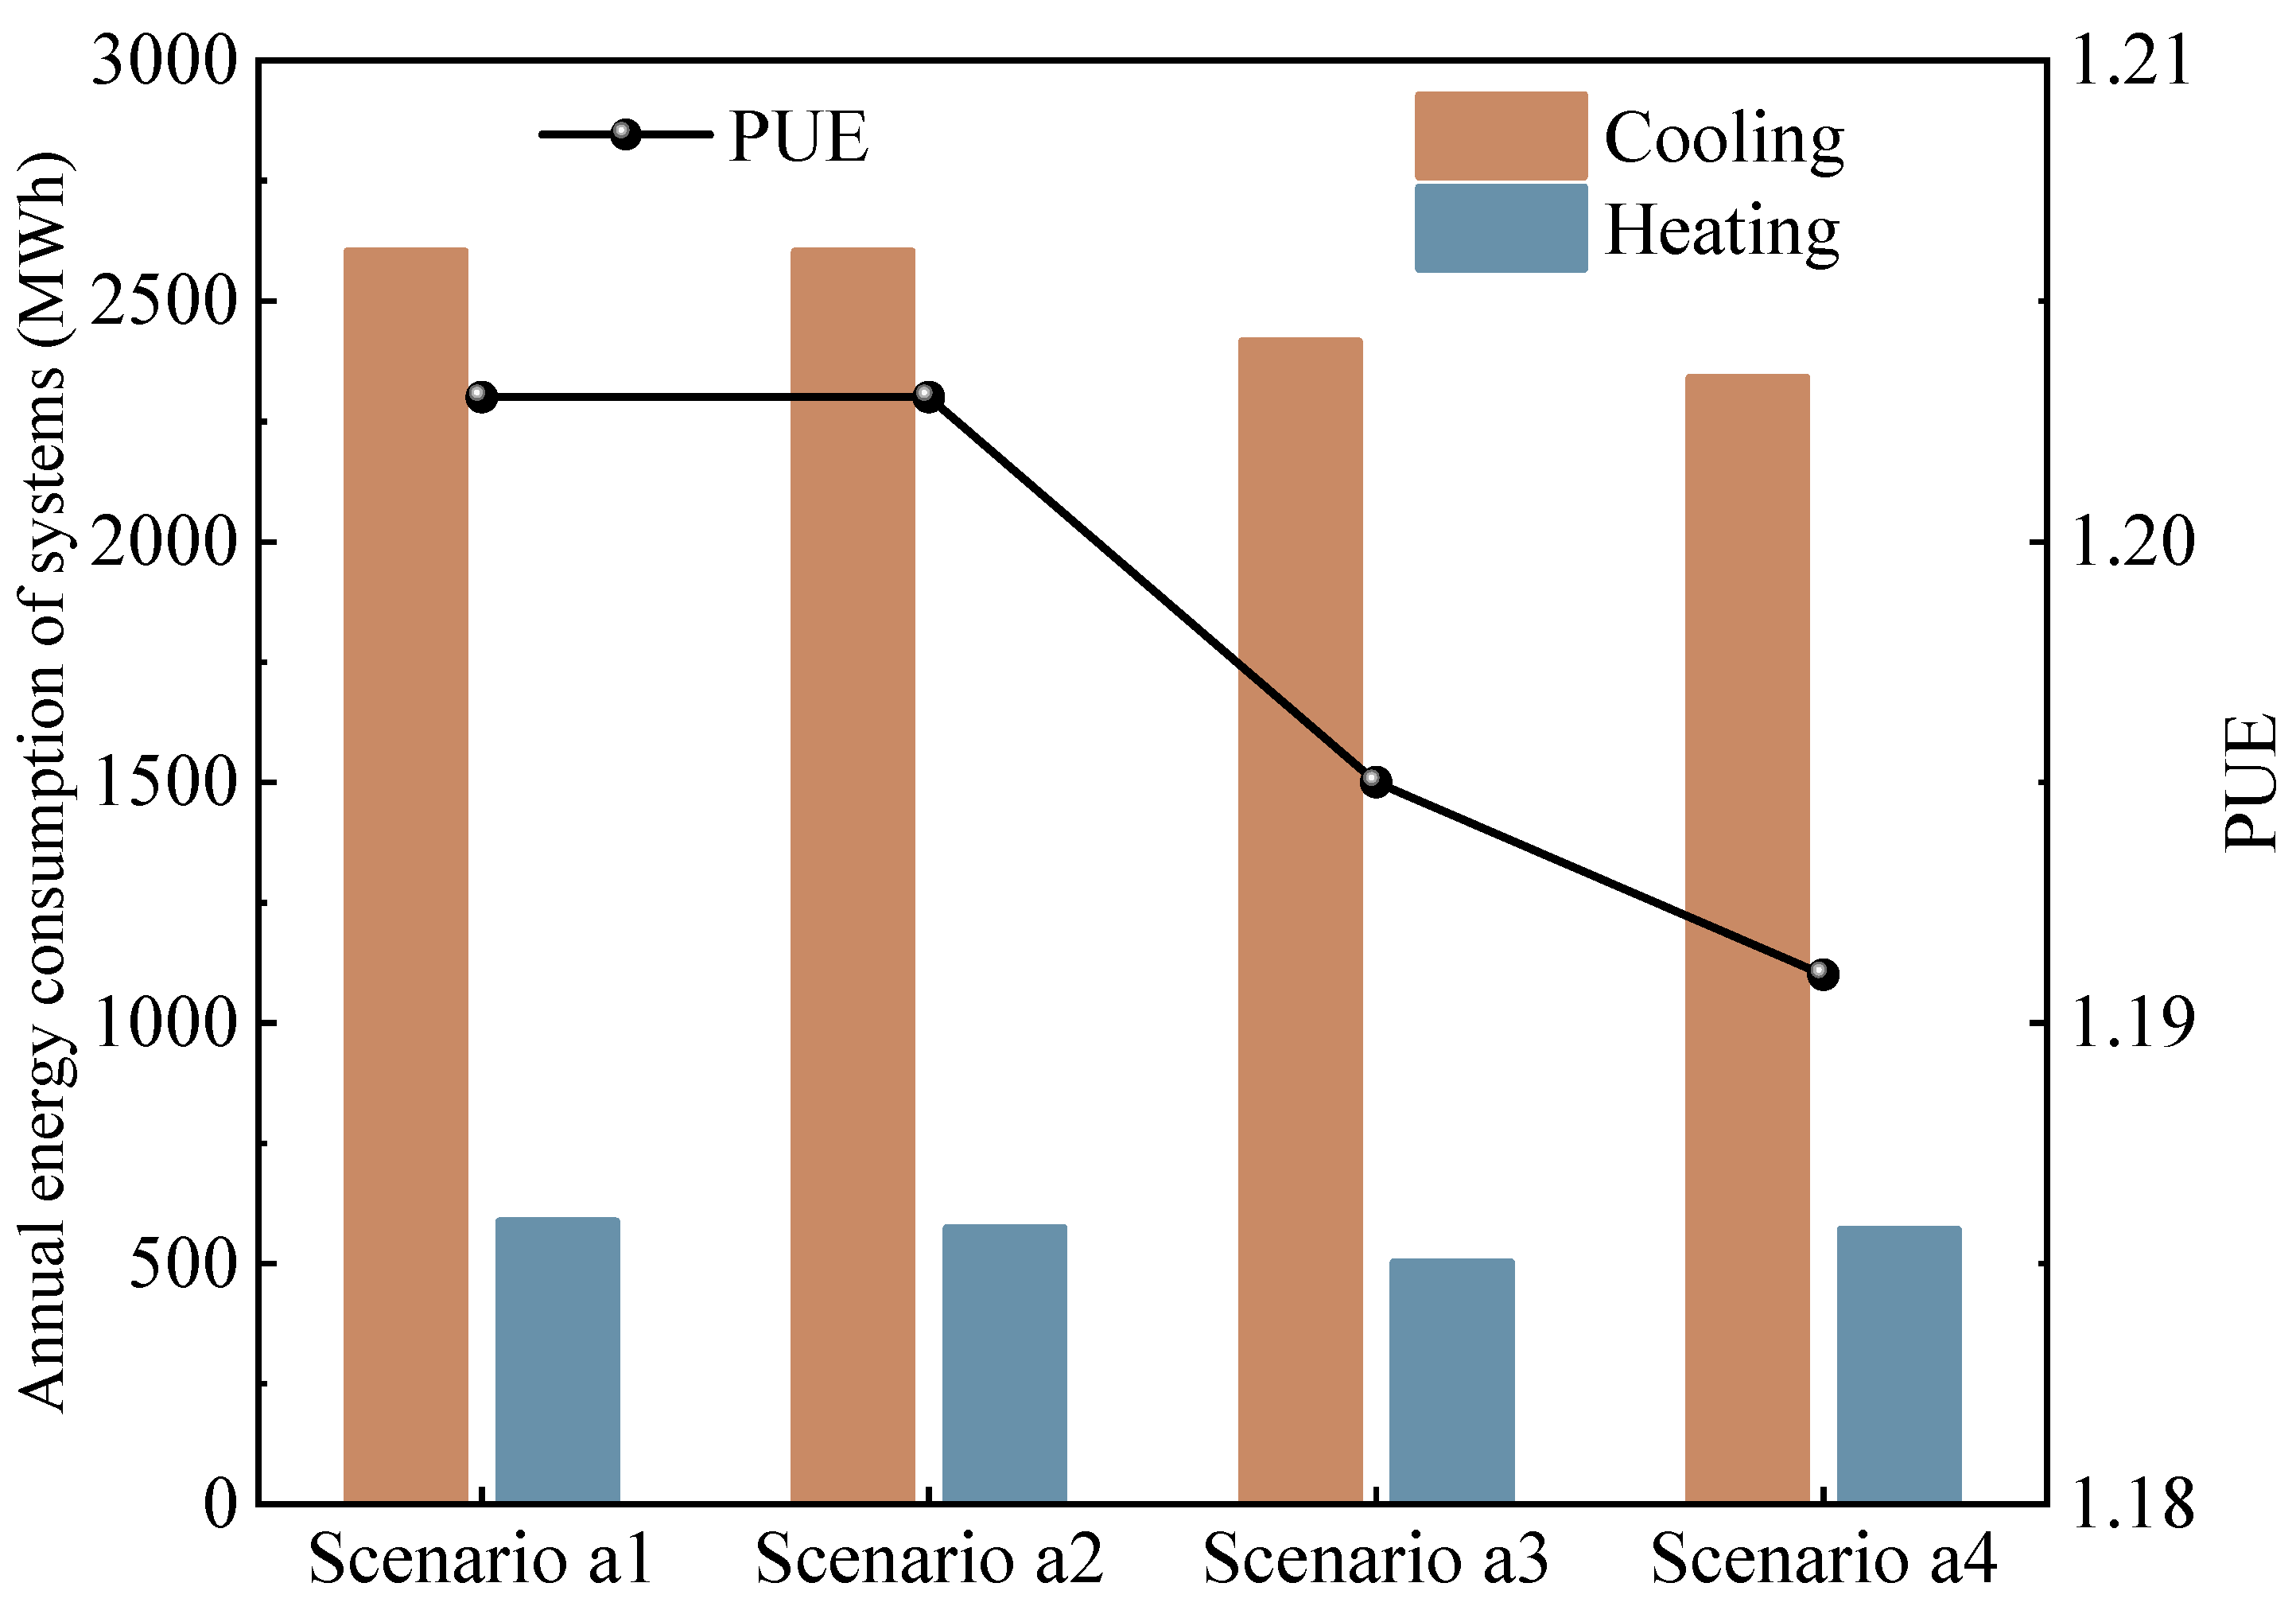
Figure 5 depicts the PUE and energy consumption of the cooling and heating systems in the four scenarios. The results indicate that Scenarios a3 and a4 exhibit higher overall energy-saving rates of 8.51% and 8.75%, respectively. Regarding the cooling system of the DC, both the cooling energy consumption and PUE of Scenarios a1 and a2 are identical and the highest among the scenarios. Consequently, the cooling energy consumption and PUE of Scenarios a3 and a4 are lower compared to Scenario a1, with energy-saving rates for the cooling system amounting to 7.15% and 10.06%, respectively.

Figure 5.
Annual energy consumption of systems and PUE of the four scenarios.
Additionally, from Figure 5, it is evident that the building heating energy consumption of Scenario a3 is the lowest, while the heating energy consumption of Scenarios a2 and a4 is approximately equal. The analysis reveals that, compared to Scenario a1, the energy-saving rates of the heating systems in Scenarios a2 to a4 amount to 2.41%, 14.53%, and 2.96%, respectively. In Scenarios a1 and a2, the heating system operates independently of the cooling system. However, in Scenarios a3 and a4, the heating system influences the cooling system through HPs, where the heat supply can impact the cooling system’s energy-saving rate and PUE.
3.2. Comparative Analysis of Waste Heat Recovery Volumes
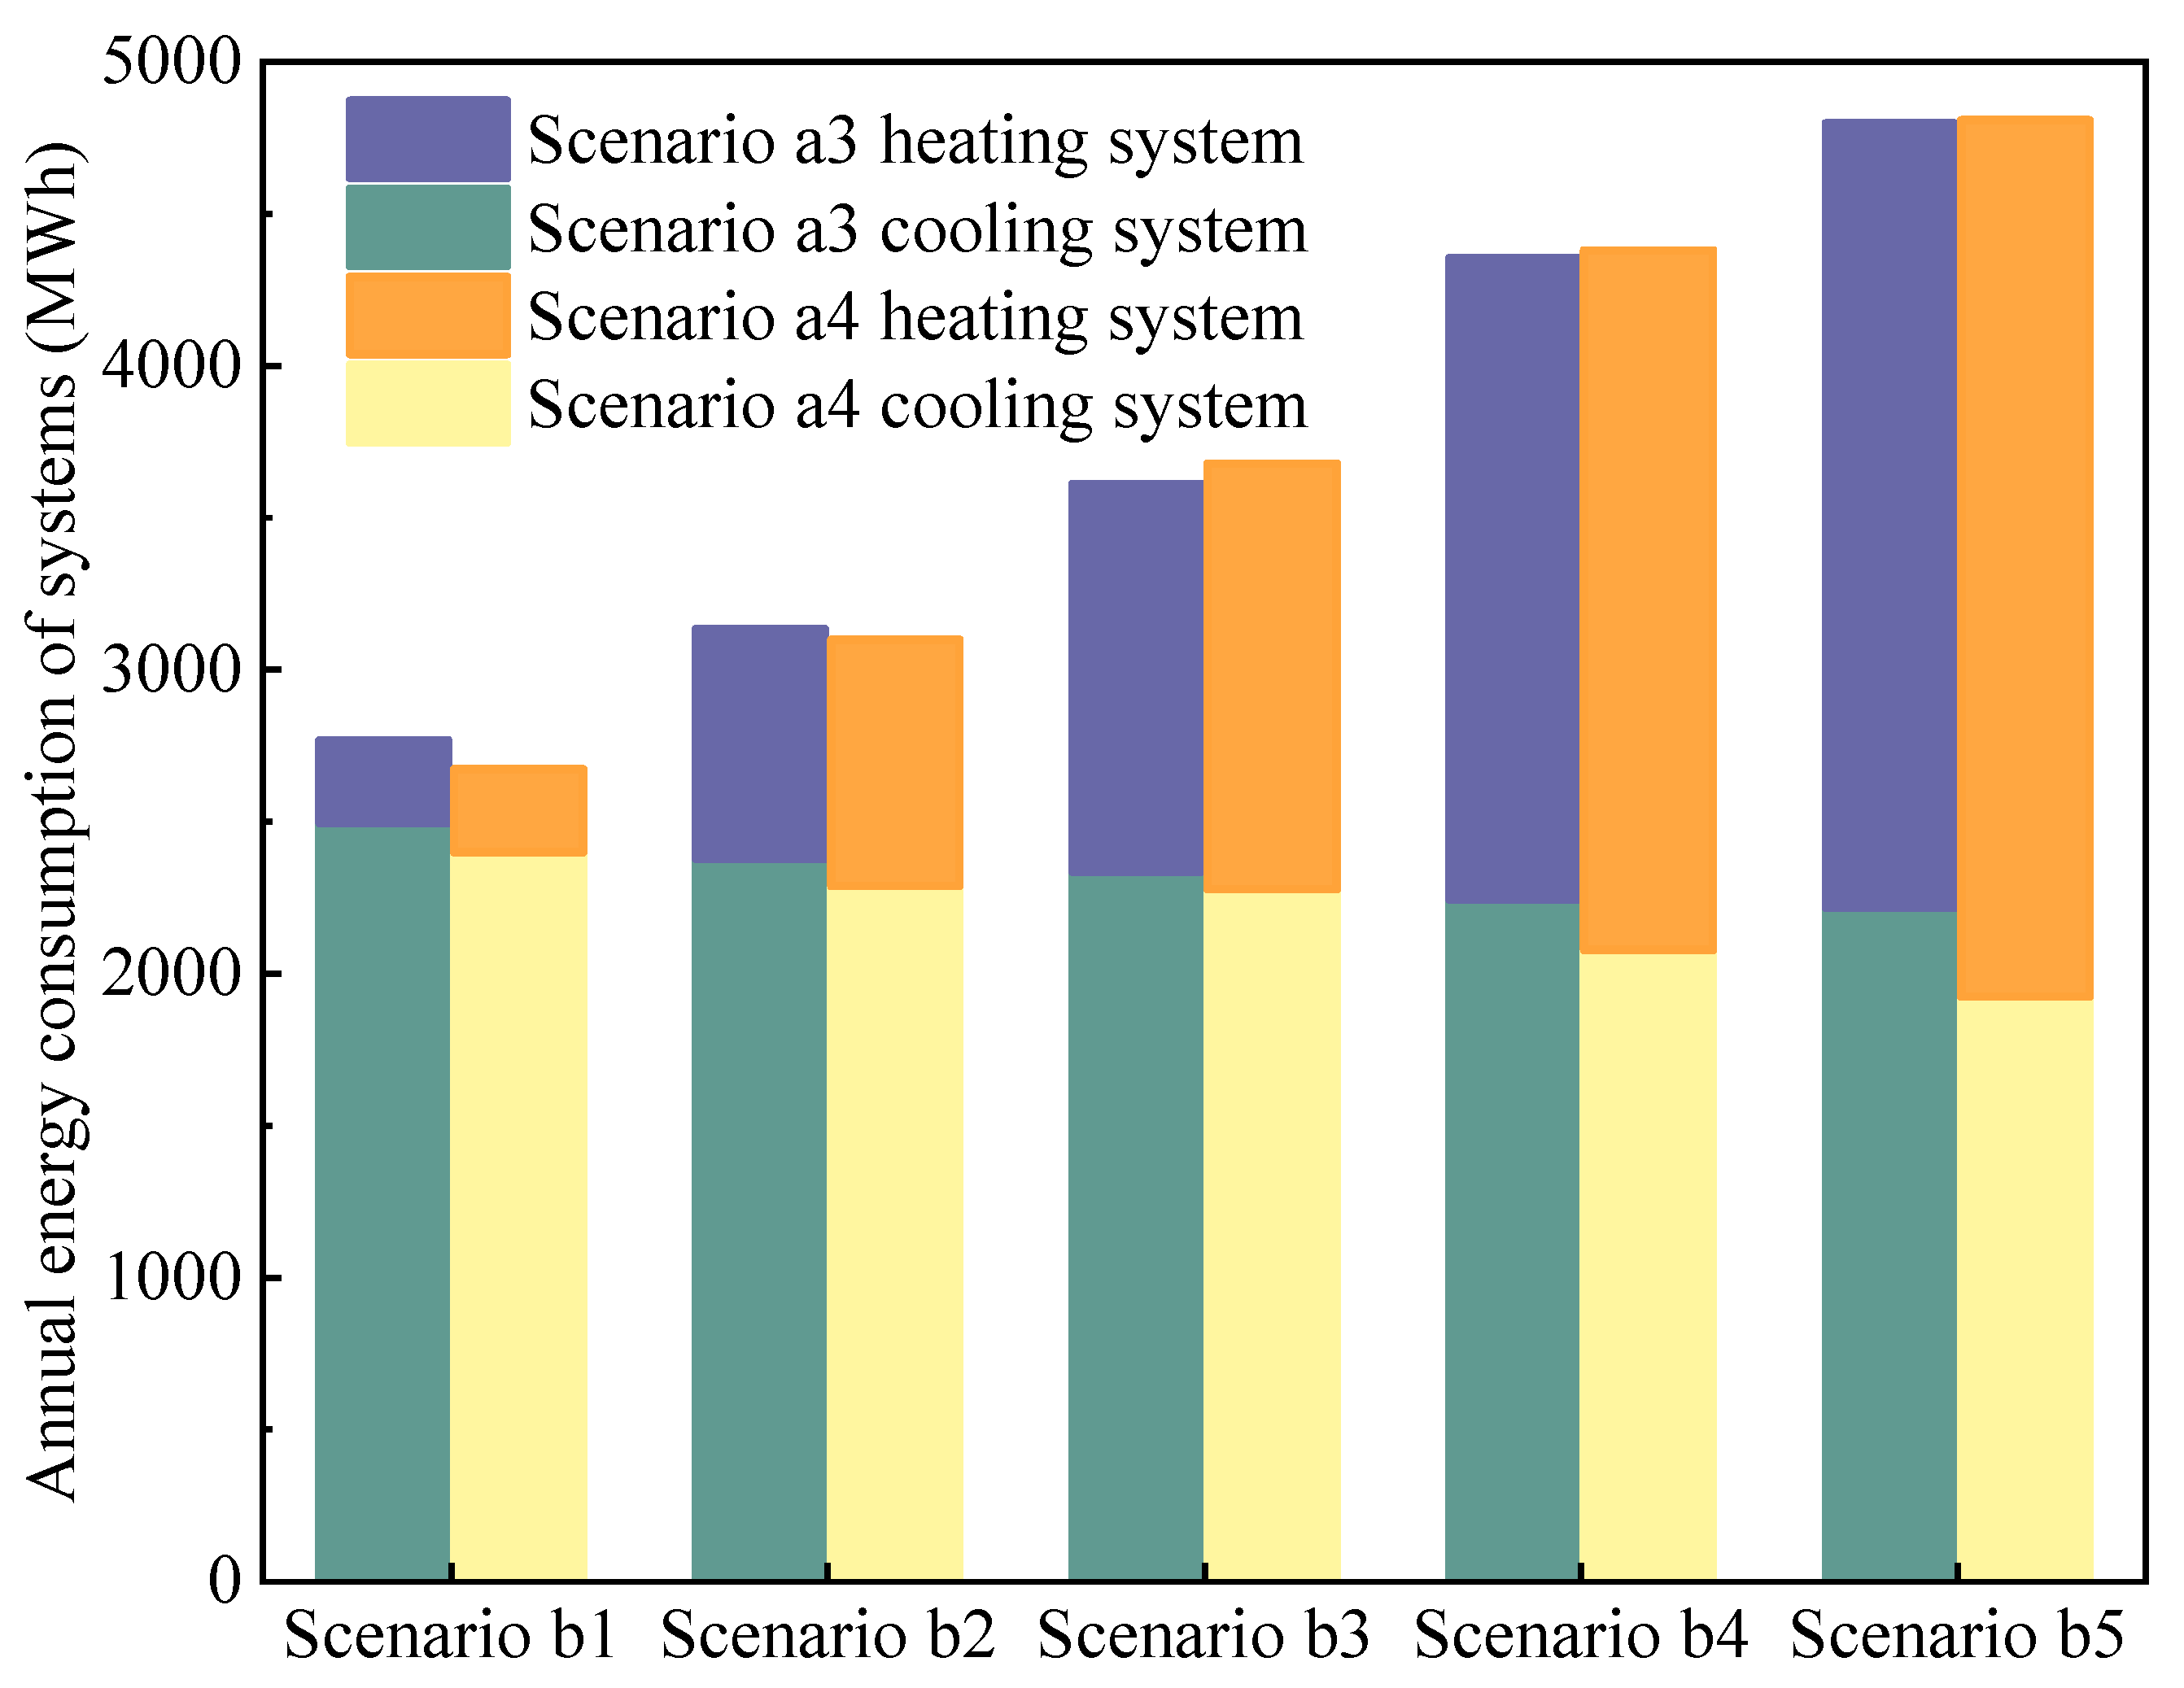
As previously discussed, in Scenarios a3 and a4, the interaction between the heating and cooling systems via HPs suggests that heat demand could influence the overall energy-saving rate and PUE. Therefore, it is imperative to investigate the impact of varying levels of waste heat recovery. To this end, five scenarios are formulated based on Scenarios a3 and a4. To maximize the utilization of waste heat and ensure that it fully covers the heat demands, the expansion is carried out based on the heating load of one hotel until the peak heat load equals the valley value of the DC cooling load. It is named 100% heat supply (Scenario b5). Subsequently, 10%, 30%, 50%, and 80% heat supply scenarios are derived based on the Scenario b5. These scenarios are labeled as b1 to b4.
The simulation results presented in Figure 6 demonstrate that, for the cooling system, there is a continuous decrease in cooling energy consumption and PUE in Scenarios a3 and a4 as the heat supply increases, with the latter consistently exhibiting lower values than the former. Specifically, compared to Scenario a1, when the heat supply escalates from 10% to 100%, the cooling energy consumption in Scenarios a3 and a4 is 2496 MWh to 2217 MWh and 2400 MWh to 1925 MWh, diminishing by 11.16% and 19.80%, respectively. Moreover, in Scenario b5, the PUE values are recorded as 1.19 and 1.17 for Scenarios a3 and a4, respectively. It means that the more heat is recovered from the return air of IT equipment and the chilled return water, the lower the energy consumption of the cooling system. Regarding the heating system, the analysis reveals that the heating energy consumption of Scenario a3 consistently outperforms that of Scenario a4. This discrepancy arises from the higher energy efficiency of WAHPs compared to ASHPs, even though the temperature of the return air of IT equipment is higher than that of chilled return water.

Figure 6.
Annual energy consumption of systems of different levels of waste heat recovery in Scenarios a3 and a4.
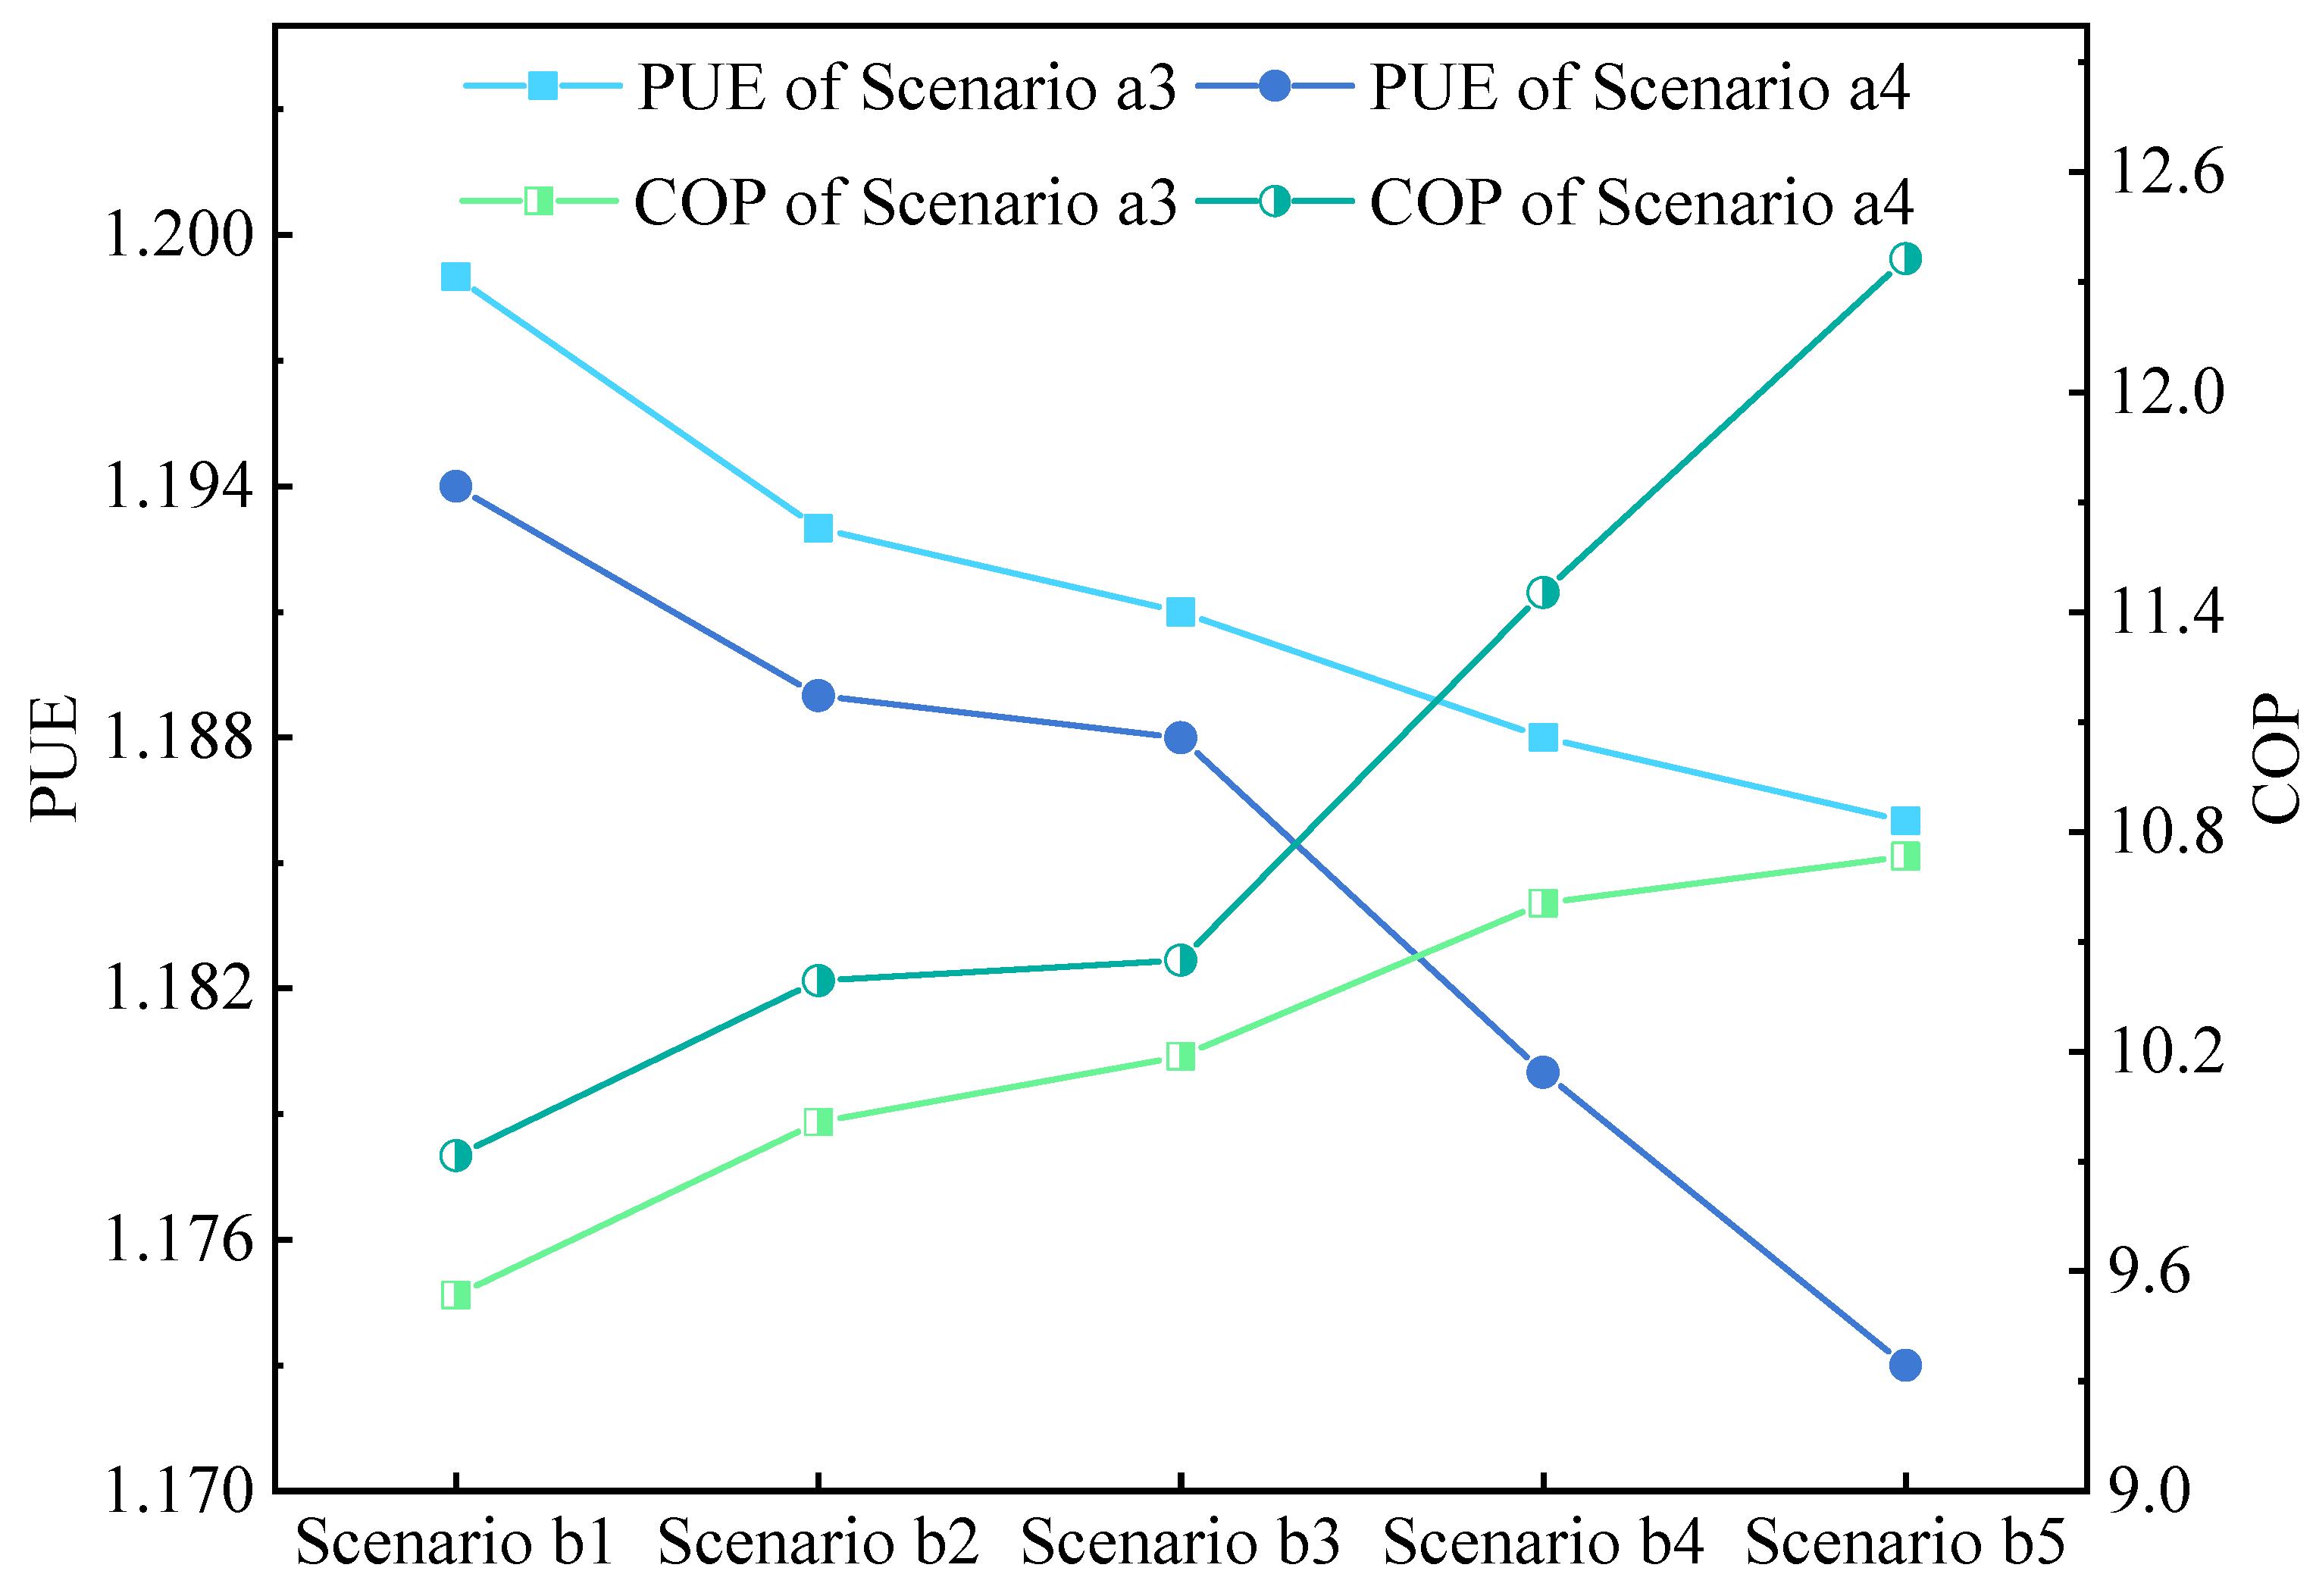
Figure 7 indicates the trends of the PUE and COP in Scenarios a3 and a4 at different levels of waste heat recovery, whether it is recovering waste heat from the chilled return water or return air of the IT equipment, with the enhancement of the degree of waste heat utilization and the implementer of the PUE and COP of the DC. Specifically, recovering waste heat from chilled water return can achieve an increase in the PUE from 1.199 to 1.186 and an increase in the COP from 9.54 to 10.73. The effect of recovering waste heat from the IT equipment return air is more significant. It can increase the PUE from 1.194 to 1.173 and the COP from 9.92 to 12.36.
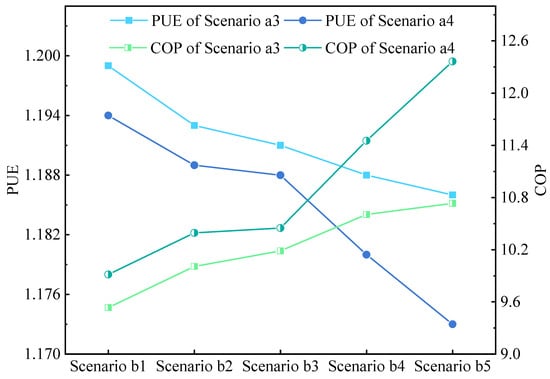
Figure 7.
PUE and COP of different levels of waste heat recovery in Scenarios a3 and a4.
Undoubtedly, the improvement of waste heat recovery level has enhanced the PUE and COP of the cooling system in the DC, and the economy of the cooling system has increased due to the reduction of operation and maintenance costs. However, the growth in heating volume leads to an increase in the initial investment cost of the heating system. Therefore, the impact of the game relationship between waste heat recovery to improve energy efficiency and higher investment costs on the economy of heating systems needs to be analyzed in depth in the future.
3.3. Comparative Analysis of Heat Extraction Methods
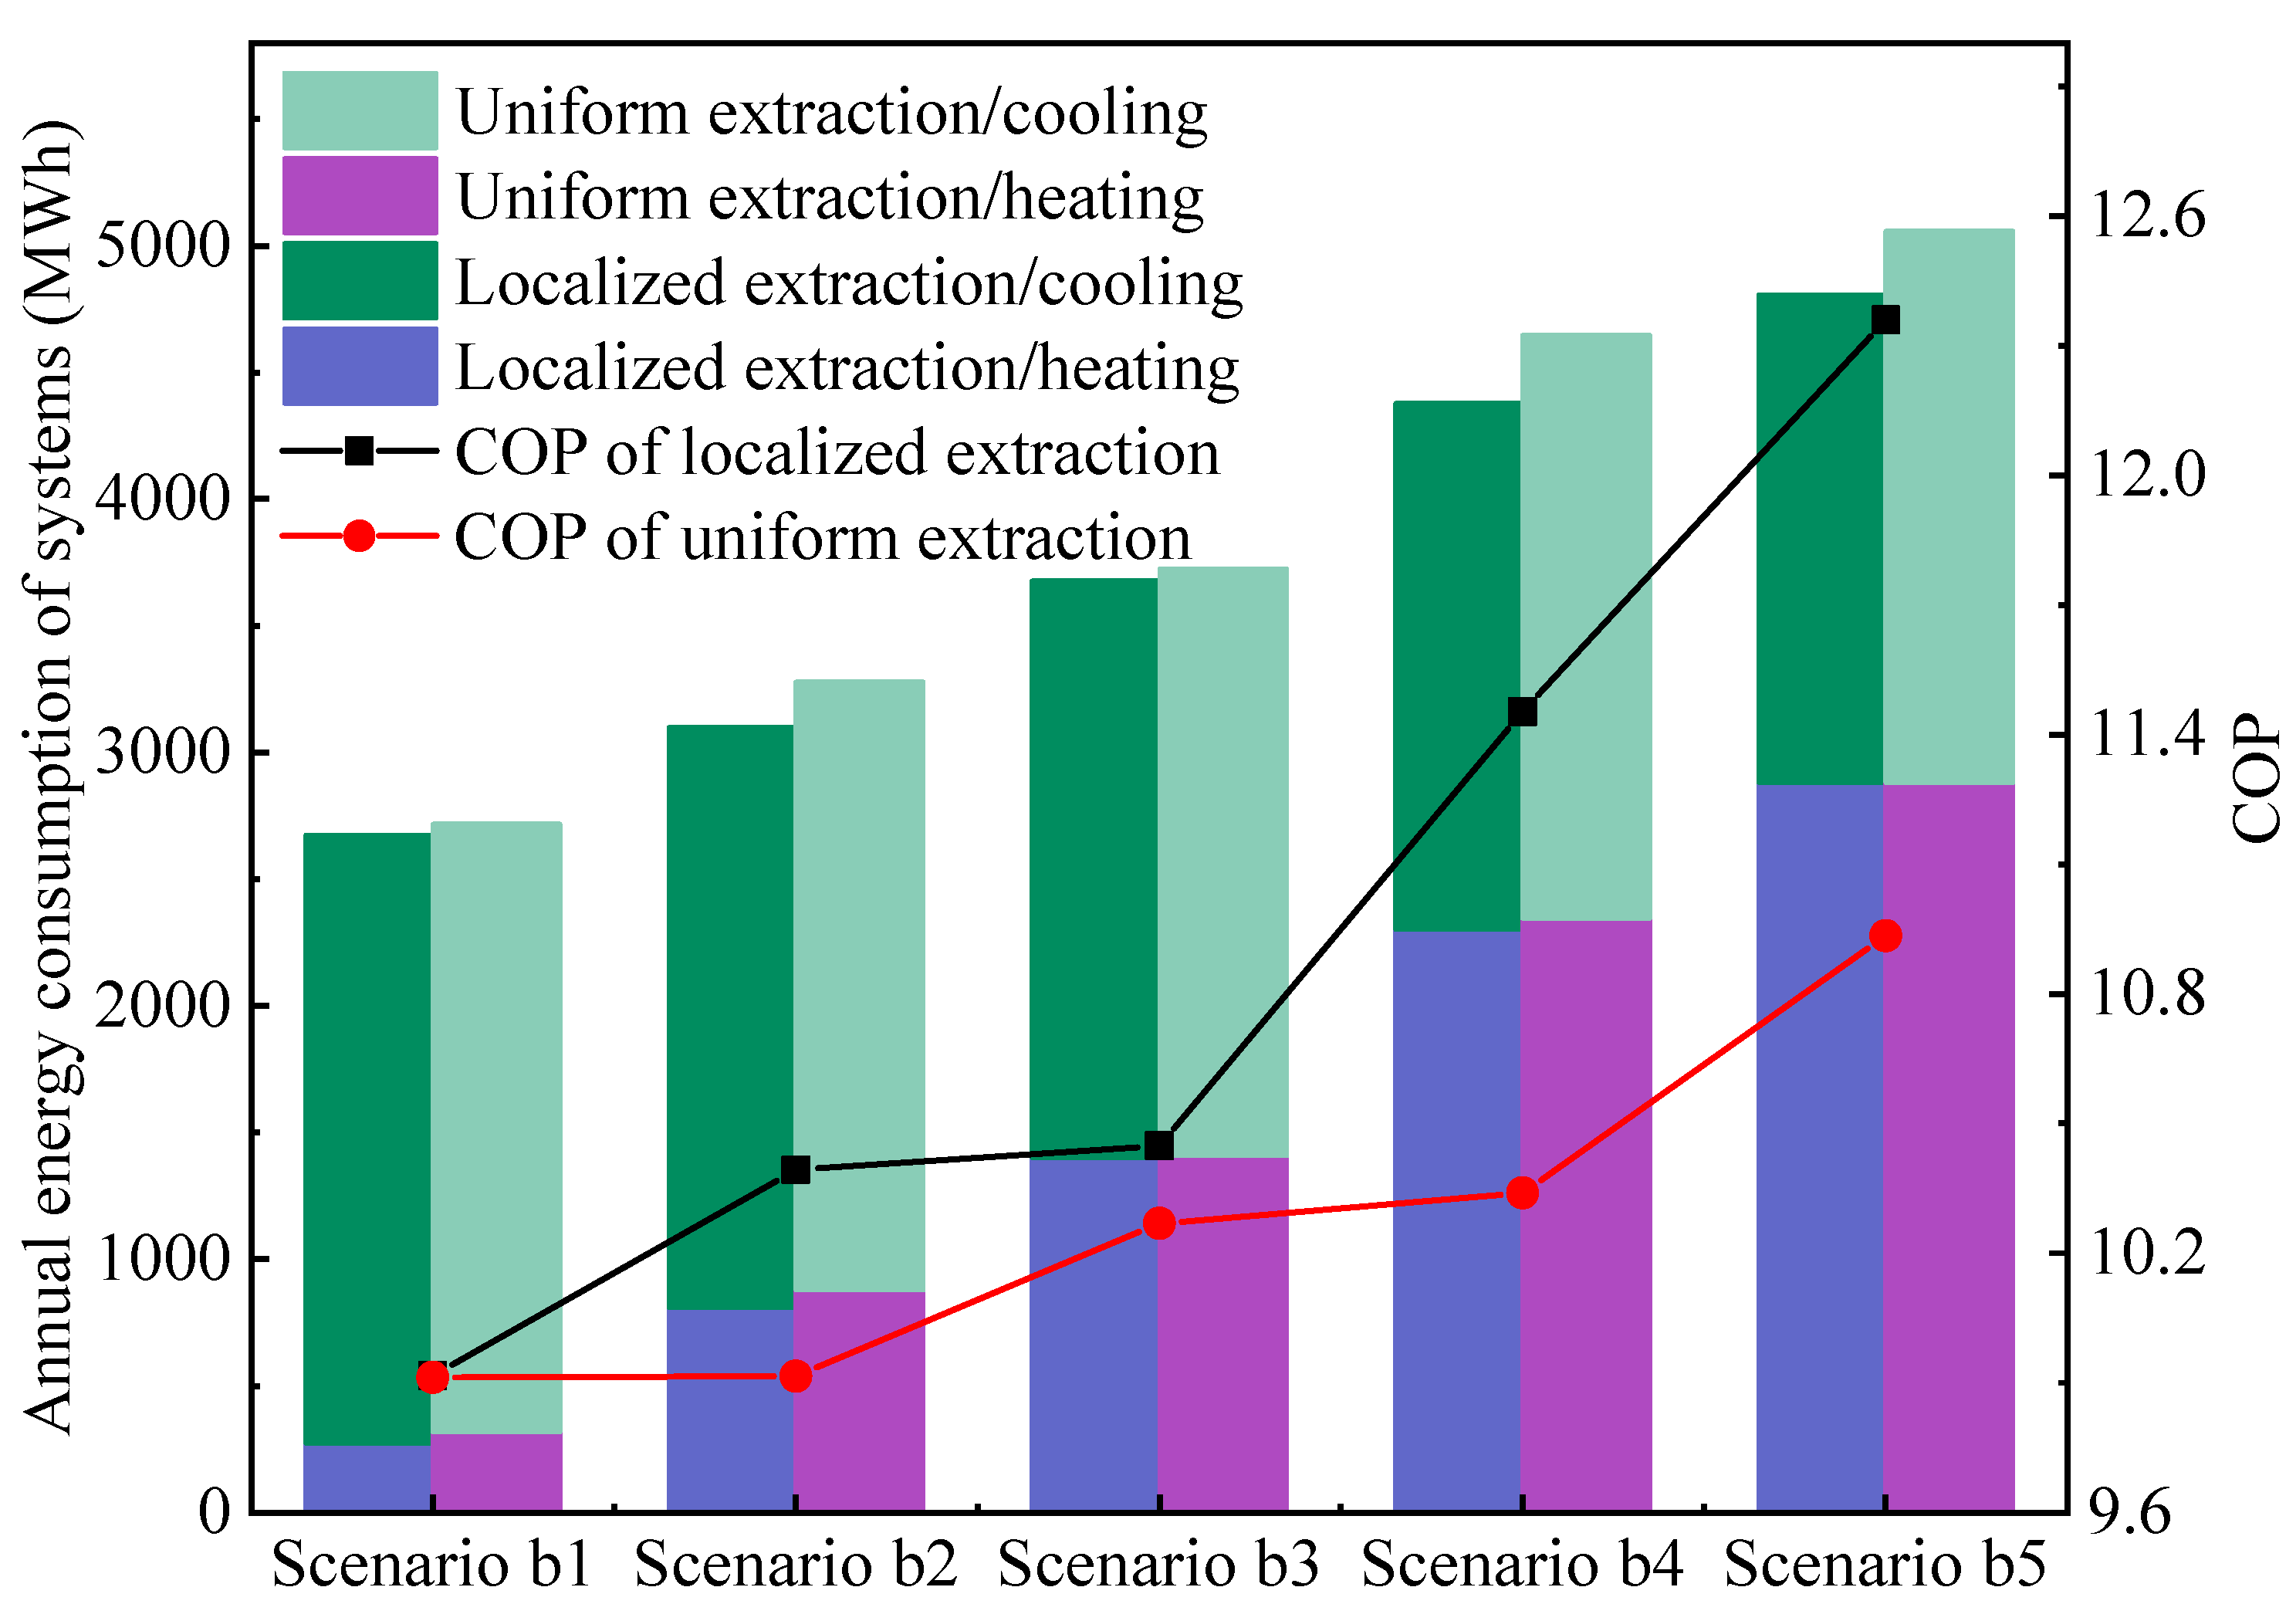
The heat extraction methods encompass two approaches: localized heat extraction and uniform heat extraction. Localized heat extraction (Scenario c1) involves the ASHPs evenly recovering waste heat from the air inlet of the partial CRAHs, and the number of ASHPs is determined based on the heating capacity of the building. Conversely, uniform heat extraction (Scenario c2) entails ASHPs recovering the same waste heat from the air inlet of all CRAHs (37 units). In this section, Scenario a4 serves as the focal point for examining the impact of heat extraction methods on system energy consumption.
As depicted in Figure 8, under the two heat extraction methods, as the waste heat recovery level increases, the heating system’s energy consumption becomes higher due to the growth amount of the heating. The energy consumption of the DC cooling system drops continuously. For the same heating demand, the cooling and heating energy consumption of Scenario c1 is lower than that of Scenario c2. Therefore, localized heat recovery of IT equipment waste heat will achieve a higher COP. From a heating perspective, the system performance coefficient is higher in the case of localized heat extraction, attributable to the larger capacity and higher load rate of the ASHP units. Compared with localized heat extraction, uniform heat extraction is a multi-unit group control regulation, which subjects to the weaknesses such as small unit capacity, low overall performance coefficient, and low operating load. Consequently, the energy-saving rate of Scenario c1 at Scenario b1 surpasses that of Scenario c2, amounting to 13.8%.

Figure 8.
Annual energy consumption of systems and COP for localized and uniform heat extraction methods.
For the uniform heat extraction method, all ASHPs need to operate with unified control. However, when extracting heat locally, it is necessary to control the ASHPs separately according to the heating load, and the control logic is complex. For economic performance, when the heating system adopts the localized heat extraction method, ASHPs work alternately, resulting in lower equipment maintenance costs. Figure 8 indicates that the uniform heating method brings more significant energy-saving effects to the cooling and heating systems. Therefore, the maintenance cost of uniform heating is lower, and so is the lifecycle cost. It is worth noting that the recovery of waste heat from IT equipment requires the addition of air ducts, which may potentially affect its thermal environment. Therefore, the potential trade-off between the improvement of energy efficiency and increased system complexity needs to be considered.
3.4. Analysis of Energy-Saving Effect of System Parameters
In this section, the impact of key parameters on the energy-saving potential of the DC lake water cooling coupled with a chilled water return waste heat recovery system is investigated (Scenario a3). These crucial parameters, which can significantly influence the system’s performance, include the chilled water supply temperature, the air supply temperature in the server rooms, and the volume of the storage tank.
3.4.1. Analysis of Chilled Water Supply Temperature
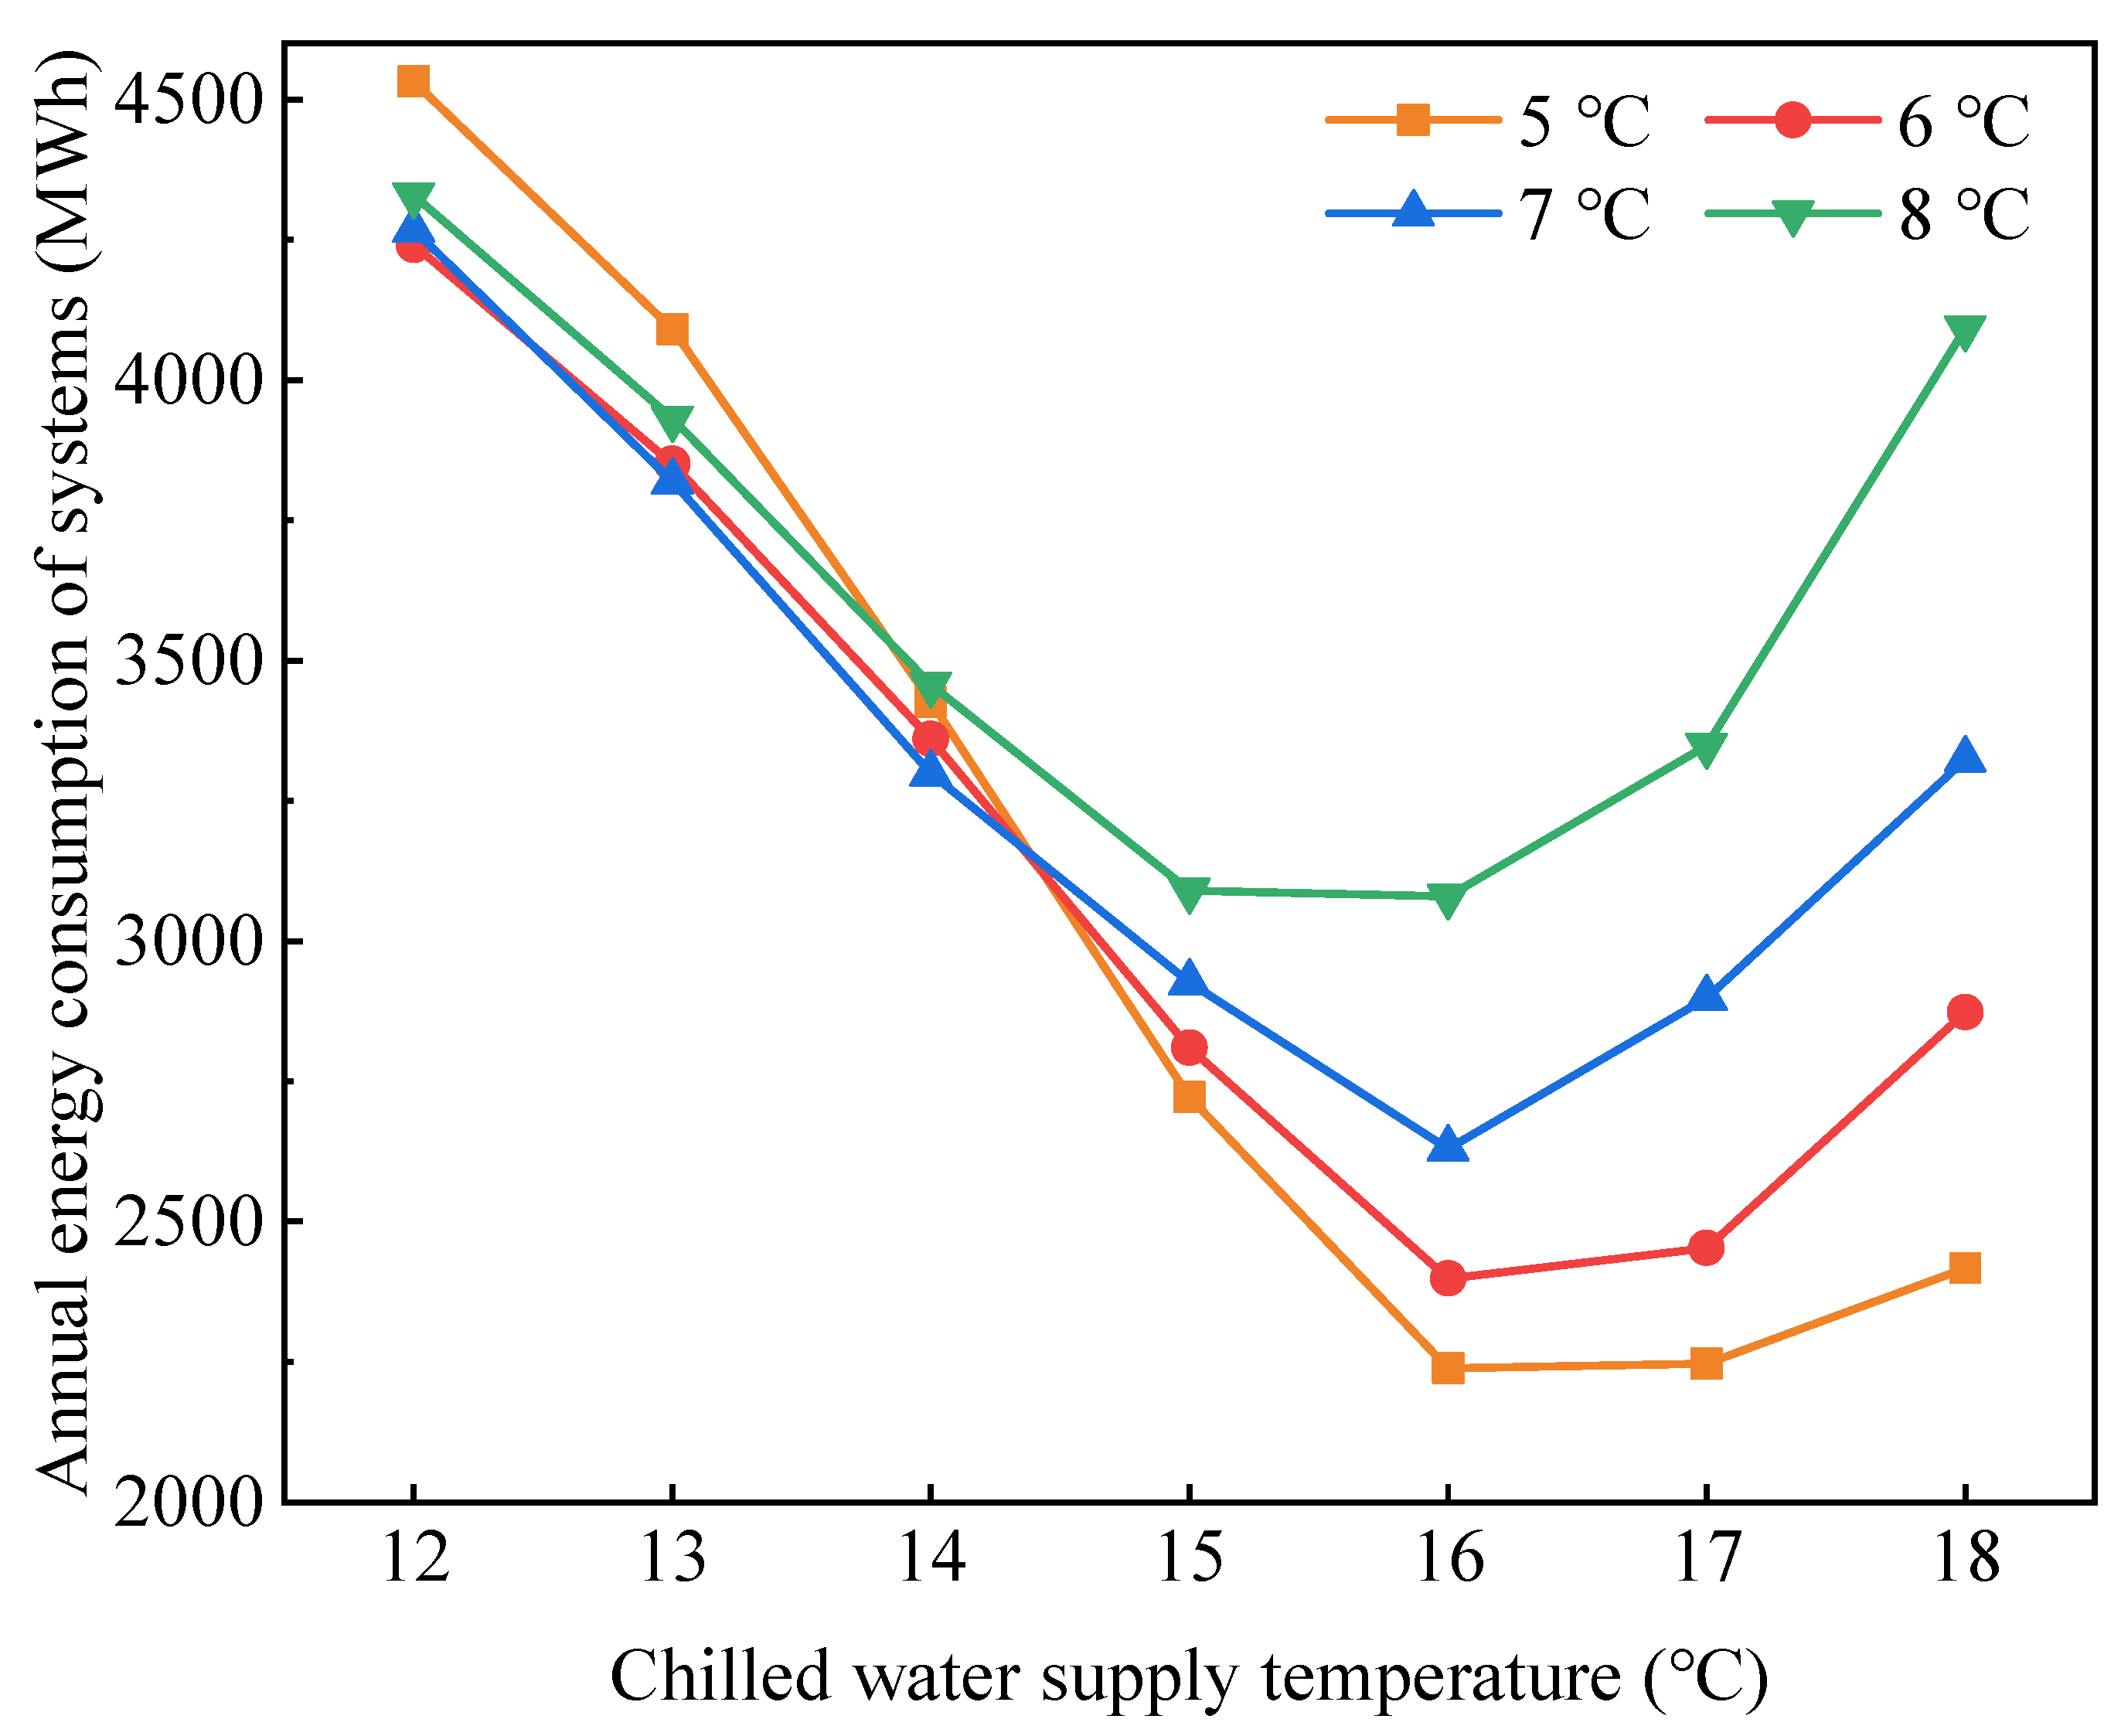
This paper conducts simulations of the system’s energy consumption under seven distinct working conditions, with chilled water supply temperatures set at 12, 13, 14, 15, 16, 17, and 18 °C. Additionally, the temperature difference between the air supply and chilled water supply in the server rooms is varied across 5, 6, 7, and 8 °C. The simulation results, depicted in Figure 9, reveal a discernible trend: under four temperature differences, the system’s energy consumption initially decreases with rising chilled water supply temperature before subsequently increasing. Properly raising the supply temperature of the chilled water can reduce the carbon emissions caused by the energy consumption of the system. Notably, the energy consumption of the system reaches its minimum at 16 °C. When the chilled water supply temperature is low, the reduction in energy consumption of the lake water pump and mechanical refrigeration predominates. Conversely, when the chilled water supply temperature is high, the increase in energy consumption of the chilled water pump and fans assumes a pivotal role. Therefore, appropriately raising the supply temperature of the chilled water reduces the operational costs of the system, but excessively high chilled water has a negative impact on the economy.
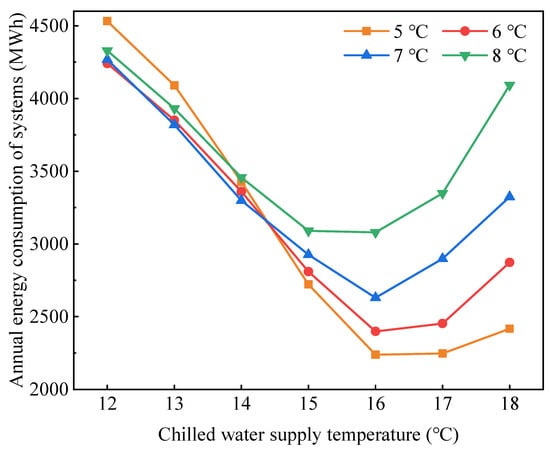
Figure 9.
Annual energy consumption of systems with chilled water supply temperature under different temperature differences.
3.4.2. Analysis of the Air Supply Temperature in the Server Rooms
Based on the preceding analysis, the chilled water supply temperature is established at 16 °C. However, owing to the limited heat exchange capacity of the CRAHs, setting the temperature difference between the supply air and chilled water supply in the computer room too low should be avoided. Consequently, the temperature difference is explored across seven operating conditions, spanning 4, 5, 6, 7, 8, 9, and 10 °C. It is essential to note that the maximum allowable temperature in the server room is capped at 35 °C. The results, illustrated in Figure 10, reveal a notable trend: as the temperature difference increases, heating energy consumption undergoes a slight decrease, while that of the cooling system experiences significant increments. This has led to a significant increase in total energy consumption, which hurts the economy and the environment.
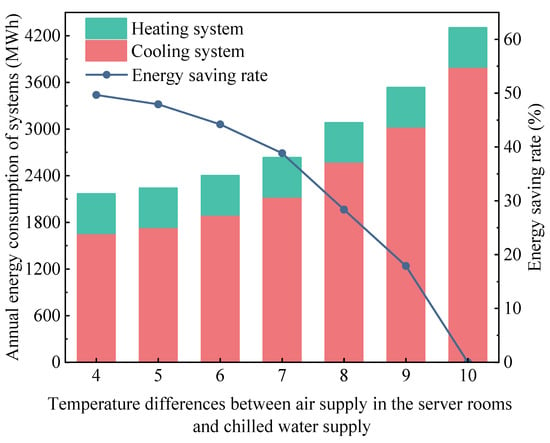
Figure 10.
Annual energy consumption of systems and saving rate under different temperature differences between air supply in the server rooms and chilled water supply.
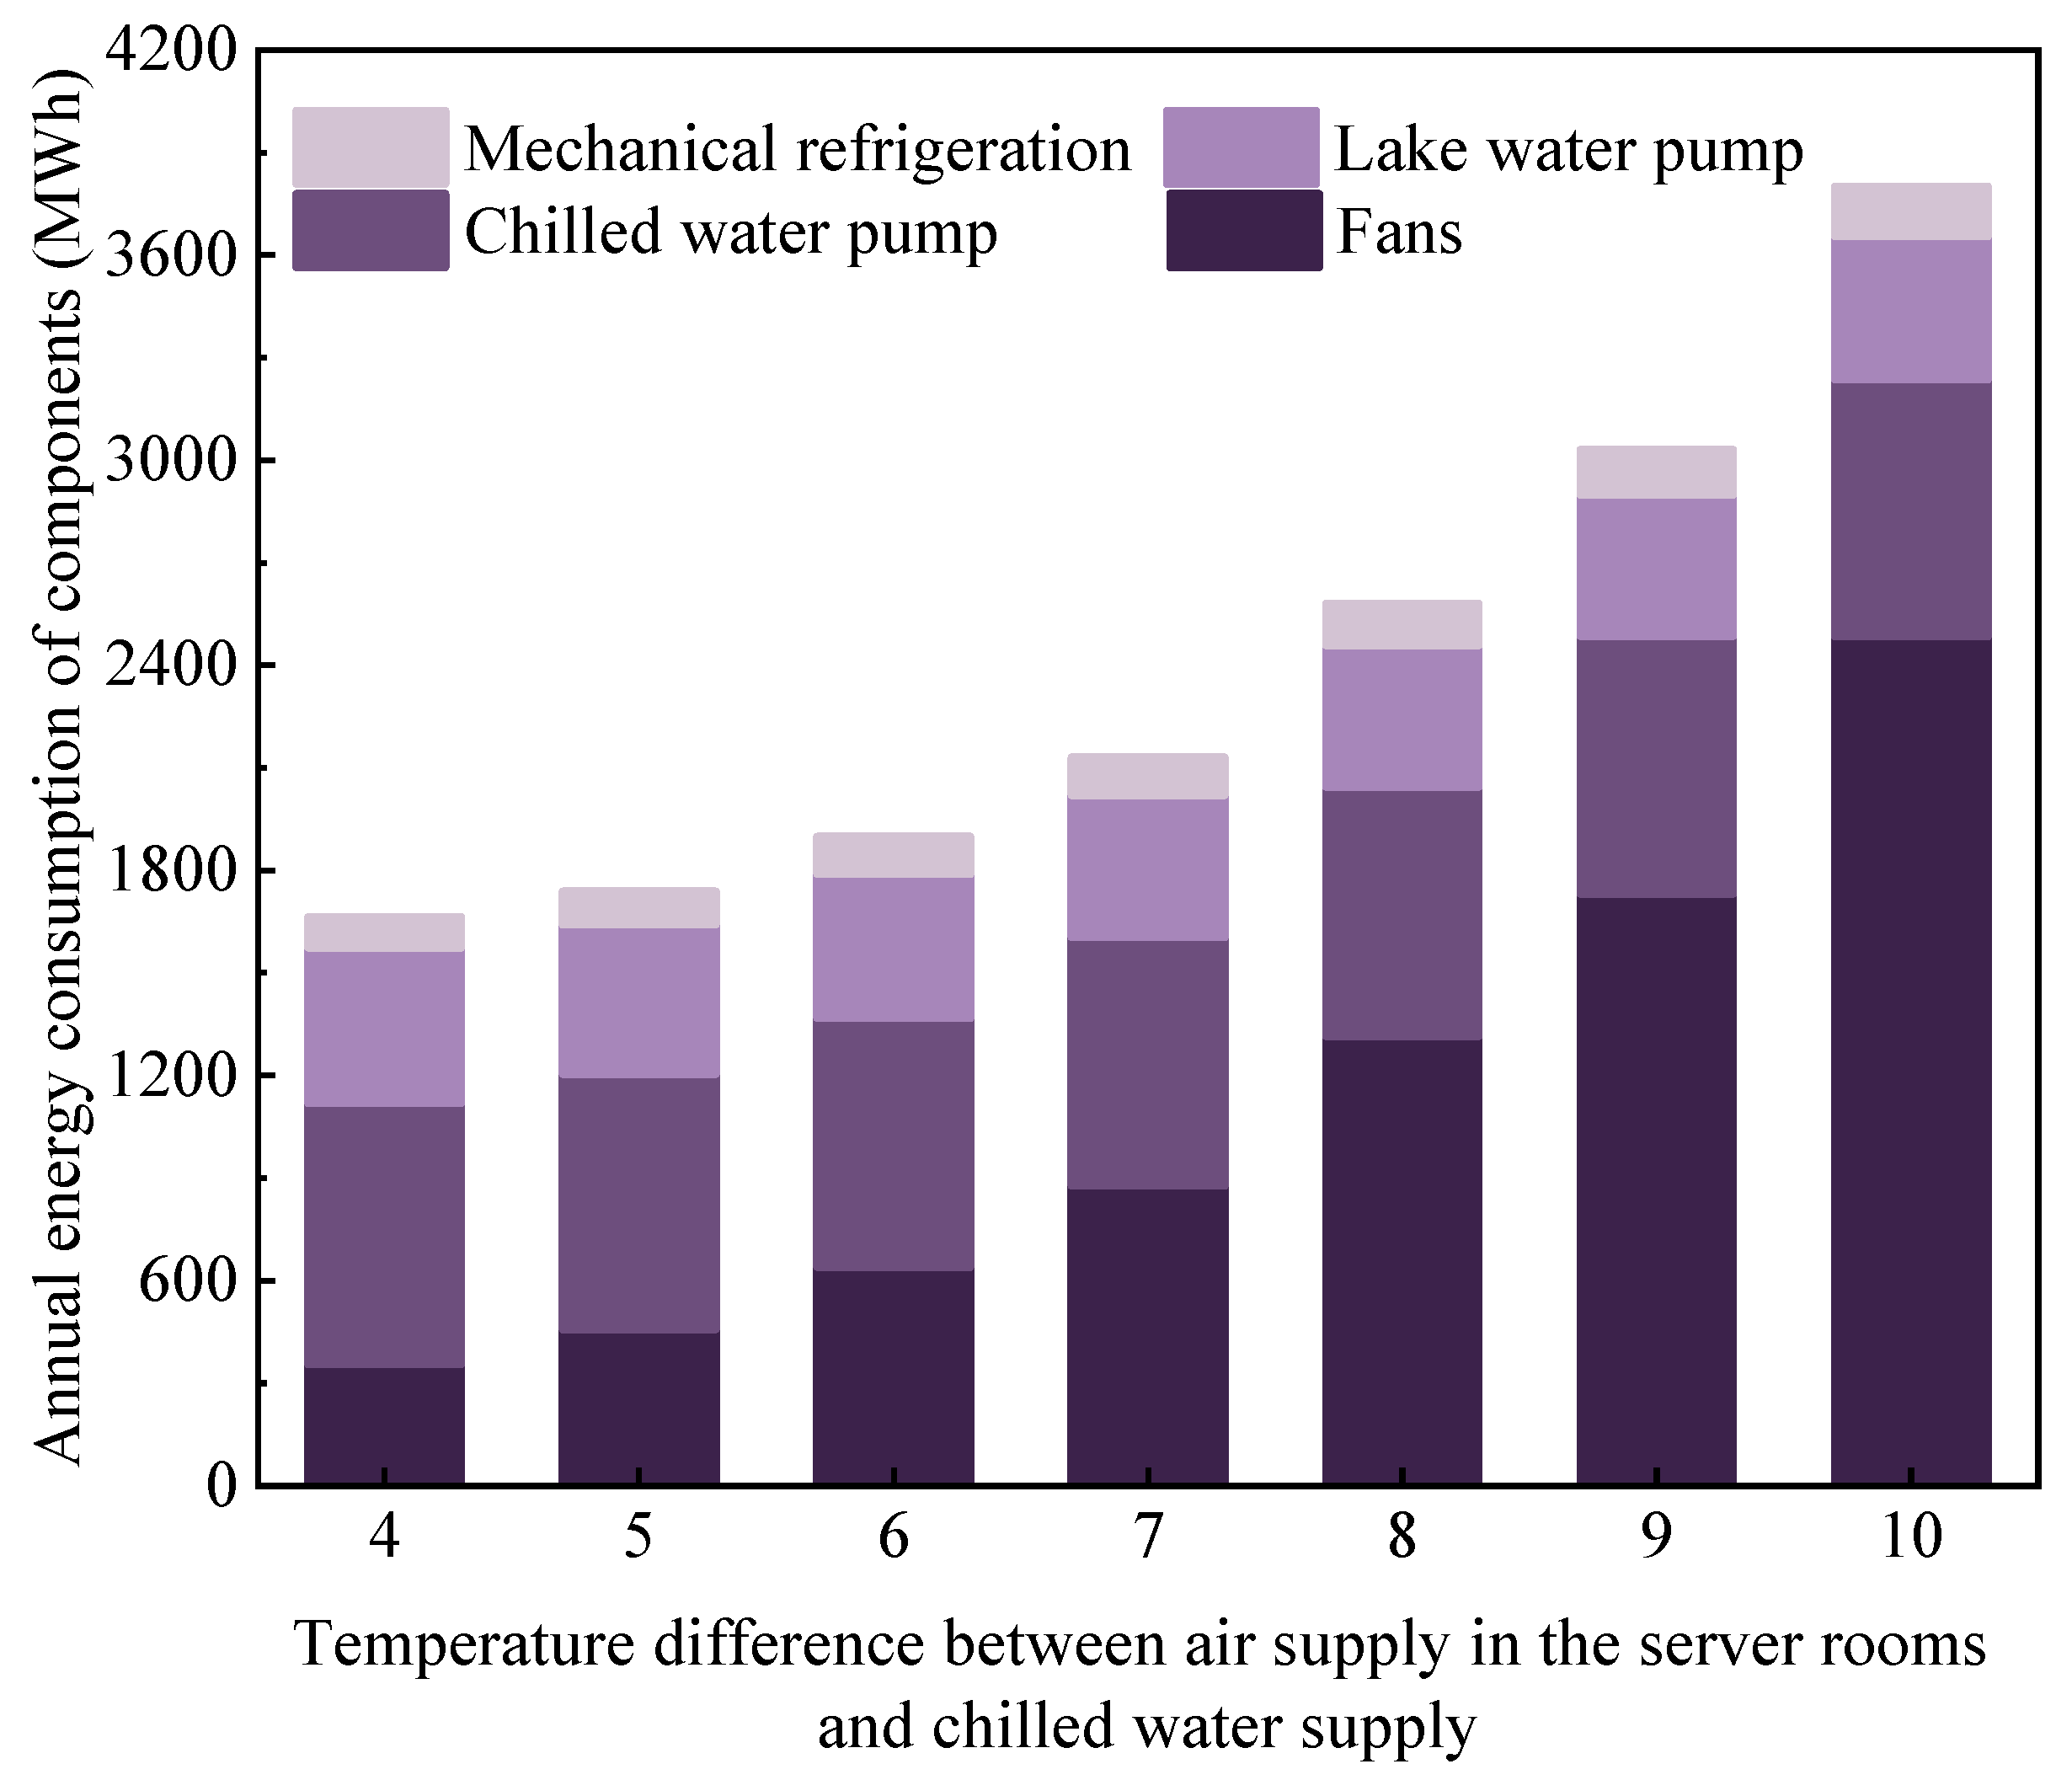
Figure 11 provides insights into the energy consumption of the components of the cooling system. As the temperature difference setting value escalates, there is a noticeable surge in the proportion of the fans’ energy consumption, consequently driving an upward trajectory in the total energy consumption of the system. Notably, as the temperature difference setting value increases from 4 °C to 10 °C, the proportion of the fans in total energy consumption rises from 16.47% to 57.78%. Remarkably, the energy-saving rate of the system with a 4 °C temperature difference compared to a 10 °C temperature difference reaches 49.66%.

Figure 11.
The energy consumption of components of the cooling system under different temperature differences between the air supply in server rooms and the chilled water supply.
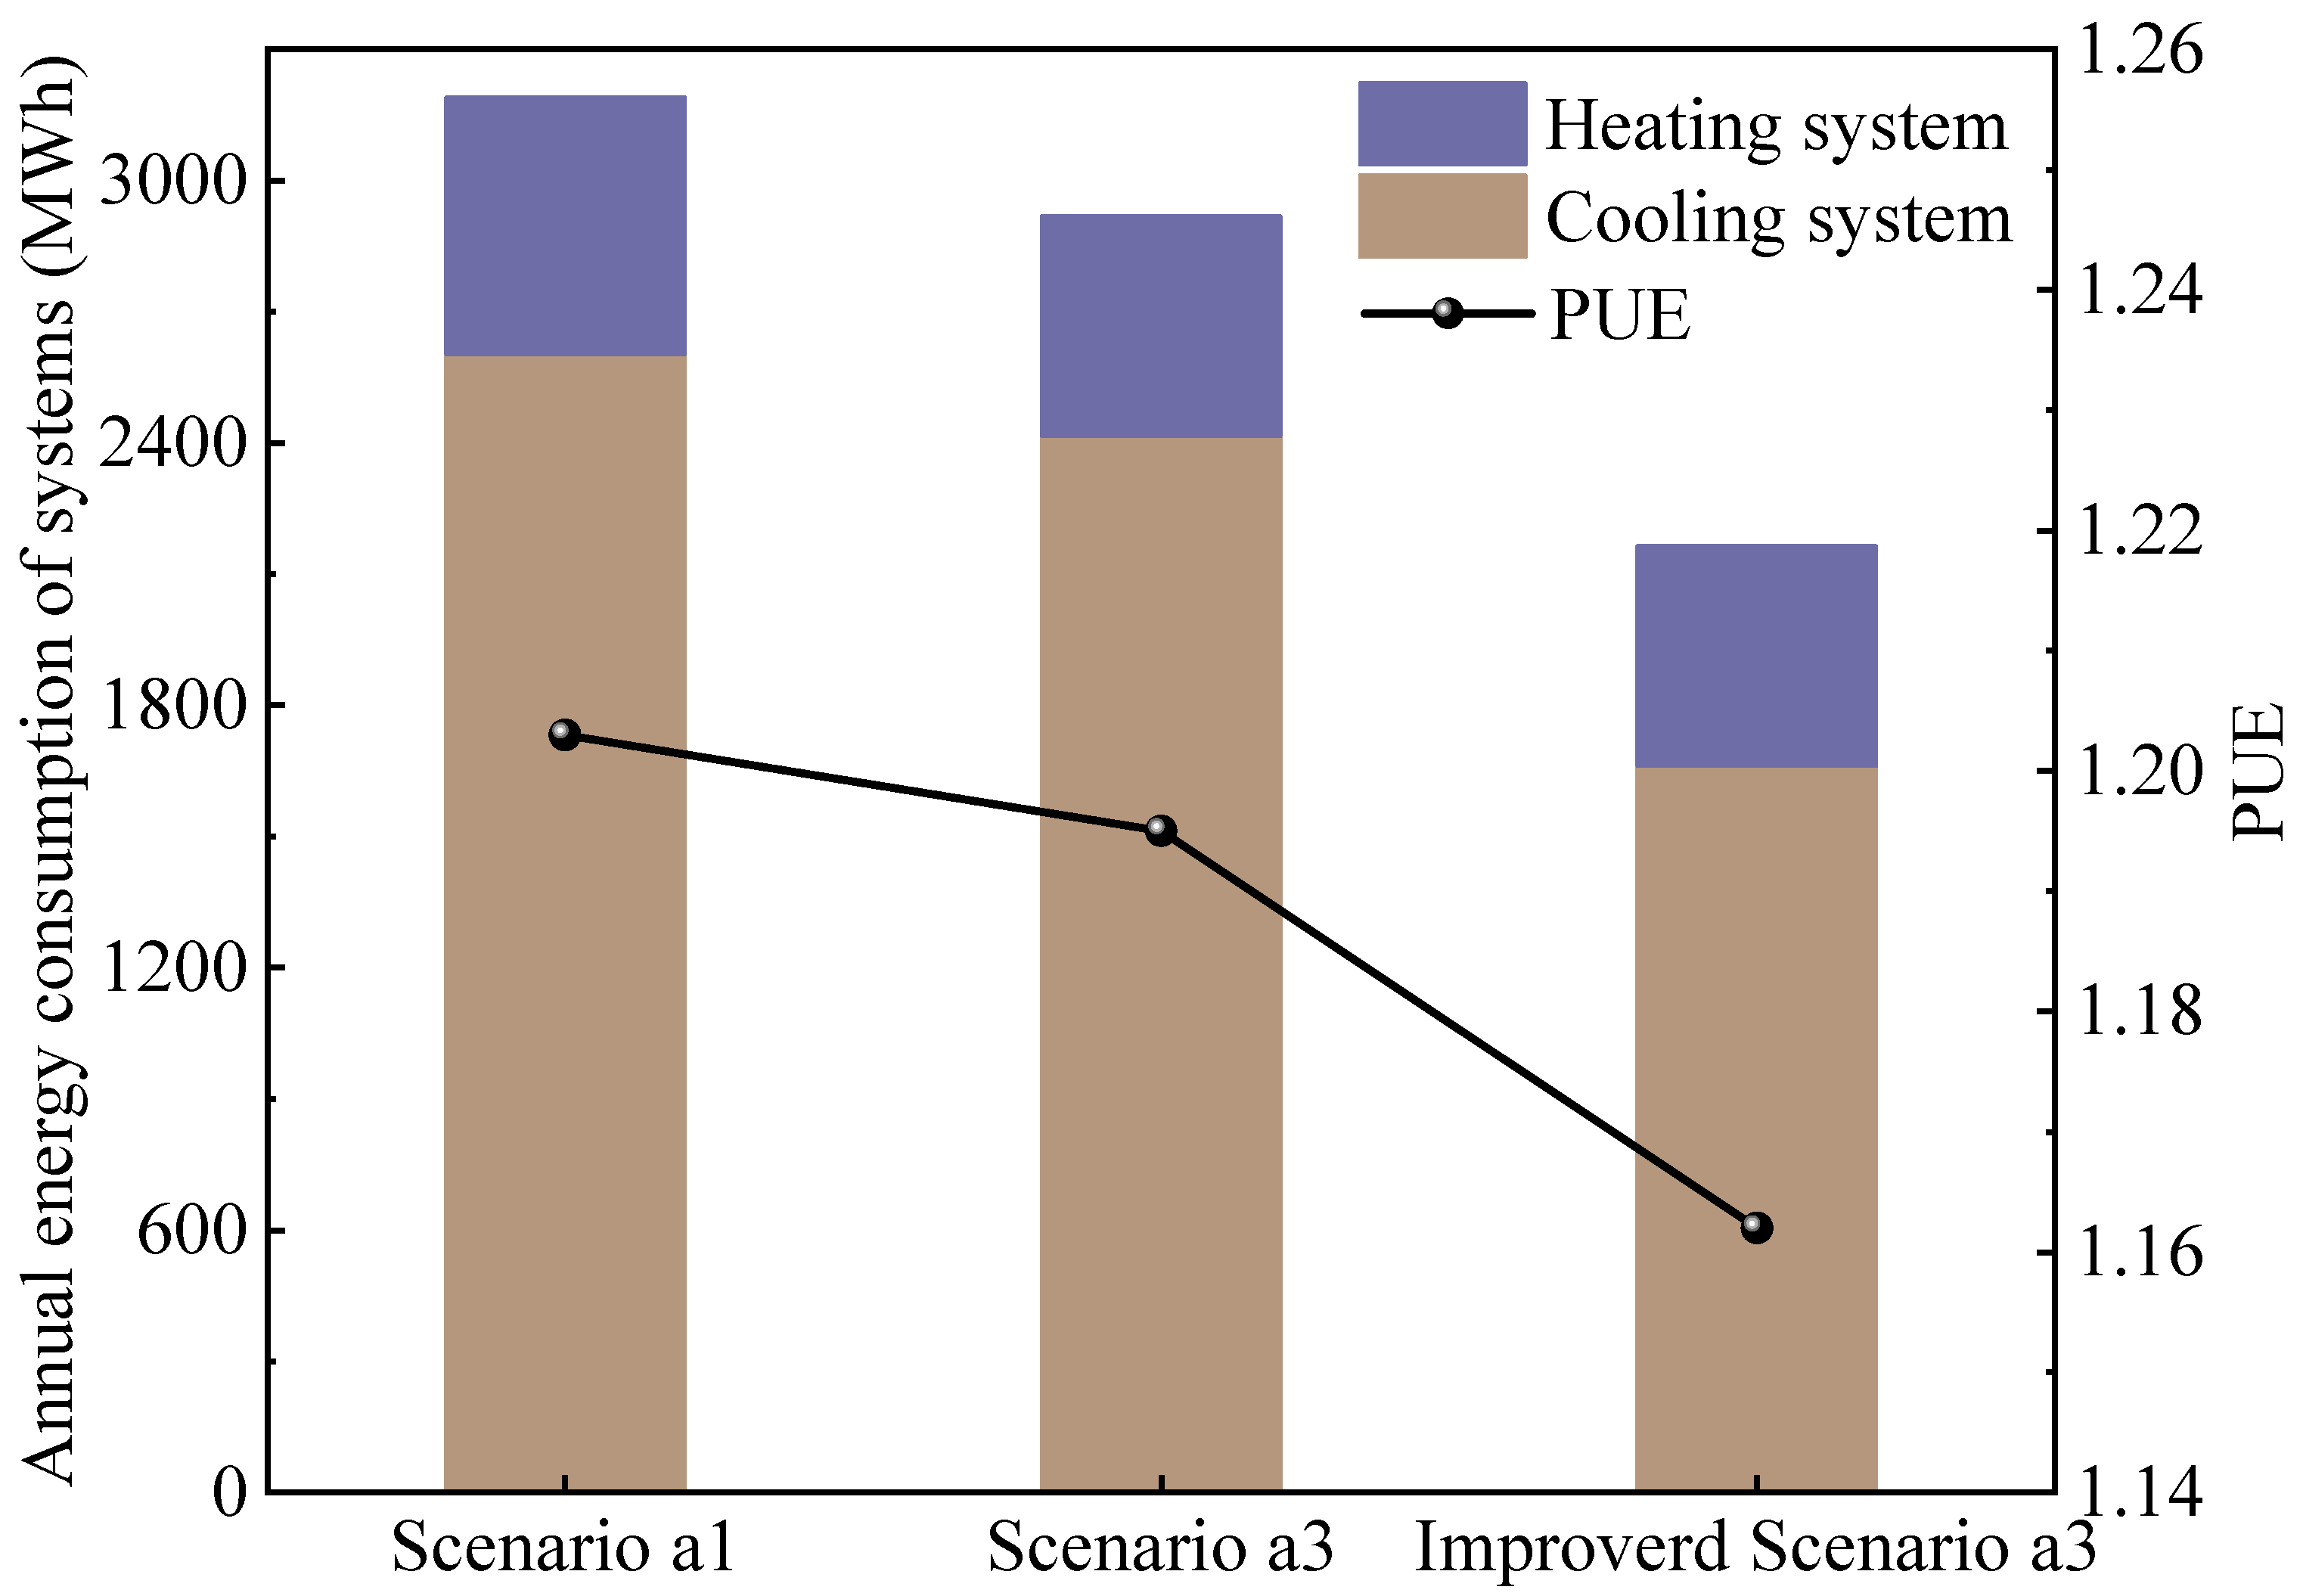
Figure 12 presents a comparison of system energy consumption and PUE between Scenario a1 and Scenario a3 before and after improvement. The chilled water supply temperature and air supply temperature for Scenarios a1 and a3 are 15 °C and 22 °C, respectively, while that for the improved Scenario a3 are 16 °C and 20 °C. Specifically, the total energy consumption of the improved Scenario a3 amounts to 2164 MWh. Comparatively, the energy-saving effect is pronounced, with the total energy-saving rate of the system reaching 26.05%. The reason is that the energy consumption of the fans and mechanical cooling has significantly dropped. The energy consumption of the fans in the improved Scenario a3 is only 55.71% of that in Scenario a3, and the duration of free cooling operation sees a notable improvement, increasing from 5144 h to 8083 h. It greatly drops the operating costs of the system and improves environmental benefits. However, the reduction in heating energy consumption is tiny, mainly due to the small amount of waste heat recovery, and the improvement of the operating parameters has little impact on heating energy consumption. Additionally, the PUE is reduced from 1.20 to 1.16, facilitating the green development of the DC.
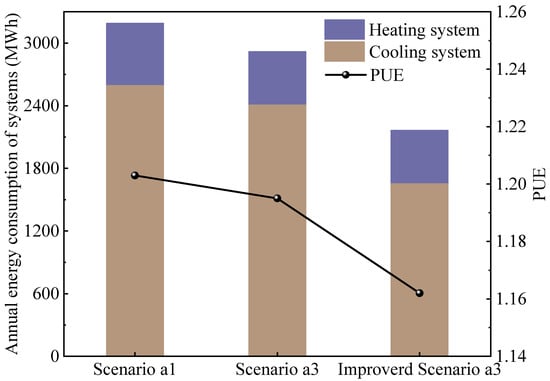
Figure 12.
Annual energy consumption of systems and PUE of Scenario a1 and Scenario a3 before and after improvement.
3.4.3. Analysis of the Volume of the Storage Tank
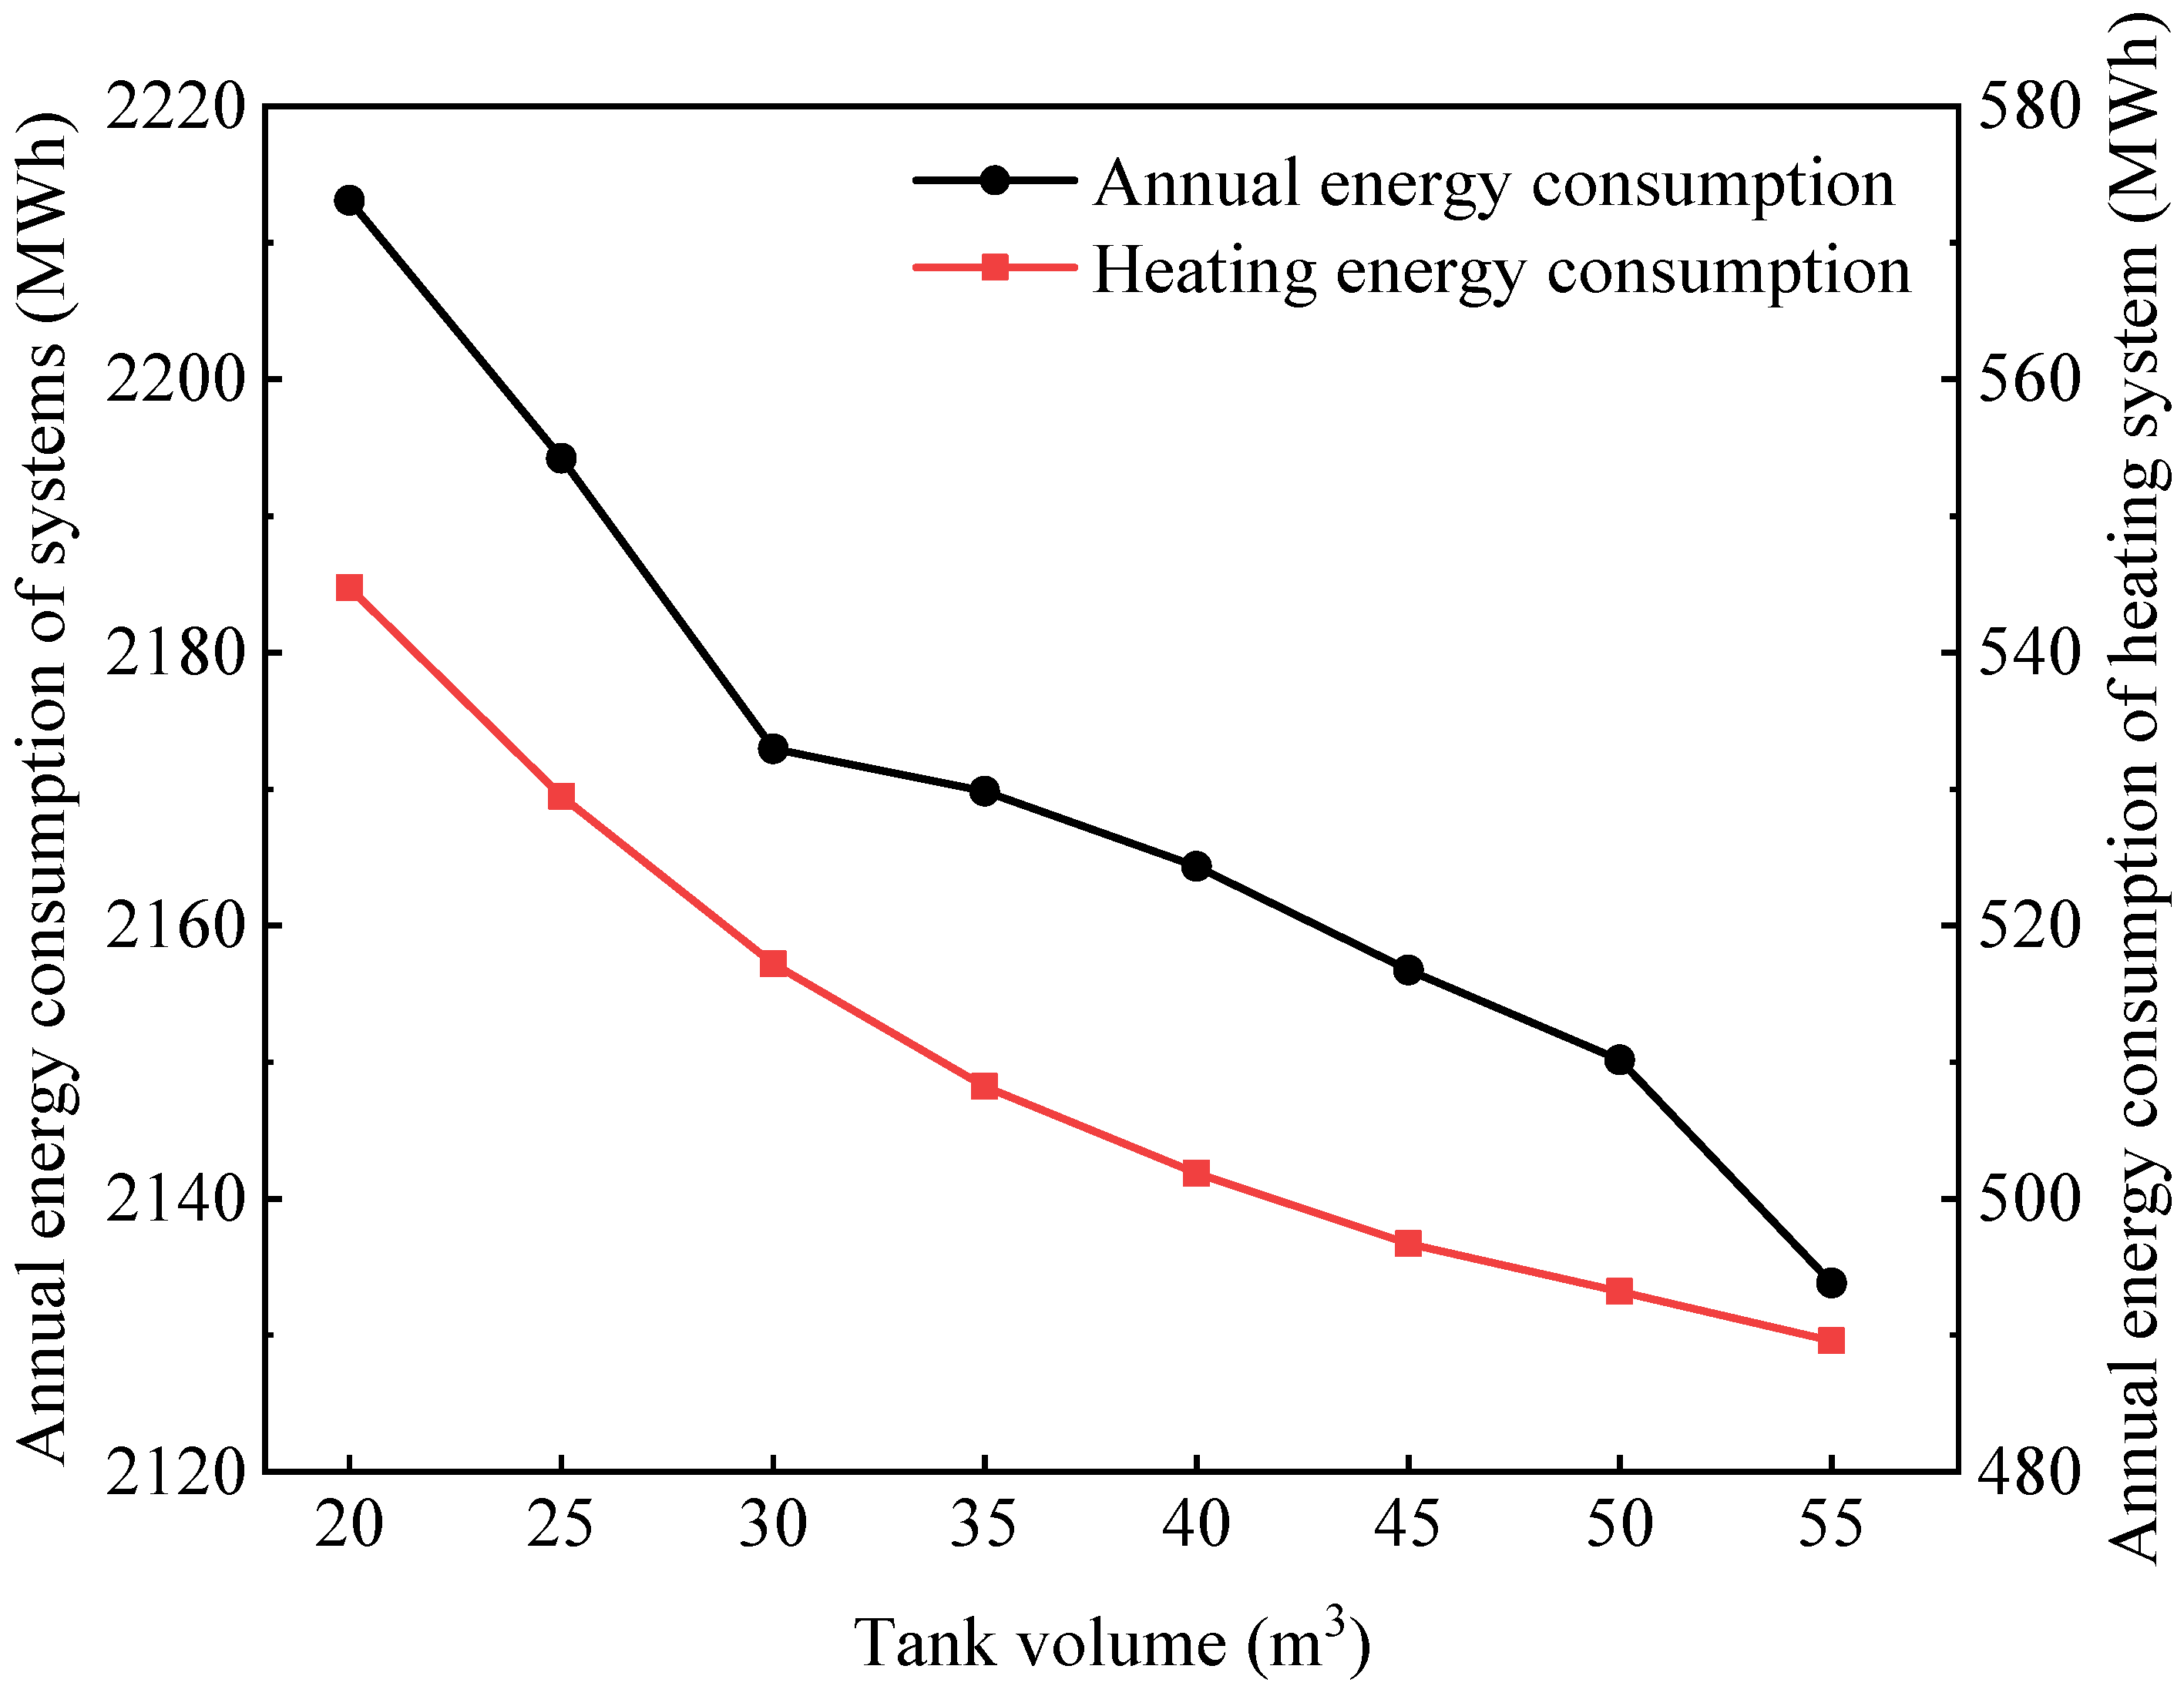
This section simulates the energy consumption of the system across eight conditions of water tank volume: 20, 25, 30, 35, 40, 45, 50, and 55 m3. The chilled water supply temperature is set to 16 °C, while the air supply temperature of the server rooms is set to 20 °C. The results, illustrated in Figure 13, reveal a notable trend: as the volume of the water tank increases, the total energy consumption of the system experiences a significant reduction. A water tank serves as a buffer and stores heat. The load characteristics of the heating system exhibit certain fluctuations, and the ASHP may often be in a low energy efficiency state. The presence of the water tank weakens the negative influence caused by this inherent characteristic, improves equipment efficiency, and reduces energy consumption. As the volume of the water tank increases, this effect becomes more significant, so the energy consumption of the system becomes more diminished. Specifically, as the volume increases from 20 m3 to 55 m3, the total system energy consumption decreases by 3.58%, with heating energy consumption showing a reduction of 10.13%. It is essential to highlight that while a larger water tank volume contributes to smoother system operation and decreased energy consumption, it also entails increased initial investment costs for the system.
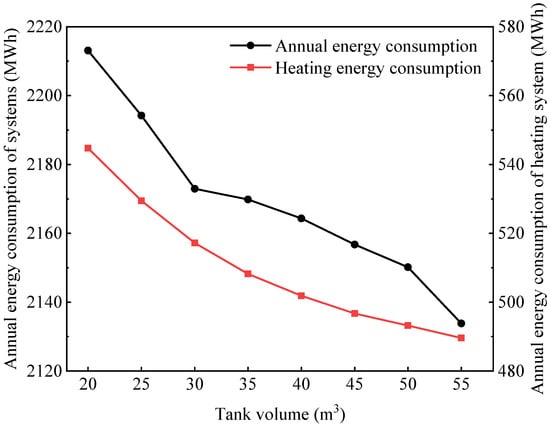
Figure 13.
The annual energy consumption of systems with different volumes of the water tank.
4. Conclusions
This study introduced an integrated system that combines lake water cooling and waste heat recovery for DCs and revealed the impact of the waste heat recovery location, volume, and the heat extraction method on overall system performance. Furthermore, the study examines potential system parameter enhancements aimed at further improving system efficiency. The main conclusions are as follows:
- (1)
- The scenario where the waste heat recovered from the return air of IT equipment achieves the lowest cooling energy consumption, with PUE, cooling system energy savings, and COP of 1.19, 10.06%, and 10.17, respectively.
- (2)
- In the scenario of maximizing the utilization of waste heat, the energy-saving rate and COP of the cooling system from recovering waste heat from the return air of IT equipment are 19.80% and 12.36, respectively.
- (3)
- Localized heat extraction is more energy efficient than uniform heat extraction, with the best COP of 12.36.
- (4)
- The energy consumption of the system exhibits an initial increase followed by a decrease as the chilled water supply temperature rises, reaching its minimum at 16 °C. As the temperature difference between the air supply temperature of the server rooms and the chilled water supply temperature increases, the cooling energy consumption experiences a notable rise, whereas the opposite effect is observed on the water tank volume. Enhancing the key parameters of the proposed system can lead to a notable reduction in the total energy consumption, amounting to 26.05%.
In this study, the analysis focused solely on the simulation system without verification against the actual situation. Additionally, the comparison and analysis of scenarios primarily centered on energy consumption without considering economic and environmental benefits. Furthermore, while the study quantitatively analyzed the effect of the system parameters on energy consumption, it lacked an optimal analysis. Moving forward, it is imperative to establish a comprehensive evaluation system and identify optimal operating parameters for the system.
Author Contributions
Conceptualization, J.W.; Software, M.Z.; Writing—original draft, P.Y. and Y.G.; Writing—review & editing, Y.G., J.W., L.Z. and W.D.; Supervision, D.F. All authors have read and agreed to the published version of the manuscript.
Funding
This work was supported by the National Natural Science Foundation of China (No.52108101), the International Science and Technology Cooperation Programme of China (2023YFE0120400), the Chenzhou Municipal Science and Technology Bureau (2022sfq28), and the Opening Foundation of Anhui Province Key Laboratory of Intelligent Building & Building Energy Saving (IBES2022KF05).
Informed Consent Statement
Not applicable.
Data Availability Statement
Data are contained within the article. The original contributions presented in the study are included in the article, further inquiries can be directed to the corresponding author.
Conflicts of Interest
Author Peng Yin was employed by the company Jiangsu Communications Services. Author Da Feng was employed by the company China Telecom Corporation Limited Suzhou Branch. Author Weike Ding was employed by the company China Information Consulting & Designing Institute. The remaining authors declare that the research was conducted in the absence of any commercial or financial relationships that could be construed as a potential conflict of interest.
Nomenclature
| Acronyms | |
| DC | Data center |
| PUE | Power usage effectiveness |
| COP | Coefficient of performance |
| NPV | Net present value |
| HP | Heat pump |
| SAT | Supply air temperature |
| CRAH | Computer room air handler |
| UPS | Uninterruptible power supply |
| PDU | Power distribution unit |
| ASHP | Air source heat pump |
| WSHP | Water source heat pump |
| Symbols | |
| LDC,cooling | Cold load of the server rooms (kW) |
| Lenvelope | Cold load of enclosure structure (kW) |
| Llighting | Cold load of lighting (kW) |
| LIT | Cold load of operation of IT equipment (kW) |
| Kenvelope | Heat transfer coefficient of the enclosure structure (W/(m2·K)) |
| A | Heat transfer area of the enclosure structure (m2) |
| toutdoor | Dry-bulb temperature of the outdoor air (°C) |
| tindoor | Temperature of the server rooms (°C) |
| q | The illuminance per unit area of the server rooms (W/m2) |
| Lservers | Server heat dissipation (kW) |
| LPDUs | PDU heat loss (kW) |
| LUPSs | UPS heat loss (kW) |
| Nserver | Number of servers |
| PFpower | Server load factor (%) |
| Pfull | Full load power of the servers (kW) |
| α | The rate of change of heat dissipation of the servers |
| userver | Server utilization (%) |
| Tair,s | Temperature of the air supply to the server rooms (°C) |
| LPDUidle | Heat loss of PDU under no load (kW) |
| LUPSidle | Heat loss of UPS under no load (kW) |
| LPDUs | Total heat loss of PDU (kW) |
| LUPSs | Total heat loss of UPS (kW) |
| πPDU | Loss coefficient of PDU |
| πUPS | Loss coefficient of UPS |
| Ptotal | Total energy consumption of the DC (kWh) |
| PIT | Energy consumption of IT equipment (kWh) |
| UAhx,c | Heat transfer coefficient of the exchanger of cooling system (kW/K) |
| Qch | Rated capacity of chiller (kW) |
| COPrate | Rated COP of chiller |
| Tchw,set | The set point temperature of the chilled water stream (°C) |
| mct,a | Design air-flow rate of the cooling tower (m3/h) |
| Pct | Rated fan power of the cooling tower (kW) |
| mchwp | Rated flow rate of the chilled water pump (m3/h) |
| Pchwp | Rated power of the chilled water pump (kW) |
| mcwp | Rated flow rate of the cooling water pump (m3/h) |
| Pcwp | Rated power of the chilled water pump (kW) |
| mlwp | Rated flow rate of the lake water pump (m3/h) |
| Plwp | Rated power of the lake water pump (kW) |
| UAcrah | Heat transfer coefficient of the exchanger of the CRAH (kW/K) |
| Pcrah | Rated power of the fan of the CRAH (kW) |
| mcrah,a | Rated air-flow rate of the fan of the CRAH (m3/h) |
| Pashp,w | Rated heating power of ASHPs without waste heat recovery (kW) |
| Pblower,w | Blower power of ASHPs without waste heat recovery (kW) |
| Qhc,w | Rated heating capacity of ASHPs without waste heat recovery (kW) |
| Qaux,w | Capacity of auxiliary of ASHPs without waste heat recovery (kW) |
| mair,w | Total air-flow rate of ASHPs without waste heat recovery (m3/h) |
| mrated,w | Rated flow rate of water pump in HPs’ load side (m3/h) |
| Prated,w | Rated power of water pump in HPs’ load side (kW) |
| V | Volume of the storage tank (m3) |
| H | Height of the storage tank (m) |
| mhwp | Rated flow rate of hot water (m3/h) |
| Phwp | Rated power of hot water pump (kW) |
| Qwshp | Rated heating capacity of the WASPs (kW) |
| Pwshp | Rated heating power of the WASPs (kW) |
| mwp,h | Rated flow rate of lake water in WSHPs’ source side (m3/h) |
| Pwp,h | Rated power of lake water in WSHPs’ source side (kW) |
| Pashp,h | Rated heating power of ASHPs with waste heat recovery (kW) |
| Pblower,h | Blower power of ASHPs with waste heat recovery (kW) |
| Qhc,h | Rated heating capacity of ASHPs with waste heat recovery (kW) |
| mair,h | Total air-flow rate of ASHPs with waste heat recovery (m3/h) |
References
- Li, J.; Duan, W.; Peng, Z.; Chen, Y.; Chen, H.; Peng, Q.; Liao, S.; Sun, X.; Jiang, C. An experimental and numerical study on the energy storage and release performance of shell and tube heat exchangers with phase change material for the data center. Appl. Therm. Eng. 2024, 255, 123966. [Google Scholar] [CrossRef]
- Wang, J.; Tian, Y.; Qi, Z.; Zeng, L.; Wang, P.; Yoon, S. Sensor fault diagnosis and correction for data center cooling system using hybrid multi-label random Forest and Bayesian Inference. Build. Environ. 2024, 249, 111124. [Google Scholar] [CrossRef]
- Wang, J.; Tong, X.; Yue, C.; Liu, W.; Zhang, Q.; Zeng, L.; Huang, G. Real-time temperature distribution reconstruction via linear parameter-varying state-space model and Kalman filter in rack-based cooling data centers. Build. Environ. 2023, 242, 110601. [Google Scholar] [CrossRef]
- Huang, P.; Copertaro, B.; Zhang, X.; Shen, J.; Löfgren, I.; Rönnelid, M.; Fahlen, J.; Andersson, D.; Svanfeldt, M. A review of data centers as prosumers in district energy systems: Renewable energy integration and waste heat reuse for district heating. Appl. Energy 2020, 258, 114109. [Google Scholar] [CrossRef]
- Phan, L.; Lin, C.-X. A multi-zone building energy simulation of a data center model with hot and cold aisles. Energy Build. 2014, 77, 364–376. [Google Scholar] [CrossRef]
- Liu, Y.; Wei, X.; Xiao, J.; Liu, Z.; Xu, Y.; Tian, Y. Energy consumption and emission mitigation prediction based on data center traffic and PUE for global data centers. Glob. Energy Interconnect. 2020, 3, 272–282. [Google Scholar] [CrossRef]
- Li, X.; Li, M.; Zhang, Y.; Han, Z.; Wang, S. Rack-level cooling technologies for data centers—A comprehensive review. J. Build. Eng. 2024, 90, 109535. [Google Scholar] [CrossRef]
- Tong, X.; Wang, J.; Liu, W.; Samah, H.-A.; Zhang, Q.; Zhang, L. A time-varying state-space model for real-time temperature predictions in rack-based cooling data centers. Appl. Therm. Eng. 2023, 230, 120737. [Google Scholar] [CrossRef]
- Nadjahi, C.; Louahlia, H.; Lemasson, S. A review of thermal management and innovative cooling strategies for data center. Sustain. Comput. 2018, 19, 14–28. [Google Scholar] [CrossRef]
- Ni, J.; Bai, X. A review of air conditioning energy performance in data centers. Renew. Sust. Energ. Rev. 2017, 67, 625–640. [Google Scholar] [CrossRef]
- Lu, T.; Lü, X.; Remes, M.; Viljanen, M. Investigation of air management and energy performance in a data center in Finland: Case study. Energy Build. 2011, 43, 3360–3372. [Google Scholar] [CrossRef]
- Ljungqvist, H.M.; Risberg, M.; Toffolo, A.; Vesterlund, M. A realistic view on heat reuse from direct free air-cooled data centres. Energy Convers. Manag. X 2023, 20, 100473. [Google Scholar] [CrossRef]
- Zhang, Y.; Wei, Z.; Zhang, M. Free cooling technologies for data centers: Energy saving mechanism and applications. Energy Procedia 2017, 143, 410–415. [Google Scholar] [CrossRef]
- Zhang, H.; Shao, S.; Xu, H.; Zou, H.; Tian, C. Free cooling of data centers: A review. Renew. Sust. Energ. Rev. 2014, 35, 171–182. [Google Scholar] [CrossRef]
- Dong, K.; Li, P.; Huang, Z.; Su, L.; Sun, Q. Research on Free Cooling of Data Centers by Using Indirect Cooling of Open Cooling Tower. Procedia Eng. 2017, 205, 2831–2838. [Google Scholar] [CrossRef]
- Wahlroos, M.; Pärssinen, M.; Rinne, S.; Syri, S.; Manner, J. Future views on waste heat utilization—Case of data centers in Northern Europe. Renew. Sust. Energ. Rev. 2018, 82, 1749–1764. [Google Scholar] [CrossRef]
- Wahlroos, M.; Pärssinen, M.; Manner, J.; Syri, S. Utilizing data center waste heat in district heating—Impacts on energy efficiency and prospects for low-temperature district heating networks. Energy 2017, 140, 1228–1238. [Google Scholar] [CrossRef]
- He, Z.; Ding, T.; Liu, Y.; Li, Z. Analysis of a district heating system using waste heat in a distributed cooling data center. Appl. Therm. Eng. 2018, 141, 1131–1140. [Google Scholar] [CrossRef]
- Davies, G.F.; Maidment, G.G.; Tozer, R.M. Using data centres for combined heating and cooling: An investigation for London. Appl. Therm. Eng. 2016, 94, 296–304. [Google Scholar] [CrossRef]
- Ancona, M.A.; Bianchi, M.; Branchini, L.; Pascale, A.D.; Melino, F.; Ottaviano, S.; Peretto, A.; Poletto, C. Experimental and numerical investigation of a micro-ORC system for heat recovery from data centers. J. Phys. Conf. Ser. 2022, 2385, 012122. [Google Scholar] [CrossRef]
- Ebrahimi, K.; Jones, G.F.; Fleischer, A.S. A review of data center cooling technology, operating conditions and the corresponding low-grade waste heat recovery opportunities. Renew. Sust. Energ. Rev. 2014, 31, 622–638. [Google Scholar] [CrossRef]
- Oró, E.; Allepuz, R.; Martorell, I.; Salom, J. Design and economic analysis of liquid cooled data centres for waste heat recovery: A case study for an indoor swimming pool. Sust. Cities Soc. 2018, 36, 185–203. [Google Scholar] [CrossRef]
- Pärssinen, M.; Wahlroos, M.; Manner, J.; Syri, S. Waste heat from data centers: An investment analysis. Sust. Cities Soc. 2019, 44, 428–444. [Google Scholar] [CrossRef]
- Haywood, A.; Sherbeck, J.; Phelan, P.; Varsamopoulos, G.; Gupta, S.K.S. Thermodynamic feasibility of harvesting data center waste heat to drive an absorption chiller. Energy Conv. Manag. 2012, 58, 26–34. [Google Scholar] [CrossRef]
- Ebrahimi, K.; Jones, G.F.; Fleischer, A.S. The viability of ultra low temperature waste heat recovery using organic Rankine cycle in dual loop data center applications. Appl. Therm. Eng. 2017, 126, 393–406. [Google Scholar] [CrossRef]
- Deymi-Dashtebayaz, M.; Valipour-Namanlo, S. Thermoeconomic and environmental feasibility of waste heat recovery of a data center using air source heat pump. J. Clean Prod. 2019, 219, 117–126. [Google Scholar] [CrossRef]
- Zhang, C.; Luo, H.; Wang, Z. An economic analysis of waste heat recovery and utilization in data centers considering environmental benefits. Sustain. Prod. Consump. 2022, 31, 127–138. [Google Scholar] [CrossRef]
- Silva-Llanca, L.; Ponce, C.; Bermúdez, E.; Martínez, D.; Díaz, A.J.; Aguirre, F. Improving energy and water consumption of a data center via air free-cooling economization: The effect weather on its performance. Energy Conv. Manag. 2023, 292, 117344. [Google Scholar] [CrossRef]
- Chen, X.; Pan, M.; Li, X.; Zhang, K. Multi-mode operation and thermo-economic analyses of combined cooling and power systems for recovering waste heat from data centers. Energy Conv. Manag. 2022, 266, 115820. [Google Scholar] [CrossRef]
- Murphy, A.R.; Fung, A.S. Techno-economic study of an energy sharing network comprised of a data centre and multi-unit residential buildings for cold climate. Energy Build. 2019, 186, 261–275. [Google Scholar] [CrossRef]
- Zhou, J.; Kanbur, B.B.; Le, D.V.; Tan, R.; Duan, F. Multi-criteria assessments of increasing supply air temperature in tropical data center. Energy 2023, 271, 127043. [Google Scholar] [CrossRef]
- Ham, S.-W.; Park, J.-S.; Jeong, J.-W. Optimum supply air temperature ranges of various air-side economizers in a modular data center. Appl. Therm. Eng. 2015, 77, 163–179. [Google Scholar] [CrossRef]
- Cho, J. Optimal supply air temperature with respect to data center operational stability and energy efficiency in a row-based cooling system under fault conditions. Energy 2024, 288, 129797. [Google Scholar] [CrossRef]
- Chen, X.; Bai, J.; Fu, L.; Lei, Y.; Zhang, D.; Zhang, Z.; Luo, Q.; Gong, S.; Shen, B. Complementary waste heat utilization from data center to ecological farm: A technical, economic and environmental perspective. J. Clean Prod. 2024, 435, 140495. [Google Scholar] [CrossRef]
- Pelley, S.; Meisner, D.; Wenisch, T.F.; Vangilder, J.W. Understanding and abstracting total data center power. Workshop Energy-Effic. Des. 2009, 11, 1–6. [Google Scholar]
- Zou, S.; Zhang, Q.; Yue, C. Comparative study on different energy-saving plans using water-side economizer to retrofit the computer room air conditioning system. J. Build. Eng. 2023, 69, 106278. [Google Scholar] [CrossRef]
- Gray, L.D.; Kumar, A.; Li, H.H. Workload Characterization of the SPECpower_ssj2008 Benchmark. In SPEC International Performance Evaluation Workshop; Springer: Berlin/Heidelberg, Germany, 2008; pp. 262–282. [Google Scholar] [CrossRef]
- GB 50015-2019; Standard for Design of Building Water Supply and Drainage. Ministry of Housing and Urban-Rural Development of the People’s Republic of China: Beijing, China, 2019.
- Deng, W.; Wang, J.; Yue, C.; Guo, Y.; Zhang, Q. Model-based control strategy with linear parameter-varying state-space model for rack-based cooling data centers. Energy Build. 2024, 319, 114528. [Google Scholar] [CrossRef]


Disclaimer/Publisher’s Note: The statements, opinions and data contained in all publications are solely those of the individual author(s) and contributor(s) and not of MDPI and/or the editor(s). MDPI and/or the editor(s) disclaim responsibility for any injury to people or property resulting from any ideas, methods, instructions or products referred to in the content. |
© 2024 by the authors. Licensee MDPI, Basel, Switzerland. This article is an open access article distributed under the terms and conditions of the Creative Commons Attribution (CC BY) license (https://creativecommons.org/licenses/by/4.0/).