Article

A Spatiotemporal Evolution and Pathway Analysis of Rural Development Efficiency: A Case Study of the Yangtze River Delta

School of Design and Architecture, Zhejiang University of Technology, Hangzhou 310023, China
*
Author to whom correspondence should be addressed.
Sustainability 2024, 16(15), 6543; https://doi.org/10.3390/su16156543
Submission received: 28 May 2024 / Revised: 15 July 2024 / Accepted: 28 July 2024 / Published: 31 July 2024

Abstract

:
Sustainable rural development is crucial for urban–rural integration and achieving shared prosperity. This study assesses rural development efficiency (RDE) at the county level in the Yangtze River Delta (YRD) region from 2012 to 2021 using the super-slacks-based measure model (SBM). By employing the Theil index and spatial Markov chains, this study explores the spatiotemporal evolution of RDE, categorizes rural development types, and proposes differentiated developmental pathways. The findings reveal (1) an initial upward trend in overall RDE in the YRD followed by stabilization, with regional disparities narrowing yet overall efficiency levels remaining relatively low; (2) a spatial distribution pattern of RDE characterized by high efficiency in the southeast and low efficiency in the northwest, forming a “core–periphery” structure, with pure technical efficiency identified as a significant bottleneck; (3) stability and “club convergence” in RDE, with geographic spatial patterns significantly influencing the transition process and a notable spatial spillover effect; (4) the classification of rural development types into six categories based on an “input–output–efficiency” perspective, each with specific developmental pathways. This study concludes that optimizing resource allocation efficiency and defining development pathways tailored to local conditions are essential for driving sustainable rural development in the YRD.

1. Introduction

Rural development has become a crucial priority for promoting urban–rural integration and achieving widespread prosperity, particularly by focusing on industrial revitalization. Many developed countries have implemented market-oriented systems for rural land transfer, implemented comprehensive technological upgrades in agriculture, and developed various models for sustainable rural development. Examples include Japan’s “Village-Making Movement” and the Netherlands’ “Land Consolidation”. Numerous case studies have demonstrated that the foundation of rural development lies in its economic sustainability. From an economic perspective, rural development involves integrating, allocating, and managing rural resources among multiple stakeholders within a market context, with the aim of enhancing and maximizing the value of these resources. Rural development efficiency (RDE) plays a critical role in assessing the input of resources and the output of effects in rural construction and management, providing an effectiveness-based evaluation of rural development pathways. This focus is essential for transitioning from a “blood transfusion” approach to a “blood-making” mechanism in rural development. Therefore, conducting scientific evaluations of RDE holds strategic significance for optimizing the allocation structure of rural resources and advancing sustainable rural development.
Supported by China’s comprehensive agricultural policies and government initiatives funded by fiscal resources at various levels, the successful implementation of rural development projects has been observed. This has catalyzed the initial development of rural industries and led to socioeconomic rejuvenation [1]. However, indiscriminate investments by governments and other stakeholders have resulted in ineffective resource accumulation and utilization, as well as a misalignment between the supply and demand of production factors in these regions [2]. Many rural areas are still in the early stages of development, prioritizing quantity and survival over efficiency. Therefore, evaluations based solely on economic levels and infrastructure completeness are insufficient for supporting sustainable rural development research [3]. Instead, efforts in rural development should shift their focus from quantitative growth to qualitative improvement. Assessing the efficiency of rural development is crucial for boosting its overall quality.
The concept of “efficiency” was first proposed by Farrell [4]. It refers to the difference between the actual output and the potential optimal output of a production unit. RDE serves as a crucial metric for evaluating the quality of rural development through an input–output analysis of rural industries. It represents a fundamental element in assessing the levels of rural development. Scholars around the world have explored different levels of RDE. Their research typically focuses on specific areas such as agricultural production efficiency [5,6], rural tourism efficiency [7], and ecological efficiency [8], considering factors like spatiotemporal changes, influencing factors, and mechanisms. For example, Sebastian Stępień et al. used DEA to evaluate the ecological efficiency of rural areas in Poland, finding that contractual integration can boost farm efficiency [9]. Zhang et al. uncovered the spatiotemporal evolution of Agricultural and Rural Green Development Efficiency in China and its relationship with economic growth [10]. In terms of evaluation systems, key input indicators include the agricultural land area and rural workforce, while output indicators often involve the agricultural output value and similar statistics [5,11]. Research on types of rural development often focuses on constructing comprehensive evaluation systems based on rurality indicators [12,13], but there is a lack of classification based on efficiency. For instance, Jiang et al. divided the rural tourism areas in Chongqing into seven types based on efficiency measurements and spatial characteristics [14]. In terms of methods, measuring RDE involves techniques such as data envelopment analysis (DEA), slacks-based measurement (SBM), and stochastic frontier analysis [15,16]. The SBM model, which includes undesirable outputs and effectively addresses input–output slack, has become a mainstream method for measuring efficiency.
Current research on RDE has several notable shortcomings. Firstly, many studies focus solely on single production factors, neglecting to explore the spatial patterns of and inherent differences in comprehensive RDE from a systemic perspective. Secondly, the construction of indicator systems for RDE remains incomplete, as the selection of indicators often overlooks the development of nonagricultural activities in rural areas. Thirdly, research tends to concentrate on macro-scale comparisons at the national or provincial level [17,18] or on micro-scale in-depth analyses of individual rural cases [19], resulting in a lack of studies at the county level. Counties represent the most concentrated units of rural production, and using them as the evaluation units for RDE can more accurately reflect regional differences and evolutionary trends. Therefore, in the context of China’s rural transformation, evaluating RDE with a focus on total factor productivity is increasingly urgent and important.
Based on the first law of geography, it is known that geographic phenomena exhibit spatial correlations [20]. As the forefront of rural revitalization in China, what spatial characteristics and correlations does RDE exhibit in the Yangtze River Delta (YRD) region? With the increased mobility of rural production factors under marketization, does this intensify spatial effects on RDE? What are the underlying patterns governing this phenomenon? Therefore, this study focuses on 273 county-level units in the YRD in China, using the super-SBM model to measure RDE from 2012 to 2021. It explores the spatiotemporal evolution characteristics and categorizes rural development types based on these findings, proposing differentiated strategies. From an economic perspective, the study emphasizes the efficiency of rural development operations, conducting comprehensive evaluations using multi-source data on rural areas and factors. This study expands the economic sustainability perspective in rural development quality research and supplements the small-scale unit studies in RDE, thereby refining richer rural development models and innovative pathways. The study’s conclusions contribute to assessing the input and rational use of rural resources, providing new insights and strategies for government efforts toward comprehensive rural revitalization.

2. Methods and Data Sources

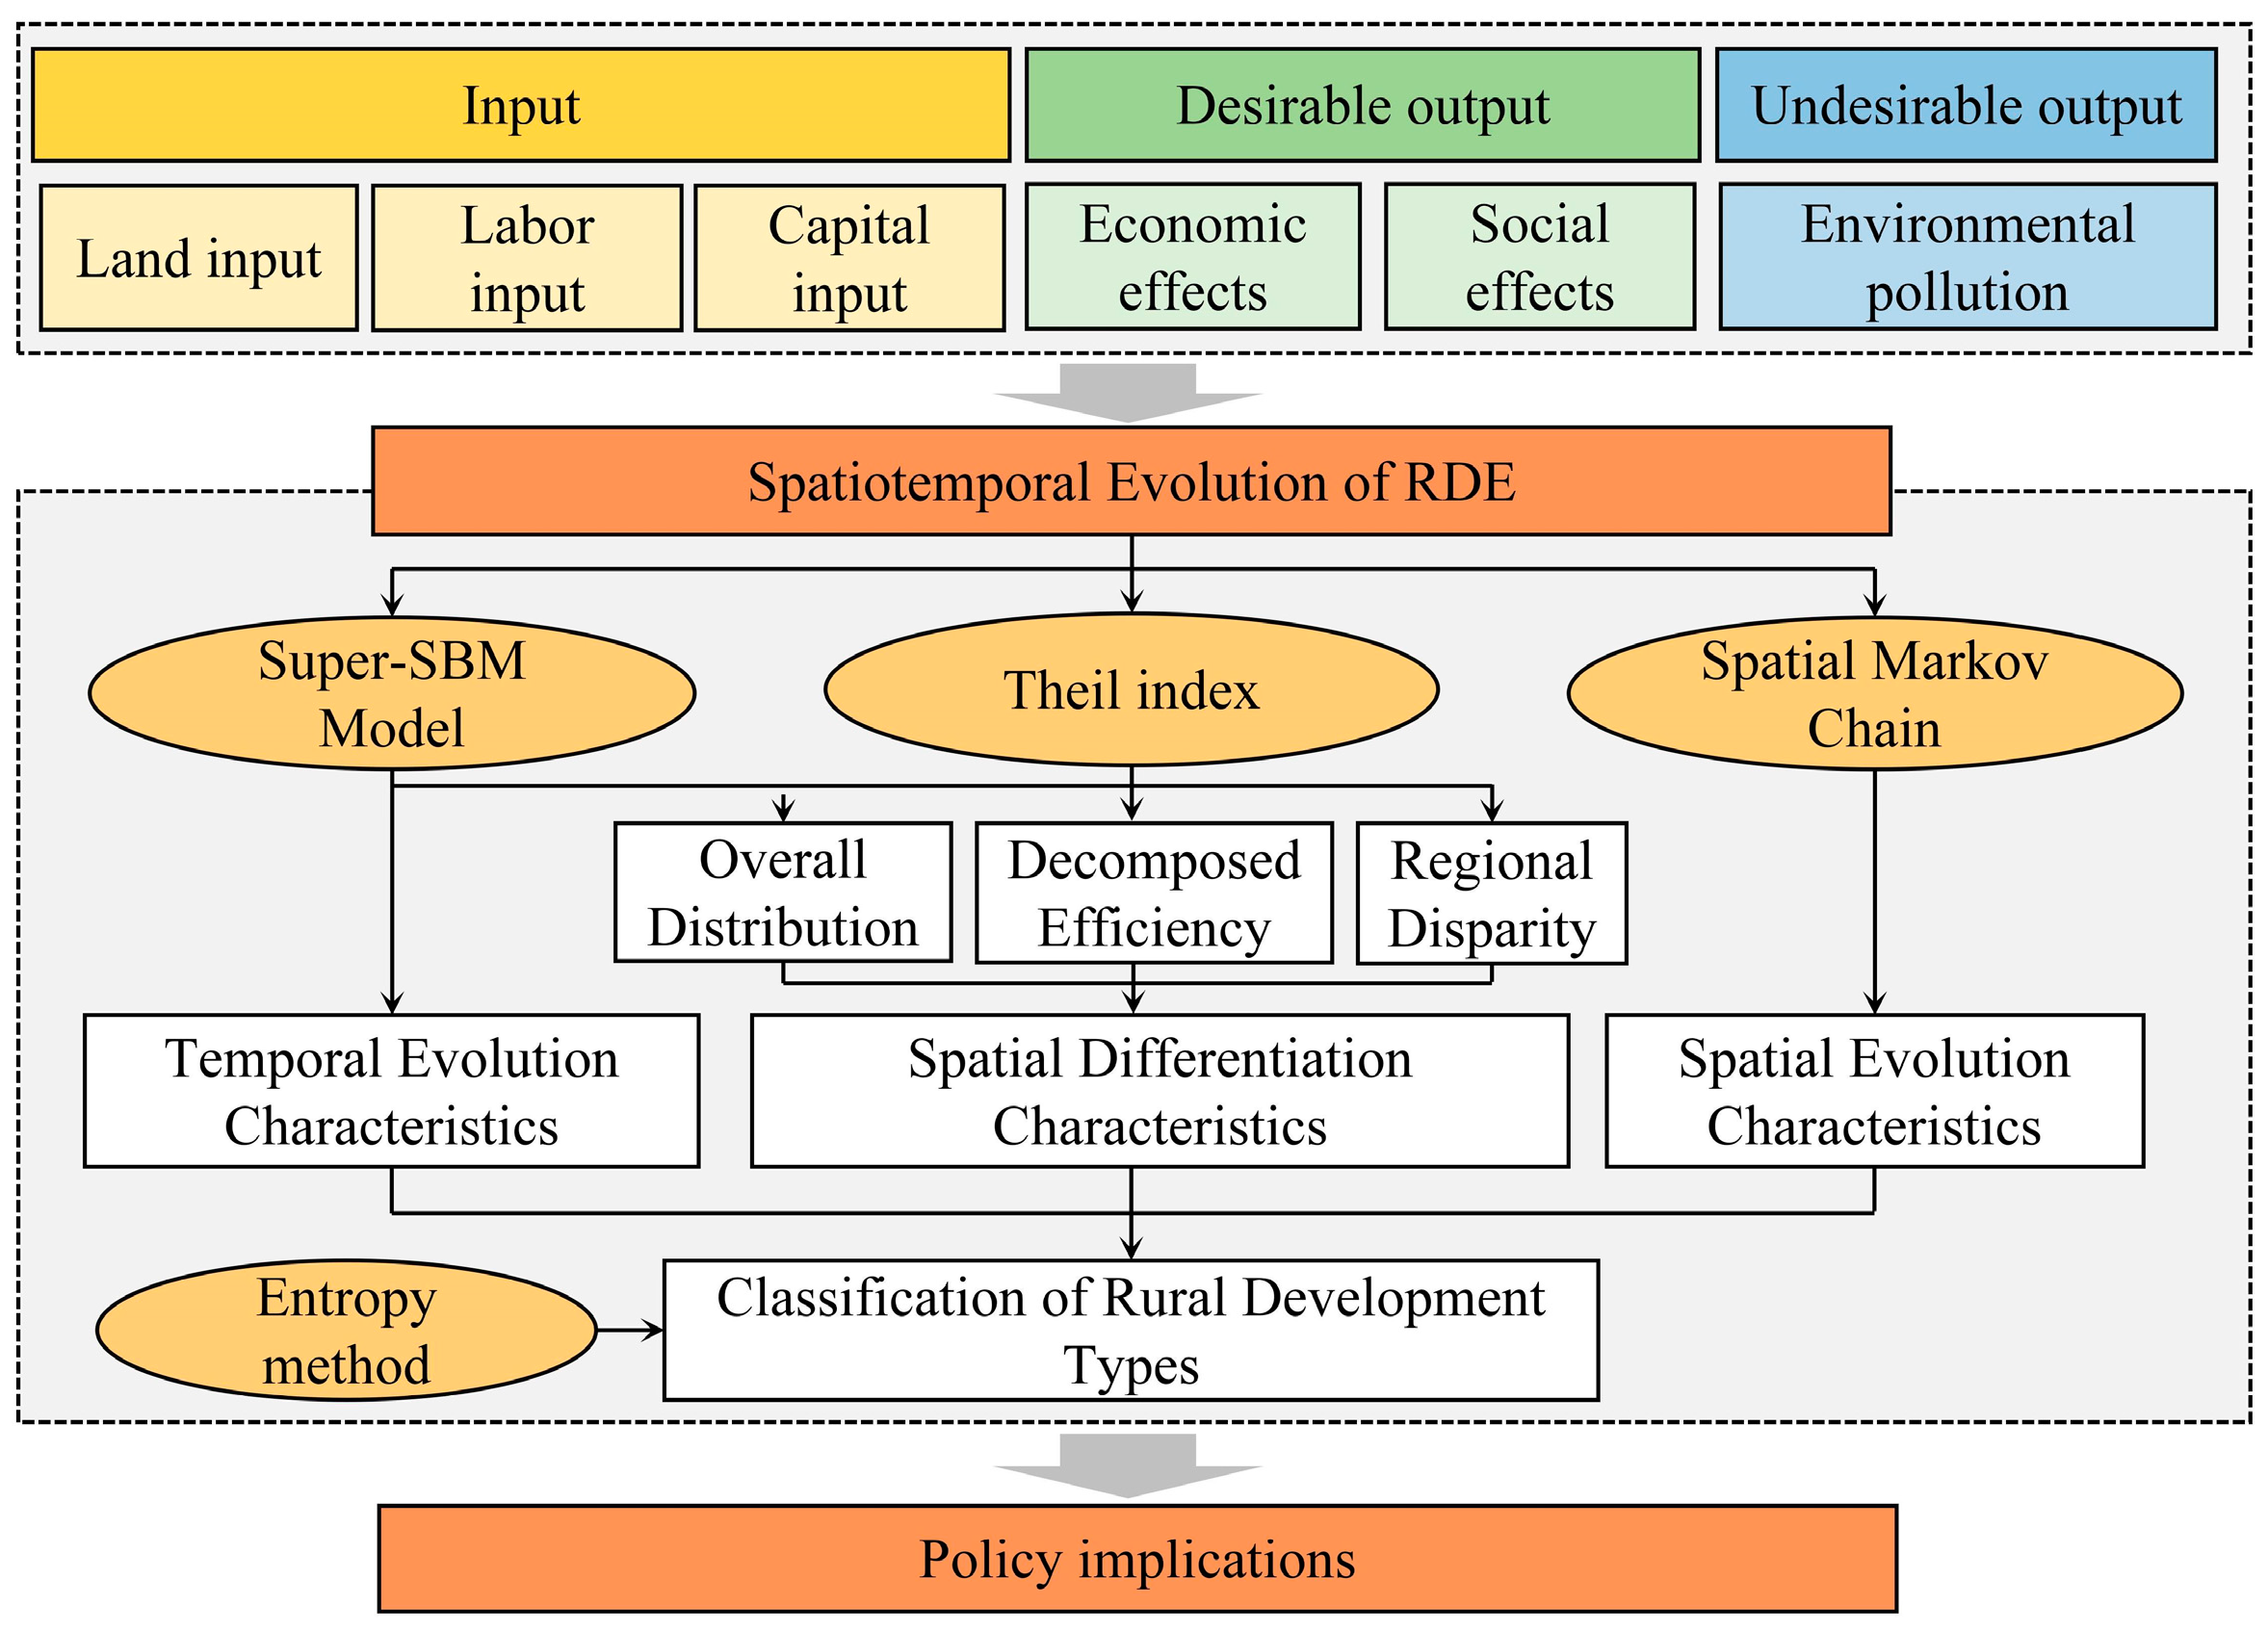
2.1. Research Framework

This study takes 273 counties in the YRD of China from 2012 to 2021 as the research object. The primary objective is to establish a comprehensive indicator evaluation system for RDE, employing the super-SBM model to measure RDE and displaying it through ArcGIS 10.6. Additionally, it incorporates Theil index calculations to assess regional disparities in RDE across the YRD, analyzing trends in temporal evolution and spatial patterns. Moreover, building upon spatial correlation analysis, the study constructs both traditional and spatial Markov chain transition probability matrices. Through a comparative analysis of these matrices, it empirically investigates the role and patterns of geographic spatial structures in the spatiotemporal evolution of RDE. Lastly, from a three-dimensional perspective of “input–output–efficiency”, the study categorizes rural development types within county-level units of the YRD, proposing differentiated development pathways and policy recommendations. The research framework is illustrated in Figure 1.

2.2. Overview of the Study Area

This study focuses on the YRD, which is one of the most economically dynamic and open areas in China. This region includes Shanghai, Jiangsu, Zhejiang, and Anhui provinces, covering a total area of 358,000 square kilometers. The rural regions of the YRD are experiencing an accelerated transformation in structure and function, driven by a continuous influx of talent, technology, and capital. These developments position these areas as exemplary cases of rural development. Therefore, the YRD is selected as a representative case for this study.
This study focuses on 273 county-level units within the YRD. Notably, the research excludes 25 municipal districts across Shanghai, Nanjing, Xuzhou, and Hangzhou due to complete urbanization, as well as certain counties with severe data deficiencies. Considering data availability, the unique characteristics of the subjects under study, and insights from prior research, this study integrates municipal districts, county-level cities, and counties into a single analysis framework to provide a more comprehensive assessment of rural development. From 2012 to 2021, there were minor adjustments in the provincial administrative divisions. To ensure data continuity and alignment with current economic policies, this study consolidates data from counties that have undergone administrative reclassifications into their respective updated administrative units.

2.3. Research Methodology

2.3.1. Super-SBM Model with Undesirable Outputs

During rural development processes, in addition to producing expected outputs, such as agricultural and industrial products, there are also undesired outputs, such as carbon emissions, which contribute to environmental pollution. Tone [21] developed the SBM-undesirable model, which effectively addresses both slack variables and undesirable outputs in the input–output process. This model also reranks decision-making units (DMUs) to provide a precise evaluation of RDE. Therefore, this study utilizes the super-SBM model with undesirable outputs to assess RDE in the YRD. The formula is as follows:
ρ = min 1 1 N n = 1 N s n x x k n t 1 + 1 M + 1 ( m = 1 M s m y y k m t + i = 1 I s i b b k i t ) s . t . t = 1 T k = 1 K z k t x k n t + s n x = x k n t , ( n = 1 , 2 , N ) t = 1 T k = 1 K z k t y k m t s m y = y k m t , ( m = 1 , 2 , M ) t = 1 T k = 1 K z k t b k i t + s i b = b k i t , ( i = 1 , 2 , I ) z k t 0 , s n x 0 , s m y 0 , s i b 0 , ( k = 1 , 2 , K )
where ρ is the objective function and efficiency value; N, M, I denote the number of inputs and desirable and undesirable outputs of each DMU, respectively; ( x k n t , y k n t , b k n t ) are the input–output values of k in t ; ( s n x , s n y , s n b ) are the slack values for inputs and desirable and undesirable outputs, respectively; and z k t is the weight vector.

2.3.2. Theil Index

RDE varies across regional spatial patterns; thus, the Theil index is used to measure the extent of regional disparities in RDE. This index is decomposable, allowing for the separate evaluation of disparities within and between regions [22]. The Theil index ranges from 0 to 1, with lower values indicating smaller disparities between regions. The formula is as follows:
T h e i l = T h e i l W + P i j = Z i j Z i L a g a = b = 1 n ( Y b W a b ) T h e i l W = i = 1 m ( n i n x ¯ i x ¯ ) T h e i l i T h e i l B = i = 1 m n i n ( x ¯ i x ¯ ) l n ( x ¯ i x ¯ )
where m is the number of provincial categories; n i / n is the proportion of counties within each province; x ¯ i / x ¯ is the ratio of the average RDE of each county to the average for the YRD; T h e i l i is the Theil index of RDE for the county i ; and T h e i l W and T h e i l B represent the intraprovincial and interprovincial disparities in RDE, respectively.

2.3.3. Spatial Markov Chain

The traditional Markov chain can effectively characterize the evolution process of RDE by introducing transition probability matrices, reflecting the developmental status of different rural counties and the fluidity of probabilities shifting upwards or downwards [23,24]. More specifically, the probability distribution of a DMU in year t is conceptualized as an 1 × k vector F t = [ F 1 , t , F 2 , t , , F k , t ] . P i j is the probability that a county’s RDE will transition from type i in year t to type j in year t + 1 . The formula is as follows:
P i j = Z i j Z i
where Z i j is the total number of county units that transition from type i at year t to type j at the next time point within the study period, and Z i is the total number of county units that belong to type i throughout the study period.
The spatial Markov chain incorporates geographic spatial elements into the traditional Markov chain framework, enabling an in-depth analysis of spatial interactions during changes in RDE [25]. This method categorizes RDE into various types and divides the conventional N × N transition probability matrix into k  N × N matrices. This decomposition allows for a clear visualization of the probabilities that RDE will improve or decline under varying spatiotemporal conditions. In this context, P i j ( k ) denotes the spatial transition probability that a county unit transitions from type i to type j at the next time step, given a spatial lag type k . The spatial lag value L a g a for county a is calculated as the weighted average of the RDE of its neighboring counties.
L a g a = b = 1 n ( Y b W a b )
where Y b is the RDE value of county b , and W a b is the spatial weight matrix.

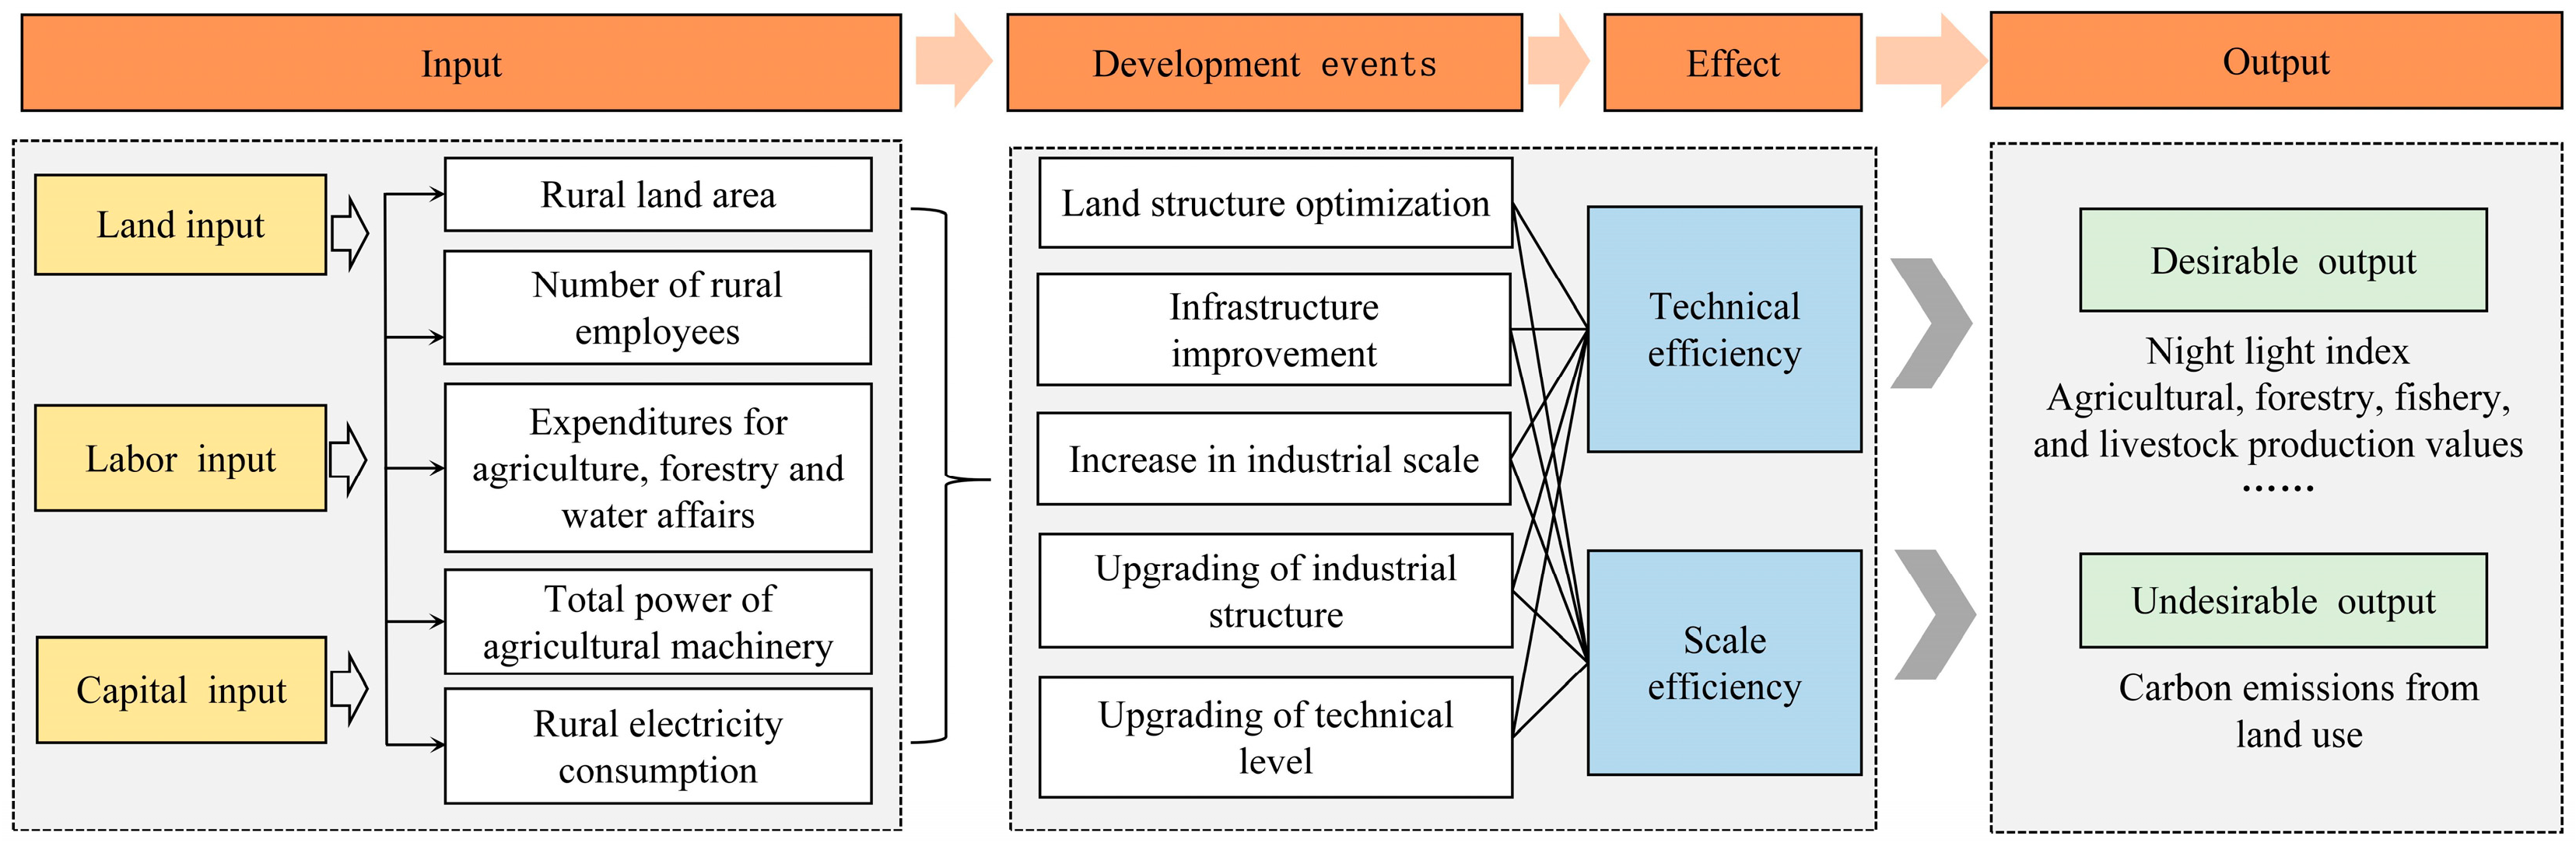
2.4. Construction of the Index System and Data Sources

2.4.1. Construction of the Index System

The measurement of RDE relies heavily on the development of a comprehensive input-and-output index system. Currently, there is no consensus in the academic field regarding the criteria for selecting indicators specifically for measuring RDE. This study draws insights from previous research [26,27,28] and considers the accessibility of data at the county level. It selects data that most accurately represent the inputs and outputs of rural development within county units, thus constructing the SBM-undesirable efficiency model (Figure 2). In terms of input indicators, land, labor, and capital are considered the fundamental production elements in economic theory. Land, which plays a vital role in rural development, has traditionally been measured by the area of agricultural land in previous studies [6]. However, this approach fails to capture the multiple functions of rural land use. In this study, we propose using the total land area of rural regions as an indicator, which integrates the potential for industrial development across different land use types. In regard to labor, we have chosen the number of rural employees as the human resource input for rural development. Rural employees are directly involved in rural development and provide the most tangible measure of labor input [27]. Capital inputs are crucial for the successful execution of rural development and are primarily reflected in government fiscal expenditures on agriculture-related areas, rural infrastructure, and services. Government expenditures for agriculture, forestry, and water affairs form a significant financial backbone for rural infrastructure construction and industrial development [29]. The total power of agricultural machinery and rural electricity consumption not only reflect the modernization and mechanization of rural agriculture but also indicate investments in basic infrastructure for rural livelihoods [30,31]. Therefore, expenditures for agriculture, forestry, and water affairs, the total power of agricultural machinery, and rural electricity consumption collectively represent the capital input into rural development.
In terms of output indicators, our primary focus is on the economic and social effects generated by rural industry development. Economic effects are represented by the economic output of rural areas, which is not adequately captured in official statistics. This output is derived from both agricultural and nonagricultural activities. In this study, we use agricultural, forestry, fishery, and livestock production values to represent revenues from agricultural activities [32]. Additionally, nighttime light data are utilized to indicate revenues from nonagricultural activities. Numerous studies have shown that there is a significant positive correlation between nighttime light data and GDP, suggesting that, under certain conditions, nighttime light can serve as an alternative indicator of the operational level of nonagricultural sectors in rural areas [33,34]. Social effects are quantified by the per capita disposable income of rural permanent residents, which serves as an indicator of social equity and the pursuit of common prosperity.
The development of rural areas necessitates the careful coordination of inputs and outputs, taking into account resource consumption and environmental protection. As a result, the assessment of RDE must consider the negative ecological externalities associated with industrial activities, which are known as undesirable outputs. Efficient land use and low-carbon transformations in rural industrial development are crucial for achieving sustainable growth. It is important for rural development to avoid the environmental burdens that arise from excessive construction land development. In this study, carbon emissions from rural land use are identified as one such undesirable output, given the availability of data [35]. The calculation of carbon emission coefficients for different land use types follows a methodology based on previous research [36]. The indicator system used is presented in Table 1.

2.4.2. Data Sources

The data sources for this study consisted of three main parts. (1) First, basic geographical data were collected. County administrative boundary data were obtained from the National Geomatics Center of China database. Administrative rural boundary data were extracted using Python 3.11 to obtain thematic maps and service resources from the Tianditu website (https://www.tianditu.gov.cn). This process provides the basic community unit boundaries for the YRD region, which are then used to calculate the land area of each rural domain. (2) Second, natural remote sensing data were used. The land use data were sourced from the Resource and Environmental Science and Data Center of the Chinese Academy of Sciences. Nighttime light data were obtained from the NPP-VIIRS dataset, which is available on the official website of the National Geophysical Data Center (NGDC) in the United States. Following the methodology proposed by Chen Z et al. [37], the NPP-VIIRS data underwent outlier removal and interannual calibration. (3) Finally, socioeconomic data were primarily obtained from the statistical yearbooks of various districts and counties for the years 2013 to 2022. To ensure comparability and remove the impact of inflation, the economic data were adjusted to constant 2000 prices. Missing data were addressed through linear interpolation using values from adjacent years.

3. Results

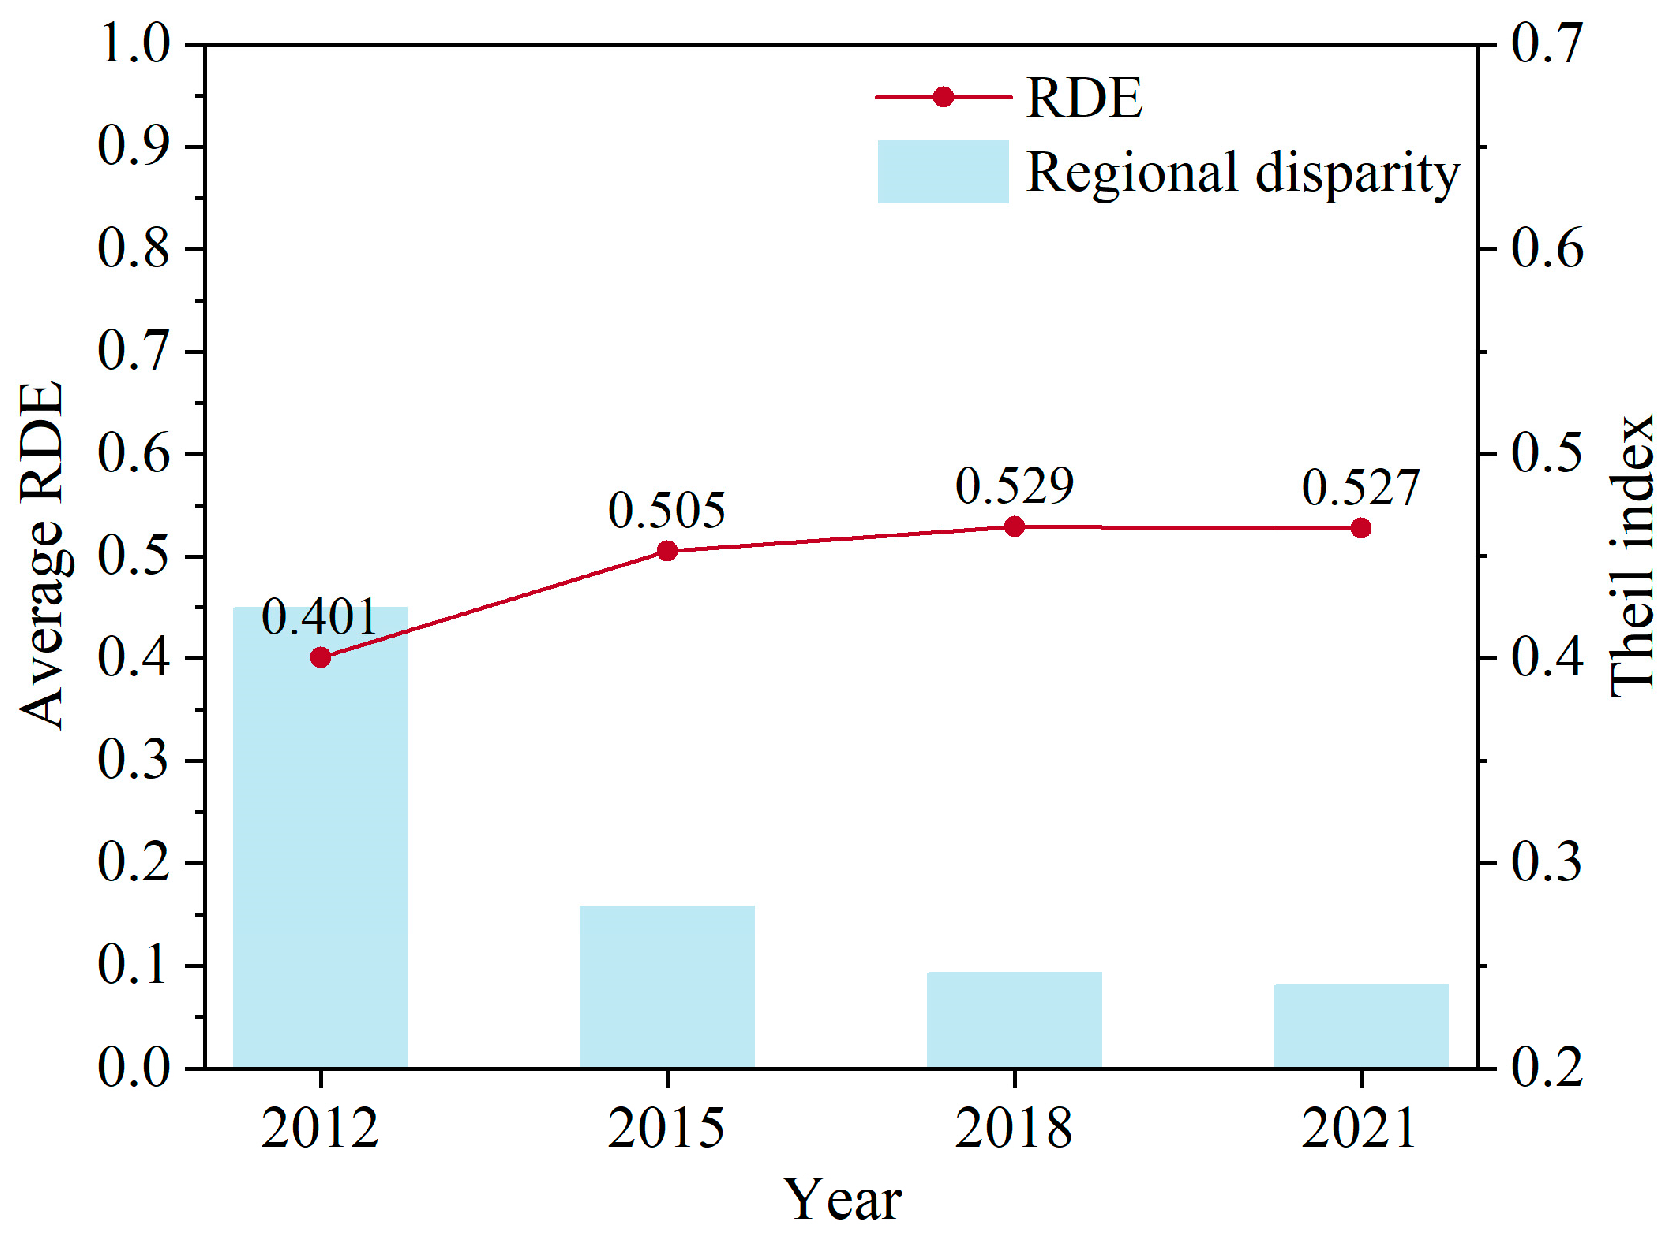
3.1. Temporal Evolution Characteristics of RDE

Using the superefficiency SBM-undesirable model, this study assessed RDE and its component efficiencies for 273 districts and counties within the YRD from 2012 to 2021. This study further analyzed the spatiotemporal evolution characteristics of RDE, integrating a regional disparity index. The findings reveal that the overall RDE of the YRD remains at a low level, with an average efficiency score of 0.491, indicating significant potential for resource conservation and technological improvement in rural development across the region. The overall trend in RDE initially showed an increase, followed by a phase of stabilization (Figure 3). Moreover, regional disparities have consistently declined, with the pace of reduction gradually slowing.
The RDE of the YRD displays two distinct evolutionary phases. During the first phase, from 2012 to 2018, the RDE steadily increased, rising from 0.401 in 2012 to a peak of 0.529 in 2018. Simultaneously, regional disparities decreased significantly, with the Theil index decreasing from 0.422 in 2012 to 0.246 in 2018, a decrease of 42%. This period was marked by a heightened national focus on rural issues, with the YRD leading in rural infrastructure development and modernization initiatives. These efforts facilitated the aggregation of technology, capital, and talent in rural areas, driving enhancements in rural productivity and development efficiency growth. In the second phase, from 2018 to 2021, RDE in the YRD experienced a period of stagnation, and regional disparities began to stabilize. After 2018, the national agenda shifted toward comprehensive rural revitalization, leading to a significant increase in agricultural financial support for underdeveloped areas. However, the marginal returns on these rural resource investments began to diminish. Concurrently, rural development encountered a bottleneck, with issues such as inefficient resource utilization and insufficient economic momentum emerging, signaling a pressing need for a new round of transformation in rural management and operations.

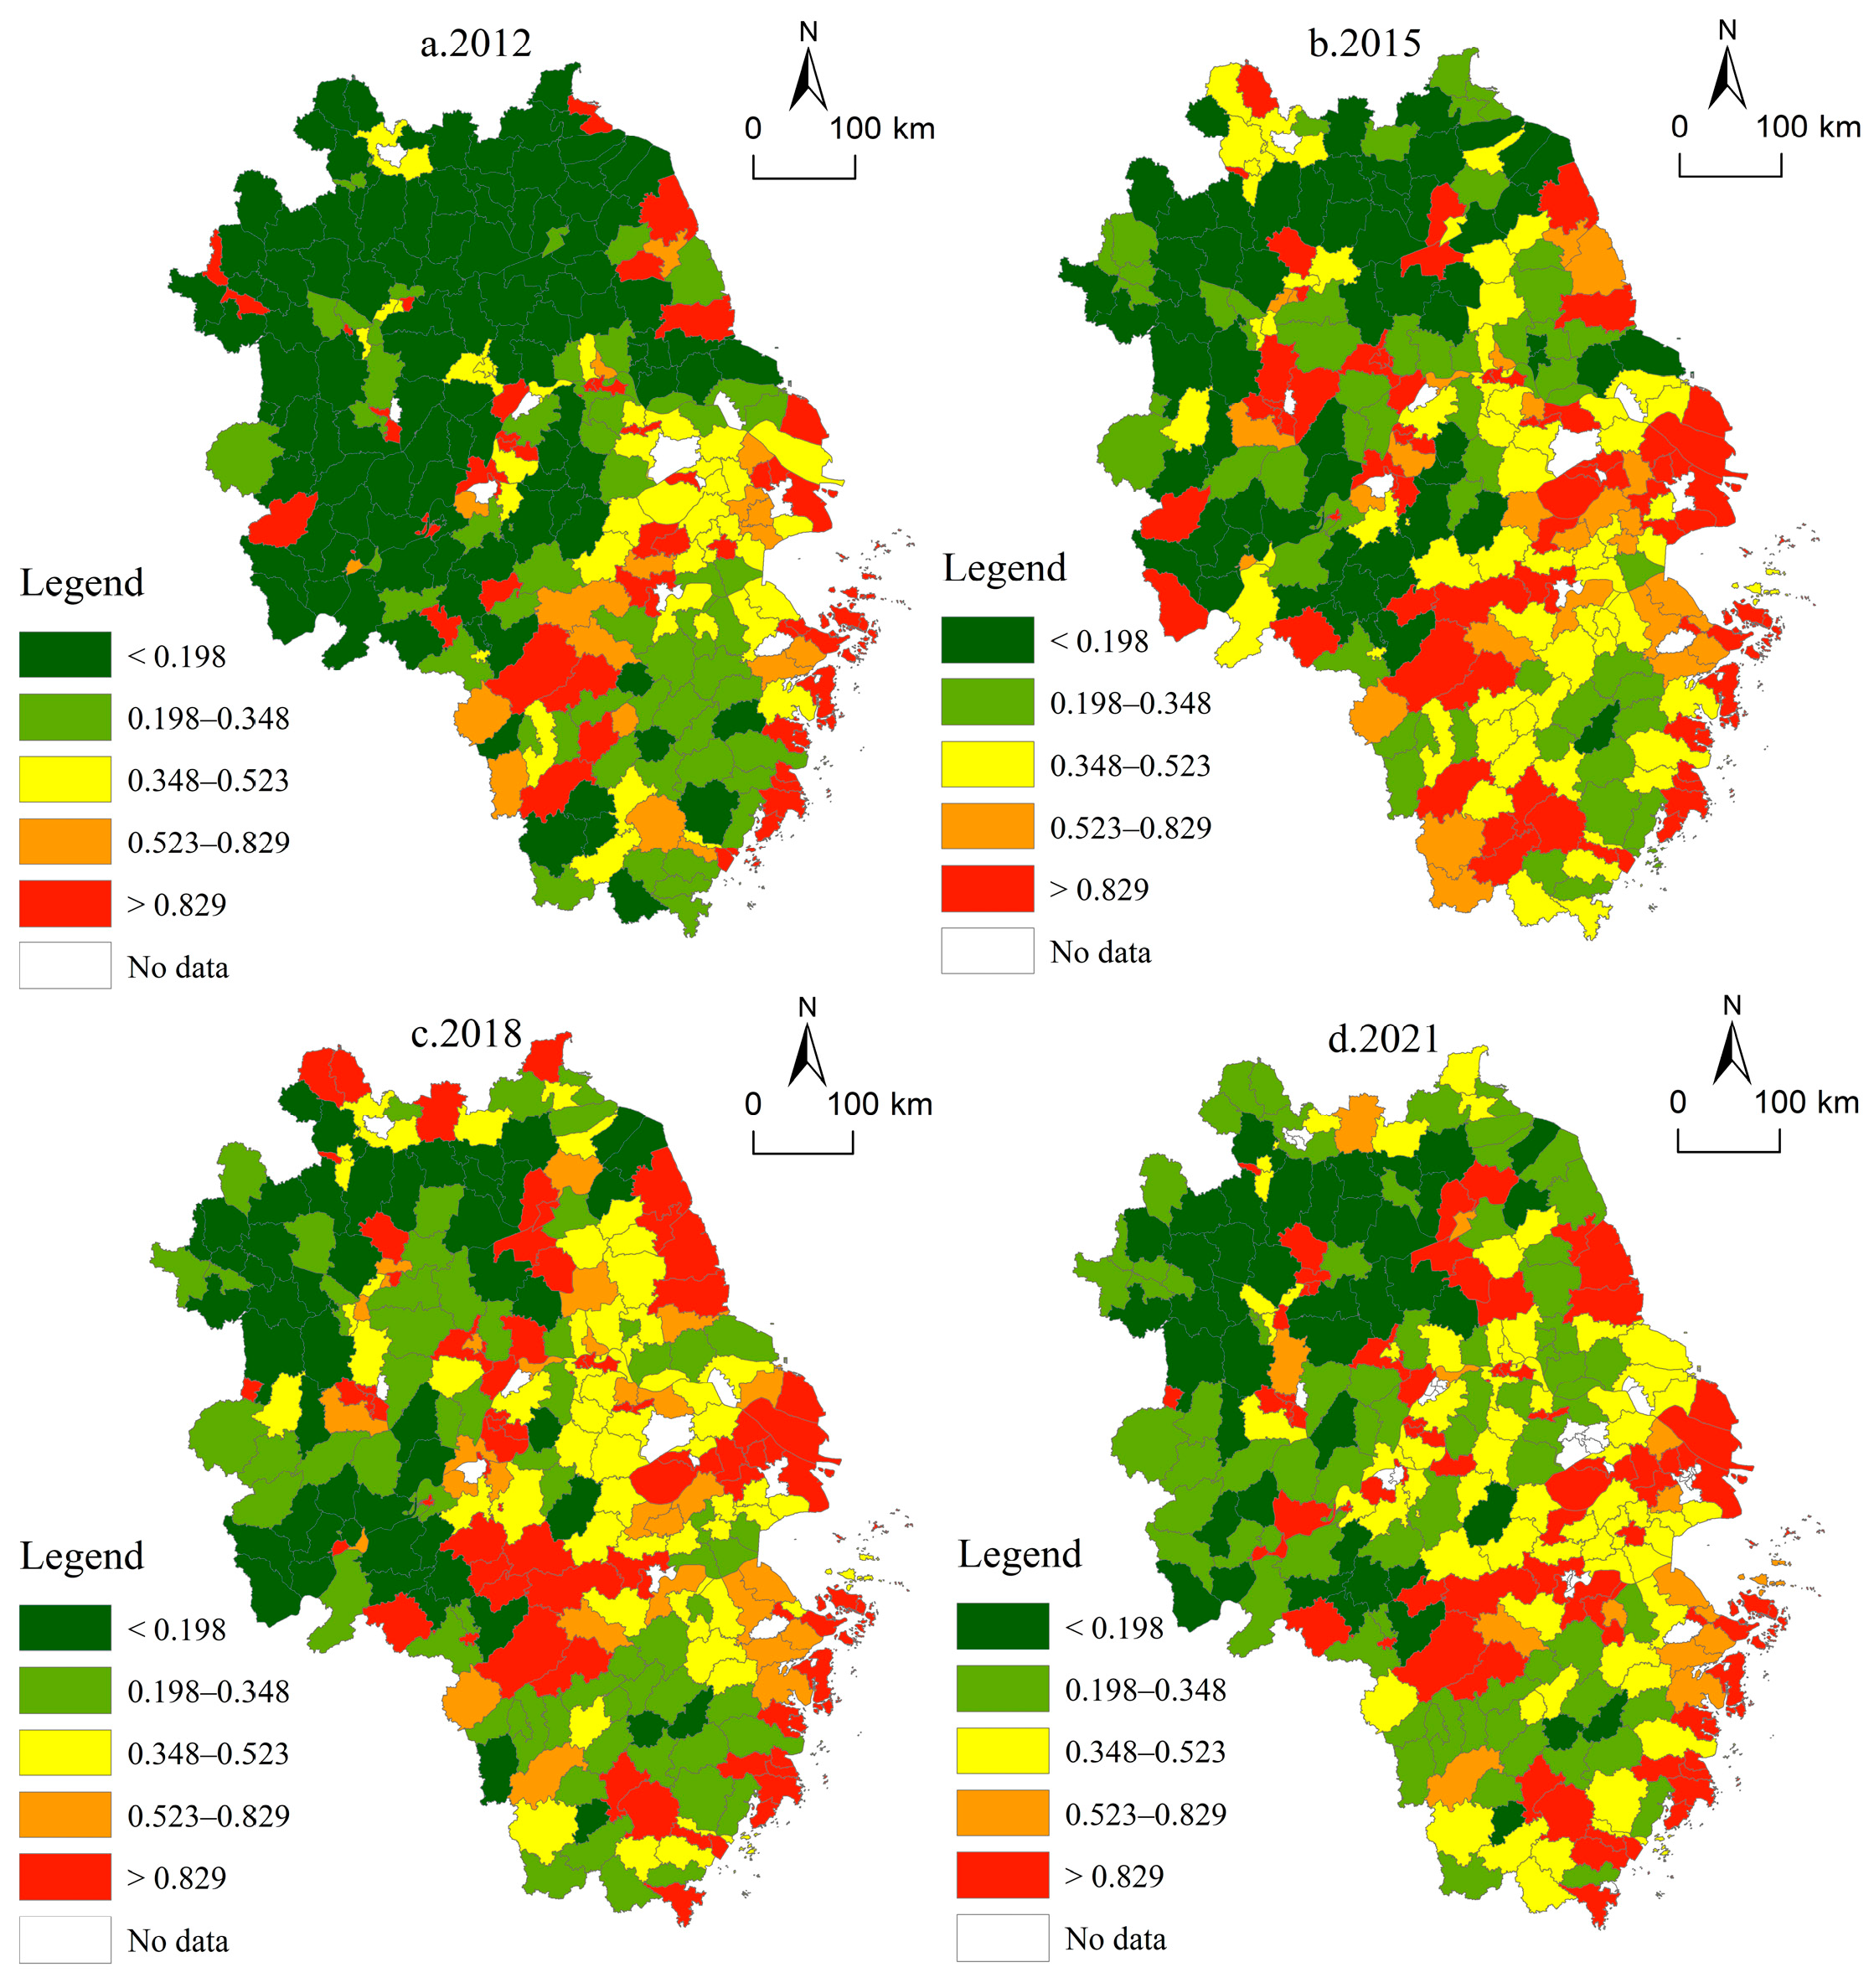
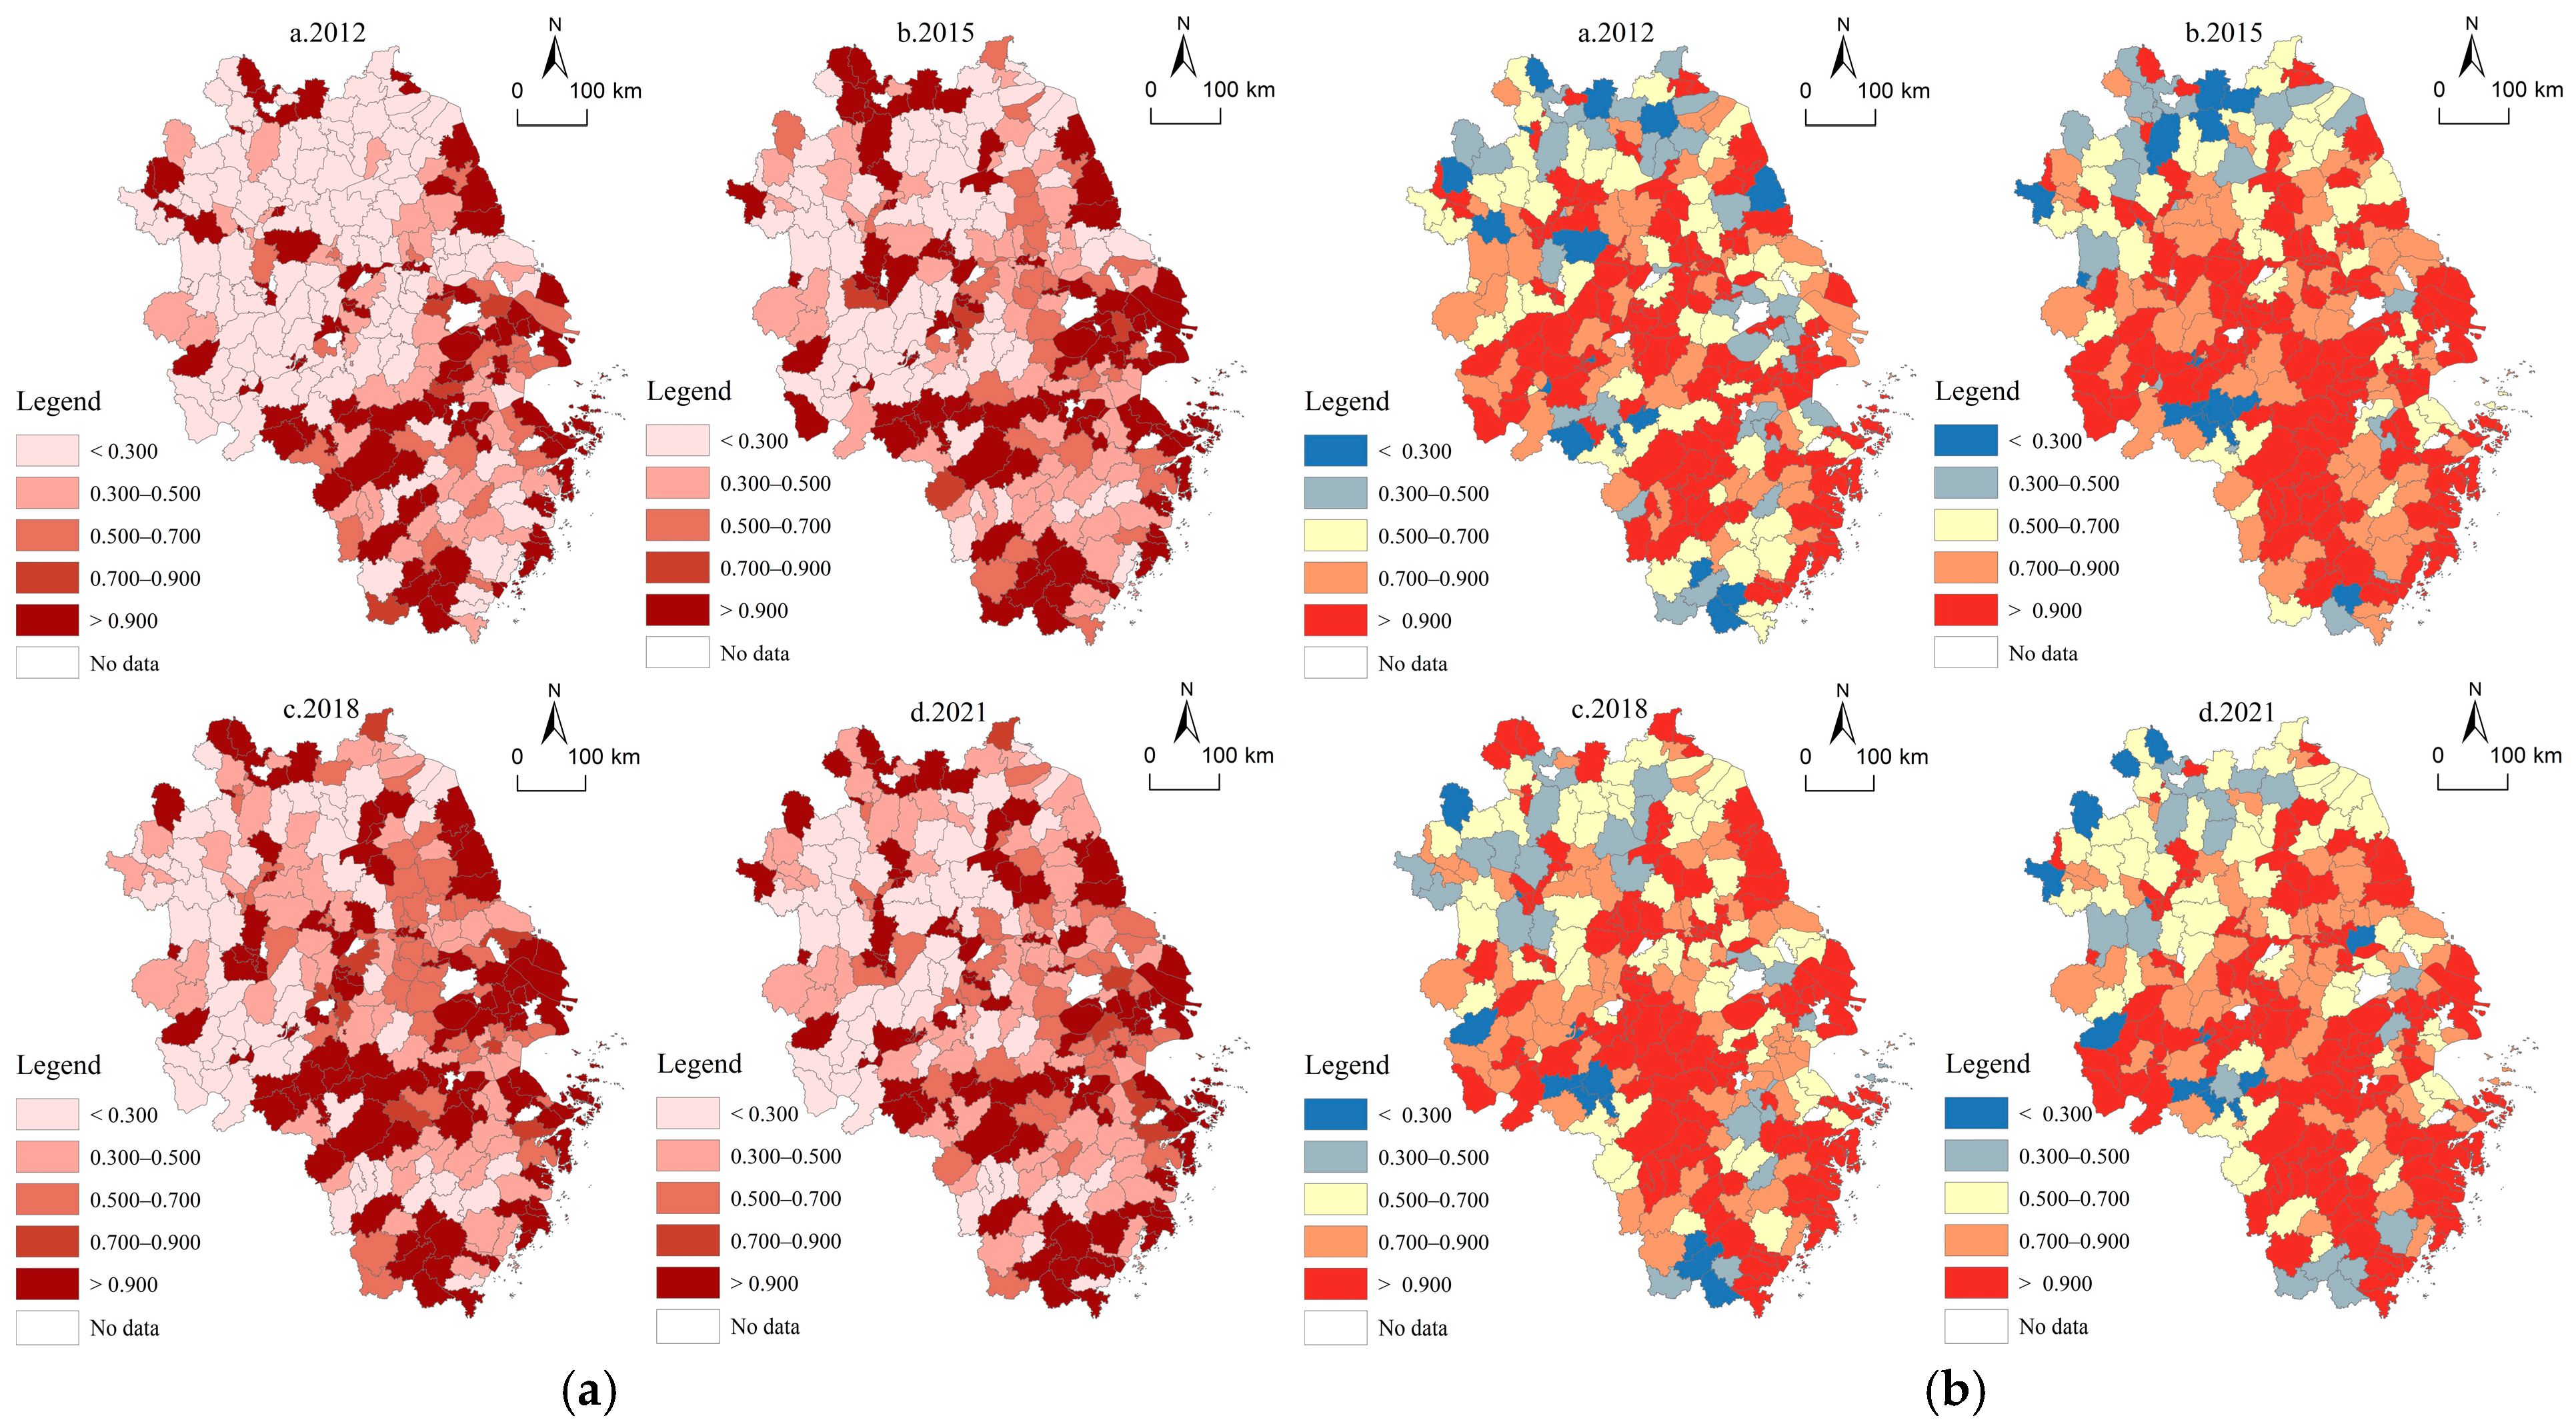
3.2. Spatial Differentiation Characteristics of RDE

3.2.1. Overall Distribution Characteristics

Using ArcGIS 10.6, the spatial distribution and evolutionary characteristics of RDE within the Yangtze River Delta were visually analyzed. Using the natural breaks method, RDE was classified into five levels: low efficiency (<0.198), relatively low efficiency (0.198–0.348), medium efficiency (0.348–0.523), relatively high efficiency (0.523–0.829), and high efficiency (>0.829). The RDE of the YRD exhibited prominent clustering characteristics, displaying a spatial distribution pattern characterized by higher efficiency in the southeast and lower efficiency in the northwest (Figure 4). The areas with high efficiency were generally concentrated around urban clusters, predominantly situated along coastal and lakeside regions, as well as in the suburbs of major cities. On the other hand, areas with low efficiency tended to be located on the outskirts of these high-efficiency zones, often at provincial boundaries, intersections, and remote areas. Over time, the spatial distribution of RDE underwent changes in different phases. In 2012, regions with high and relatively high efficiency were mainly concentrated in Shanghai and the surrounding northeastern Zhejiang, southern Jiangsu, and coastal areas, maintaining a leading position throughout the study period. A distinct “core–periphery” diffusion pattern emerged from this region, spreading outwards. Rural areas in the suburbs of large cities began to transition to modern, leisure-oriented urban villages earlier. By 2015 and 2018, areas with high and relatively high efficiency expanded further, with block-like distributions appearing in regions such as Hefei, Huai’an, and Lishui. Regions with medium efficiency spread from east to west and from the central part toward the northern and southern extremes, primarily located in central Zhejiang, central Jiangsu, southern Jiangsu, and northern Anhui. During this period, the implementation of rural-supportive policies in the YRD improved the rural landscape and increased farmers’ incomes. Resources from core cities diffused outwards, thereby enhancing the development structure of rural counties and significantly boosting RDE in most counties. The number of low-efficiency areas decreased dramatically, declining from 111 in 2012 to 52 by 2018. This reduction primarily occurred in southern and central Anhui, as well as northern Jiangsu. This was closely linked to the comprehensive efforts made by the national government to alleviate rural poverty in recent years. However, by 2021, the growth in RDE had stagnated, accompanied by significant declines in efficiency levels in regions such as Taizhou and Chuzhou. An analysis of the input–output ratio indicated that although rural resource investments increased in these areas, there was sluggish growth in rural output and farmers’ incomes. This suggests a resource mismatch and diminishing marginal effects of inputs, leading to a contiguous pattern of low efficiency developing across the northern YRD.

3.2.2. Characteristics of Decomposed Efficiency Distribution

To further elucidate the inherent mechanisms behind improvements in RDE, this analysis divides RDE into two components: PTE and SE. Building on prior research and taking the specific context into account [38], the PTE and SE of the YRD are grouped into five distinct levels: low efficiency (PTE/SE < 0.3), relatively low efficiency (0.3 ≤ PTE/SE < 0.5), medium efficiency (0.5 ≤ PTE/SE < 0.7), relatively high efficiency (0.7 ≤ PTE/SE < 0.9), and high efficiency (PTE/SE ≥ 0.9).
PTE indicates the extent of rational resource allocation within the input factors. Its spatial differentiation pattern closely aligns with that of RDE, displaying a positive correlation with regional economic development levels (Figure 5a). Over the study period, regions with high PTE were primarily situated in 67 counties, including core cities such as Shanghai, Hangzhou, and Ningbo. These areas exhibited minimal fluctuations and demonstrated significant stability. SE, on the other hand, represents the degree of scale aggregation in rural development and exhibits a distinct spatial concentration pattern (Figure 5b). In 2012, regions with high SE were mainly concentrated in 126 counties across southern Anhui, western Jiangsu, and northwestern Zhejiang, constituting 46% of the study area. Subsequently, the epicenter of high-value areas shifted southwards, with the area of high SE expanding further, resulting in a spatial distribution of SE characterized by “high in the south, low in the north”.
Overall, the average SE in the YRD is 0.790, significantly surpassing the average PTE of 0.623. This indicates that SE largely influences the region. Consequently, PTE emerges as a critical constraint on enhancing RDE. Therefore, the key to boosting RDE in the YRD lies in improving technical efficiency and promoting the development of new technologies, industries, and business models in rural areas.

3.2.3. Regional Disparity Characteristics

The Theil index and its decomposition were used to conduct a comprehensive analysis of the magnitude and trends of regional disparities in RDE in the YRD. As shown in Table 2, the Theil index for RDE in the YRD decreased from 0.425 in 2012 to 0.241 in 2021. This indicates that although the overall efficiency gap remains significant, the level of imbalance has progressively decreased. Analyzing the spatial disparity structure, from 2012 to 2015, variations in RDE were found to be primarily driven by differences within provinces. However, after 2015, interprovincial disparities emerged as the principal source, surpassing internal disparities.
The intraprovincial Theil index demonstrated a consistent decline, reflecting overall trends in disparities and decreasing significantly from 0.260 in 2012 to 0.093 in 2021, representing a 64% reduction. This considerable decline suggests that economic development has expanded from urban centers and the suburbs to the rural areas of counties, transitioning from a polarizing effect to a trickle-down effect, thus achieving initial success in promoting shared prosperity. In contrast, the interprovincial Theil index initially decreased and then increased, and by 2018, it had surpassed intraprovincial disparities, becoming the main driver of uneven development in RDE. This pattern can be attributed to Shanghai’s role as the core city within the YRD, which has a distinct hierarchical relationship with Zhejiang, Jiangsu, and Anhui, where there are still substantial interregional gaps. This indicates that the regional integration mechanisms within the YRD are still underdeveloped, with rural development primarily occurring within provincial boundaries, posing a challenge to the elimination of administrative barriers to facilitate the free flow of resources across regions. Although rural development is no longer persistently poor, the phenomenon of “better continuous improvement” persists.

3.3. Spatial Evolution Characteristics of RDE

As the rural market economy in the YRD evolves, the mobility of rural production factors is increasing. Consequently, there is a stronger spatial connection between neighboring rural developments, and the effects of location are becoming more pronounced. To examine the spatiotemporal evolution of RDE across different counties, this study first used global Moran’s I to visualize the spatial clustering of RDE in the YRD. The Moran’s I values for RDE in different years ranged from 0.221 to 0.331, all passing the 1% significance level test. This indicates that RDE in the YRD is not randomly distributed geographically; rather, it exhibits significant clustering. Furthermore, both traditional and spatial Markov transition probability matrices were constructed to compare their differences and investigate the relationships between the transition probabilities of county-level RDE and those in neighboring counties. Based on the aforementioned efficiency classification, RDE was divided into five states: low, relatively low, medium, medium-high, and high, represented by k = 1, 2, 3, 4, and 5, respectively. Transitions from lower to higher states were defined as upward transitions, while the reverse was considered a downward transition. Table 3 presents the traditional Markov transition probability matrix for the types of RDE in the YRD from 2012 to 2021. The specific analysis is as follows: (1) The RDE transition in the YRD demonstrates stability. This is indicated by consistently higher probabilities on the diagonal compared to those off the diagonal, suggesting short-term path dependency. (2) There is evidence of “club convergence” within RDE in the YRD. The probability values at both extremes of the diagonal are notably greater than those in the middle. This implies that counties at the lower and higher ends of the RDE spectrum are most likely to retain their current status in the subsequent phase, with retention probabilities of 53.23% and 79.68%, respectively. (3) The likelihood of “leapfrog” developments in RDE between adjacent time periods is relatively low. Transitions predominantly occur among adjacent categories. This finding corroborates, to some degree, that the evolution of rural development in the YRD continues to adhere to lifecycle theory.
Traditional Markov chains primarily focus on the internal transitions between types but neglect the influence of neighborhood levels on RDE. To address this issue, this study enhances the traditional Markov model by incorporating a spatial lag term. This approach develops a spatial Markov chain for RDE in the YRD, allowing for an examination of the spatial transition trends within different neighborhood contexts. As shown in Table 4, geographical spatial patterns significantly impact the RDE transition process within the YRD. The transition probabilities of RDE types undergo marked changes across different neighborhood contexts. The specific findings are as follows: (1) There is a significant synergy between county-level and regional RDE types. For example, during period t, when the number of neighboring counties is 1, the number of counties with low RDEs is notably greater than that of other types. (2) A spatial spillover effect exists in the RDE of the YRD, where the efficiency levels of neighboring counties influence one another. If a county is located in a neighborhood with low RDE, the probability of its RDE type transitioning downwards increases; conversely, if a county is adjacent to an area with high RDE, the probability of its RDE type transitioning upwards increases. For instance, under high-efficiency neighborhood conditions, RDE12|2(0.368) > RDE12(0.267), RDE23|4(0.356) > RDE23|3(0.0.347) > RDE23(0.328), and RDE34|5(0.333) > RDE34(0.146). This indicates a positive spillover effect from counties with high RDE.

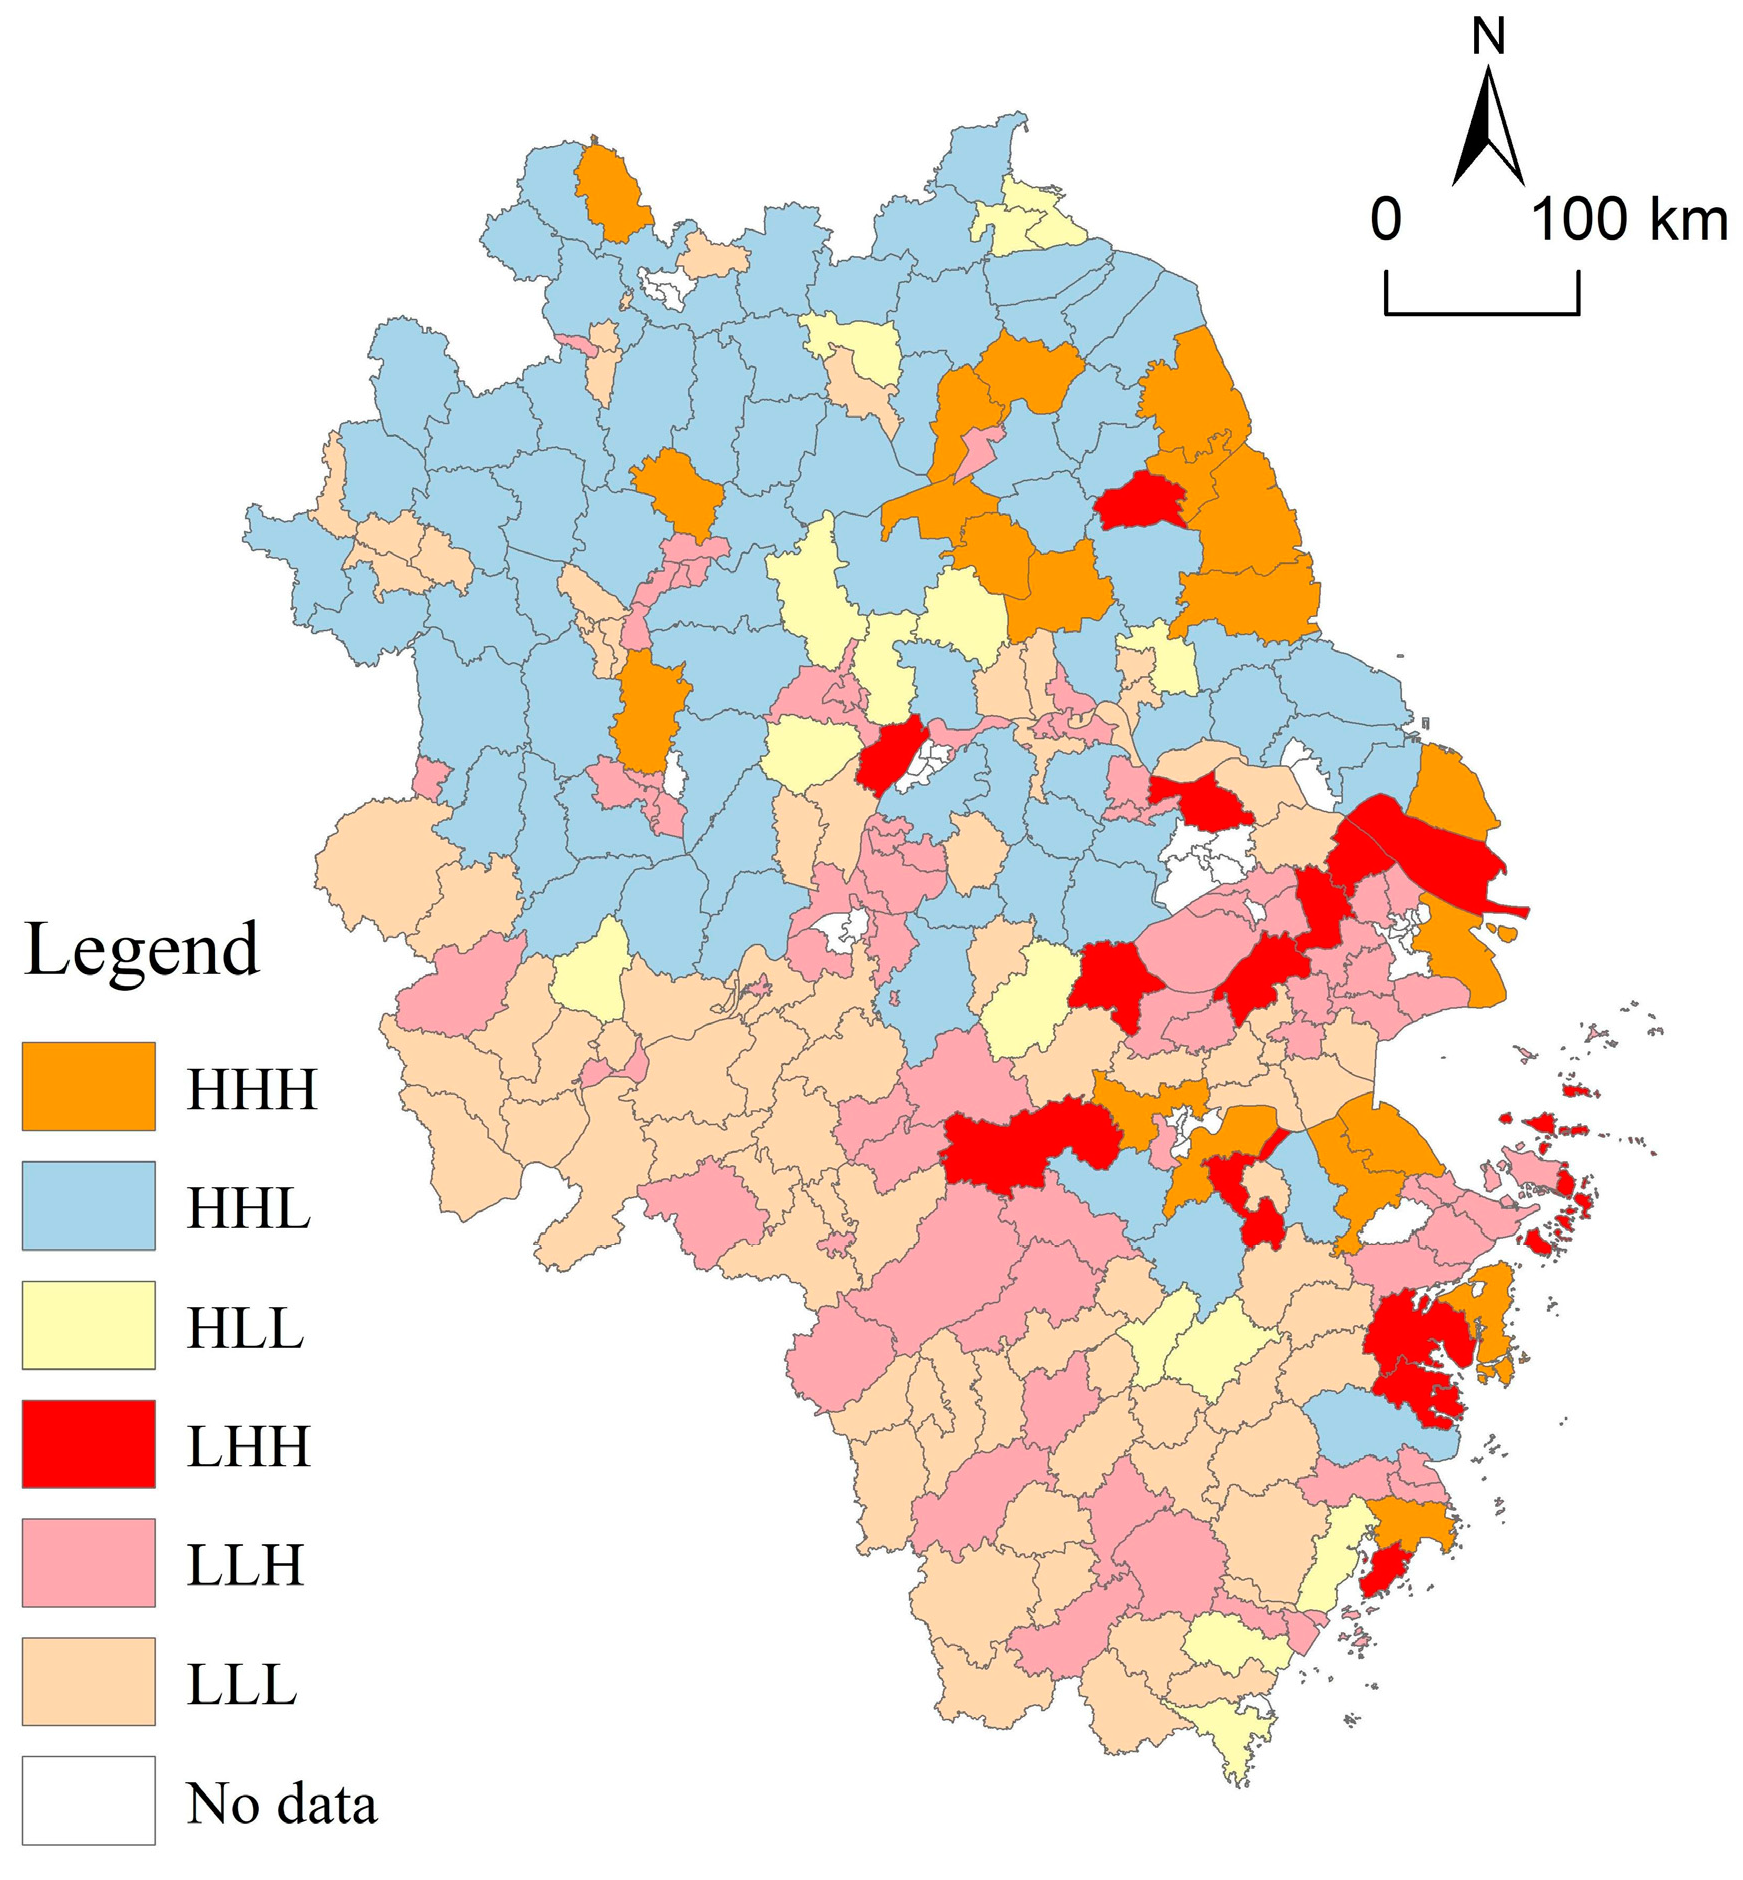
3.4. Classification of Rural Development Types

Different counties display varying industrial bases and levels of resource investment in rural areas. Therefore, accurately identifying development characteristics and regional disparities and strategically planning development pathways at the macro level are crucial for implementing rural revitalization strategies. This study classifies RDE in the county areas of the YRD from a three-dimensional perspective of “input–output–efficiency.” Using the entropy method, county-level rural development inputs and outputs are comprehensively assessed by their mean values. This approach, combined with the mean RDE, categorizes rural development types. In the dimensions of inputs and outputs, after standardizing the data, the entropy method objectively calculates the weights of input and output indicators (Table 5). Subsequently, counties in the top 50% in terms of inputs, outputs, and efficiency are classified as high-level counties. The counties within the YRD are categorized into six RDE types: high-input, high-output, high-efficiency (HHH); high-input, high-output, low-efficiency (HHL); high-input, low-output, low-efficiency (HLL); low-input, high-output, high-efficiency (LHH); low-input, low-output, high-efficiency (LLH); and low-input low-output, low-efficiency (LLL).
As depicted in Figure 6, the “HHH” category includes 20 counties, such as Pudong, Xiaoshan, and Yuyao. These counties exhibit high levels of economic development and possess the capacity to provide substantial rural resources, along with advantages in effectively converting outcomes. The “HHL” category is prevalent across 140 counties in northern Jiangsu, central Anhui, and northern Anhui. Despite significant resource input, these areas face limitations due to population outflow, underdeveloped agricultural modernization, and a homogeneous industrial structure, collectively resulting in lower RDE. The “HLL” category includes 15 counties, such as Dongyang and Guangde. Despite substantial investments, these areas suffer from low rural resource utilization rates. Conversely, the “LLH” category includes 15 counties, such as Kunshan, Lin’an, and Changxing. These regions leverage technical efficiency to drive the transformation and sustainable development of their rural industrial structures. The “LHH” category comprises 73 counties situated in the suburbs of major cities. These areas exploit locational advantages to develop distinctive industries, such as modern agriculture and specialty tourism, adjacent to urban centers, facilitating efficient rural development. Finally, the “LLL” category is concentrated in 80 counties in central and southern Zhejiang and southern Anhui. These counties potentially encounter challenges, such as mismatches in rural resource supply and demand and incomplete industrial structures.

4. Discussion

4.1. Characteristics of RDE

The spatial pattern of RDE in the YRD exhibits distinct uneven development characteristics. This non-equilibrium development pattern is particularly noticeable in economically advanced coastal areas heavily influenced by urbanization and industrialization, where rural transformation has rapidly shifted focus from quantity-driven growth to quality improvement. This indicates that the RDE and characteristics of each region generally correspond with its spatial location and economic foundation [39]. However, as rural resource inputs continue to rise, some areas are experiencing declining RDE, a trend seen in other studies as well [40,41]. This decline is mainly due to inefficient resource allocation stemming from inappropriate rural industrial structures. Additionally, this study identifies PTE as a critical factor limiting improvements in RDE. Many rural operations still operate under the paradigm of “economies of scale”, with redundant rural investments heavily relying on traditional resource consumption and scale-based investments, consistent with findings by Cao et al. [42]. Hence, there is an ongoing need to optimize rural industrial structures to enhance resource utilization efficiency. Innovation and technological advancements are essential for fostering deeper integration among elements, thus achieving synergies between rural economies of scale and technical efficiency.
Comparisons between traditional and spatial Markov matrices reveal that geographic spatial patterns play a crucial role in the transfer of RDE within the YRD. There is evidence of spatial spillover effects in RDE, which aligns with the findings of Hou and Yao [11]. Against the backdrop of marketization and an open economy, a unified market enhances the mobility of production factors between rural areas and other regions. The digital economy in rural areas further dismantles the spatial constraints of traditional economic activities, enhancing economic interconnectedness among regions [43]. Therefore, neighboring counties with different geographical backgrounds should establish robust mechanisms for rural economic linkage. Through cooperative strategies such as “strong–strong partnerships” and “leading the weak”, RDE can be effectively enhanced.

4.2. Policy Implications

Rural development should comprehensively consider the total quantity, quality, structure, and intensity of regional resource elements for scientific planning, enhancing collaborative development between rural areas across regions. By utilizing differences in the efficiency gradient potential between neighboring counties, efforts should be intensified to pair and support “city-to-city” and “village-to-village” initiatives. This approach leverages the geographical advantages and driving effects of high-efficiency counties, while low-efficiency counties expand their openness to attract talent, technology, and other advantageous resources, thereby enhancing spatial resource exchanges across systems.
Furthermore, rural development should continue to increase investments in agricultural production, infrastructure, and operational management to capitalize on the dividends brought by years of resource and technological inputs. Simultaneously, fostering innovation and promoting deep integration among elements through technology advancements will enhance the quality and efficiency of rural industrial development resource supply systems. This shift aims to transition rural development from being driven by factors and investments toward efficiency and technology-driven approaches.
Lastly, the rural development path is formulated by division and classification. Based on the characteristics of rural development types and considering factors such as county geographical location, resource endowment, economic foundation, and urban–rural development conditions, three types of rural development regions and corresponding paths are proposed: (1) Rural leading demonstration areas. This region type includes counties classified under “HHH”, “LLH”, and “LHH” RDE, primarily located in Shanghai, northeastern Zhejiang, southern Jiangsu, and coastal areas. These regions exemplify high RDE, leveraging the economic advantages and policies of urban and coastal areas. The focus is on creating diverse and specialized rural development models, emphasizing rural institutional innovation and technological breakthroughs, as well as demonstrating best practices. (2) Rural transformation areas. This region type encompasses counties characterized by “LLL” rural development types, where rural resource input levels are low and resource conversion rates are inadequate. Efforts in this area should concentrate on increasing investment in rural agriculture production, management, and innovation to enhance industrial integration and resource efficiency. Additionally, they should aim to amplify urban spillover effects, transforming rural areas into attractive “gravitational fields” for resources. (3) Rural resource-constrained areas. This region type includes counties with “HHL” and “HLL” rural development types, primarily focusing on grain production in the YRD. These areas typically feature a relatively singular rural industrial system and employment structure. Strategies here should capitalize on robust agricultural resources to develop a low-input, high-yield, and high-quality agricultural production system. Simultaneously, emphasis should be placed on fostering rural town economies, increasing policy support, and comprehensively addressing rural development deficiencies to elevate overall rural development levels.

5. Conclusions

In this study, 273 county units in the YRD were examined by developing a comprehensive index system to evaluate RDE. By employing the superefficiency SBM model to measure RDE and incorporating analytical tools such as the Theil index and spatial Markov chains, the temporal evolution and spatial distribution trends of RDE from 2012 to 2021 were investigated. In this study, the types of rural development were categorized, and differentiated development pathways for rural areas were proposed. The findings indicated that RDE in the YRD initially showed an upward trend, followed by stabilization, with reduced regional disparities but still at relatively low overall levels. Significant potential for resource conservation and technological advancement was identified. Spatially, RDE exhibited a “high in the southeast, low in the northwest” distribution pattern, decreasing outward from Shanghai, northeast Zhejiang, southern Jiangsu, and coastal areas, illustrating a “core–periphery” structure. PTE emerged as a critical constraint on improving RDE in the YRD region. Furthermore, the findings highlighted the stability of RDE, and a phenomenon of “club convergence” was observed. Geographical spatial patterns played a crucial role in the transfer of RDE within the YRD region, showing evident spatial spillover effects. From the “input–output–efficiency” tri-dimensional perspective, RDE in the county areas of the YRD can be categorized into six groups, namely, high–high–high, high–high–low, high–low–low, low–high–high, low–low–high, and low–low–low, thus putting forward differentiated development paths.
Several limitations are acknowledged, as this study serves as an exploratory investigation. First, the selection of indicators for assessing RDE from an input–output perspective is subject to data availability constraints. Future research should work toward refining these indicators, enhancing the comprehensiveness and accuracy of the data, and extending the time series for a more comprehensive evaluation. Second, there were length restrictions for this paper; thus, future studies should analyze the factors influencing RDE in greater detail and examine the underlying mechanisms involved.

Author Contributions

Conceptualization, Y.W. and X.C.; methodology, X.C.; software, Y.W.; validation, Y.W.; formal analysis, X.C.; writing—original draft preparation, X.C.; writing—review and editing, Y.W. All authors have read and agreed to the published version of the manuscript.

Funding

This research received financial support from the Key Project of the National Social Science Foundation of China (21FGLA002) and the Cultivation of Leading Talents in Planning of Philosophy and Social Sciences in Zhejiang Province (24QNYC08ZD).

Institutional Review Board Statement

Not applicable.

Informed Consent Statement

Not applicable.

Data Availability Statement

The data that support the findings of this study are available from the websites described in the Data Sources Section 2.4.2.

Acknowledgments

Special thanks are given to the editor and the anonymous reviewers for their insightful comments.

Conflicts of Interest

The authors declare that they have no known competing financial interests or personal relationships that could have appeared to influence the work reported in this paper.

References

  1. Shen, M.; Shen, J. State-led commodification of rural China and the sustainable provision of public goods in question: A case study of Tangjiajia, Nanjing. J. Rural Stud. 2022, 93, 449–460. [Google Scholar] [CrossRef]
  2. Yang, G.; Zhuang, H.; Tian, G.; Miao, G. The Logic of Realizing Endogeous Sustainable Development of Rural Economy: An Experience Inspecton Based on Z Town in Jiangsu Province. Issues Agric. Econ. 2023, 6, 121–134. [Google Scholar] [CrossRef]
  3. Ayenew, H.Y.; Estruch, E.; Sauer, J.; Abate-Kassa, G.; Schickramm, L.; Wobst, P. Decent rural employment and farm production efficiency: Empirical evidence from Tanzania and Ethiopia. Agric. Econ. 2017, 48, 587–596. [Google Scholar] [CrossRef]
  4. Farrell, M.J. The measurement of productive efficiency. J. R. Stat. Soc. 1957, 120, 253–278. [Google Scholar] [CrossRef]
  5. Picazo-Tadeo, A.J.; Gómez-Limón, J.A.; Reig-Martínez, E. Assessing farming eco-efficiency: A data envelopment analysis approach. J. Environ. Manag. 2011, 92, 1154–1164. [Google Scholar] [CrossRef] [PubMed]
  6. Drall, A.; Mandal, S.K. Non-farm income and environmental efficiency of the farmers: Evidence from India. Heliyon 2024, 10, e30804. [Google Scholar] [CrossRef] [PubMed]
  7. Li, T.; Liu, J.; Zhu, H.; Zhang, S. Business characteristics and efficiency of rural tourism enterprises: An empirical study from China. Asia Pac. J. Tour. Res. 2018, 23, 549–559. [Google Scholar] [CrossRef]
  8. Walker, N.L.; Norton, A.; Harris, I.; Williams, A.P.; Styles, D. Economic and environmental efficiency of UK and Ireland water companies: Influence of exogenous factors and rurality. J. Environ. Manag. 2019, 241, 363–373. [Google Scholar] [CrossRef] [PubMed]
  9. Stępień, S.; Czyżewski, B.; Sapa, A.; Borychowski, M.; Poczta, W.; Poczta-Wajda, A. Eco-efficiency of small-scale farming in Poland and its institutional drivers. J. Clean. Prod. 2021, 279, 123721. [Google Scholar] [CrossRef]
  10. Zhang, Q.; Qu, Y.; Zhan, L. Great transition and new pattern: Agriculture and rural area green development and its coordinated relationship with economic growth in China. J. Environ. Manag. 2023, 344, 118563. [Google Scholar] [CrossRef]
  11. Hou, M.; Yao, S. Spatial-temporal evolution and trend prediction of agricultural eco-efficiency in China: 1978–2016. Acta Geogr. Sin. 2018, 73, 2168–2183. [Google Scholar] [CrossRef]
  12. Long, H.; Zou, J.; Liu, Y. Differentiation of rural development driven by industrialization and urbanization in eastern coastal China. Habitat Int. 2009, 33, 454–462. [Google Scholar] [CrossRef]
  13. Wu, Q.; Ye, J.; Chen, Y. The spatial differentiation of rurality in developed coastal regions of eastern China based on rural revitalization: The case of Zhejiang Province. Sci. Geogr. Sin. 2022, 42, 466–475. [Google Scholar] [CrossRef]
  14. Jiang, Y.; Pan, Z.; Pan, M. Spatial variation and strategic pattern optimization of operation efficiency of rural tourism in Chongqing. Resour. Sci. 2016, 38, 2181–2191. [Google Scholar] [CrossRef]
  15. Forleo, M.B.; Giaccio, V.; Mastronardi, L.; Romagnoli, L. Analysing the efficiency of diversified farms: Evidences from Italian FADN data. J. Rural Stud. 2021, 82, 262–270. [Google Scholar] [CrossRef]
  16. Yang, Y.; Ma, H.; Wu, G. Agricultural green total factor productivity under the distortion of the factor market in China. Sustainability 2022, 14, 9309. [Google Scholar] [CrossRef]
  17. Mergoni, A.; Dipierro, A.R.; Colamartino, C. European agricultural sector: The tortuous path across efficiency, sustainability and environmental risk. Socio-Econ. Plan. Sci. 2024, 92, 101848. [Google Scholar] [CrossRef]
  18. Xiao, P.; Xu, J.; Yu, Z.; Qian, P.; Lu, M.; Ma, C. Spatiotemporal pattern differentiation and influencing factors of cultivated land use efficiency in Hubei Province under carbon emission constraints. Sustainability 2022, 14, 7042. [Google Scholar] [CrossRef]
  19. Lobley, M.; Potter, C. Agricultural change and restructuring: Recent evidence from a survey of agricultural households in England. J. Rural Stud. 2004, 20, 499–510. [Google Scholar] [CrossRef]
  20. Tobler, W.R. A computer movie simulating urban growth in the Detroit Region. Econ. Geogr. 1970, 46, 234–240. [Google Scholar] [CrossRef]
  21. Tone, K. A slacks-based measure of efficiency in data envelopment analysis. Eur. J. Oper. Res. 2001, 130, 498–509. [Google Scholar] [CrossRef]
  22. Zhang, W.; Bao, S. Created unequal: China’s regional pay inequality and its relationship with mega-trend urbanization. Appl. Geogr. 2015, 61, 81–93. [Google Scholar] [CrossRef]
  23. Le Gallo, J. Space-time analysis of GDP disparities among European regions: A Markov chains approach. Int. Reg. Sci. Rev. 2004, 27, 138–163. [Google Scholar] [CrossRef]
  24. Wei, Y.; Liao, F. Dynamics, space, and regional inequality in provincial China: A case study of Guangdong province. Appl. Geogr. 2012, 35, 71–83. [Google Scholar] [CrossRef]
  25. Rey, S.J.; Montouri, B.D. US regional income convergence: A spatial econometric perspective. Reg. Stud. 1999, 33, 143–156. [Google Scholar] [CrossRef]
  26. Liu, Y.; Zhou, Y.; Li, Y. Rural regional system and rural revitalization strategy in China. Acta Geogr. Sin. 2019, 74, 2511–2528. [Google Scholar]
  27. Zhang, Z.; Liao, X.; Li, C.; Yang, C.; Yang, S.; Li, S. Spatio-temporal characteristics of agricultural eco-efficiency and its determinants in Hunan Province. Econ. Geogr. 2022, 42, 181–189. [Google Scholar] [CrossRef]
  28. Tian, Y.; Huang, J.; An, M. Evaluation on the efficiency of agricultural modernization under the rural revitalization strategy: Based on the combined analysis of Super-efficiency DEA and comprehensive entropy method. Issues Agric. Econ. 2021, 3, 100–113. [Google Scholar] [CrossRef]
  29. Jiang, P.; Yang, Y.; Hao, L. Study on rural tourism in the outer suburban areas of beijing: Efficiency evaluation and its influency factors. Chin. J. Agric. Resour. Reg. Plan. 2023, 44, 198–205. [Google Scholar]
  30. Ma, W.; Liu, T.; Li, W.; Yang, H. The role of agricultural machinery in improving green grain productivity in China: Towards trans-regional operation and low-carbon practices. Heliyon 2023, 9, e20279. [Google Scholar] [CrossRef]
  31. Khurana, T.; Sangita, S. Household access to electricity and non-farm business in rural India: A panel data analysis. Energy Sustain. Dev. 2022, 67, 125–134. [Google Scholar] [CrossRef]
  32. Zheng, D.; Hao, S.; Sun, C. Evaluation of Agricultural Ecological Efficiency and Its Spatial- temporal Differentiation Based on DEA-ESDA. Sci. Geogr. Sin. 2018, 38, 419–427. [Google Scholar] [CrossRef]
  33. Henderson, J.V.; Storeygard, A.; Weil, D.N. Measuring economic growth from outer space. Am. Econ. Rev. 2012, 102, 994–1028. [Google Scholar] [CrossRef]
  34. Xu, K.; Fang, Y.; Zhou, Y. Spatial differentiation of rural functions from the perspective of production-living-ecological functions at the township level: Acase study of Shandong Province. Prog. Geogr. 2023, 42, 644–656. [Google Scholar] [CrossRef]
  35. Sun, H.; Liang, H.; Chang, X.; Cui, Q.; Tao, Y. Land use patterns on carbon emission and spatial association in China. Econ. Geogr. 2015, 35, 154–162. [Google Scholar] [CrossRef]
  36. Yang, K.; Zhang, Y.; Zhao, X.; Wen, Q.; Zhong, T. Temporal and spatial characteristics and influencing factors of structural efficiency of rural land use. Prog. Geogr. 2019, 38, 1393–1402. [Google Scholar] [CrossRef]
  37. Chen, Z.; Yu, B.; Yang, C.; Zhou, Y.; Qian, X.; Wang, C.; Wu, B.; Wu, J. An extended time-series (2000–2018) of global NPP-VIIRS-like nighttime light data from a cross-sensor calibration. Earth Syst. Sci. Data Discuss. 2020, 2020, 1–34. [Google Scholar] [CrossRef]
  38. Han, Z.; Cao, X.; Di, G. Spatial-temporal evolution of infrastructure investment efficiency and its correlation pattern based on the empirical study of prefecture-level cities in China. Sci. Geogr. Sin. 2021, 41, 941–950. [Google Scholar] [CrossRef]
  39. Long, H.; Liu, Y.; Zou, J. Assessment of Rural Development Types and Their Rurality in Eastern Coastal China. Acta Geogr. Sin. 2009, 64, 426–434. [Google Scholar]
  40. Shi, Z.; Wang, R. Research on the coupling coordination relationship between agricultural. J. Arid Land Resour. Environ. 2024, 38, 1–12. [Google Scholar] [CrossRef]
  41. Tian, M.; Huang, Y.; Wang, F.; Liu, Y.; Liu, C.; Meng, X. The Threshold Effect of Rural Tourism in Poverty Reduction in Underdeveloped Areas: Based on Panel Data of 15 Underdeveloped Counties in Anhui Province. For. Econ. 2022, 44, 65–81. [Google Scholar] [CrossRef]
  42. Cao, F.; Hang, Z.; Xu, M.; Wang, K. Spatial-temporal pattern and influencing factors of tourism efficiency and the decomposition efficiency in Chinese scenic areas: Based on the Bootstrap-DEA method. Geogr. Res. 2015, 34, 2395–2408. [Google Scholar]
  43. Meng, W.; Zhang, G.; Zhao, F. Digital Economy Empowers Rural Revitalization: Influencing Mechanisms and Spatial Effects. Res. Financ. Econ. Issues 2023, 3, 32–44. [Google Scholar] [CrossRef]
Figure 1. Research framework.
Sustainability 16 06543 g001
Figure 2. Effect mechanism of RDE.
Sustainability 16 06543 g002
Figure 3. RDE and regional disparity in the YRD.
Sustainability 16 06543 g003
Figure 4. The spatial distribution of RDE in the YRD.
Sustainability 16 06543 g004
Figure 5. (a) The spatial distribution of the PTE of rural development in the YRD; (b) the spatial distribution of the SE of rural development in the YRD.
Sustainability 16 06543 g005
Figure 6. Rural development types at the county scale in the YRD.
Sustainability 16 06543 g006
Table 1. Evaluation index system of RDE.
DimensionsIndicatorsIndicator DescriptionUnit
InputLand inputRural land areakm2
Labor inputNumber of rural employeesPeople/year
Capital inputExpenditures for agriculture, forestry, and water affairsCNY 10,000
Total power of agricultural machinery1000 kW
Rural electricity consumption10,000 kWh
Desirable outputEconomic effectsNight light index/
Agricultural, forestry, fishery, and livestock production valuesCNY 10,000
Social effectsPer capita disposable income of rural permanent residentsCNY
Undesirable outputEnvironmental pollutionCarbon emissions from land use10,000 ton
Table 2. Theil index and contribution rate of RDE in the YRD.
YearAggregate Thiel IndexIntraprovincial Theil IndexInterprovincial Theil IndexIntraprovincial Theil Index Decomposition
ShanghaiJiangsuZhejiangAnhui
20120.4250.258
(60.65%)
0.167
(39.33%)
0.066
(3.35%)
0.512
(12.26%)
0.209
(26.14%)
0.569
(16.90%)
20150.2790.148
(53.14%)
0.131
(46.86%)
0.385
(3.35%)
0.299
(14.02%)
0.146
(19.61%)
0.376
(16.16%)
20180.2460.103
(40.80%)
0.131
(58.20%)
0.093
(2.12%)
0.209
(12.93%)
0.177
(13.79%)
0.338
(12.97%)
20210.2410.094
(39.06%)
0.147
(60.94%)
0.073
(2.03%)
0.227
(10.66%)
0.159
(14.16%)
0.317
(12.14%)
Table 3. The Markov transition probability matrix of RDE in the YRD from 2012 to 2021.
t/t + 1n12345
12250.6040.2670.0580.0090.062
21170.0790.5200.3280.0280.045
31510.0070.2050.5170.1460.126
4740.0000.0410.2840.3920.283
51920.0310.0680.0520.0630.786
Table 4. The spatial Markov transition probability matrix of RDE in the YRD from 2012 to 2021.
Neighborhood Typet/t + 1n12345
11880.6590.2050.0910.0000.045
2210.2860.4290.2380.0000.048
370.0000.0000.7140.1430.143
410.0000.0000.0000.0001.000
5110.1820.4550.0000.0000.364
21680.4710.3680.0440.0150.103
2610.0660.5250.3280.0330.049
3170.0000.3530.2350.1180.294
420.0000.0000.0000.5000.500
5210.0000.0480.0480.0480.857
31550.7090.2180.0360.0180.018
2490.0200.5310.3470.0410.061
3520.0190.2310.5190.1350.096
4220.0000.0450.2270.3640.364
5380.0000.0530.0530.0790.816
41110.4550.4550.0000.0000.091
2450.0670.5330.3560.0220.022
3670.0000.1940.5520.1340.119
4410.0000.0490.3410.3900.220
5810.0120.0620.0620.0740.790
5100.0000.0000.0000.0000.000
210.0001.0000.0000.0000.000
360.0000.0000.6670.3330.000
460.0000.0000.3330.5000.167
5330.0000.0000.0300.0610.909
Table 5. Index weight of rural development type classification.
DimensionsIndicatorsIndicator DescriptionIndex Weight
InputLand inputRural land area (km2)0.151
Labor inputNumber of rural employees (people/year)0.135
Capital inputExpenditures for agriculture, forestry, and water affairs (CNY 10,000)0146
Total power of agricultural machinery (1000 kW)0.246
Rural electricity consumption (10,000 kWh)0.323
Desirable outputEconomic effectsNight light index0.527
Agricultural, forestry, fishery, and livestock production values (CNY 10,000)0.300
Social effectsPer capita disposable income of rural permanent residents (CNY)0.144
Undesirable outputEnvironmental pollutionCarbon emissions from land use (10,000 tons)0.294
Disclaimer/Publisher’s Note: The statements, opinions and data contained in all publications are solely those of the individual author(s) and contributor(s) and not of MDPI and/or the editor(s). MDPI and/or the editor(s) disclaim responsibility for any injury to people or property resulting from any ideas, methods, instructions or products referred to in the content.

