Article

Optimization Design Methods for Thermal Environment Problems in Chinese University Teaching Buildings at Various Periods

1
Northwest Research Institute of Engineering Investigations and Design, Xi’an 710003, China
2
School of Architecture, Chang’an University, Xi’an 710061, China
3
Guangdong Architectural Design & Research Institute Co., Ltd., Guangzhou 510010, China
*
Author to whom correspondence should be addressed.
Sustainability 2024, 16(15), 6547; https://doi.org/10.3390/su16156547
Submission received: 9 June 2024 / Revised: 24 July 2024 / Accepted: 25 July 2024 / Published: 31 July 2024

Abstract

:
Chinese universities have gone through three periods of centralized construction and significant differences in the design of teaching buildings in different periods may cause various thermal environment problems. This study takes a city in a cold region in northern China as an example and selects three teaching buildings built during three concentrated construction periods: 1950s to 1960s, 1980s to 1990s, and early 21st century as common cases. Based on field research, thermal environment measurement, APMV and PMV-PPD evaluation, and DeST simulation methods, it was found that the average summer APMV of the three teaching buildings was 1.37, indicating poor thermal comfort. In winter, the ambient temperature of the classrooms was below 18 °C for about 30% to 40% of the whole year, the average PMV value was −2.36, and the PPD value was obtained as 83.28%, far exceeding the standard requirements. The obtained results form a design strategy to optimize the thermal environment of teaching buildings. By considering the teaching building of historical architecture from the 1950s to 1960s as an example, the optimization design was carried out from three aspects to improve the indoor thermal environment and reduce the building’s cooling and heating load. The cumulative load of the building throughout the year was reduced by 21%, the cumulative heat load was reduced by 28.3%, and the cumulative cooling load was reduced by 10.1%. This research is anticipated to be of great reference significance for enhancing the thermal comfort of existing buildings, promoting energy conservation, and reducing carbon emissions. At the same time, it contributes to the protection and optimal use of historical buildings.

1. Introduction

The scale of China’s construction industry is constantly expanding and its energy consumption is constantly increasing. The “2023 China Building Energy Efficiency Annual Development Research Report” indicates that in 2021, the ratio of building energy consumption to total energy consumption was about 21%, and the ratio of carbon dioxide emissions related to building operations to total emissions was 22% [1]. Energy conservation and reducing greenhouse gas emissions are essential in the construction industry. Only by achieving low-carbon and energy-saving goals can we completely overcome the problem of fossil energy shortage and achieve sustainable energy development.
With the rapid development of China’s higher education industry, the scale of higher education institutions continues to expand and the building area continues to increase. The Chinese government has issued policy documents such as the “Implementation Plan for Green and Low-Carbon Development of the National Education System”, which suggests incorporating green and low-carbon development into the national education system [2]. In recent years, universities have become a crucial member of the promotion of building energy saving. The construction of Chinese universities has gone through three periods to adapt to changes in demand: the construction period in the 1950s and 1960s, the education revitalization, university consolidation, the enrollment expansion period in the 1980s and 1990s, and the construction period of new campuses and university towns in the 21st century [3]. The teaching building occupies a large part of the university campus and students spend most of their time in it. The significant differences in the design of teaching buildings in various periods may lead to diverse thermal environment problems. Solving thermal environment problems in buildings is of great implication in improving user comfort and promoting building energy efficiency. Therefore, by studying the relationship between teaching building design and thermal environment in different periods, a design strategy can be formed to optimize the thermal environment of university teaching buildings, which is of great importance for enhancing the thermal comfort of these types of buildings, conserving energy, and reducing carbon emissions.

2. Literature Review

The thermal environment is an interdisciplinary field that includes many fields such as psychology, architecture, physiology, and medicine. In recent years, research on building thermal environment has been increasingly expanded, from the establishment of evaluation indicators to how to optimize and transform its thermal environment using passive design, building space, building materials, and other approaches.
In terms of building thermal environment evaluation indicators, in the 1970s, Fange conducted a large number of climate chamber experiments and a series of theoretical analyses [4]. By integrating four physical variables of human thermal comfort (i.e., air temperature, flow rate, average surface radiation temperature, and relative humidity) and two human variables (clothing thermal resistance and human activity), he proposed the PMV-PPD (Predicted Mean Vote-Predicted Percentage Dissatisfied) index that can predict thermal comfort, which has become a widely used thermal environment evaluation index at the international level (where PMV and PPD stand for “predicted mean vote” and “predicted percentage dissatisfied”, respectively). Currently, this model is included in ASHRAE 55 [5] and the international standard ISO7730 [6]. Although the PMV-PPD index has become a relatively comprehensive thermal environment evaluation index to date, there are still scholars constantly revising this index from aspects such as human physical and mental condition, health level, and geography. For example, in 2020, Omidvar et al. [7] improved the performance of the Fanger model used in warm climate conditions by considering the effect of sweating at low exercise intensity, as well as the impact of environmental parameters on whole-body evaporative heat loss. In 2020, Zhang et al. [8] suggested that according to Fanger’s PMV development by ignoring solar radiation, the PMV was corrected and its accuracy was verified. In 2023, Liu et al. [9] explored the potential of using thermal discomfort body language to predict thermal dissatisfaction rates by considering individual differences in thermal comfort, environmental factors, and human factors in public building spaces with random crowd movements. To this end, the PMV-PPD was utilized as the basic model and an appropriate method was established for this.
In terms of optimizing the internal thermal environment of campus buildings, the research focus is mainly divided into two parts. One part is optimizing the design of the building itself, focusing on ventilation, façade, building envelope, shading, and other aspects. Another part is improving the thermal environment of campus buildings by optimizing equipment technology.
In terms of ventilation design, in 2013, Barbhuiya et al. conducted research and simulations on the Civil Engineering and Architecture Building at Loughborough University in the UK, investigating how ventilation strategies in educational buildings affect building energy consumption and thermal comfort. They finally concluded that the integration of building entrances and interior spaces can help reduce building energy consumption [10]. In 2016, Zomorodian et al. [11] conducted a review on thermal comfort in educational buildings over the past 50 years and emphasized ventilation as a crucial factor in indoor air quality and thermal comfort.
In terms of the facade and building envelope, Mohelníková et al. [12] conducted testing and simulation on a historical building in a European school that had been optimized for its exterior envelope in 2019. They believed that focusing only on exterior wall insulation and ignoring window renovation may not necessarily yield good results and that the indoor climate of the classroom is greatly affected by windows. Solar energy is able to affect thermal stability and indoor lighting. The quality of thermal insulation of building envelope structures and efficient shading systems are commonly essential tasks of school renovation strategies. In 2022, Suradhuhita et al. [13] conducted data measurements on a public elementary school classroom in Sawah Besar 01 to examine the effect of the opening design of the facade on classroom thermal comfort.
Accounting for shading, in 2019, Camacho-Montano et al. [14] conducted a simulation to improve the thermal comfort of classrooms in summer by implementing passive measures. The study suggested that buildings can prevent overheating through good ventilation, while lightweight buildings require more sun protection. On the other hand, in 2022, Wang et al. [15] utilized Grasshopper and Rhino software to optimize the structural size parameters of the shading system based on a multi-objective genetic algorithm. This study aimed to improve the classroom thermal environment by considering lighting, energy consumption, and visual comfort.
In terms of equipment technology optimization, Monna et al. [16] conducted a quantitative analysis based on on-site measurements by recording some thermal comfort parameters (mainly air temperature and relative humidity) of the school for one year and believed that the solar chimney, solar wall, and underground pipeline used in the classroom have a positive impact on the indoor thermal environment. Ghosh et al. [17] evaluated the thermal comfort of an unfurnished room composed of building-integrated photovoltaic (BIPV)-vacuum glass and compared the results with the BIPV-double-pane glass system. They found that the photovoltaic cell temperature difference between the two different types of glass was 24 °C and showed that the BIPV-vacuum glazing system provided soothing or comfortable thermal comfort during the middle of the day for a bright sunny day in a temperate climate.
From current research, research on thermal environment optimization in universities mainly focuses on optimizing one or more aspects of architectural design. However, there is a lack of targeted optimization strategies to perform comparative studies based on various periods and to propose multidimensional approaches. Therefore, this study selects teaching buildings of various eras of a university in the cold region of China as the research target. A combination of field research, typical case testing-PMV, APMV (Adaptive Predicted Mean Vote) numerical analysis, and computer simulation methods are appropriately adopted to examine the influencing factors of the thermal environment of buildings in different periods and propose an optimal solution that is compatible with the local climate. The obtained results from the present research can be regarded as a valuable reference for the design of building thermal environments in other similar climate regions.

3. Materials and Methods—Analysis and Research on the Current Situation of the Thermal Environment in Teaching Buildings of Universities

3.1. Research Methodologies

To analyze the thermal environment issues of teaching buildings in various eras, this paper chooses Xi’an City, Shaanxi Province, which is relatively concentrated in Chinese universities, as the research target. There are a total of 63 universities in this area, which are ranked sixth in the country. By conducting research and summarizing universities in various periods in the region, let us select typical cases for testing, calculate their PMV and APMV values, and employ DeST-C (Designer’s Simulation Toolkit-Commercial buildings) software (Version 2.0) to simulate various cases. Finally, we summarize and discover the thermal environment problems of teaching buildings in different eras. The specific process is illustrated in Figure 1.

3.2. Current Situation of Universities in Various Periods in Xi’an

Different climate characteristics possess various design requirements for buildings and the design methods for building thermal environments are also very different. The civil building thermal design code GB50176-2016 divides China into two levels from the perspective of building envelope design [18]. The first level area of the design of the building envelope structure is divided into five zones, which are the severe cold area (Zone 1), cold area (Zone 2), hot summer and cold winter area (Zone 3), hot summer and warm winter area (Zone 4), and mild area (Zone 5), as demonstrated in Figure 2.
The Xi’an region is located in a cold zone, which belongs to a warm temperate continental monsoon climate, with distinct cold, warm, dry, and wet periods. It is cold and dry in winter and hot and dry in summer. The buildings in the area must meet the insulation design requirements and should also consider natural ventilation and shading design. Moreover, there are numerous universities in Xi’an with long historical continuity and a huge building area. The phenomenon of high energy consumption as a cost but not maintaining the indoor thermal environment of buildings is particularly evident among major universities in this area. Research and optimization of the thermal environment in academic buildings of this region can be regarded as a suitable reference for buildings in other cold regions.
This research analyzed 27 teaching buildings in multiple universities in Xi’an, focusing on the differences in building technology, materials, design concepts, and other aspects caused by various construction methods in different eras. The research was conducted using field research methods and the literature review and the results are summarized in Table 1.

3.3. Selection of Research Cases

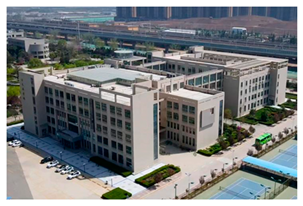
Due to the limited space, this study selected the teaching buildings of different courses at one of the famous universities in Xi’an City as typical cases. The university was established as a conventional comprehensive higher education institution in the 1950s and some of the old academic buildings are still in use. In the 1980s, a new batch of teaching buildings was completed. At the beginning of the 21st century, the construction of new campuses also began, among which the latest Hongyuan Teaching Building was completed in 2015. There are teaching buildings from different eras on the university campus, and the existing teaching buildings in each period are in accordance with the development history of universities in Xi’an. The planar form, facade design, and enclosure structure are representative and universal and can be utilized as research objects for research and analysis.
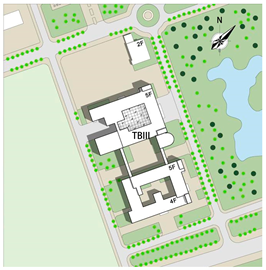
After the analysis, the main teaching building (TBI), the second teaching building (TBII), and the Hongyuan teaching building (TBIII) show the characteristics of the thermal environment and the problems of teaching buildings in various periods of universities. The main situation is presented in Table 2.

3.4. Thermal Environment Measurement and Simulation Analysis

Actual measurements were performed in buildings TBI, TBII, and TBIII on 7 January 2021, and 24 June 2022, respectively. The measurement points are divided into outdoor and indoor measurement points. The outdoor measurement points should be selected in the corridor or atrium of the building and there should be no direct sunlight. The indoor measurement points are selected in classrooms on the first, middle, and top floors, and representative classrooms are selected in each direction. All test rooms are not air-conditioned in summer but the windows are open. Furthermore, in winter, they are in heating mode, which is in accordance with their daily use.
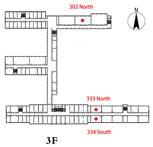
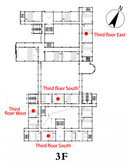
The testing instruments used are ONSET HOBO UX100-003 temperature and humidity recorder (Transcat, Inc., Rochester, NY, USA), UNI-T UT302A+temperature gun (Uni-Trend Technology, Dongguan, China), testo405V1 Detour hot wire anemometer (Suzhou Robock Measurement & Control Technology Co., Ltd., Suzhou, China), and AZ8778 Hengxin black ball thermometer (Heng Hsin Industrial Co., Ltd., Taichung, Taiwan), as illustrated in Table 3. Due to limited space, only the distribution plan of measurement points is placed on the middle floor of each teaching building, as presented in Table 4. The distribution of measurement points on the first and last floor is almost the same as on the middle floor.

3.4.1. Thermal Environment Testing

This test is conducted throughout the year, from 9:00 to 19:00, to capture the main usage time of the teaching building. Data are recorded hourly under extreme weather conditions in summer and winter.
1.
Summer
The results of measuring the temperature of the summer test rooms in various teaching buildings are presented in Figure 3. The temperature of three teaching buildings increases with the increase in floors. The case of TBII exhibits a rise in temperature by about 1.5 °C per floor, the TBI demonstrates an increase by about 1.5 °C per floor, and TBIII demonstrates an increase of the least at 0.15 °C. “Standards for indoor air quality” GB/T 18883-2022 [19], and “Design Code for Heating Ventilation and Air Conditioning of Civil Buildings” GB50736-2012 [21] stipulate that the comfortable temperature in summer is 22–28 °C. Most of the rooms in these three teaching buildings exhibit temperatures higher than the set values.
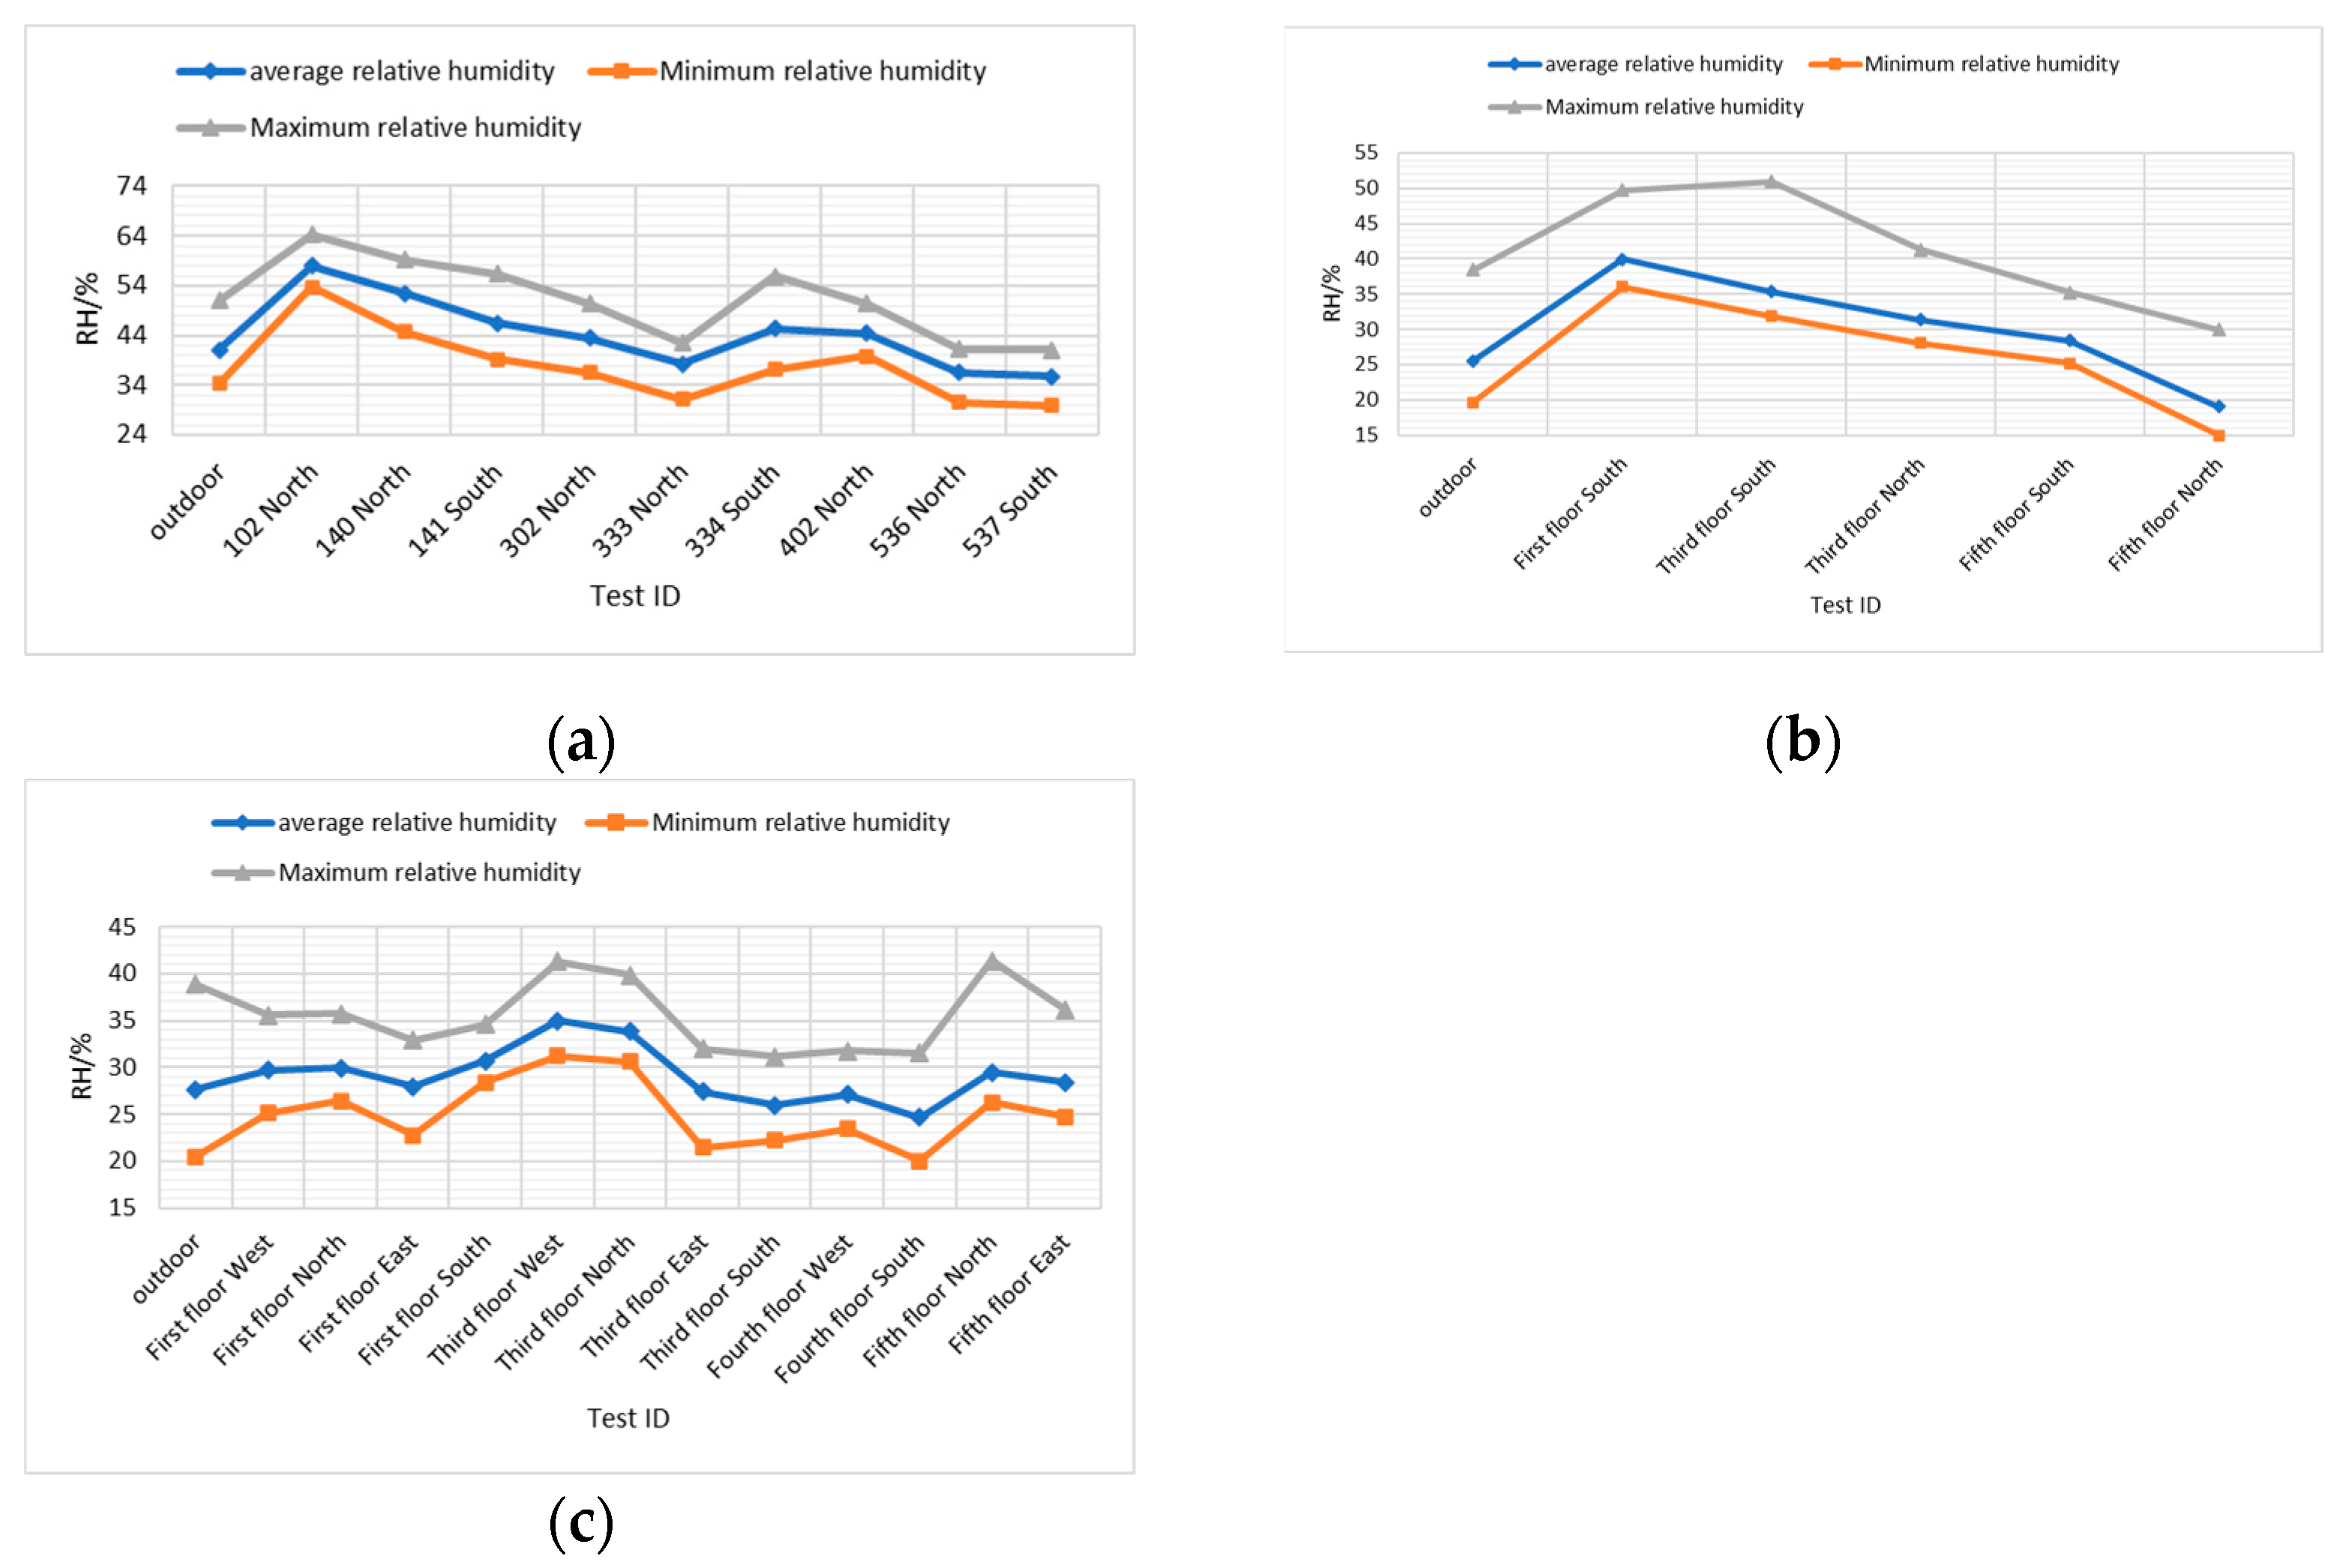
The humidity of the testing rooms of various teaching buildings during the summer is shown in Figure 4. As the floors of the three teaching buildings increase, the relative humidity of the rooms gradually reduces. The downward trend of TBI and TBII is more pronounced, whereas the downward trend of TBIII changes slightly. “Standards for indoor air quality” GB/T 18883-2022 specifies that the relative humidity suitable for summer is 40–80% [19]. Except for the case of TBI, the average relative humidity levels of the three teaching buildings are relatively close, whereas the average relative humidity of the other two buildings is less than the specified value.
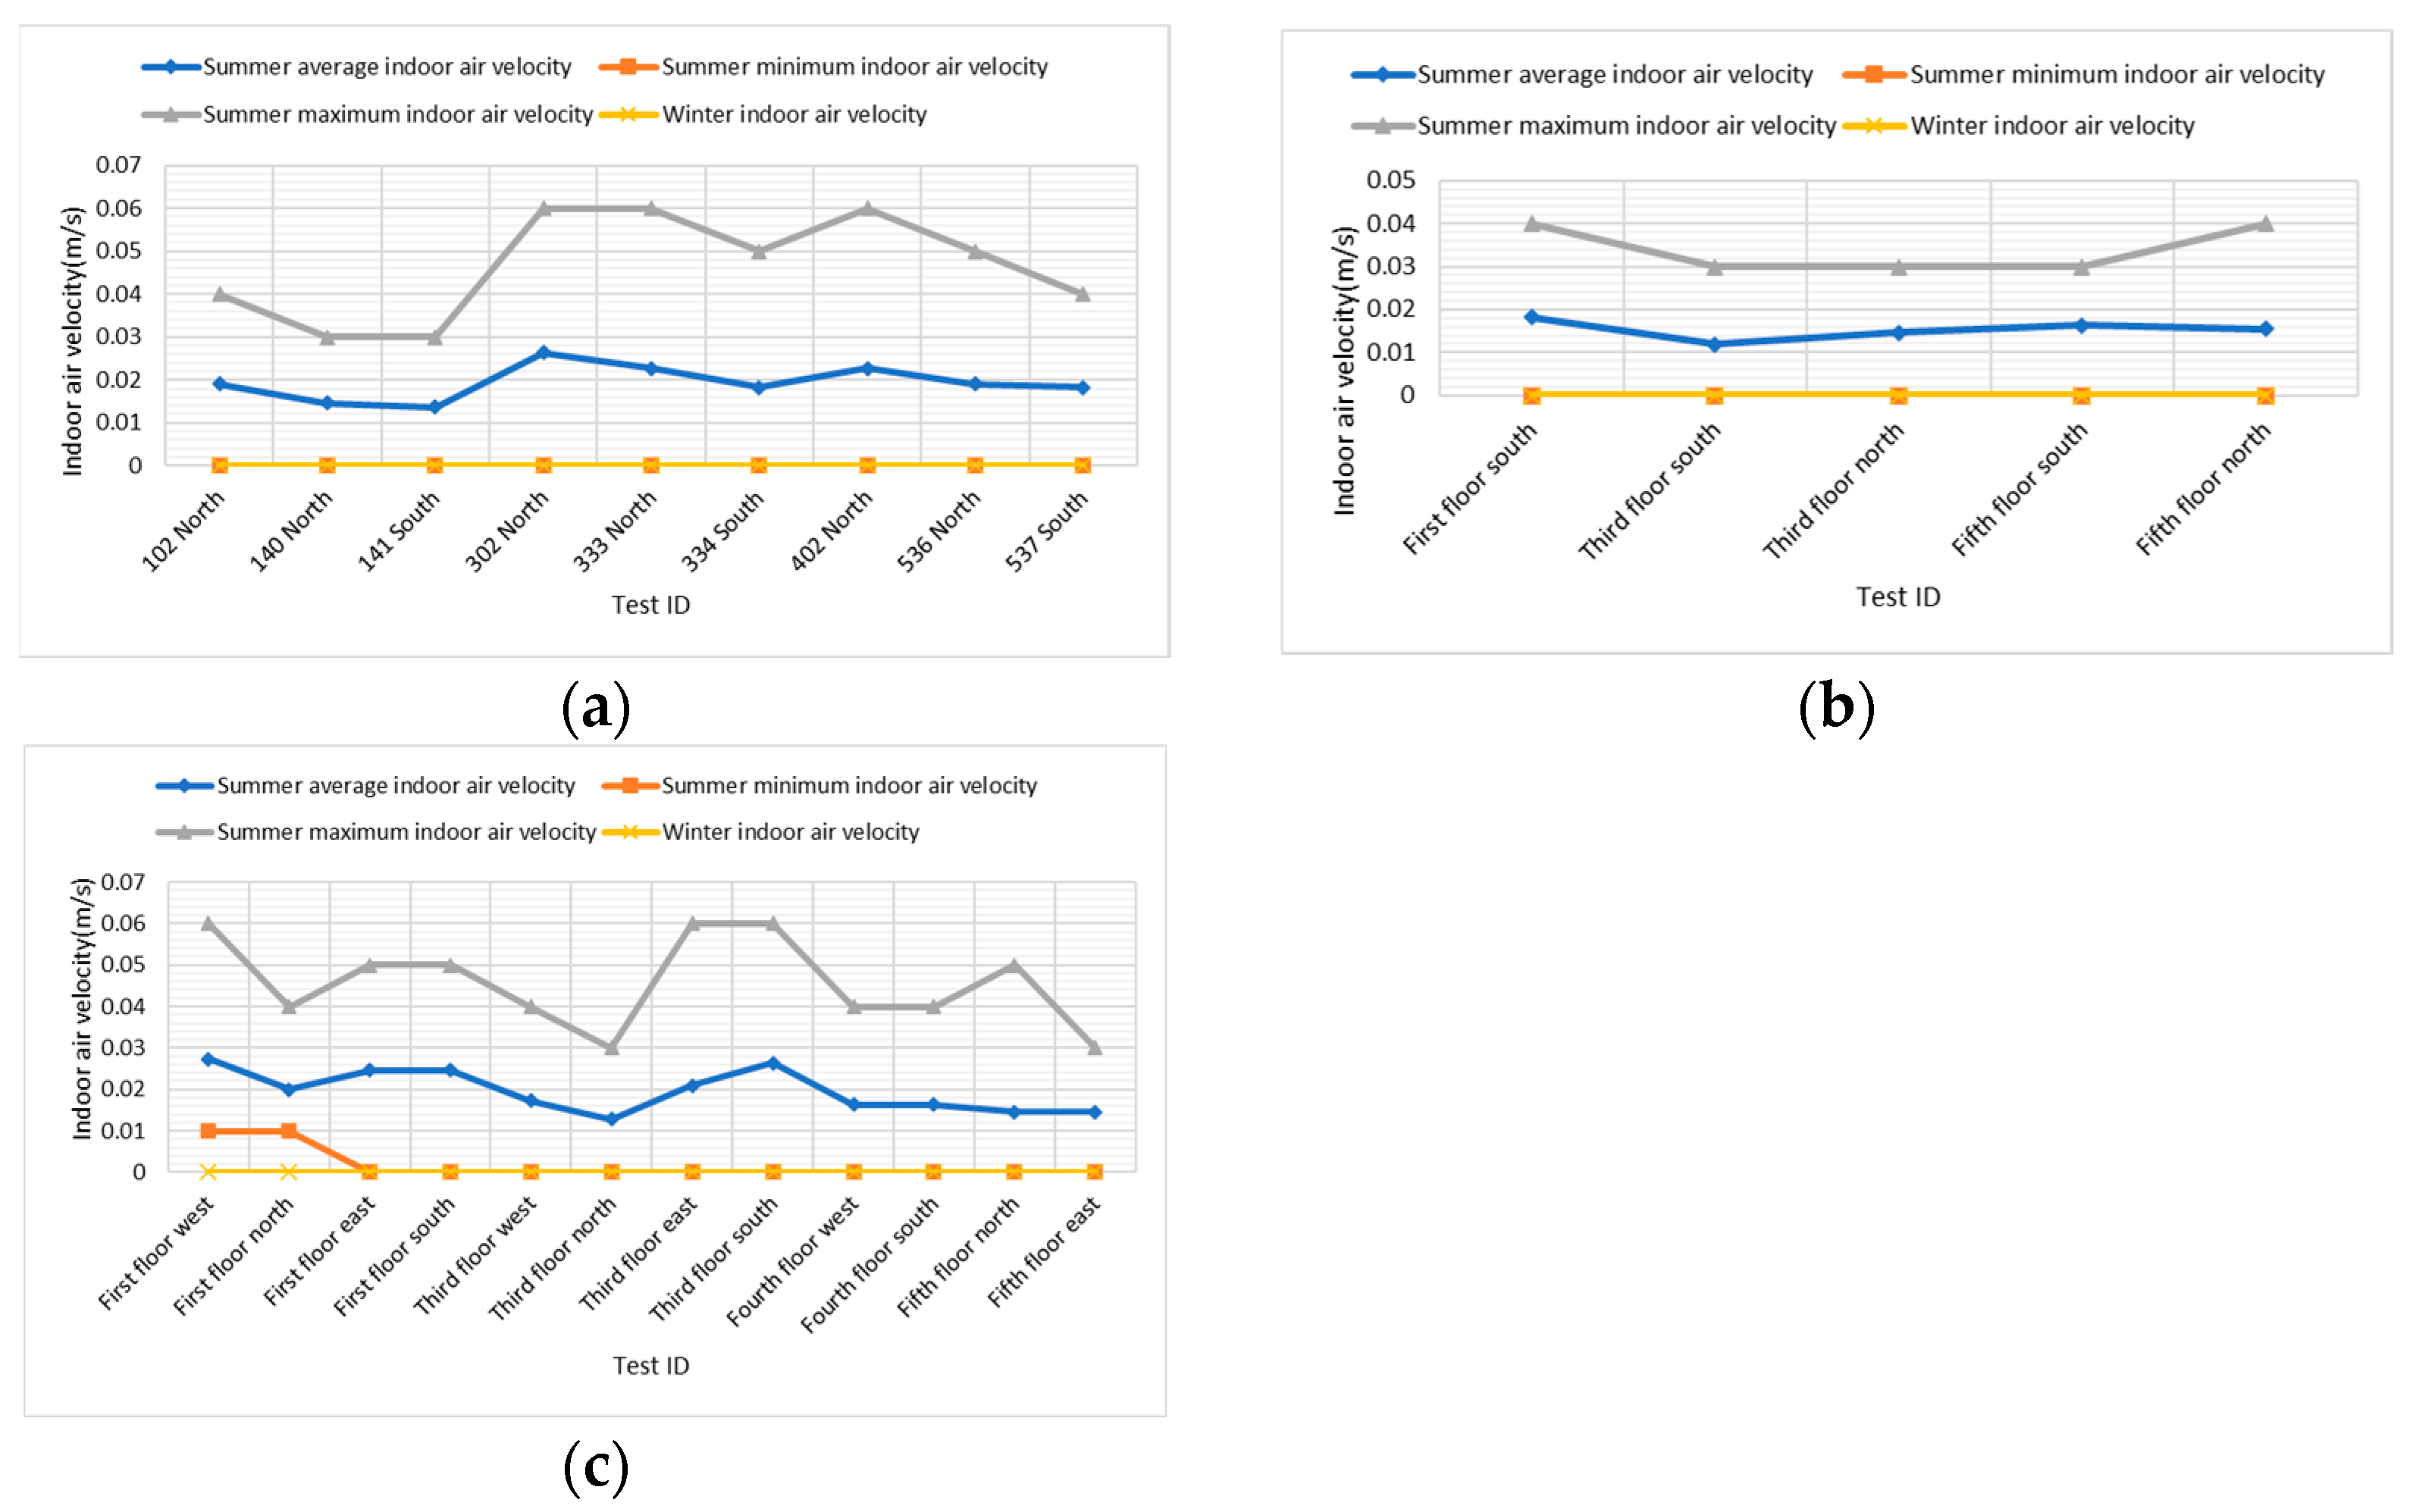
The winter and summer indoor air velocities in the testing rooms of various teaching buildings are illustrated in Figure 5. The indoor air velocity of the testing point of three teaching buildings in winter is almost 0 m/s. The average indoor air velocity in summer is relatively low, which cannot meet the basic indoor air velocity requirements for thermal comfort standards.
2.
Winter
The actual temperature measurement results of the winter testing rooms in various teaching buildings are illustrated in Figure 6. According to the ”Design Code for Heating Ventilation and Air Conditioning of Civil Buildings GB50736-2012”, the suitable indoor temperature in winter is specified in the range of 18–24 °C [21]. The average indoor temperature of the TBI case is lower than this value. Only a few rooms in TBII and TBIII exceed 18 °C during certain periods in the afternoon. The temperature of south-facing rooms on the same floor of each teaching building is slightly higher than that of north-facing rooms.
The results of humidity measurements conducted during winter testing in various teaching buildings are shown in Figure 7. Since the university being tested is located in a cold zone of China with a very dry winter climate, the classrooms are heated with radiators, resulting in very low actual humidity. The humidity data in each classroom are relatively similar and below 15%; however, the range of the measuring instruments used is 15% to 95%. To conduct a complete data analysis, we recorded readings based on 15% and calculated according to 15%.

3.4.2. Thermal Comfort Evaluation

1.
APMV
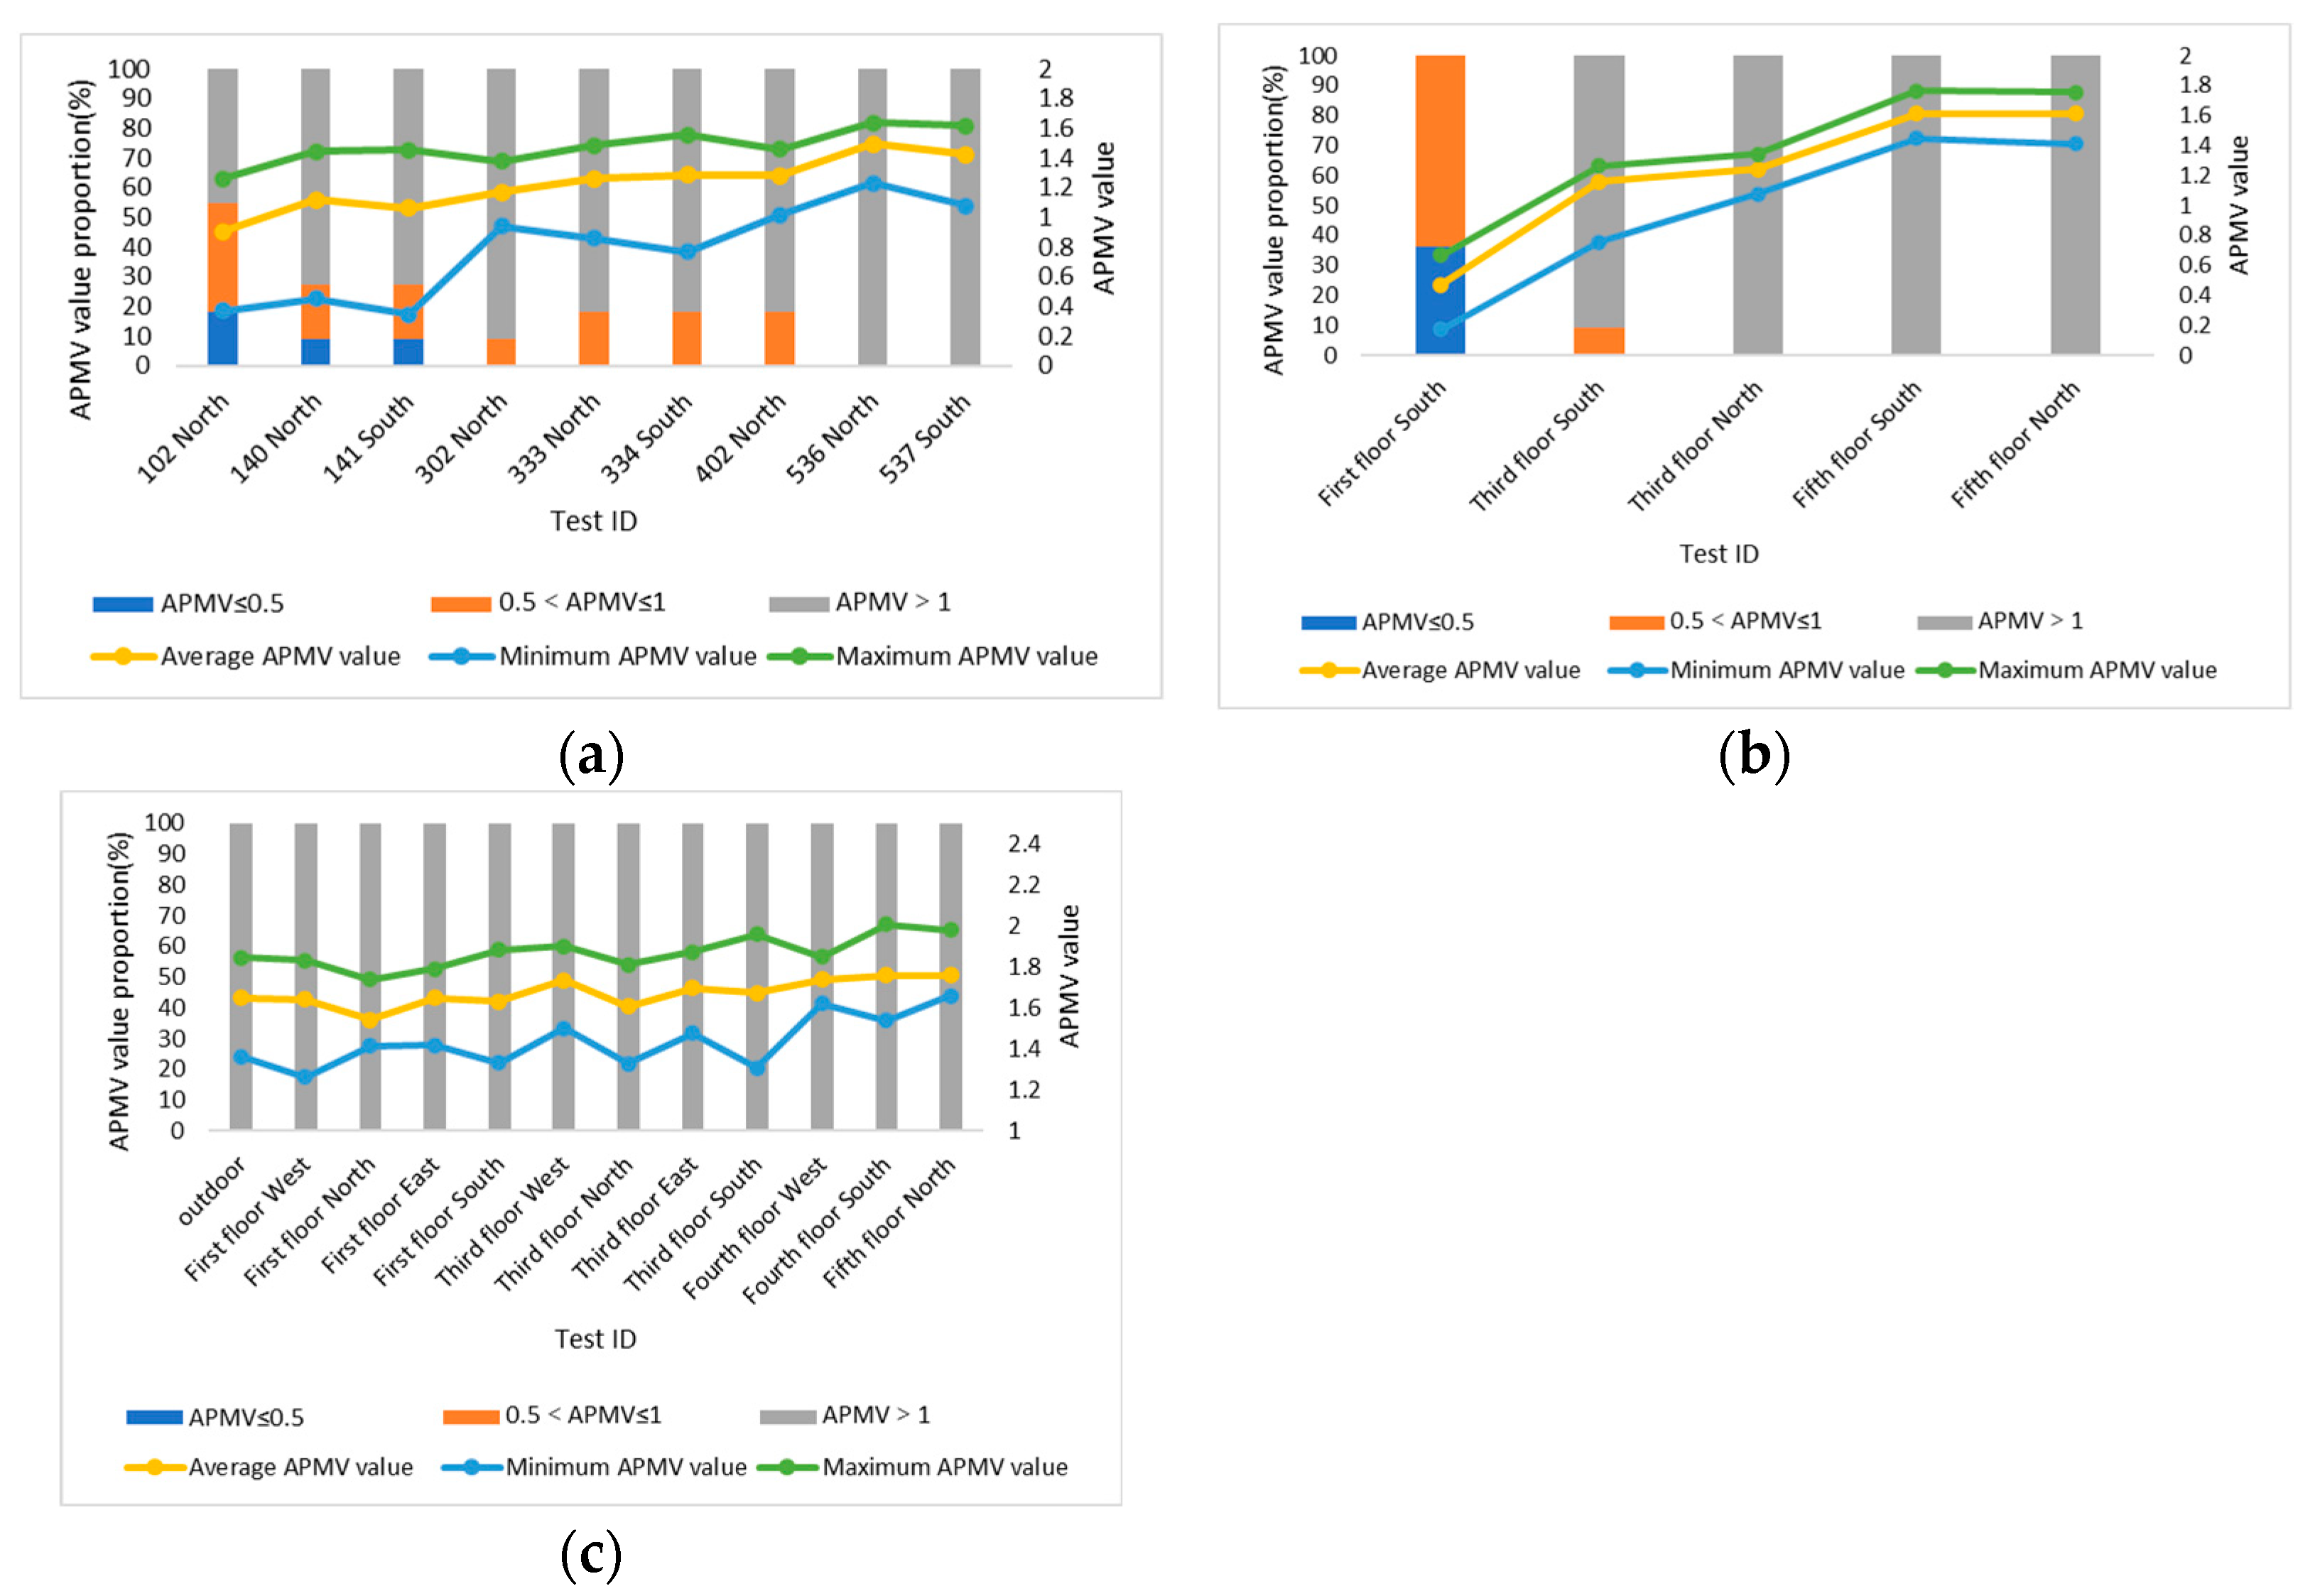
Due to the summer season, the testing rooms are located in a non-artificial hot and humid environment, so the APMV is adopted as the thermal environment evaluation indicator, as shown in Figure 8. Among the TBI testing rooms, only three rooms on the first floor have an APMV value for a period slightly less than 0.5, which meets the standard of Class I in “Evaluation standard for the indoor thermal environment in civil buildings” GB/T 50785-2012 [22]. Only the TBII first-floor room exhibited APMV values of less than 1 during the testing period, meeting both Level I and Level II standards. During the TBIII test period, the APMV values of all rooms were greater than 1, which did not meet the Level I and Level II standards. The APMV values of the three teaching buildings all increase with the increase in floors, indicating a decrease in thermal comfort.
2.
PMV-PPD value
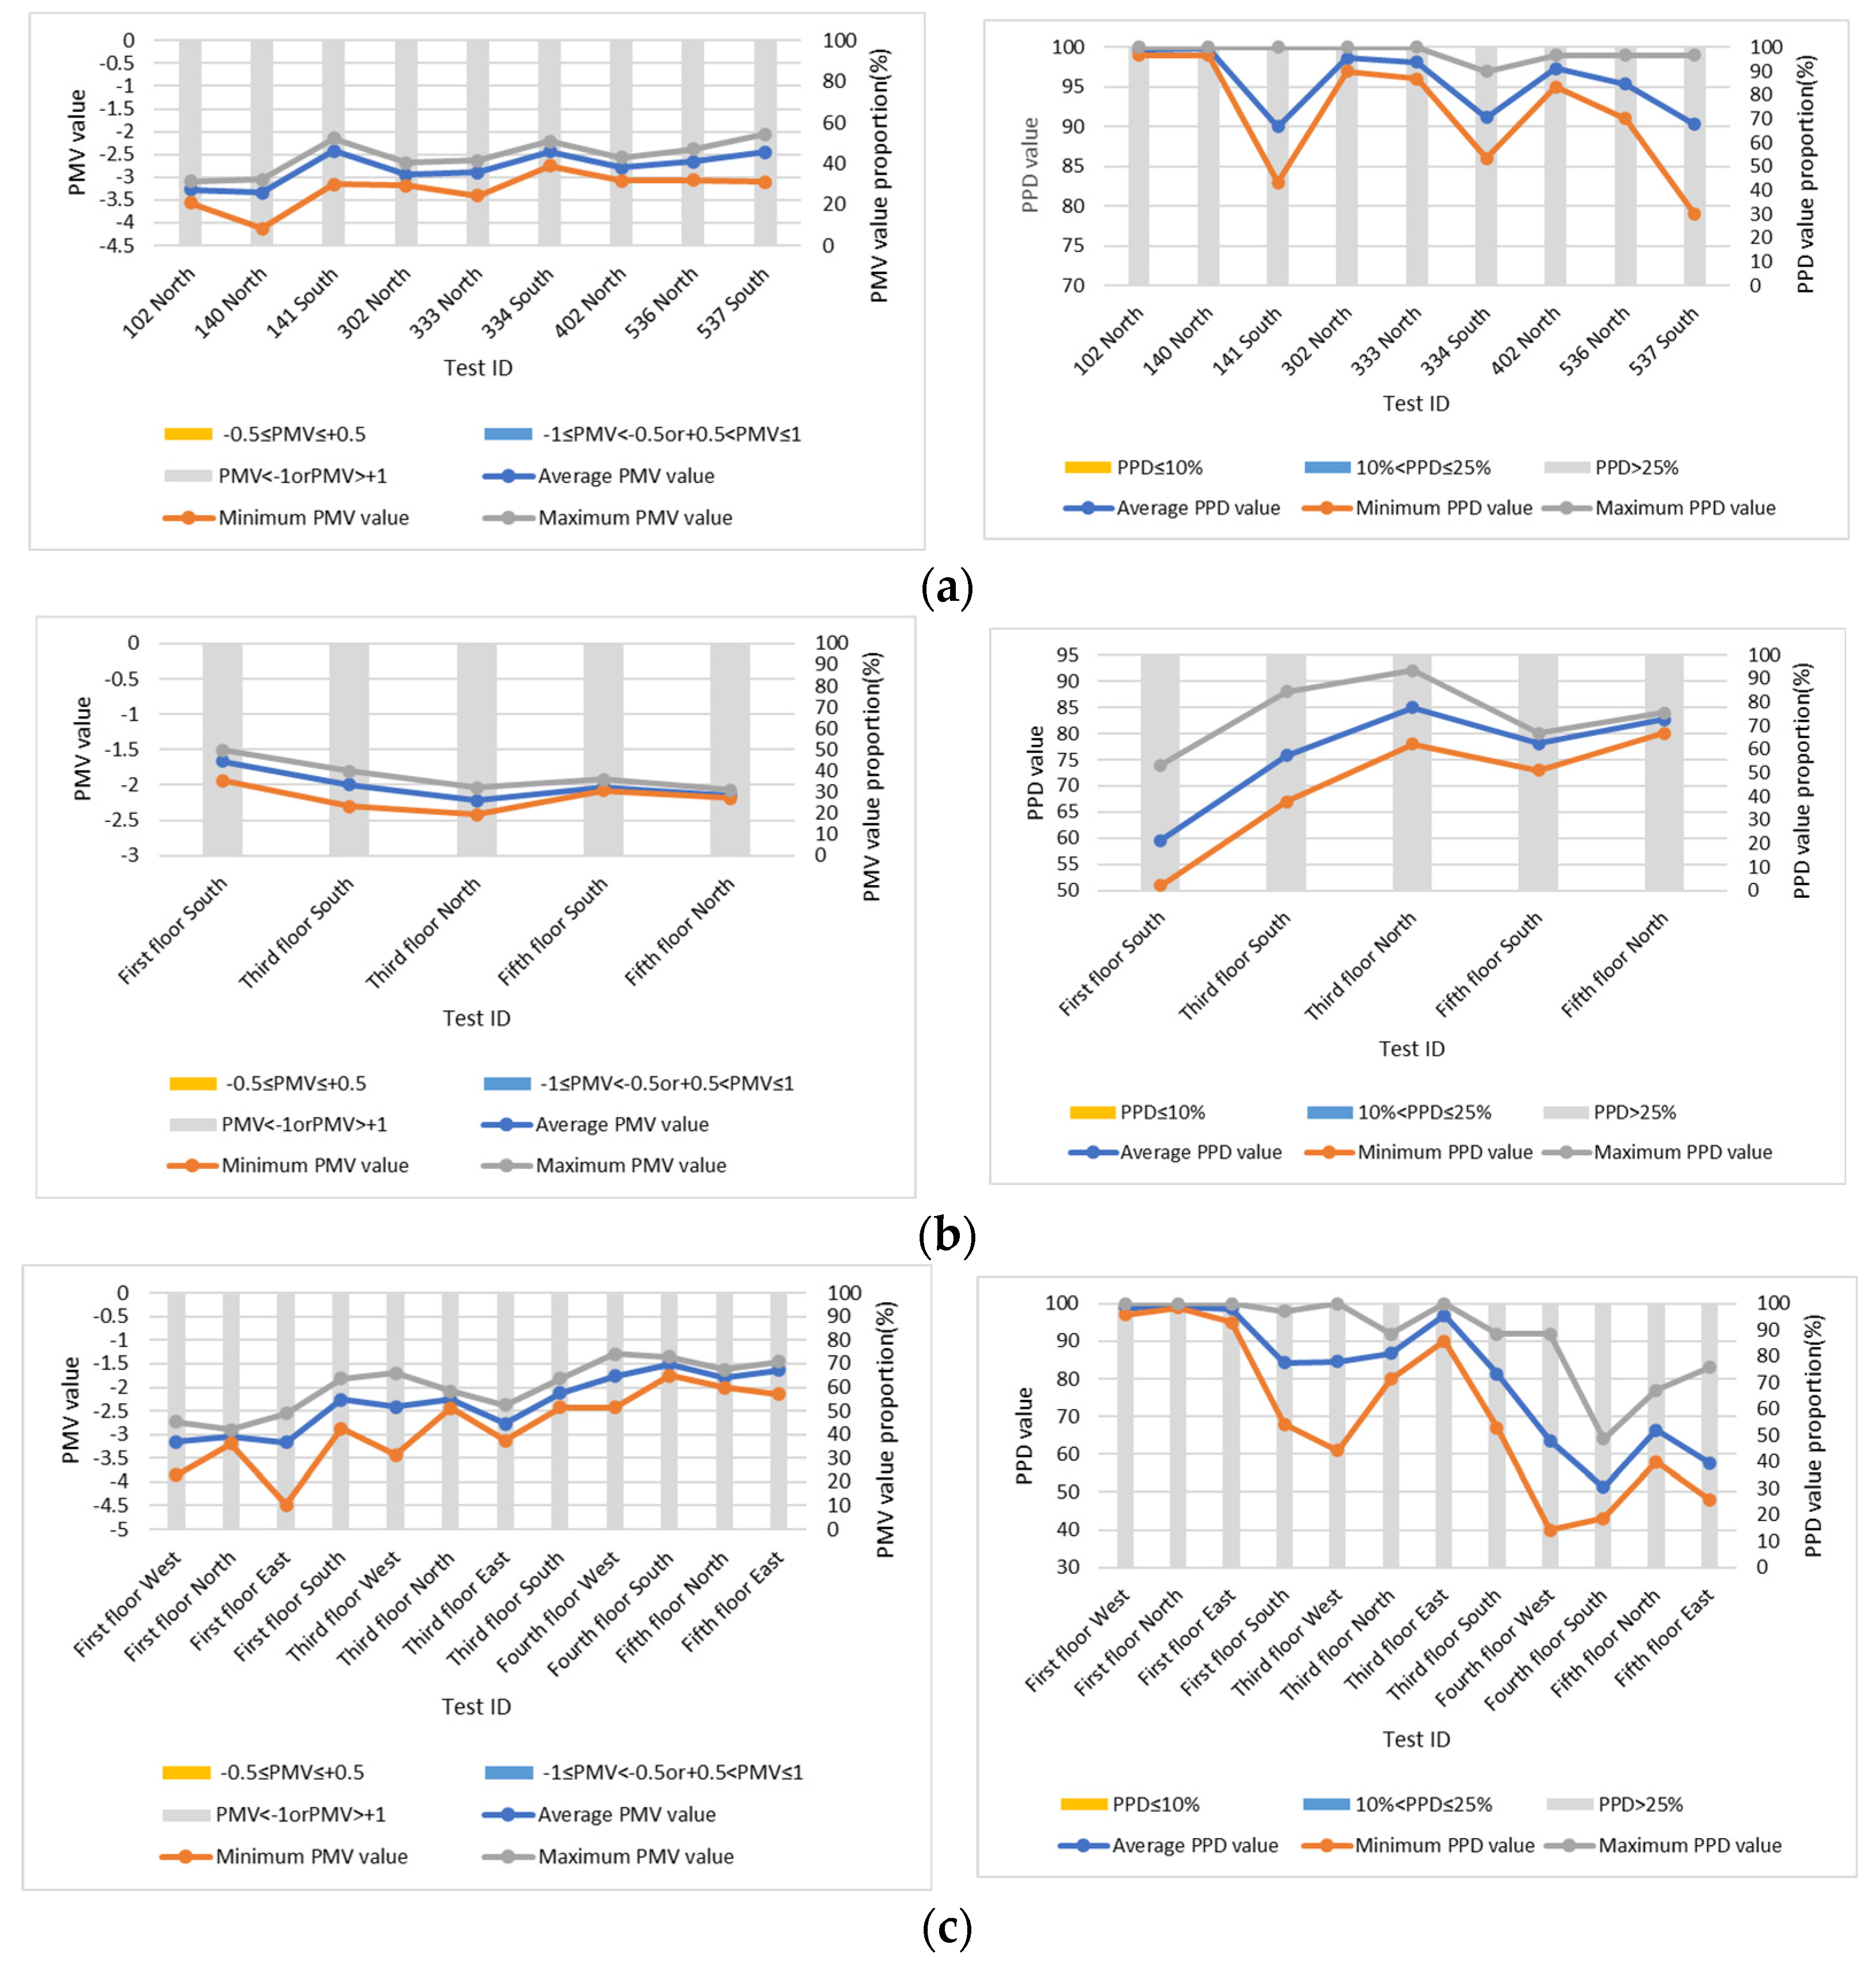
In winter, PMV-PPD is employed as the thermal environment evaluation index, as shown in Figure 9. During the testing period, the PMV values of all rooms in TBI were less than −1, lower than the level III standard. During the test period, the PMV values of all rooms in TBII were less than −1.5. The PMV values of each room in TBIII are all less than −1, which does not meet the level I and II standards.
The absolute value and PPD value of PMV in the south-facing rooms on the same floor of these three teaching buildings are relatively smaller than those in the north-facing rooms. The thermal comfort in the south-facing room is slightly better than the north-facing room and, as the floors increase, the absolute value of PMV and PPD both slightly reduce, which indicates a certain degree of thermal comfort improvement. But, in general, all test rooms have poor thermal comfort in winter.

3.4.3. Summary of the Actual Measurements in Each Teaching Building

After the above analysis and testing, the basic data of three teaching buildings in winter and summer are summarized in Table 5.

3.4.4. DeST Simulation

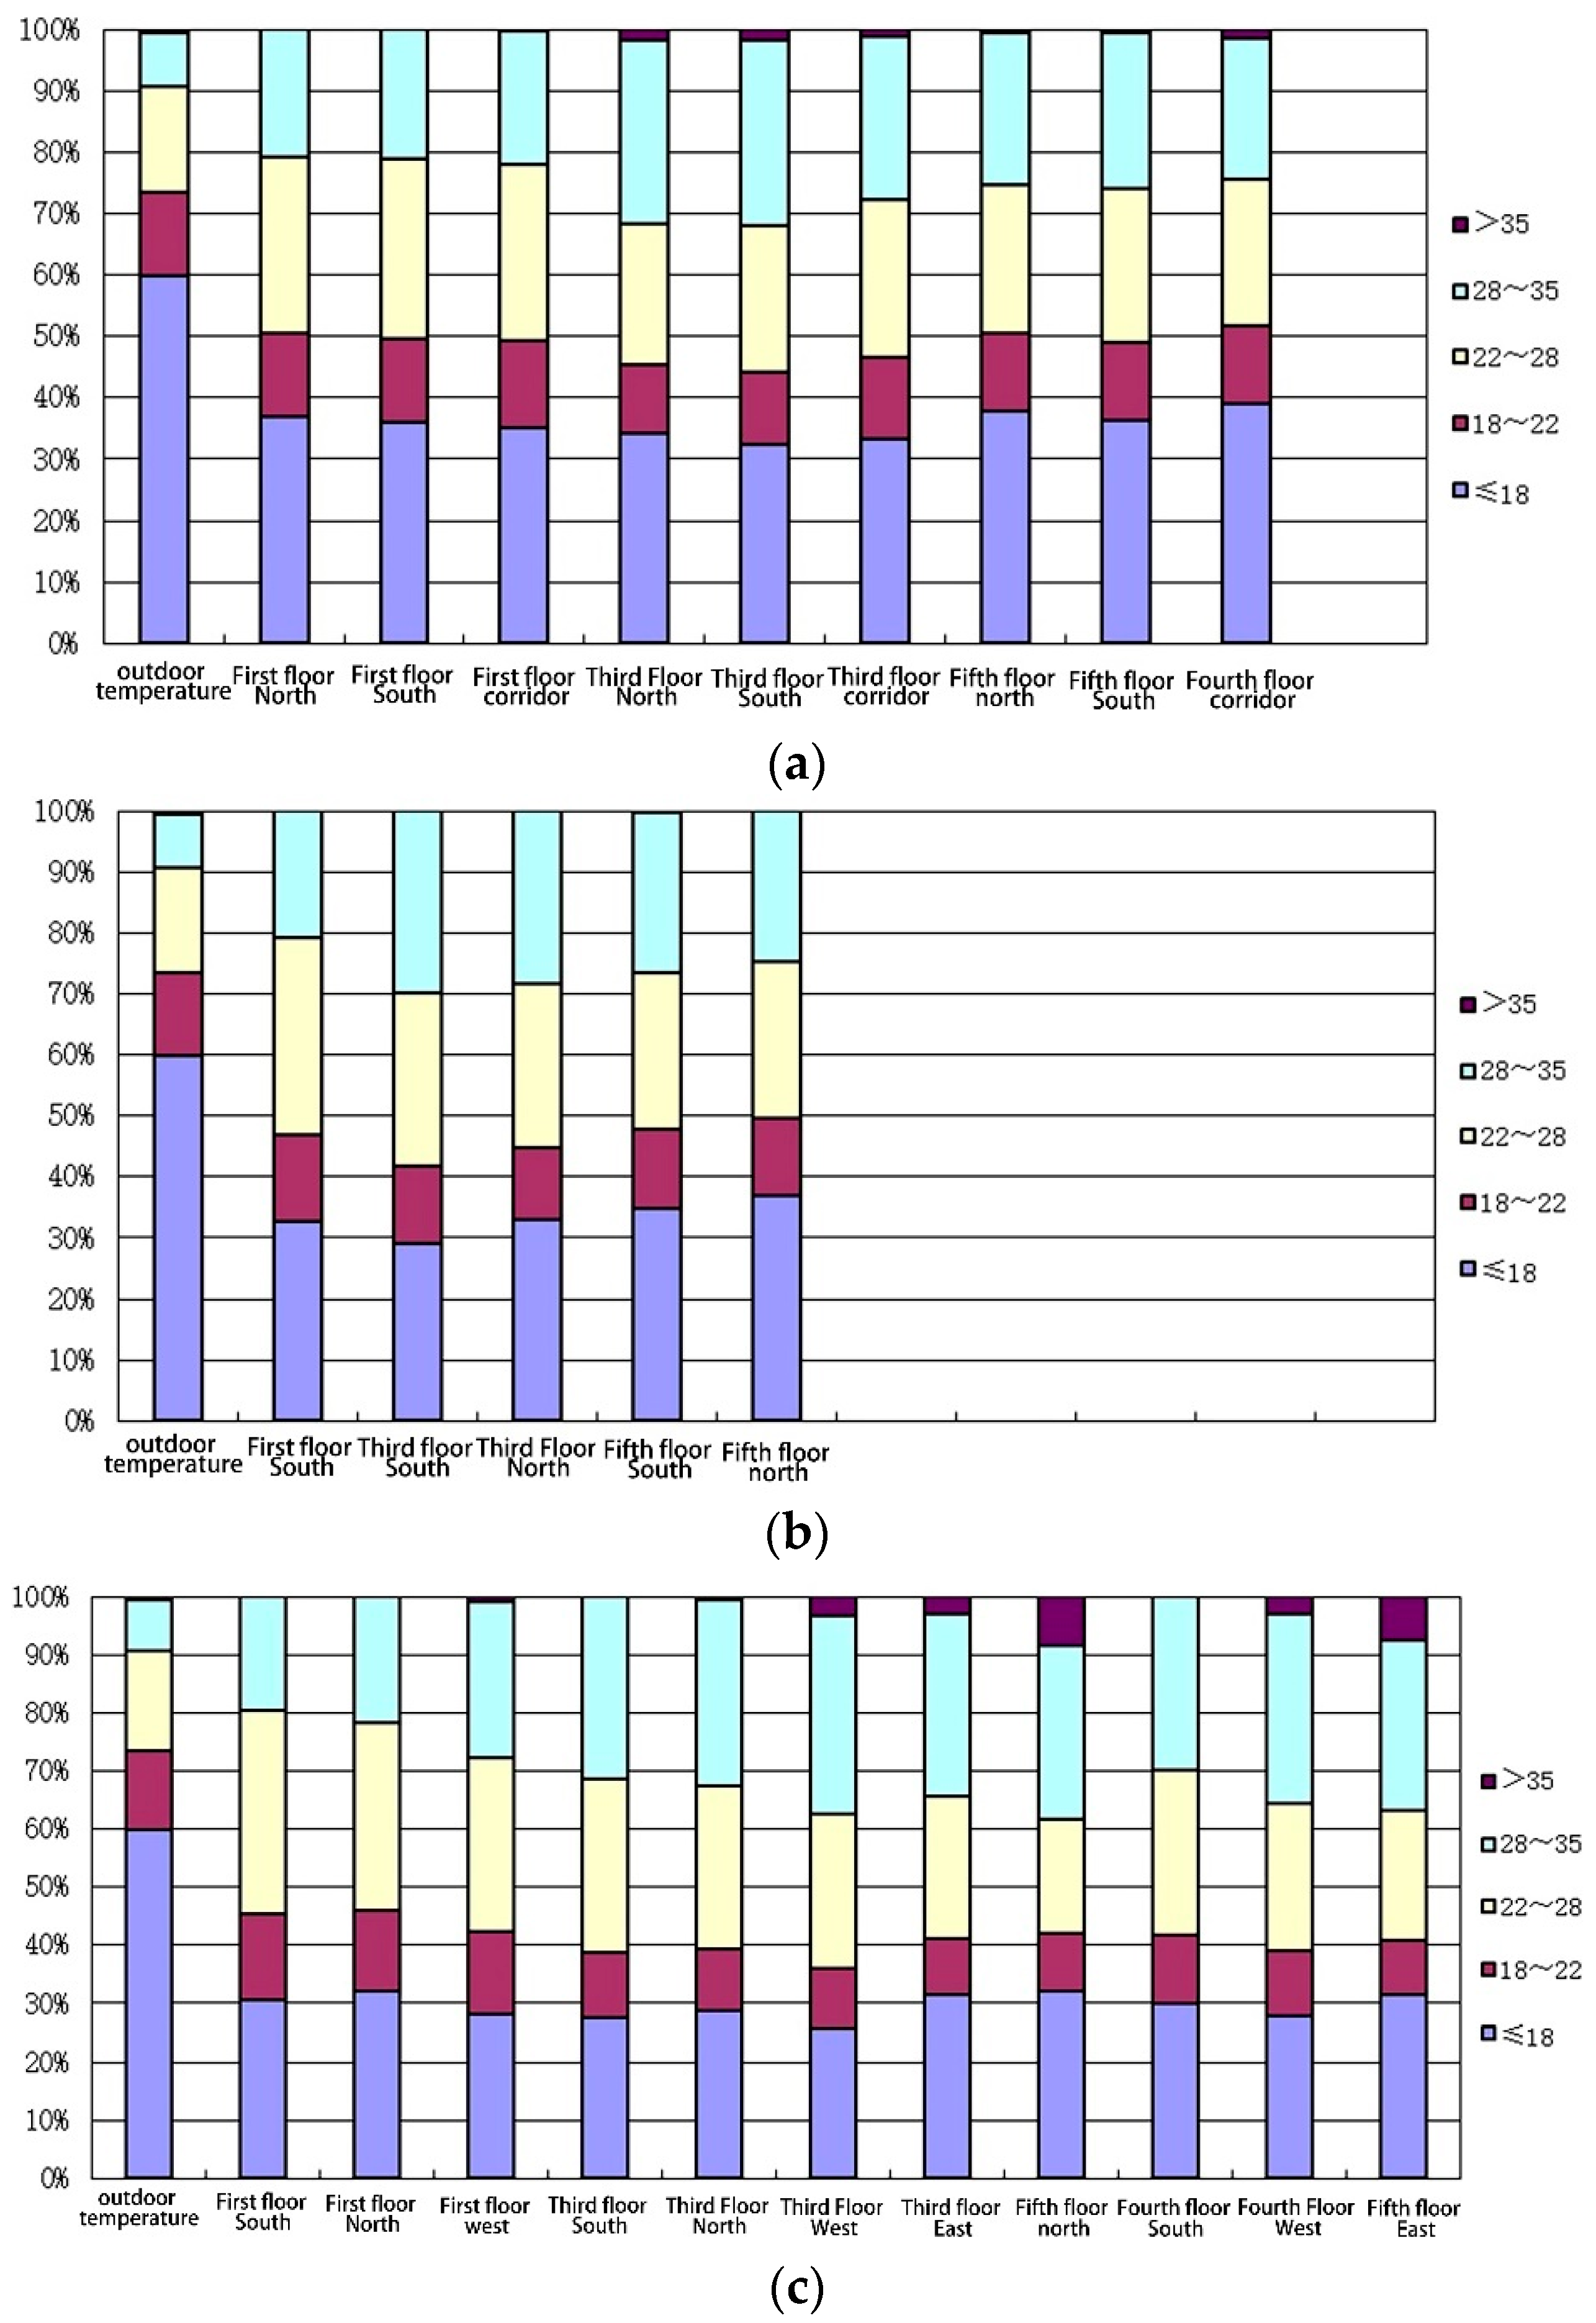
After the actual measurements, DeST-C was employed to simulate teaching buildings in the three different periods mentioned above and the indoor ambient temperature and building cooling and heating loads of the rooms throughout the year were calculated. The annual simulation results of the room temperature of the testing rooms in various teaching buildings are presented in Figure 10. According to the simulation results, the duration of the outdoor temperature below 18 °C in Xi’an is about 60% of the whole year. The ambient temperature of classrooms in the three teaching buildings is below 18 °C, accounting for about 30–40% of the whole year. In general, the proportion of the duration of less than 18 °C in each representative room of TBIII is the lowest throughout the year and the insulation effect is better than TBI and TBII. The proportion of time above 35 °C in each room represents the summer in which TBIII is the highest, followed by TBI. In winter, low temperatures in various teaching buildings mainly occur on the first and top floors, while in summer, high temperatures in various teaching buildings mainly occur on the middle and top floors.
The annual cooling and heating load statistics of teaching buildings in various periods are provided in Table 6. Due to being located in a cold region and having an indoor ambient temperature below 18 °C for a long time, the cumulative heating load of the three teaching buildings is higher than the cooling load during the year. The maximum annual cooling and heating load per unit area is observed in TBIII but in terms of cumulative annual cooling load per unit area, the case of TBI exhibits the largest value, followed by TBIII.

3.5. Analysis of the Thermal Environment Problems and the Causes of Cold and Hot Load Characteristics

By combining on-site inspection of buildings, measured data of the thermal environment, and computer simulation results, these three methods complement and verify each other. Let us summarize, compare, and summarize the thermal environment problems, as well as the cooling and heating load characteristics of these three typical teaching buildings in various periods. After that, we can identify and analyze the main reasons for these problems and differences and classify the causes accordingly.
1.
Analysis of summer thermal environment problems in three teaching buildings of various eras
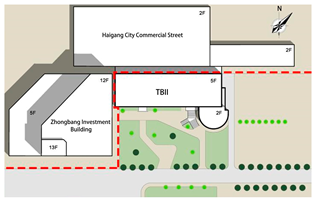
Through the above research analysis and simulation, it can be seen that the average indoor temperature of the three teaching buildings in summer has exceeded 30 °C, which is beyond the comfortable temperature range for the human body. TBIII represents the hottest in summer, with an average temperature of 33.7 °C. The APMV values of TBI and TBII are both 1.22, while the APMV value of TBIII is 1.67, both exceeding 1, indicating poor thermal comfort. In terms of ventilation, the three teaching buildings lack effective natural ventilation, resulting in poor indoor air circulation. According to Table 7, the thermal environment problems mainly originated from the design of their building envelope. The TBIII problem is the most serious problem, which is essentially related to the design flaws in the site planning and styling space.
2.
Analysis of winter thermal environment problems in the three teaching buildings of various periods
Through the above research analysis and simulation, it can be seen that the average indoor temperature of the three teaching buildings in winter is less than 18 °C. Under normal heating conditions, most rooms in TBIII are able to reach the minimum temperature required for heating but most rooms in TBI and TBII are difficult to reach. The PMV-PPD values of the three teaching buildings did not meet the level I and II standards, while the corresponding PMV-PPD values of TBI were −2.74 and 95.6%, which were the worst among the three teaching buildings. The indoor humidity of all three teaching buildings is less than 15%, mainly due to the dry climate and the use of heating equipment. Low humidity can cause symptoms such as dry tongue and sore throat in the population, which is one of the thermal environment problems in the three teaching buildings during winter. In terms of ventilation, due to the low outdoor wind speed of about 1.5 m/s in Xi’an during winter, most test buildings are arranged in a closed layout. A closed cluster space, especially in the corners of buildings, can easily create a quiet wind zone. Meanwhile, the interior of the space is more susceptible to the influence of building winds and shaded areas, leading to poor outdoor ventilation. During the test, the classroom was in a closed-door and window state, with poor ventilation. According to Table 8, it can be seen that the PMV-PPD values of three teaching buildings do not meet the standards of level I and level II and that the thermal comfort in winter was poor. The heat transfer coefficient of its enclosure structure is higher than the specified value. Among them, the problems of TBI and TBII are more prominent. Due to the age of TBI, the enclosure structure is not equipped with an insulation layer and the doors and windows have been in disrepair for a long time, resulting in poor ventilation.
3.
Analysis of the cooling and heating load issues in the three teaching buildings for various periods
According to Table 9, TBI and TBIII exhibit higher cold and hot loads. The maximum annual cooling and heating loads per unit area of TBIII are 274.87 W/m2 and 276.17 W/m2, respectively. In addition, the cumulative annual cooling and heating load per unit area of TBI is 214.52 W/m2 and that of TBIII is 203.22 W/m2. TBI is essentially the result from poor design in the enclosure structure. TBIII is mostly due to its architectural design space.

4. Results and Analysis: Thermal Environment Optimization Design of Teaching Buildings as Historical Buildings

4.1. Optimization Analysis of the Thermal Environment in Teaching Buildings

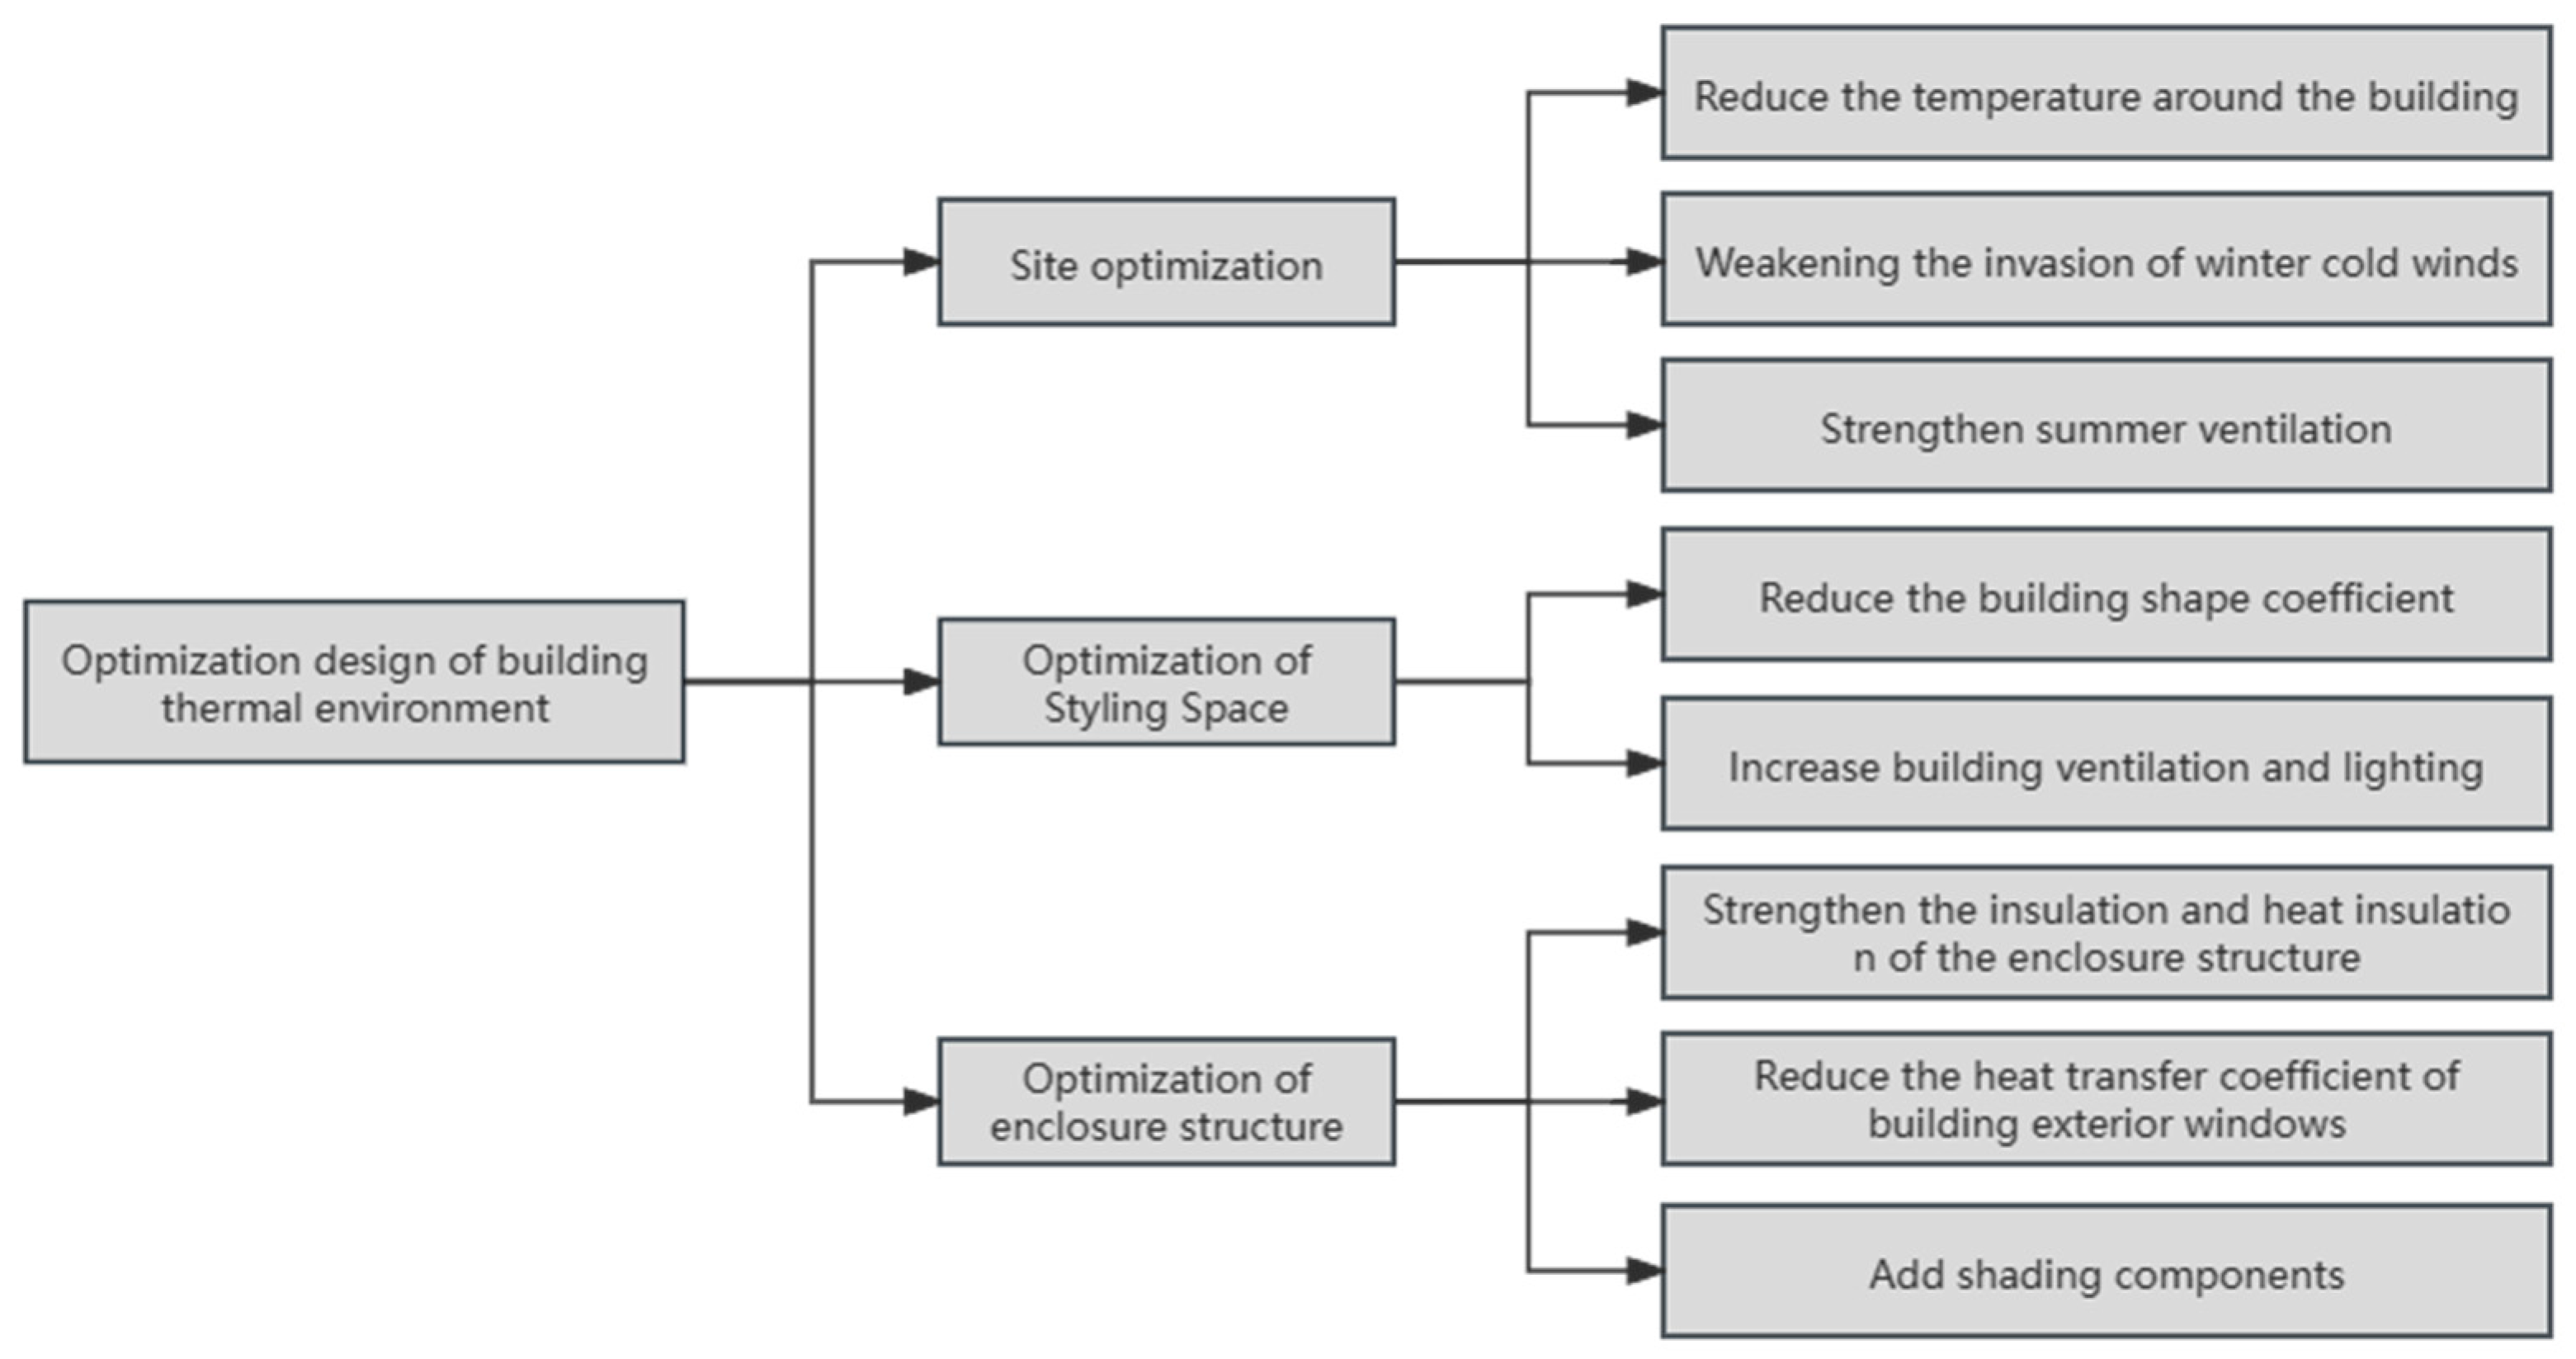
As illustrated in Figure 11, the thermal environment of buildings is mainly optimized through several design aspects such as site renovation, architectural design space, and building envelope optimization.

4.1.1. Site Optimization

It is challenging to alter the orientation of the teaching building due to its already-built structure. Therefore, the focus is on optimizing the landscape around the building to enhance the thermal environment of the building. The optimization is mainly performed through the following procedures:
1.
Reduce the temperature around the building
Research has shown that plants can effectively reduce the building cooling load by 10% and play an energy-saving role [23]. Therefore, for teaching buildings with relatively loose surrounding land and more hard paving, it is necessary to reduce the hard paving around the building, increase the green space and water area around the building, and use evaporation to reduce the surrounding temperature [24]. The relationship between the decrease in air temperature and the green areas is illustrated in Figure 12 [25]. In terms of paving, more attention should be paid to the use of dark colors (hot materials), which can absorb more solar radiation compared to light colors (cold materials) and are more suitable for cold climate zones [26]. In addition, vertical greening and rooftop greening can be considered for teaching buildings with limited surrounding land.
2.
Weakening the invasion of winter cold winds
According to the prevailing winter wind direction in the region, trees are planted at corresponding locations to form a wind barrier, thereby protecting the building from cold winds.
3.
Strengthen summer ventilation
One way to improve the ventilation and shading of buildings in summer is by planting tall deciduous trees in the direction of direct sunlight. These trees have lush branches and leaves that can provide shade and enhance the circulation of air around the building. During autumn and winter, the leaves fall off, allowing sunlight to enter the interior and warm the building through solar radiation [27].

4.1.2. Optimization of Architectural Design Space

1.
Reduce body shape coefficient
The shape coefficient of a building is directly proportional to the external surface area per unit volume of the building. A higher shape coefficient would result in higher heat transfer loss [27]. However, if the body shape coefficient is too small, it can also restrict the creativity of architects and even damage the functionality of the building [28]. Due to its location in a cold region of China, the lower the shape coefficient of a building within an appropriate range, the less likely it is to dissipate heat within the building during winter. The comfort level of the building’s thermal environment will also be higher, while the building will be more energy efficient. For some ordinary teaching buildings, while ensuring the safety of the structure, the number of floors can be increased through renovation and expansion to reduce the expansion of the plan or increase the plan space to adopt a more appropriate ratio of width and depth of the face. For historical buildings, they should be optimized while protecting their main facade and maintaining their external planar form.
2.
Strengthen ventilation and lighting
By optimizing the architectural design space, its ventilation and lighting could be enhanced. For instance, optimizing the height and position of windows to enhance ventilation and setting up a door bucket space at the entrance and exit. At the same time, it should be noted that for historical buildings, the division of door bucket space indoors should be performed to avoid affecting the exterior facade of the building.

4.1.3. Optimization of the Building Envelope

1.
Strengthen the insulation and heat insulation of the envelope
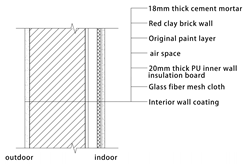
The renovation of the current external wall insulation mainly utilizes external wall insulation and internal wall insulation. Compared to the other two, exterior wall insulation exhibits better insulation performance and is more conducive to energy conservation. The renovation of exterior walls’ insulation of existing buildings can make them more aesthetically pleasing. Therefore, except for historical buildings, most buildings adopt exterior wall insulation renovation. Historical buildings adopt exterior walls and internal insulation to protect the appearance of the exterior facade. At present, exterior wall insulation materials are mainly divided into two categories, organic materials and inorganic materials, each of which has its own advantages and disadvantages. As presented in Table 10, organic thermal insulation materials, such as polyurethane (PU) and polystyrene foam plastic (EPS) board, are characterized by lightweight and low thermal conductivity, so they are very suitable for energy-saving renovation of building exterior walls in cold regions and both external and internal thermal insulation are applicable [29].
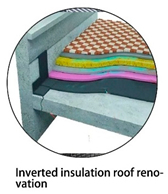
To renew the roof insulation, the main methods used are upright and inverted insulation roofs. The inverted roofs are currently more in line with the development direction of building energy-saving technology. It is also possible to plant on the roof to prevent sunlight and reduce heat gain. However, the quality of the buildings should be evaluated and historical buildings built in previous years should not be utilized blindly.
2.
Reduce the heat transfer coefficient of the outer window
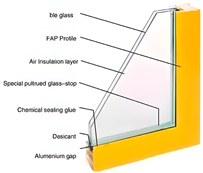
The use of glass products with good thermal insulation performance and window frame materials with good ventilation is the key to energy conservation in doors and windows. Low-E glass (low radiation glass) is the most extensively employed type of glass in energy-saving doors and windows, with excellent thermal and optical properties. In summer, strong infrared radiation can be blocked outdoors, thereby reducing indoor heat gain. Winter is able to prevent indoor radiation energy leakage to the outside and thus maintain the indoor temperature [30].
3.
Increase shading
For existing buildings with a fixed orientation, building shading is an effective approach to optimize the building’s thermal environment. Architectural shading is mainly divided into external shading and internal shading. To protect historical buildings, their facades cannot be substantially altered. Therefore, only internal shading systems, such as horizontal aluminum alloy shading louvers, can be utilized in the shading design.

4.1.4. Optimization Design of the Thermal Environment in Teaching Buildings of Universities in Various Periods

Teaching buildings in universities face different thermal environment problems in different periods. Based on the above research, measurement, simulation, and summarization of the optimization system of the building thermal environment, the optimization measures for teaching buildings in Xi’an in various periods are presented in Table 11.

4.2. Thermal Environment Optimization for Historical Architecture Teaching Buildings

The historical buildings of universities include both cultural leftovers and historical buildings that have been included in the protection objects and those that are not included in the protection objects but have been preserved for at least 30 years and possess significant historical and cultural education significance [31]. They reflect the characteristics of the times and witness the development of universities; their optimization can make them sustainable. Based on the analysis of the thermal environment issues of teaching buildings in various periods mentioned above, this article selects the object of the renovation of the historical TBI building built in the 1950s and 1960s from three design aspects: site planning and design, architectural design space, and envelope design. The optimized thermal environment and the renovated thermal environment are appropriately simulated.
1.
Optimization of the site planning
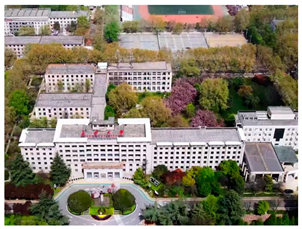
TBI is essentially oriented from north to south and surrounded by abundant greenery. Tall trees are planted in the small courtyards around it to provide some shade for the main building in summer and prevent exposure to the sun. In winter, the leaves fall and sunlight is able to shine on the building’s facade. The site planning is good; therefore, no further optimization plan is required.
2.
Optimization of the architectural design space
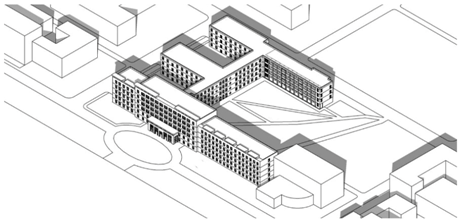
Since the TBI is a historical building, the hybrid renovation approach is mainly adopted. As presented in Table 12, without affecting its exterior style, the design space has been renovated in response to the poor indoor thermal environment and ventilation in winter and summer.
3.
Optimization of the building envelope
The TBI envelope has the highest heat transfer coefficient and no insulation layer is installed on the exterior walls and roof, resulting in a high cold and hot load. Therefore, this paper optimizes the TBI envelope design. as shown in Table 13. After optimization, the heat transfer coefficients of the envelope comply with the “Design Standard for Energy Efficiency of Public Buildings” GB 50189-2015 [20].

4.3. Optimization Plan DeST Simulation

Through the DeST simulation of the TBI optimization scheme, the optimized design of the enclosure structure is illustrated in Table 14. The ambient temperature distribution statistics, as well as cooling and heating load statistics of all rooms before and after TBI optimization, are obtained (see Table 15 and Table 16).
From Table 15, it can be seen that the total number of ambient temperature hours in all TBI rooms increased by 244,746 h during the year, which represents an increase of 38.1%, indicating a 38.1% increase in the duration of comfortable ambient temperature throughout the year and the total number of hours that the ambient temperature in all rooms remained below 18 °C decreased by 152,112 h during the year, a lessening of 23.8%. The total number of hours in which the ambient temperature in all rooms remains above 35 °C throughout the year decreased by 6189 h over the year, a 23% decrease.
In general, the effect of TBI thermal environment optimization is very significant. The duration of the ambient temperature of the comfortable room inside the building increased significantly, with the largest decrease in the duration of low temperatures in winter and extremely high temperatures in summer.
From Table 16, the following can be concluded.
After optimization, all TBI load indicators were reduced to different degrees. The cumulative load of TBI for the whole year decreased from 2,813,212.11 kW·h to 2,189,968.47 kW·h, which represents a decrease of 22.1%. The total load of buildings was significantly reduced during the year and the effect of improving the thermal environment is significant.
The cumulative thermal load of the building has decreased by 28.3% and the cumulative cooling load by 10.1%. The cumulative heat load is reduced even more, reducing the cooling load by about three times. In the heating season, the heating load per unit area decreased by 32.5%, while in the air conditioning season, the cooling load per unit area decreased by 17.2%. The reduction in heat load per unit area during the heating season was about twice the cooling load per unit area during the air conditioning season. The effect of reducing the heating load is more significant during the building heating season.

5. Conclusions

With increasing urbanization and construction activities, the demand for global resources in the building industry is constantly increasing, and optimizing the thermal environment of buildings is becoming very important. It helps to achieve sustainability goals, reduce carbon emissions, reduce climate change, and reduce energy consumption.
This study evaluates the current thermal environment of teaching buildings in cold regions of China in various periods from three dimensions: site planning, architectural design space, and building envelope. Through on-site research, data measurement, and computer simulation, we examine the various thermal environment problems that may be caused by teaching buildings due to different periods. To this end, we proceed with optimizing the thermal environment of the historical teaching building built in the 1950s and 1960s through passive design. The major results obtained can be summarized as follows:
1.
The winter thermal environment problems of teaching buildings were more prominent in the 1950s, 1960s, 1980s, and 1990s and the thermal comfort of buildings was poor in winter. The summer thermal environment problem of teaching buildings was more prominent in the early 21st century and there were generally high indoor temperatures in summer. The teaching buildings of the universities have all generated high cooling and heating loads in three periods and the heating load is higher than the cooling load;
2.
The design problems of the thermal environment of teaching buildings in the 1950s, 1960s, 1980s, and 1990s were essentially ascribed to the excessive heat transfer coefficient of the enclosure structure and poor ventilation of the building. The thermal environment problems of teaching buildings in the early 21st century were mostly focused on site planning and design space. The lack of green space around the building as well as the large body shape coefficient and window-to-wall ratio were more serious problems;
3.
The design concerning the optimization of the thermal environment of teaching buildings in different periods is mainly related to three aspects: site planning optimization, architectural design space, and building envelope optimization. However, the specific approach should be appropriately adjusted according to the architecture of various periods, especially the protection of historical buildings. In the 1950s and 1960s, after three aspects of optimization, the teaching building increased the duration of the comfortable ambient temperature of all rooms by 38% during the year and the cumulative load throughout the year lessened by 22.1%.
Through ongoing research on teaching buildings in universities, it is believed that the thermal environment optimization design of future university buildings should not only prioritize basic comfort but should also integrate intelligent technology, sustainable development concepts, and humanistic care. This will create an ideal place for teachers and students to promote academic research, innovative thinking, and social interactions.

Author Contributions

Conceptualization, L.F. and Q.L.; methodology, L.F., X.Y. and Q.L.; software, X.Y. and X.H.; validation, X.Y., L.F. and Q.L.; formal analysis, X.Y. and X.H.; investigation, X.Y. and X.H.; resources, L.F. and X.H.; data curation, L.F. and X.Y.; writing—original draft preparation, L.F., X.Y. and Q.L.; writing—review and editing, L.F. and Q.L.; visualization, X.Y. and X.H.; supervision, L.F. and Q.L.; project administration, L.F.; funding acquisition, Q.L. All authors have read and agreed to the published version of the manuscript.

Funding

This research was funded by Shaanxi Provincial Department of Science and Technology, funding number: 2024GH-ZDXM-03, as well as Shaanxi Provincial Department of Housing and Urban-Rural Development, funding number: 2021-K29.

Institutional Review Board Statement

Not applicable.

Informed Consent Statement

Not applicable.

Data Availability Statement

The data presented in this study are available on request from the corresponding author.

Conflicts of Interest

Author Liping Fan was employed by Northwest Research Institute of Engineering Investigations and Design; Author Xiao Han was employed by Guangdong Architectural Design and Research Institute Co., Ltd. The remaining authors declare that the research was conducted in the absence of any commercial or financial relationships that could be construed as potential conflicts of interest.

References

  1. Jiang, Y. Annual Development Research Report on Energy Efficiency in Chinese Buildings 2023; Special Topic on Urban Energy Systems; Tsinghua University Building Energy Conservation Research Center: Beijing, China, 2023. [Google Scholar]
  2. Ministry of Education of the People’s Republic of China. Implementation Plan for the Construction of National Education System for Green and Low Carbon Development. Available online: http://www.moe.gov.cn/srcsite/A03/moe_1892/moe_630/202211/t20221108_979321.html?eqid=8b0850fb0003f114000000046477ff61 (accessed on 31 October 2022).
  3. An, X.; Xiong, X.; Li, Y.-E. The Course and Feature of Higher Education since the Founding of the People’s Republic of China. Contemp. Educ. Cult. 2020, 12, 75–80. [Google Scholar]
  4. Fanger, P.O. Thermal Comfort. Analysis and Application in Environment Engineering; Danish Technical Press: Copenhagen, Denmark, 1970; Volume 45, p. 244. [Google Scholar]
  5. ANSI/ASHRAE 55-2023; Thermal Environmental Conditions for Human Occupancy. ASHRAE: Peachtree Corners, GA, USA, 2020.
  6. ISO 7730:2005; Ergonomics of the Thermal Environment-Analytical Determination and Interpretation of Thermal Comfort Using Calculation of the PMV and PPD Indices and Local Thermal Comfort Criteria. ISO: London, UK, 2005.
  7. Omidvar, A.; Kim, J. Modification of sweat evaporative heat loss in the PMV/PPD model to improve thermal comfort prediction in warm climates. Build. Environ. 2020, 176, 106868. [Google Scholar] [CrossRef]
  8. Zhang, H.; Yang, X.; Zheng, W.; You, S.; Zheng, X.; Ye, T. The CPMV* for assessing indoor thermal comfort and thermal acceptability under global solar radiation in transparent envelope buildings. Energy Build. 2020, 225, 110306. [Google Scholar] [CrossRef]
  9. Liu, G.; Wang, X.; Meng, Y.; Zhang, Y.; Chen, T.   Research on prediction and regulation of thermal dissatisfaction rate based on personalized differences. Appl. Sci. 2023, 13, 7978. [Google Scholar] [CrossRef]
  10. Barbhuiya, S.; Barbhuiya, S. Thermal comfort and energy consumption in a UK educational building. Build. Environ. 2013, 68, 1–11. [Google Scholar] [CrossRef]
  11. Zomorodian, Z.S.; Tahsildoost, M.; Hafezi, M. Thermal comfort in educational buildings: A review article. Renew. Sustain. Energy Rev. 2016, 56, 895–906. [Google Scholar] [CrossRef]
  12. Mohelníková, J.; Novotný, M.; Mocová, P. Evaluation of school building energy performance and classroom indoor environment. Energies 2020, 13, 2489. [Google Scholar] [CrossRef]
  13. Suradhuhita, P.P.; Setyowati, E.; Prianto, E. Influence of a facade design on thermal and visual comfort in an elementary school classroom. IOP Conf. Ser. Earth Environ. Sci. 2022, 1007, 012013. [Google Scholar] [CrossRef]
  14. Camacho-Montano, S.C.; Cook, M.; Wagner, A. Avoiding overheating in existing school buildings through optimized passive measures. Build. Res. Inf. 2019, 48, 349–363. [Google Scholar] [CrossRef]
  15. Wang, Y.J.; Yang, W.B.; Wang, Q. Multi-objective parametric optimization of the composite external shading for the classroom based on lighting, energy consumption, and visual comfort. Energy Build. 2022, 275, 112441. [Google Scholar] [CrossRef]
  16. Monna, S.; Baba, M.; Juaidi, A.; Barlet, A.; Bruneau, D. Improving thermal environment for school buildings in Palestine, the role of passive design. J. Phys. Conf. Ser. 2019, 1343, 012190. [Google Scholar] [CrossRef]
  17. Ghosh, A.; Sarmah, N.; Sundaram, S.; Mallick, T.K. Numerical studies of thermal comfort for semi-transparent building integrated photovoltaic (BIPV)-vacuum glazing system. Sol. Energy 2019, 190, 608–616. [Google Scholar] [CrossRef]
  18. GB50176-2016; Thermal Design Code for Civil Building. China Architecture & Building Press: Beijing, China, 2016; p. 77.
  19. GB/T 18883-2022; Indoor Air Quality Standard. Standards Press of China: Beijing, China, 2022; p. 2.
  20. GB50189-2015; Design Standard for Energy Efficiency of Public Buildings. China Architecture & Building Press: Beijing, China, 2015; pp. 9–10.
  21. GB50736-2012; Design Code for Heating Ventilation and Air Conditioning of Civil Buildings. China Architecture & Building Press: Beijing, China, 2012; p. 5.
  22. GB/T 50785-2012; Evaluation Standard for Indoor Thermal Environment in Civil Buildings. China Architecture & Building Press: Beijing, China, 2012; pp. 6–10.
  23. Yu, C.; Hien, W.N. Thermal benefits of city parks. Energy Build. 2006, 38, 105–120. [Google Scholar] [CrossRef]
  24. Dimoudi, A.; Nikolopoulou, M. Vegetation in the urban environment: Microclimatic analysis and benefits. Energy Build. 2003, 35, 69–76. [Google Scholar] [CrossRef]
  25. Yang, L. Building Climatology; China Architecture & Building Press: Beijing, China, 2015. [Google Scholar]
  26. Doulos, L.; Santamouris, M.; Livada, I. Passive cooling of outdoor urban spaces. The role of materials. Sol. Energy 2004, 77, 231–249. [Google Scholar] [CrossRef]
  27. Wang, J. Regional Application Strategies of Ecological Architecture Technology. Master’s Thesis, Hebei University of Engineering, Handan, China, 2011. [Google Scholar]
  28. Long, L. The Research on Technology For Rural Housing Building Energy Efficiency in Northwest China. Master’s Thesis, Lanzhou University of Technology, Lanzhou, China, 2012. [Google Scholar]
  29. Zhu, Q.; Wu, F.; Zhao, J. Research advances in thermal insulation materials used for external walls. New Build. Mater. 2012, 39, 12–16. [Google Scholar]
  30. Jiang, Y. Current building energy consumption in China and effective energy efficiency measures. J. HVAC 2005, 5, 30–40. [Google Scholar]
  31. He, W. The Research on the Conservation of Campus Heritage and Sustainable Development in the Taibai Campus of Northwest University. Master’s Thesis, Northwest University, Xi’an, China, 2018. [Google Scholar]
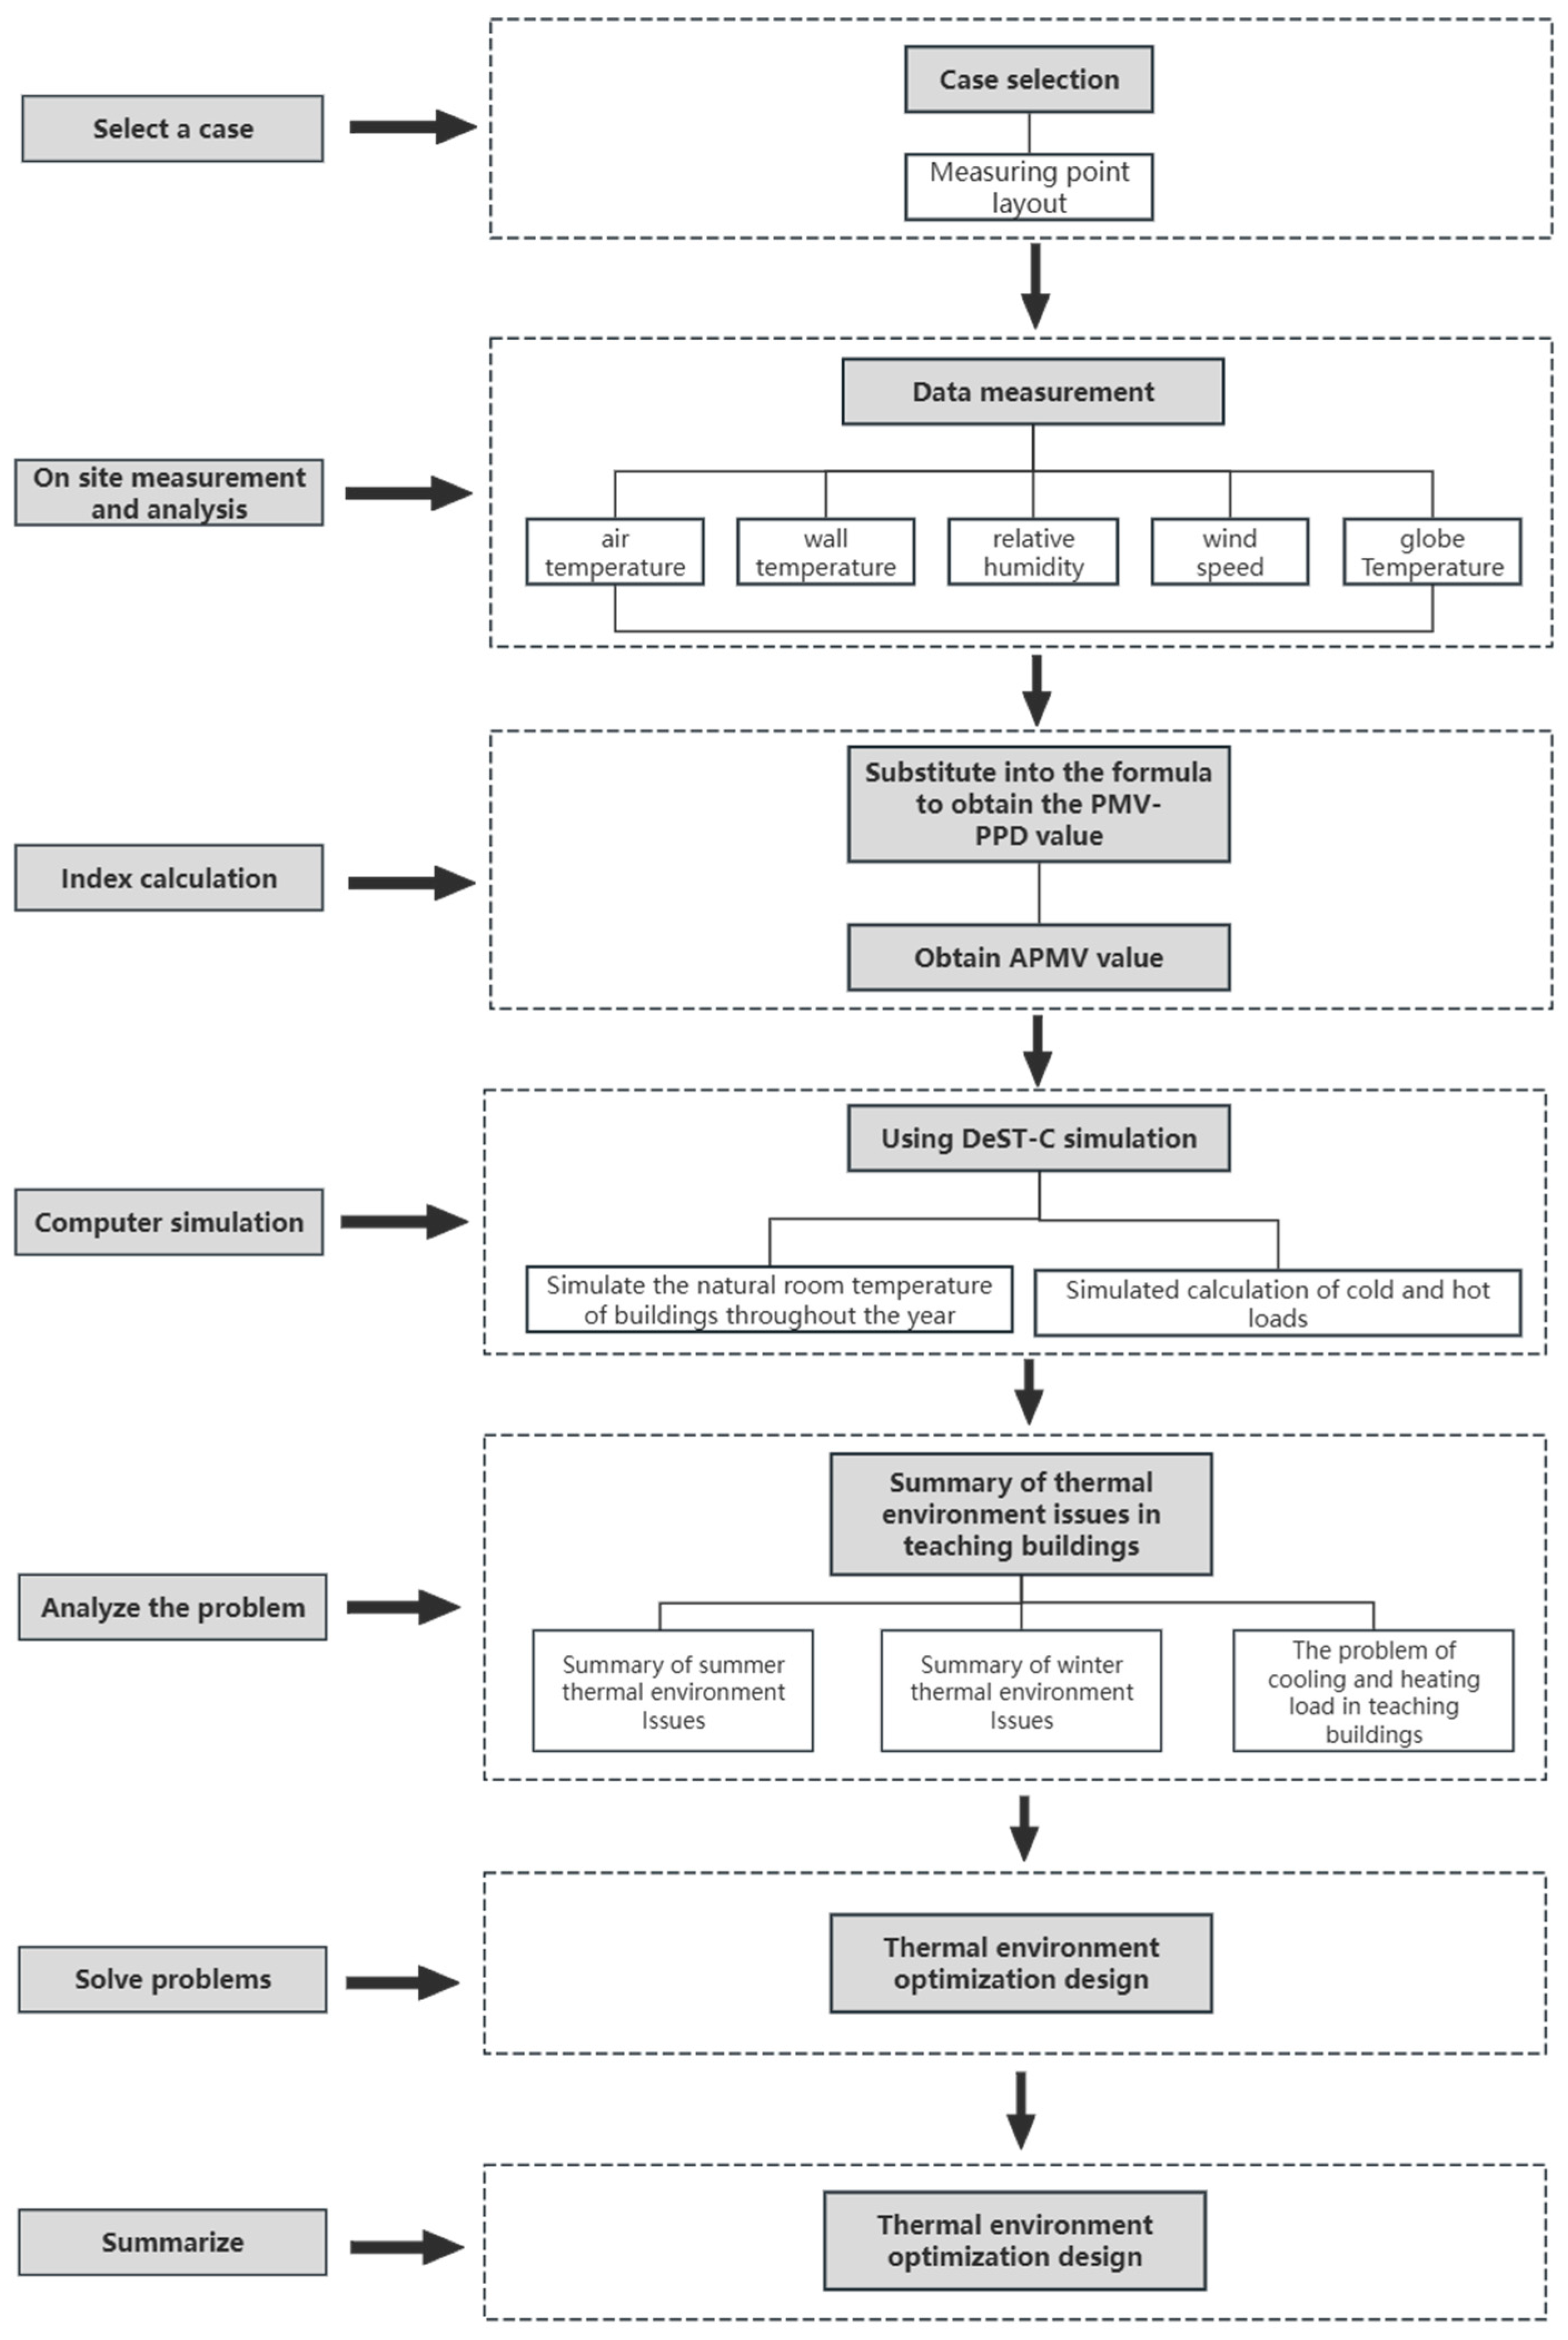
Figure 1. Research method roadmap.
Sustainability 16 06547 g001
Figure 2. Schematic representation of climate zoning in China [19].
Sustainability 16 06547 g002
Figure 3. Full-day temperature in testing rooms of various teaching buildings in summer. (a) Comparison of all-day temperature in TBI test rooms; (b) Comparison of all-day temperature in TBII test rooms; (c) Comparison of all-day temperature in TBIII test rooms.
Sustainability 16 06547 g003
Figure 4. Humidity of testing rooms in various teaching buildings throughout the day in summer. (a) Comparison of humidity in TBI testing rooms throughout the day. (b) Comparison of humidity in TBII testing rooms throughout the day. (c) Comparison of humidity in TBIII testing rooms throughout the day.
Sustainability 16 06547 g004
Figure 5. Full-day indoor air velocity in testing rooms of various teaching buildings in winter and summer. (a) Comparison of all-day indoor air velocity in TBI testing rooms. (b) Comparison of all-day indoor air velocity in TBII testing rooms. (c) Comparison of all-day indoor air velocity in TBIII testing rooms.
Sustainability 16 06547 g005
Figure 6. Full-day temperature in testing rooms of various teaching buildings in winter. (a) Comparison of all day temperature in TBI test rooms. (b) Comparison of all day temperature in TBII test rooms. (c) Comparison of all day temperature in TBIII test rooms.
Sustainability 16 06547 g006
Figure 7. Humidity of testing rooms in various teaching buildings throughout the day in winter. (a) Comparison of humidity in TBI testing rooms throughout the day. (b) Comparison of humidity in TBII testing rooms throughout the day. (c) Comparison of humidity in TBIII testing rooms throughout the day.
Sustainability 16 06547 g007
Figure 8. APMV values of testing rooms in various teaching buildings. (a) APMV values for TBI testing rooms. (b) APMV values for TBII testing rooms. (c) APMV values for each testing room in the TBIII building.
Sustainability 16 06547 g008
Figure 9. PMV-PPD values in the testing rooms of various teaching buildings. (a) PMV-PPD values for TBI testing rooms. (b) PMV-PPD values for TBII testing rooms. (c) PMV-PPD values for TBIII testing rooms.
Sustainability 16 06547 g009
Figure 10. Annual room temperature simulation of testing rooms in various teaching buildings. (a) The statistical distribution map of the ambient temperature in TBI. (b) The statistical distribution map of the ambient temperature in TBII. (c) The statistical distribution map of the ambient temperature in TBIII.
Sustainability 16 06547 g010
Figure 11. Optimization design of the building’s thermal environment.
Sustainability 16 06547 g011
Figure 12. The relationship between the decrease in the air temperature and the green areas.
Sustainability 16 06547 g012
Table 1. Summary of the characteristics of teaching buildings in higher education institutions of different periods in Xi’an.
Aspect1950s–1960s1980s–1990sIn the Early 21st Century
Site planningSite selection and layoutLocated in an old urban area, with flat terrain and tight land use, the building layout is relatively compactLocated in the new campus on
the outskirts of the city, with ample land and a relatively loose architectural layout
Building orientationMainly oriented north-south, with fewer rooms facing east-westBuildings are mostly combination form, with more rooms facing east and west
landscapeThe building is surrounded by lush trees and vegetation, providing ample shadeThere is relatively less vegetation around the building, and the trees are relatively low, providing less shade around the buildingThere is relatively less vegetation around the building and it is mostly composed of low trees and shrubs, which are unable to provide shade around the building
Architectural design space Plan layoutMostly in rectangle combination, usually in the form of an inner corridorMostly in rectangle combination, usually in the form of an inner corridorMost of them are fully enclosed-shaped combinations. Usually enclosed or open corridor-style
Spatial characteristicsThe width and depth are relatively small, mainly consisting of small and medium-sized rooms. The internal space is relatively single and no public space is detectable. The buildings are not equipped with door bucketsThe building has spacious rooms with a focus on medium to large sizes and the width and depth of the building are relatively large. The internal space is well-appointed and usually includes an inner courtyard. Notably, there are no door pockets in the building
Building shape coefficient<0.2<0.20.2~0.3
Building envelopeExterior wall370 mm brick wall, without insulation370 mm brick wall, no insulation or low insulation standards240 mm brick wall, more external wall insulation is exploited with higher insulation standards
RoofFlat roof, sloping roof (without insulation)Flat roofs, mostly upright insulated roofs (with lower insulation standards)Flat roofs, mostly upright insulated roofs (with higher insulation standards)
Doors and windowsInternal doors, external doors, and windows are generally made of wood, glass, and single-layer glass, respectively
Window-to-wall ratioMostly between 0.2 and 0.3Mostly between 0.3 and 0.4
Table 2. Basic information of the typical cases.
Case 1. TBI (Built in 1961)
Site planningBuilding orientationThe overall orientation is north-south, with a small portion of auxiliary buildings facing east-west.Sustainability 16 06547 i001
landscapesurrounded by abundant vegetation, providing shade in summer.
Architectural design spacePlan layoutRectangle combinationSustainability 16 06547 i002
Spatial characteristicsThe north part is designed as an open external corridor, while the rest are internal corridors with high windows.
Building shape coefficient0.2
Building envelopeDuring winter, the building experiences severe air leakage due to poor airtightness of the exterior doors and windows. In summer, ventilation is limited due to the limiters on the sliding windows. The exterior walls and roofs are not insulated, despite being made of brick, and the window-to-wall ratio is 0.22.
The heat transfer coefficient (K) of the roof is 2.047 (W/m2·K) The K value of the exterior wall is 1.57 (W/m2·K). The K value of the external window and door is 5.7 (W/m2·K). In addition, the K values of both of these do not comply with the “Design Standard for Energy Efficiency of Public Buildings” GB 50189-2015 [20].
Case 2. TBII (Built in 1998)
Site planningBuilding orientationNorth-South orientationSustainability 16 06547 i003
landscapeMainly consisting of low shrubs, low trees, and lawns.
Architectural design spacePlan layoutThe building is a deformed rectangle, consisting of a rectangular mass and a semi-circular mass.Sustainability 16 06547 i004
Spatial characteristicsInterior corridor building with high internal windows resulting in poor ventilation and poor lighting.
Building shape coefficient0.19
Building envelopeThe building has a window-to-wall ratio of 0.2. It is made of brick and concrete with no insulation on the exterior walls, but it has a 120 mm thick insulation layer on the roof. The exterior doors and windows of the building are not airtight, which leads to severe air leakage during winter and poor ventilation in summer.
The heat transfer coefficient (K) of the roof is 1.113 (W/m2·K). The K values of the exterior wall and external window in order are 1.107 and 5.7 (W/m2·K). Furthermore, the K value of both of these does not comply with the “ Design Standard for Energy Efficiency of Public Buildings” GB 50189-2015 [20].
Case 3. TBIII (Built in 2014)
Site planningBuilding orientationMost rooms with a south-by-east angle of 20°, whereas the rest of the rooms are oriented east-west.Sustainability 16 06547 i005
landscapeThe surrounding vegetation is sparse, and the landscape is poor.
Architectural design spacePlan layoutComposed of two fully enclosed-shaped combinations, the two parts are connected through outdoor corridors.Sustainability 16 06547 i006
Spatial characteristicsAdopting a closed outer corridor, the northern atrium is connected to the central courtyard by an overhead connection, and the high windows of the inner corridor are too high.
Building shape coefficient0.23
Building EnvelopeThe window-to-wall ratio is 0.3, and the exterior wall adopts 240 brick walls. The roof is flat with an upright insulated roof. Small opening area for external sliding windows.
The heat transfer coefficient (K) of the roof is 0.658 (W/m2·K). The K values of the exterior wall and external window in order are 0.748 and 5.7 (W/m2·K). It should be noted that the K, both of which do not comply with the “ Design Standard for Energy Efficiency of Public Buildings” GB 50189-2015 [20].
Table 3. The range and precision of the testing instrument.
Test ItemsTesting InstrumentsInstrument RangeInstrument PrecisionInstrument Images
Air temperature
Relative humidity
Temperature and humidity recorder
ONSET HOBO UX100-003
−20 °C to 70 °C
15% to 95% RH
±0.21 °C
(0 °C to 50 °C)
±3.5% (25% to 85%)
Sustainability 16 06547 i007
Wall temperatureTemperature gun
(UNI.T) UT302A+
−32 °C to 700 °C±1.5 °CSustainability 16 06547 i008
AirspeedAnemometer
testo405V1
0~10 m/s± (0.1 m/s + 5% measured value) (0–2 m/s) Sustainability 16 06547 i009
Globe temperatureBlack bulb thermometer
AZ8778
0~80 °CIndoor ± 1 °C (15–40 °C), other 1.5 °CSustainability 16 06547 i010
Table 4. Sketch a map of the distribution of measurement points in the middle floor of the thermal environment for each teaching building.
Sketch Map of the Teaching BuildingClassroom Size
Sketch map of the TBISustainability 16 06547 i011Size of the large classroom: 14.4 m × 8.2 m = 118.08 m2 Small classroom size: 9.6 m × 6.2 m = 59.52 m2
Sketch map of the TBIISustainability 16 06547 i012Size of the large classroom: 12 m × 9.6 m = 115.2 m2
Small classroom size: 9.6 m × 6 m = 57.6 m2
Sketch map of the TBIIISustainability 16 06547 i013Size of the large classroom: 9.5 m × 12 m = 114 m2
Table 5. Thermal environment measurement analysis of teaching buildings in winter and summer seasons.
Measured DataTBITBIITBIIIAnalysis Results
SummerAverage indoor temperature30.8 °C30.5 °C33.7 °CTBIII is the hottest in summer and the highest temperature in the top floor room can reach 36.3 °C
Temperature difference between the inner and outer walls of the exterior wall2~3.5 °CAround 4 °CAround 8 °CThe thermal insulation performance of TBIII exterior walls is the best, whereas TBI exhibits the worst
HumidityBetween 24% and 64%, with an average humidity of 44.2%Between 15% and 50%, with an average humidity of 32.3%Between 20% and 45%, with an average humidity of 29.16%Between 20% and 45%, with an average humidity of 29.16%
Indoor air velocityMaximum indoor air velocity: 0.06 m/s
Minimum indoor air velocity: 0 m/s
Average indoor air velocity: 0.019 m/s
Maximum indoor air velocity: 0.04 m/s,
Minimum indoor air velocity: 0 m/s,
Average indoor air velocity: between 0.01 and 0.02 m/s
Maximum indoor air velocity: 0.06 m/s
Minimum indoor air velocity: 0 m/s
Average indoor air velocity: 0.02 m/s
The overall ventilation of the teaching building is poor in summer.
Average APMV value1.221.221.67The APMV values of the three teaching buildings are all relatively high, with TBIII having the highest value and the worst thermal comfort
WinterAverage indoor temperature13.7 °C16.5 °C15.9 °CTBI exhibits the lowest average indoor temperature
Temperature difference between the inner and outer walls of the exterior wall11.5 °C4 °C13 °CThe better insulation performance of TBIII exterior walls
HumidityBelow 15%Below 15%Below 15%The humidity is all less than 15%. The indoor environment is relatively dry
Indoor air velocity0 m/s0 m/s0 m/sThe three teaching buildings are accustomed to tightly closing the doors and windows of the classrooms in winter to reduce indoor heat loss, so they are all in a windless state. The sealing of TBI and TBII doors and windows is poor.
PMV value−2.74−2.01−2.32The three teaching buildings are far from meeting the level I and II standards, with TBI being the worst PMV-PPD indicator among the three teaching buildings.
PPD value95.6%73.43%80.81%
Table 6. DeST building cooling and heating load statistics.
Statistical ItemsUnitTBITBIITBIII
Total building air conditioning aream213,113.853154.0811,188.44
Project load statistics
Annual maximum heat loadkW2328.38587.703089.96
Maximum annual cooling loadkW2330.49600.433075.41
Annual cumulative heat loadkW·h1,865,861.69423,695.031,682,497.43
Annual cumulative cooling loadkW·h947,350.42193,057.57591,173.33
Project unit area load
Maximum annual heat load per unit areaW/m2177.55186.33276.17
Maximum annual cooling load per unit areaW/m2177.71190.37274.87
Annual cumulative heat load per unit areakW·h/m2142.28134.33150.38
Annual cumulative cooling load per unit areakW·h/m272.2461.2152.84
Seasonal load per unit area of the project
Heating load per unit area during the heating seasonW/m240.2237.3041.22
Seasonal cooling load of air conditioning per unit areaW/m225.1820.8114.95
Accumulated load
Accumulated annual cooling and heating loadkW·h2,813,212.11616,752.62,273,670.76
Table 7. Summer thermal environment problems and analysis of teaching buildings.
IssueTeaching BuildingCurrent Situation ReasonsCausing Thermal Environment Issues
Site planningTBII1. There is a building blocking the southwest side of TBII.
2. The commercial street on the north side of TBII generates a large amount of heat.
Actual measurement data shows that the temperature in the northbound room on the same floor is slightly higher than that in the southbound room.
TBIII1. Some things are facing the room.
2. The area near TBIII is mostly hard-paved with less greenery.
Severe exposure to sunlight and high room temperature.
Architectural design spaceTBIIIThe TBIII building exhibits the highest shape coefficient and window-to-wall ratio among the three teaching buildings.1. The TBIII enclosure structure has better insulation performance compared to two other teaching buildings from different eras. However, during summer, the indoor temperature often rises above 35 °C and remains high for a significant period of time throughout the year.
2. The APMV value is the highest, and the summer thermal comfort is the worst.
TBIThe temperature in the inner corridor room is too high.The high windows set up in the inner corridor and the small size of the windows cause poor ventilation.
Building
envelope
The three teaching buildings mentioned aboveThe heat transfer coefficients of the enclosure structures of these three teaching buildings are all greater than the heat transfer coefficient limit specified in the “Design Standard for Energy Efficiency of Public Buildings” GB 50189-2015 [20].1. The temperature of each teaching building does not meet the comfortable temperature range for the human body.
2. The APMV value is relatively high and the thermal comfort is almost poor.
The heating area of the top room is relatively large, and the insulation effect of the roof is fairly poor.With the growth of the floor number, the temperature rises, and the temperature in the top room is too high in summer.
1. Windows are equipped with limiters to limit their opening area.
2. The high windows in the corridor have been in a closed state for a long time.
Low indoor air velocity and poor ventilation.
Table 8. Winter thermal environment problems and analysis of understudied teaching buildings.
IssueTeaching BuildingCurrent Situation ReasonsCausing Thermal Environment Issues
Architectural design spaceTBILack of corridor barriers, increasing the contact area between the classroom and the outside world.The temperature in the corridor room is too low.
TBIIINo door hopper set.The temperature in the foyer is too low.
Building envelopeThe three teaching buildings mentioned above1. The heat transfer coefficients of the three teaching buildings are all greater than the specified heat transfer coefficient limit and actual research has found that the sealing of doors and windows is poor and easy to ventilate.1. The temperature in each teaching building is relatively low and the duration of indoor ambient temperature below 18 °C accounts for about 30% to 40% of the entire year.
The PMV-PPD values did not meet the standards of Level I and Level II.
2. There is no door hopper installed at the exit of the first floor, and the area of the top floor room in contact with cold air is large, resulting in insufficient roof insulation.1. The temperature in the first and top rooms of the teaching building is relatively low.
TBIThe heat transfer coefficient of the enclosure structure is high, the degree of aging of the enclosure structure is high, and no insulation layer is installed on the exterior walls and roof.PMV-PPD exhibits the worst thermal comfort level.
TBIIThe heat transfer coefficient of the enclosure structure is too high, and the degree of aging of the enclosure structure is relatively high.Under normal heating conditions, the indoor temperature is relatively low, making it difficult for the room to reach 18 °C.
Climate factorsThe three teaching buildings mentioned aboveThe winter in Xi’an is cold and dry and doors and windows are often tightly closed in winter.Indoors are relatively dry.
Table 9. Problems and analysis of cooling and heating load in teaching buildings.
IssueCurrent Situation ReasonsThe Formed Load Characteristics
Architectural design spaceTBIII has a large body shape coefficient and a high window-to-wall ratio, resulting in a high maximum load per unit area.Maximum annual cooling and heating load per unit area: TBIII > TBI > TBII
Building
envelope
The TBI enclosure structure has a high heat transfer coefficient, a large body shape coefficient, and a high window-to-wall ratio. However, the exploitation of TBIII during winter and summer vacations is relatively low, which may lead to a decrease in the cumulative annual cooling and heating load per unit area.Annual cumulative cooling and heating load per unit area: TBI > TBIII > TBII
Climate factorsLocated in the cold Zone B of China, the cold weather lasts for a long time throughout the year.The cumulative heat load of the three teaching buildings throughout the year is higher than the cooling load
Table 10. Calculation parameters for thermal physical properties of building insulation system materials.
Material NameDry Density ρ0
(kg/m3)
Thermal Conductivity λ [W/(m·K) ]Thermal Storage Coefficient
S
(Cycle 24 h) [W/(m2·K)]
Specific Heat Capacity C
[kJ/(kg·K)]
Coefficient of Vapor μ (×104)
[g/m·h·Pa)]
Polyurethane rigid foam (PU) 350.0240.291.380.234
Polystyrene foam (EPS) 200.039
(whiteboard)
0.033 (Gray board)
0.281.380.162
Extruded polystyrene foam
(XPS)
350.030 (With epidermis) 0.032 (Without skin) 0.341.38-
Table 11. Thermal environment optimization design of teaching buildings in universities of various periods in the Xi’an area.
Optimization Aspect1950s–1960s1980s–1990sIn the Early 21st Century
Site optimization_Combining vertical greening with roof greeningReduced hard paving around buildings, increased green space and water area around buildings
Optimization of architectural design space1. Optimize historical buildings without affecting the exterior facade and reduce the shape coefficient
2. Optimize corridor high windows
3. Indoor entrance and exit division
1. Reduce the shape coefficient and increase the building space through renovation and expansion
2. Optimize corridor high windows
3. Set the door hopper
1. Moderate enclosure shall be provided for open corridors, outdoor corridors, and elevated floors; Small courtyards are closed using openable glass skylights to reduce system coefficients
2. Optimize corridor high windows
3. Set the door hopper
Optimization of the building envelope1. Internal insulation of exterior walls of historical buildings
2. Adopting energy-saving doors and windows
3. Roof insulation renovation
4. Internal shading of buildings
1. External wall insulation
2. Replace the energy-saving and airtight center hanging windows and outer doors
3. Internal and external shading of buildings (south)
4. Inverted insulation roof renovation
5. Planting roof/ventilation/elevated roof
1. External wall insulation renovation
2. Replace the energy-saving and airtight center hanging windows and outer doors
3. Internal and external shading of buildings (different approaches for south, east, and west directions)
4. Inverted insulation roof renovation planted roof/ventilation/elevated roof
Table 12. TBI modeling space optimization design.
Thermal Optimization Design of Styling SpaceAnalysis
Sustainability 16 06547 i014
1. The southern part of the northern block has been converted from an open external corridor to a closed external corridorSustainability 16 06547 i015Reduce the building shape coefficient to avoid low temperatures in the outdoor corridor rooms during winter
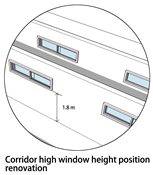
2. Corridor high window optimization, changing the corridor high window to a position of 1.8 m for easy accessSustainability 16 06547 i016Strengthen indoor and outdoor air circulation
3. Set up door buckets at the main entrances and exits, and divide the indoor areas to avoid affecting the external facadeSustainability 16 06547 i017Act as an airlock to reduce indoor temperature fluctuations. In summer, door handles are capable of reducing the amount of sunlight entering buildings and alleviating indoor overheating issues. In winter, door buckets are able to provide additional insulation to reduce indoor heat loss.
4. Transforming idle rooms with low utilization rates into open corridor spaces, such as discussion and communication spacesSustainability 16 06547 i018Release the space at the end of the corridor, open spaces not only have lower temperatures but also enhance building ventilation
Table 13. Optimization design of the TBI building envelope.
Optimization Design of Building EnvelopeAnalysis
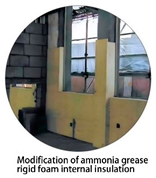
1. Polyurethane rigid foam external wall internal insulation transformationSustainability 16 06547 i019Maintain historical buildings without affecting the exterior facade, reduce the heat transfer coefficient of the exterior wall, simulate after renovation, and the K value is 0.5 (W/m2·K)
2. Replace the outer window with a heat-insulating aluminum profile Low-E hollow high transparency glass window, while retaining the original separation and opening formSustainability 16 06547 i020Replace energy-saving doors and windows, enhance their airtightness, simulate after renovation, and the K value is 0.25 (W/m2·K)
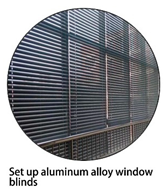
3. Set up aluminum alloy internal shading louversSustainability 16 06547 i021Prevent direct sunlight exposure in summer
4. Transform the roof into an inverted insulated roofSustainability 16 06547 i022Strengthening roof insulation and heat preservation, simulated after renovation, with a K value of 0.45 (W/m2·K)
Table 14. Optimization plan for the TBI and enclosure structure design.
ElementMethod ConstructionSchematic Representation of the Enclosure Structure Construction MethodThe Heat Transfer Coefficient (K) [W/m2·K]
Roof(1) Concrete slab
(2) 50 mm thick PU insulation board
(3) Two layers of asphalt felt and three layers of hot asphalt
(4) Two coats of adhesive bitumen primer
(5) 20 mm thick cement mortar
(6) Reinforced concrete roof panels
Sustainability 16 06547 i0230.45
Exterior wall(1) 18 mm thick cement mortar
(2) Red clay brick wall
(3) Original paint layer
(4) Air space
(5) 20 mm thick PU inner wall insulation board
(6) Glass fiber mesh cloth
(7) Interior wall coating
Sustainability 16 06547 i0240.5
Outer windowWindow frame: heat-resistant aluminum profile
Glass: LOW-E hollow high-transparency glass
Sustainability 16 06547 i0250.24
Table 15. Ambient temperature distribution statistics of all rooms before and after TBI optimization.
T < 18 °C18 ≤ T < 28 °C28 ≤ T < 35 °CT ≥ 35 °C
Hours (h) (before optimization) 638,730641,784461,58327,423
Hours (h) (optimized) 486,618886,530375,13821,234
Change amount−152,112+244,746−86,445−6189
Proportion (before optimization) 36.1%36.3%26.1%1.5%
Proportion (after optimization) 27.5%50.1%21.2%1.2%
Change rateReduced by 23.8%Increased by 38.1%Reduced by 18.7%Reduced by 23%
Table 16. Statistics of cold and hot loads before and after TBI optimization.
Statistical ItemsUnitBefore OptimizationAfter OptimizationOptimization Effect
Total building air conditioning aream213,113.8514,173.96
Project load statistics
Annual maximum heat loadkW2328.381721.61Reduced by 26.1%
Maximum annual cooling loadkW2330.492243.41Reduced by 3.7%
Annual cumulative heat loadkW·h1,865,861.691,338,418.41Reduced by 28.3%
Annual cumulative cooling loadkW·h947,350.42851,550.06Reduced by 0.1%
Project unit area load
Annual maximum heat load per unit areaW/m2177.55121.46Reduced by 31.6%
Annual maximum cooling load per unit areaW/m2177.71158.28Reduced by 10.9%
Annual cumulative heat load per unit areakW·h/m2142.2894.43Reduced by 33.6%
Annual cumulative cooling load per unit areakW·h/m272.2460.08Reduced by 16.8%
Project load per unit area by season
Heating load per unit area during the heating seasonW/m240.2227.16Reduced by 32.5%
Cooling load per unit area during the air conditioning seasonW/m225.1820.86Reduced by 17.2%
Accumulated load
Annual cumulative loadkW·h2,813,212.112,189,968.47Reduced by 22.1%
Disclaimer/Publisher’s Note: The statements, opinions and data contained in all publications are solely those of the individual author(s) and contributor(s) and not of MDPI and/or the editor(s). MDPI and/or the editor(s) disclaim responsibility for any injury to people or property resulting from any ideas, methods, instructions or products referred to in the content.