Article

Health Risk Assessment of Road-Dust-Bound Heavy Metals via Ingestion Exposure from One Typical Inland City of Northern China: Incorporation of Sources and Bioaccessibility

1
College of Geography and Environment, Shandong Normal University, Jinan 250358, China
2
Jinan Environmental Research Institute (Jinan Yellow River Basin Ecological Protection Promotion Center), Jinan 250100, China
3
Jinan Ecological Environment Monitoring Center Jiyang Branch Center, Jinan 251400, China
4
State Key Laboratory of Pollution Control and Resource Reuse, School of the Environment, Nanjing University, Nanjing 210023, China
*
Author to whom correspondence should be addressed.
These authors contributed equally to this work.
Sustainability 2024, 16(15), 6550; https://doi.org/10.3390/su16156550
Submission received: 17 June 2024 / Revised: 22 July 2024 / Accepted: 28 July 2024 / Published: 31 July 2024

Abstract

:
Heavy metals in road dust pose potential health risks to humans, while oral bioaccessibility and sources are all important factors influencing this health risk. However, few prior studies have combined them for health risk analysis. In this study, road dust samples were collected from different geographical locations of Jinan (west area, WA; central area, CA; and east area, EA) to analyze the source-specific and bioaccessibility-based health risks of heavy metals. The mean concentrations of heavy metals in the three areas were CA > EA > WA, with Cd, Cu, Mn, Pb, and Zn exceeding their corresponding background values. A source analysis using a Positive Matrix Factorization (PMF) model showed that traffic emissions were the main source of heavy metals in the WA and CA, while industrial activities were the main source in the EA. The mean bioaccessibility of heavy metals extracted using the Solubility Bioaccessibility Research Consortium (SBRC) method followed the order of Cd (75.5%) > Zn (42.2%) > Mn (42.1%) > Pb (42.0%) > Cu (32.9%) > As (23.6%) > Ni (20.1%) > V (16.8%) > Cr (13.3%). According to the combined source analysis, traffic was the primary risk factor in the WA (54.5 and 58.3% of NCR and CR, respectively) and CA (61.8 and 51.2%), with solid waste being the main risk factor in the EA (41.9 and 51.3%). In oral bioaccessibility testing, lower non-carcinogenic (<1.0) and carcinogenic risks (<1 × 10⁻⁶) of heavy metals were observed than those based on the total metal content. More importantly, As (43.4%) was replaced by V (29.7%) as the main contributor to NCR. Source-specific and bioaccessibility-based health risk assessments can accurately identify priority pollutants and heavy metals in urban road dust that need to be controlled. This provides more effective and accurate urban environmental risk management recommendations for sustainable urban development and population health.

1. Introduction

Over the past few decades, the protracted trajectory of accelerated industrialization and extensive urbanization in China has engendered a discernible deterioration in the overall quality of the urban environment [1]. The accumulation of solid particles on external ground surfaces, referred to as road dust, serves as a good indicator of the state of urban environmental quality, thereby eliciting significant public attention [2] Road dust originates from a wide range of sources, including local surface soil erosion, industrial and traffic activities (such as tire brake wear), and fossil fuel burning [3,4]. In addition, road dust, due to its large surface area and ease of resuspension, undergoes constant redistribution in the atmosphere, facilitating the spread of environmental pollutants and posing potential health risks to urban inhabitants [5]. Heavy metals are priority environmental pollutants and have received attention because of their toxicity [6,7]. It has been reported that children can ingest 20–200 mg of dust via daily hand-to-mouth activity [7]. Currently, >50% of the global population lives in urban areas, thereby characterizing the health risks of the heavy metals found in road dust as important for urban environmental control and management.
To effectively control the metal pollution caused by road dust, it is essential to identify the pollution source. Li et al. analyzed the source distribution of Pb in 24 dust samples in detail using the Pb isotope tracer method [8]. Principal component analysis–multiple linear regression (PCA-MLR) has also been widely used in source analysis due to its ability to simultaneously analyze the total amount of heavy metals in dust [5,9]. Most common source apportionment models for heavy metals in road dust lack detailed quantitative analysis for individual elements [10]. Given the Positive Matrix Factorization (PMF) model’s capability to furnish quantifiable insights into the individual contribution of each source category, which is significant in enhancing source apportionment accuracy [11,12], using PMF to accurately identify the sources of heavy metals in road dust and to clarify the direction of heavy metal pollution control in urban dust has great significance for urban pollution control and protecting the health of the population.
Fine dust, a notable carrier of heavy metals, is a key concern as it easily resuspends, leading to human exposure through inhalation, ingestion, and skin contact [13]. Compared to other routes, oral ingestion is the most critical route of human exposure to dust [7,11]. However, a traditional content-based risk assessment may lead to an overestimation of the health risk of heavy metals in road dust. A more reliable estimation of heavy metal exposure relies on accurately quantifying the bioavailable portion of road dust that is absorbed into the systemic circulation [14]. Consequently, it is crucial to account for the bioaccessible metal concentrations rather than relying solely on total metal amounts in risk assessments. Due to the high cost and ethical issues of using animal models to measure bioavailability, in vitro assays that have good correlations with animal bioassays and have a series of advantages such as being cost-effective, easy to operate, and reproducible have been developed to measure bioaccessibility [3,15]. For example, the bioaccessibility of heavy metals extracted using the Solubility Bioavailability Research Consortium (SBRC) gastric phase method has been validated for estimating heavy metals’ relative bioavailability in contaminated soils and dusts [3,7,8,15]. However, information on the bioaccessible fractions of heavy metals in urban road dust is very limited compared to that of contaminated soil. Ma et al. indicated that the bioaccessibility of Ni was relatively higher in rural dust, whereas the bioaccessibility of Cr, Pb, and Zn exhibited significantly higher levels in urban dust [16]. Luo et al. reported that Cd and Pb from traffic sources exhibited higher bioaccessibility compared to those derived from coal combustion sources [17]. The large variation in the bioaccessibility of different heavy metals in dust environments may be due to their complex geochemical speciation and emission sources [18]. Assessing the bioaccessibility of heavy metals provides an accurate assessment of health risks and identifies priorities for control among different types of heavy metals. This is crucial for the development and control of urban governance and health control strategies.
Jinan is a typical inland city with traffic congestion in northern China, especially Jingshi Road, the longest main road in the country. Recently, using sustainable development theory in practice, a number of Chinese cities, including Jinan City, have entered a phase of new and old energy transformation. In this study, urban dust samples were collected along Jingshi Road in Jinan from different geographical location areas (west area, WA; central area, CA; and east area, EA) to analyze the source-specific and bioaccessibility-based health risks of heavy metals. The principal aims of this research were to (1) quantitatively discern the sources and evaluate their respective contributions to the heavy metal content in road dust utilizing the PMF model; (2) investigate the oral bioaccessibility of heavy metals in road dust via an SBRC assay; and (3) assess the health risks of heavy metals in road dust via ingestion exposure based on source apportionment and bioaccessibility. The outcomes can offer fundamental guidance for protecting the health of urban residents. This study takes the heavy metal pollution of road dust along the main road of Jingshi Road throughout Jinan as an example, and deepens the understanding of the environmental risks of urban road dust at the early stage of the transformation of old and new energies. This provides a reference base for future environmental management in more cities of the same type.

2. Materials and Methods

2.1. Study Area and Dust Sampling

In this study, dust samples were collected along Jingshi Road in Jinan City, Shandong Province, China. Jingshi Road is the longest main road in China, with a total length of 90 km from east to west. According to the geographical location and regional function, the sampling area along Jingshi Road was divided into three regions in this study, namely, the west area (WA), central area (CA), and east area (EA). The WA and EA are two areas with dense factory distribution. The difference is that the traffic flow in the EA is larger than that in the WA. The CA represents the commercial and living areas of Jinan, with a dense population and large traffic flow. A total of 31 road dust samples were collected from the study areas using a plastic dustpan and brush (Figure S1). To prevent cross-contamination, separate dustpans and brushes were employed for every sampling location. The collected samples, each weighing approximately 50 g, were sealed in labeled bags and securely transported to the laboratory for analysis. Following collection, all dust samples were air-dried at room temperature for 48 h, with leaves and other impurities being removed before sieving through a 250 μm nylon mesh. The <250 μm dust samples were used for the bioaccessibility assessment.
The dried road dust samples (<250 μm) were digested using the USEPA 3050B method and analyzed for their total content of heavy metals (As, Cd, Cr, Cu, Mn, Ni, Pb, V, and Zn) using inductively coupled plasma mass spectrometry (ICP–MS, iCAP RQ, Thermo Scientific, the United States of America). For ensuring data reliability, a certified soil standard GBW07405 (GSS-5, Institute of Geophysical and Geochemical Exploration, Chinese Academy of Geological Sciences, China) was incorporated into the analysis workflow as part of the quality assurance and quality control (QA/QC) measures. The recovery of the heavy metals in the GSS-5 was in the range of 92.7–103.2% (n = 3).

2.2. Sequential Extraction

The heavy metals in the dust samples were fractionated according to Tessier et al. [19]. The fractions were operationally defined as follows: exchangeable fraction (F1); carbonate fraction (F2); Fe/Mn oxide fraction (F3); organic fraction (F4); and residual fraction (F5). The specific steps are presented in the Supplementary Materials (SI 1.1). Extracts from each step were centrifuged at 4000 rpm for 10 min before being filtered through 0.45 μm filters. The filtered samples were analyzed using ICP–MS.

2.3. Source Identification

In source identification, Positive Matrix Factorization (PMF) has been proven to be an efficacious multivariate analytical technique [12]. In this study, PMF 5.0 was used to analyze the heavy metals in the dust samples. Two sets of data were prepared with sample heavy metal concentration values and sample heavy metal uncertainty information. Both data sets were acceptable when imported into the program. The uncertainty (Unc) was obtained by calculating the specified method detection limit (MDL). When the concentration was not greater than the MDL:
Unc = MDL × 5 / 6
If the concentration was greater than the MDL, Unc was calculated based on the concentration fraction and the MDL:
Unc = Error   fraction   × concentration + 0.5 × MDL
After preparing the two documents of element concentration and uncertainty, the model was imported for quality control inspection. In this model calculation, a signal-to-noise ratio of less than 2 was defined as ‘weak’. At the same time, the goodness of fit of parameter Q was evaluated to determine the optimal operation [11,12].

2.4. Bioaccessibility via SBRC Method

The bioaccessibility of heavy metals in road dust in digestive systems was evaluated using the in vitro SBRC extraction method. The SBRC method, which has been widely used to assess heavy metal bioaccessibility in soil and dust, was selected [3,7]. Briefly, a 0.2 g dust sample was added to 20 mL gastric phase extract containing 30.03 g L−1 glycine (Sigma-Aldrich, St. Louis, MI, USA). The mixtures were horizontally shaken at 37 ℃ and 150 rpm for 1 h. During the process, the solution’s pH (1.5) was continuously monitored and adjusted using concentrated HCl. After the gastric phase (GP), the dust suspension was centrifuged at 4000 rpm for 10 min, and the supernatant samples (2 mL) were filtered (0.45 μm) and stored at 4 °C before the analysis of heavy metals using ICP-MS.
After the gastric phase, the dust suspension was modified by adjusting the pH to 7.0 with NaOH and the addition of 1.75 g L−1 bile (Sigma-Aldrich) and 0.5 g L−1 pancreatin (Sigma-Aldrich) to simulate the intestinal phase (IP). The dust slurry was centrifuged and the supernatant samples were filtered (0.45 μm) after 4 h extraction, and stored at 4 °C before analysis using ICP-MS. The bioaccessibility of the heavy metals in the road dust was quantified by calculating the ratio of heavy metals extracted in the simulated gastric or intestinal fluid phases to the total heavy metal content in the sampled dust:
Bioaccessibility % = C bioaccessible × 100 % / C total
where Cbioaccessible is the metal concentration extracted using SBRC and Ctotal is the total metal concentration of the sample.
A soil standard reference material (SRM NIST2711a, National Institute of Standards and Technology) was included for QA/QC, which yielded a mean As and Pb bioaccessibility of 53 ± 2.1% and 83 ± 3.0%, respectively, consistent with the values of 56 ± 4.6% and 89 ± 5.4% reported by Dodd et al. [20].

2.5. Health Risk Assessment

To evaluate the potential health hazards posed by heavy metal exposure, the health risk assessment (HRA) method recommended by the US EPA (2011) was employed in this study [21]. The adopted HRA model categorizes health threats from metal contaminants into carcinogenic risk (CR) and non-carcinogenic risk (NCR). The overall non-carcinogenic risk is summarized by the Hazard Index (HI). Meanwhile, the total carcinogenic risk (TCR) consolidates individual risks from each carcinogen. Acknowledging physiological variations, this assessment segmented the population into three categories: children, adult men, and adult women.
After the determination of the bioaccessibility of the heavy metals in the road dust samples, the bioaccessibility data were incorporated into a health risk assessment, which provided a more accurate assessment of the potential health risks of heavy metal exposure to the human body caused by hand–mouth behavior [1]. The data for Chinese people used in the equation were based on Huang et al. [11]. In order to ensure the comparability of the results based on the total concentration and bioaccessible part, only those health risk evaluations based on ingestion were selected. The specific calculation method was as follows:
ADD ingest = C i × R ingest × EF × ED × 10 6 / BW × AT
HI = HQ = ADD i / RfD i
TCR = CR = ADD i × SF i
For NCR, the HI was the sum of the HQ of metal elements. When HI > 1, it indicates that there are potential adverse health effects. If CR > 10−4, it indicates that there is a significant risk of cancer. When CR < 10−6, the risk to human health is negligible [11]. The specific parameters are presented in Tables S2 and S3.

3. Results and Discussion

3.1. Pollution Characteristics of Heavy Metals

The mean concentrations of heavy metals varied among the WA, CA, and EA regions in the order of CA > EA > WA for most heavy metals (Table 1 and Figure S2). Specifically, the mean concentrations of Cd, Cu, Pb, and Zn exceeded the soil background values by 1.68–12.3, 1.68–2.68, 1.86–2.98, and 3.64–5.34 times in the CA, EA, and WA, respectively. The mean Ni and Mn concentrations in the CA and EA were 1.00 to 1.04 times higher than the soil background values, while the mean As, Cr, and V concentrations were lower than the local background soil in Jinan. Moreover, the As, Cr, and V concentrations yielded relatively low coefficient of variation (CV) values (7.24–54.6%), indicating that they primarily originated from local soil [22]. The CVs of the Cd, Cu, Pb, and Zn concentrations ranged from 30% to 176% in the CA, EA, and WA road dust samples, indicating high spatial variations [23]. Compared to a previous study involving more than 400 dust samples from 66 main roads in Jinan [24], no significant differences with this study were found for the content of most heavy metals, while higher mean Cd and Zn concentrations were observed in this study. It was reported that vehicle surface paint and tire wear was an important source of Cd and Zn [6,25], so their concentrations in the road dust from Jingshi Road were higher because of the huge volume of traffic with a maximum road width of up to twelve lanes in two directions. The Cd and Zn concentrations were the highest in the CA road dust samples, which also demonstrated that traffic flow plays an important role in Cd and Zn emissions.
The heavy metal concentration levels in Jinan were compared with those of other cities in China (Table 2). The concentrations of most metals in Jinan were lower than those in Beijing, Shanghai, and Guangzhou, three of the largest cities in China [11,26,27]. Moreover, compared with other capital cities in the north and south of China, the contents of most heavy metals (such as Cu, Ni, Pb, and Zn) in our study area were lower than those in Chengdu and higher than those in Hefei. Notably, the Cd concentration from the CA region was higher than those for all cities shown in Table 2. The CA region is relatively prosperous and complex, including living areas, schools, hospitals, and business districts, with many human activities. In recent years, urban transformation has become more frequent, resulting in noteworthy solid construction waste. The excessive Cd content in these two cities may be caused by waste materials produced during urban construction [5,28]. The content of Zn in the road dust in Jinan was similar to that in Chengdu, Nanjing, and Xi’an. These cities all have developed traffic systems, and the content of Zn is closely related to the flow of vehicles [5,9,22]. The contents of As, Mn, and V relating to local smelters, glass factories, and other industrial manufacturers in the EA region were high, and were similar to those of old industrial cities such as Xi’an [22]. Although the heavy metals had the same or similar sources, the source contributions were different due to the different levels and directions of urban development. Therefore, the source analysis of heavy metals is an important part of heavy metal control in urban dust.

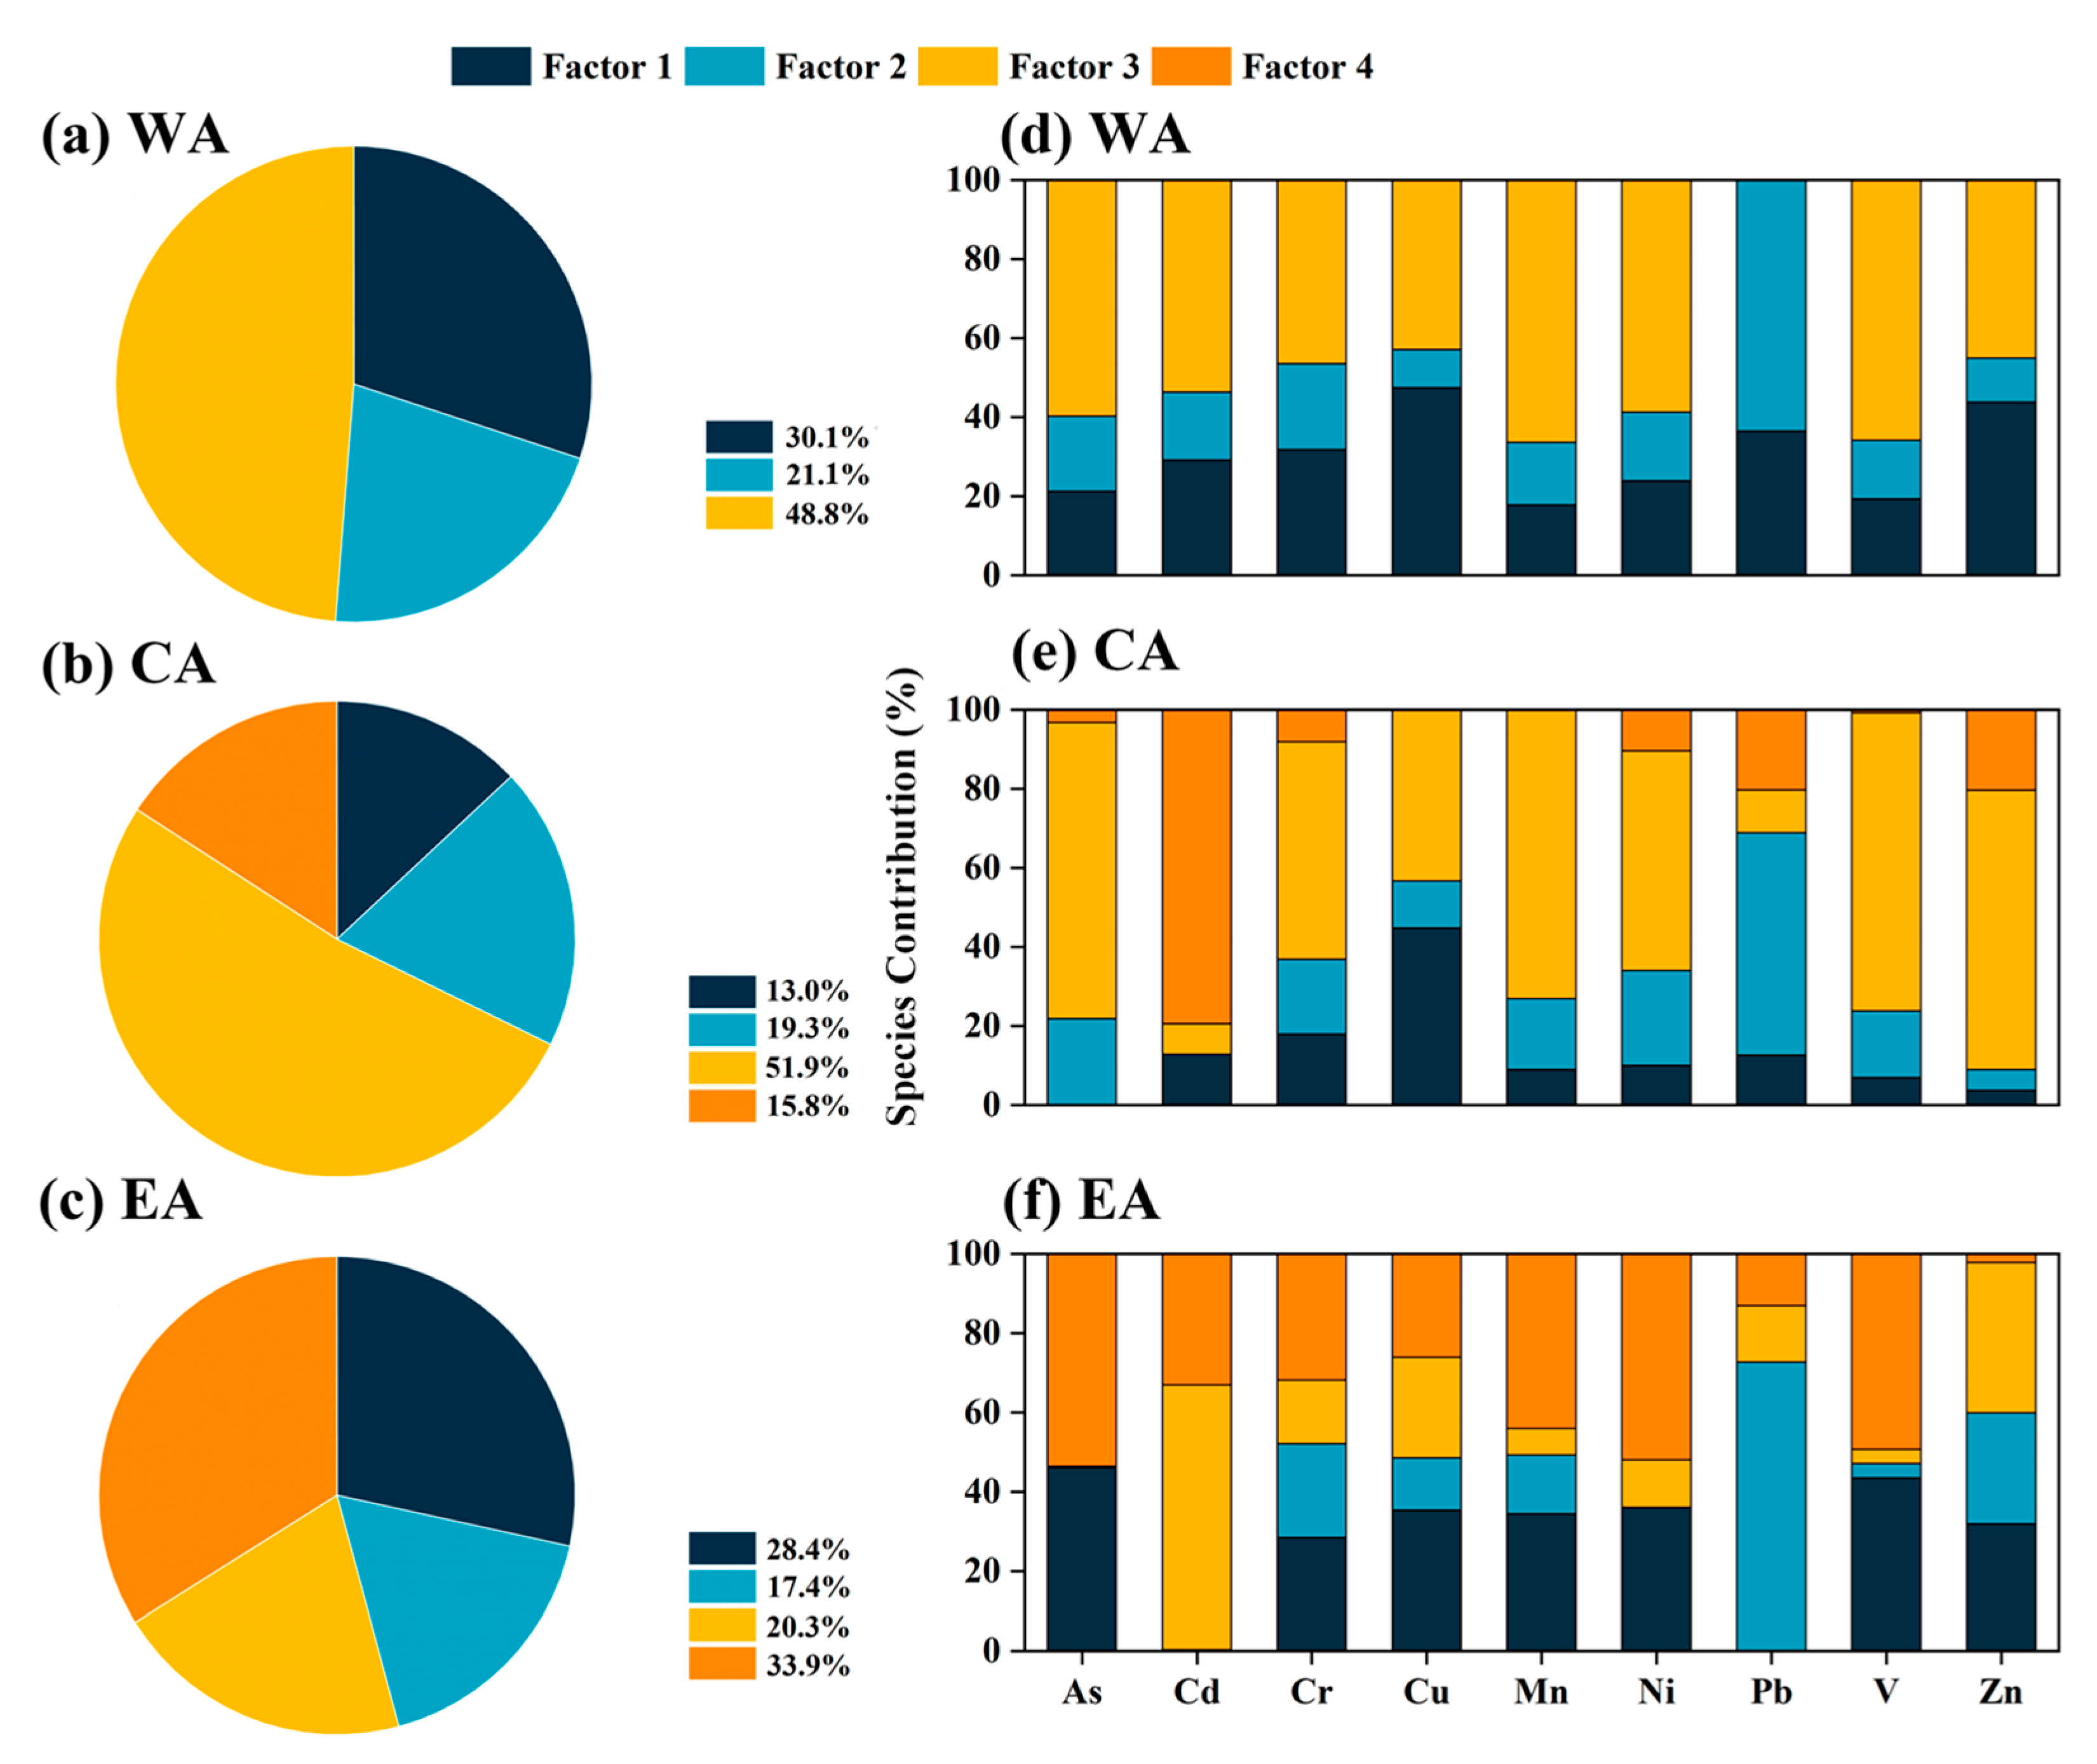
3.2. Quantitative Source Analysis Using PMF

According to the results of the analysis of heavy metal sources from the PMF model, there were four main factors influencing the accumulation of the nine metals (Figure 1 and Figure S3). Factor 1 was heavily characterized by Cu (35.6–47.5%), Pb (0.00–36.5%), Cr (17.8–31.8%), and Ni (9.97–36.0%). Copper is mainly released by industrial activities and metallurgical processes [32]. Lead is an important industrial material and is widely used in various industrial production and processing activities, such as liquid-crystal screen processing and electronic product manufacturing [33]. Cr, Ni, and Pb are also closely related to industrial activities [22,34]. More importantly, we found dense industrial parks in the WA and EA regions. Thus, factor 1 of the PMF model represented industrial sources. Factor 2 was characterized by V, Cr, Ni, Cu, As, and Mn, which are generally considered to be common elements in nature [11,35]. Previous researchers have reported that Mn is a prevalent lithospheric element, while Ni and Cr sources are typically associated with geological parent materials [32,36]. Thus, factor 2 was identified as representing natural sources.
The PMF results showed that factor 3 was characterized by Zn (37.9–70.7%), Pb (0.00–20.3%), and Cd (7.72–53.7%). The corrosion and wear of tire and body coatings was also an important source of Zn and Cd pollution [6,25]. Since the 1998 implementation of a leaded gasoline ban in Jinan, soil lead levels have remained elevated, a consequence of lead’s extended half-life and past contamination. This persistent lead content poses a recurrent threat via its potential to be resuspended in street dust [37]. Therefore, factor 3 was considered to represent a source of heavy metals from traffic. Factor 4 mainly included Cd (79.5%) in the CA. There are many sources of Cd, including fossil fuel combustion, garbage incineration, and the wear and tear of building materials in the city [5,38]. Factor 4 was mainly characterized by Cd, while Zn was also found in the EA. Varying degrees of corrosion were found on street lamps and metal shutter doors along the streets within the range of the CA. This shedding of the coating may be the cause of the Zn load in factor 4 (Figure S3d). It was speculated that it may be a source of anthropogenic solid waste in the city.
The results of the PMF source analysis showed that the main pollution sources in the WA were traffic sources (48.8%) and industrial sources (30.1%); the main pollution sources in the CA were traffic sources (51.9%); and the main pollution sources in the EA were solid waste (33.9%) and industrial sources (28.4%). The contribution rate of each type of pollution source in the different regions was different, which was related to the characteristics of the region. The CA includes living and educational areas and has a high population density. Therefore, traffic and solid waste were the main sources of pollution in this region [5,12]. As a mature industrial zone, the WA has many kinds of industries and a low population density. In addition to the large number of factories and enterprises in the EA, this region is still in the stage of development and construction, and its contribution of industrial sources was almost the same as that for the WA. The results of the source analysis showed that the focus of reducing heavy metal pollution in different regions varied with different pollution sources.

3.3. Bioaccessibility of Heavy Metals in Road Dust

An in vitro test using the SBRC method was conducted to assess the bioaccessibility of heavy metals in typical urban trunk road dust from Jinan City. As detailed in Figure 2, the mean bioaccessibility varied considerably with different metals and three regions along Jingshi Road. Based on the gastric phase (GP), the mean bioaccessibility of the metals followed the order of Cd (75.5%) > Zn (42.2%) > Mn (42.1%) > Pb (42.0%) > Cu (32.9%) > As (23.6%) > Ni (20.1%) > V (16.8%) > Cr (13.3%). In comparison to the gastric phase, the intestinal phase of the SBRC assay revealed the significantly reduced bioaccessibility of heavy metals for the majority of the samples. As shown in Figure 2a, Cr had the lowest bioaccessibility (1.25–22.8%), while Cd showed the highest (5.02–124%). This finding was consistent with previous studies that reported that Cd had higher bioaccessibility through the oral ingestion of contaminated soil [39]. The results indicated that there were substantial variations in the bioaccessibility of heavy metals among the samples tested.
Geochemical fractions of heavy metals play an important role in controlling their migration, bioavailability, and toxicity [40]. As shown in Figure S4a–c, Cd was primarily distributed in the exchangeable fraction and carbonate fraction (F1 + F2; 3.92–74.3%, averaging 46.7%), which explained the high Cd bioaccessibility in the dust samples. The Cr fraction distribution in the samples was different from that of Cd, in which residual bound Cr (F5: 48.5–91.8%, averaging 71.1%) was the main fraction and the exchange fraction (F1: 0.02–1.38%, averaging 0.21%) was the lowest. To further investigate the relationship between fractions and bioaccessibility, correlation tests were performed to investigate the contribution of different heavy metal fractions to their bioaccessibility (Figure S5). The bioaccessibility (GP) of As, Cd, and Mn showed significant correlations (r = 0.40–0.57) with F1 + F2 (F12), suggesting that the As, Cd, and Mn extracted using SBRC possibly originated from these fractions. F1 and F2 are always regarded as labile fractions, implying that the heavy metals in these fractions are easily absorbed by the human body and pose health risks.
The bioaccessibility of metals also varied between the different regions along Jingshi Road in the order of WA > CA > EA for most heavy metals. Compared with the CA and EA regions, though most heavy metal concentrations in the WA road dust was the lowest, the bioaccessibility in the gastric phase was the highest, which was caused by their different sources. Industrial sources (factor 1) and traffic sources (factor 3) were the most dominant sources of all heavy metals except Pb (natural source, factor 2), up to 78.9% in the WA road dust. For example, the main source of Cd in the WA region was traffic (53.7%), and industrial sources (29.1%) showed the highest bioaccessibility (85.0%). However, the Cd of the EA and CA regions mainly originated from solid waste and traffic sources, respectively, and the Cd bioaccessibility was lower than that from the WA region. The results demonstrated that heavy metals from industrial emissions posed a higher threat to health in Jinan’s road dust than traffic sources and solid waste due to the higher mobility and toxicity. Similar results also reported that industrial emissions constitute the chief source of human health risks owing to the heightened hazardous nature of metals originating from such emissions [24,31]. It was also reported that heavy metal elements (especially Zn) emitted by traffic sources also have high bioaccessibility [41]. Therefore, the pollution sources of heavy metals in road dust are an important factor affecting bioaccessibility.

3.4. Health Risk Assessment of Heavy Metals in Road Dust

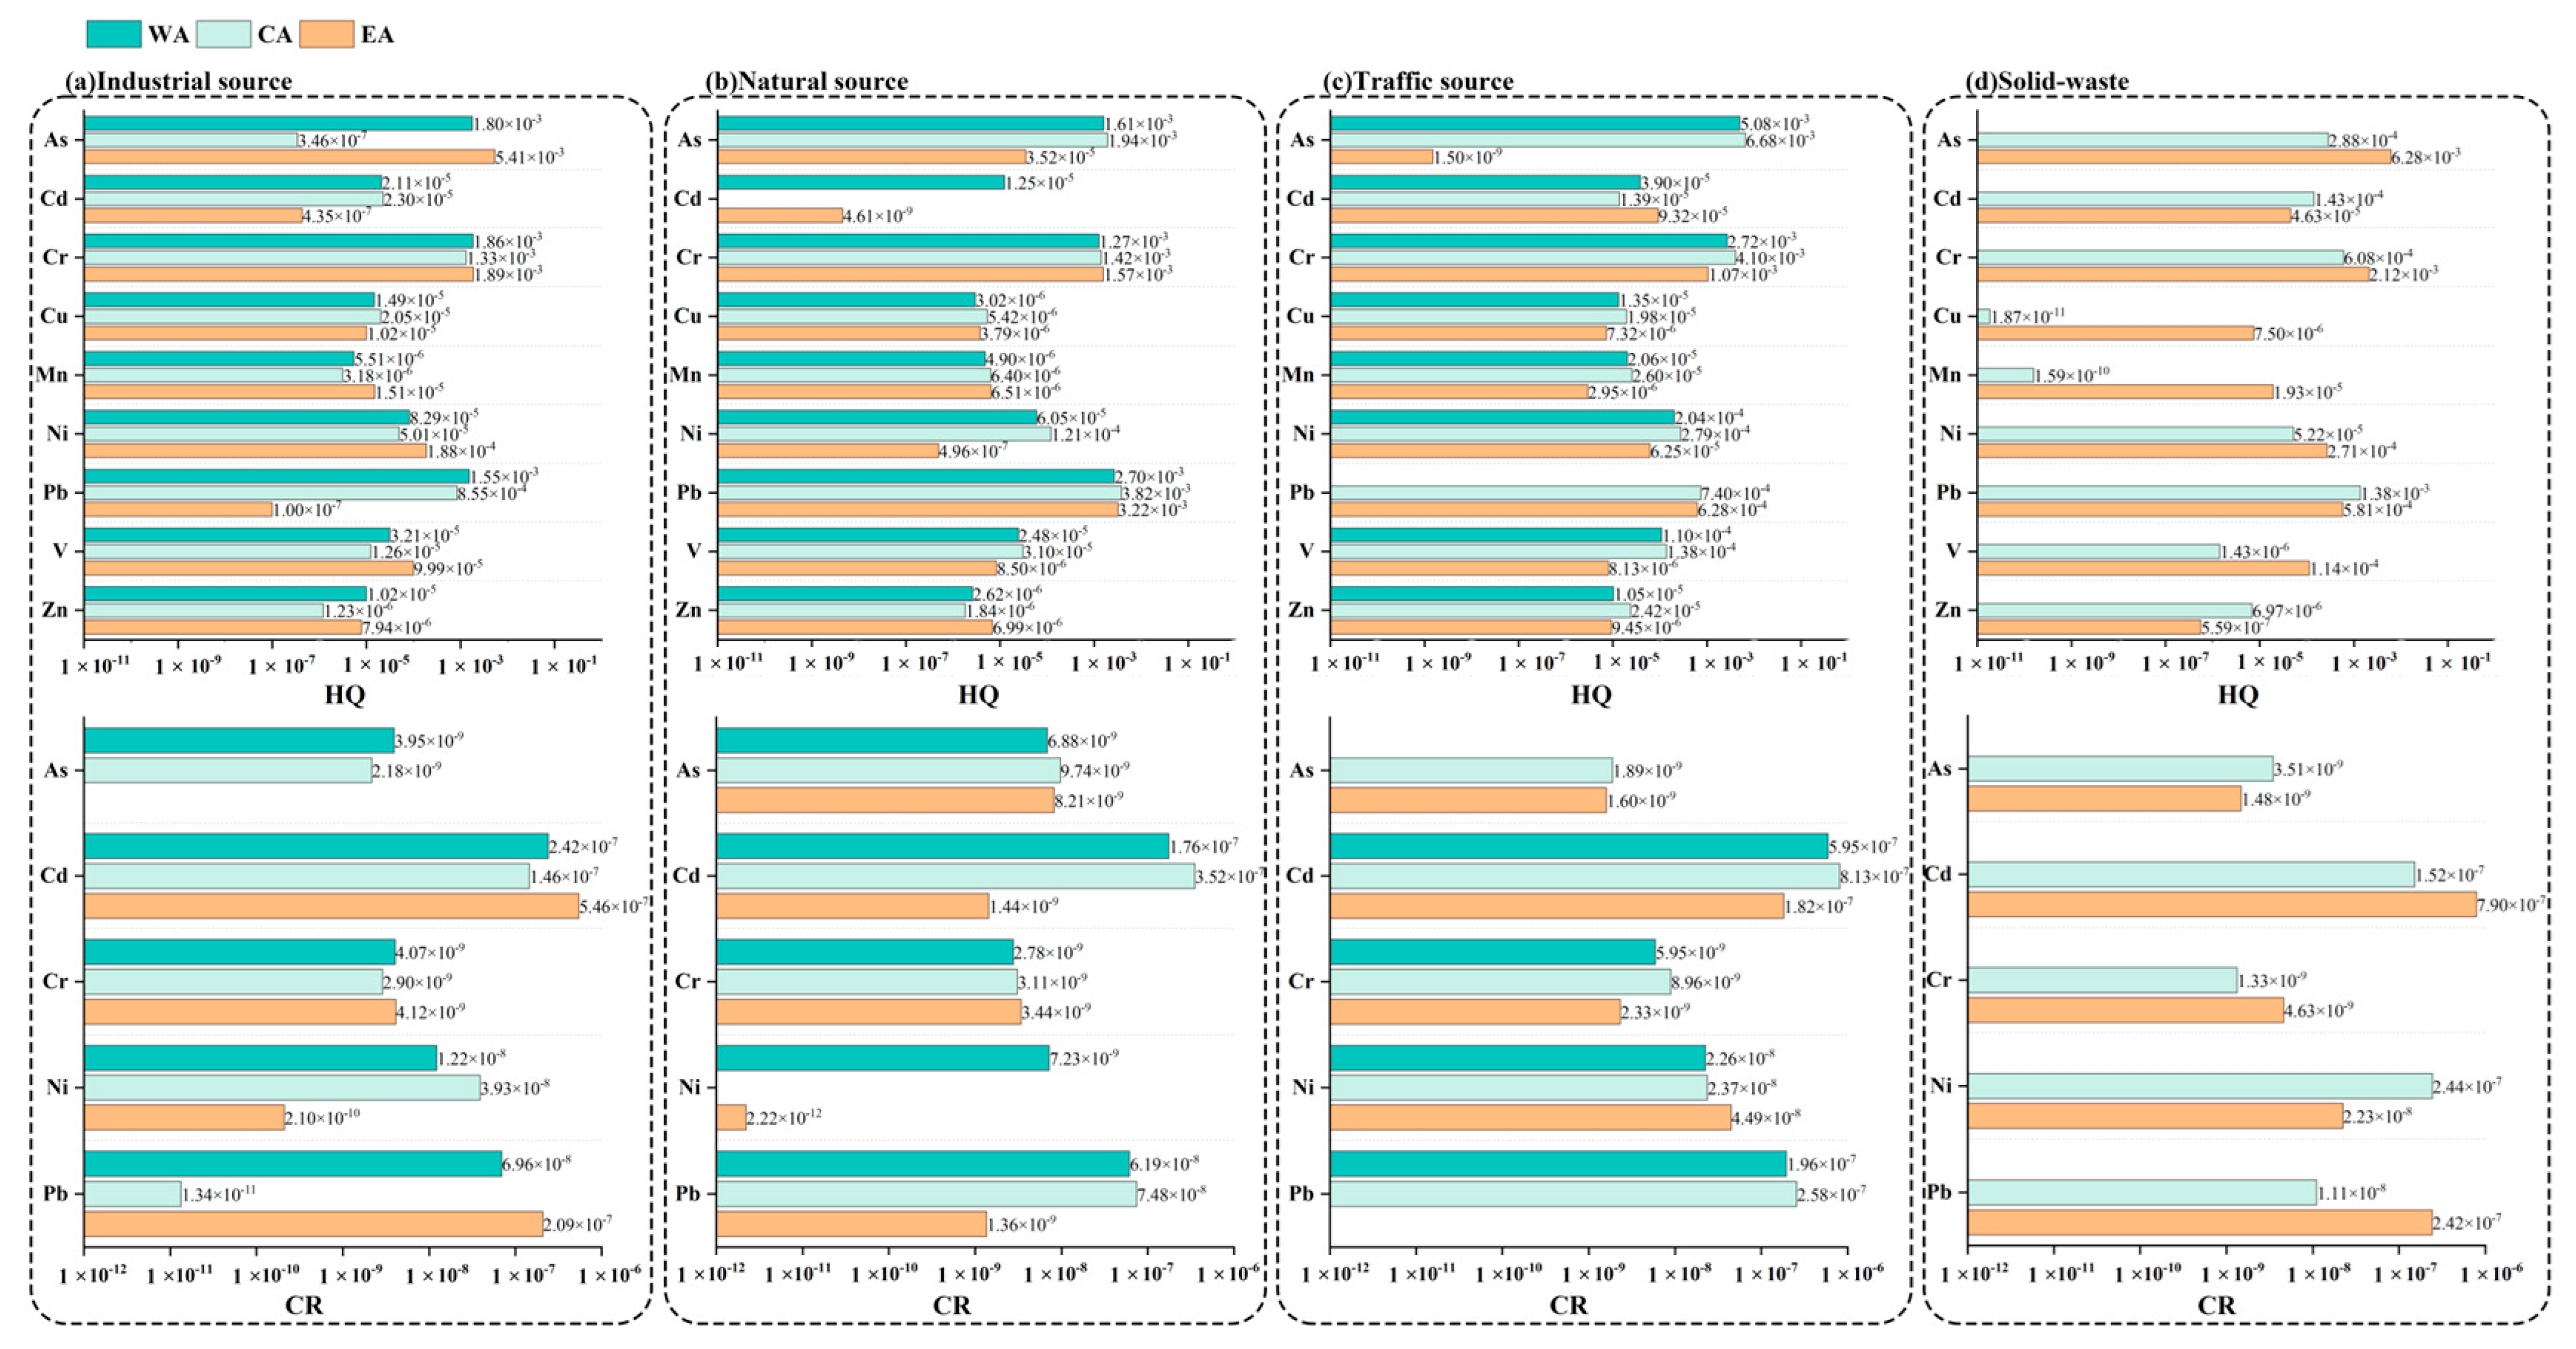
3.4.1. Source-Specific Health Risks

In this study, all health risks from the oral ingestion of heavy metals found in road dust from three geographical locations were calculated for children and adults. As shown in Figure 3, the mean HIs for children, adult males, and adult females were all below 1, showing a low non-carcinogenic risk to humans. Notably, all health risks to children were higher than for adult males and females because children are more sensitive, which is consistent with previous reports [25,31]. The HI value was lower in the WA (1.93 × 10⁻²) and higher in the CA (2.41 × 10⁻²); the same phenomenon showed that the CA (3.16 × 10⁻³ and 6.50 × 10⁻³) was higher than the WA (2.53 × 10⁻³ and 5.73 × 10⁻³) for adult males and females, respectively (Figure 3). Given that children are the most sensitive population type and that their hand-to-mouth behavior represents the most significant route of dust ingestion, the following analyses in this study focus on the evaluation of health risks in children. For non-carcinogenic risk, the HQ for children follows the order As > Cr > Pb > Ni > V > Cd > Cu > Mn > Zn. The HQ and HI were all below 1 at all sites, and there was no non-carcinogenic risk in any of the three regions. Different from the HQs, the CRs of children and adults (males and females) were generally above 1.0 × 10⁻⁶, suggesting high potential carcinogenic risks to residents from the study area [11]. Especially for children, 87.5%, 100%, and 100% of the points in the WA, CA, and EA exceeded the carcinogenic risk line, respectively. In order to ascertain the contribution of heavy metal elements to the risk to children’s health in the three regions, a calculation was performed. The CR for children followed the order Ni > As > Cd > Cr > Pb. Further analysis showed that in the WA, CA, and EA regions, Ni was the main carcinogenic element (the contribution rates reached 72.0%, 68.1%, and 73.6%, respectively), followed by As (23.3%, 16.0%, and 21.9%, respectively) and Cd (2.99%, 14.3%, and 3.26%, respectively), consistent with the typical urban environment [26,42].
To accurately identify the high-risk sources, we conducted source-specific health risk assessments. Figure 4 details the HQ and CR of heavy metals emitted from various sources and calculations of the contribution of HI and TCR from each source in the different regions. In the analyses of the three main NCR-contributing heavy metals As, Cr, and Pb, it was found that their distributional characteristics varied according to the source of pollution and the region. Specifically, in the WA, traffic sources were the primary contributors to the NCR of As and Cr (with an HQ of 5.08 × 10⁻³ and 2.72 × 10⁻³, respectively), while natural sources were the most significant contributors to the NCR of Pb (2.70 × 10⁻³). In the CA, the results were comparable to those observed in the WA, with traffic sources continuing to be the primary contributors to the NCR of As and Cr (with an HQ of 6.68 × 10⁻³ and 4.10 × 10⁻³), and natural sources remaining the dominant source of Pb as a non-carcinogenic risk (3.82 × 10⁻³). In contrast, the NCR for As and Cr was mainly attributed to solid waste (with an HQ of 6.28 × 10⁻³ and 2.12 × 10⁻³, respectively) in the EA, while natural sources were, again, the source of the greatest NCR for Pb (3.22 × 10⁻³).
In addition, Ni, As, and Cd were identified as key observations for CR. The CR of As was primarily attributed to traffic sources in the WA and CA (5.95 × 10⁻⁷ and 8.13 × 10⁻⁷, respectively), while solid waste was the primary contributor to the CR of Ni in the EA (7.90 × 10⁻⁷). The CR of As was similar to Ni, with traffic sources dominating in the WA and CA (1.96 × 10⁻⁷ and 2.58 × 10⁻⁷), while in the EA it shifted to solid waste as the dominant source (2.42 × 10⁻⁷). The sources of CR of Cd were generally dominated by traffic sources in the WA and EA (2.26 × 10⁻⁸ and 4.49 × 10⁻⁸) and solid waste in the CA (2.44 × 10⁻⁷).
The contribution rates of the pollution sources varied significantly by sample area. The results showed that traffic in the WA and CA was the main source of risk (the contribution rate was 51.3–61.8%). Previous research has also reported that traffic emissions lead to higher non-carcinogenic risks for children [16]. The main risk source in the EA was human-made solid waste (41.9–51.3%). The above results remind us that for the WA and CA, traffic sources are the priority pollution sources to be controlled, while the EA needs to focus on the treatment of solid waste. Notably, the role of diverse pollution sources in terms of health risks differs as urbanization progresses. For example, with a decrease in the scale of construction and the development of industry in the future, the main source of pollution in the EA may change from solid waste to industrial pollution.

3.4.2. Bioaccessibility-Based Health Risk

To accurately assess the health risks associated with the ingestion of heavy metals from road dust, oral bioaccessibility was incorporated into the health risk assessment. In this study, the dissolution concentration of the gastric phase based on the SBRC assay represented the maximum conservative dissolution amount [15], which was incorporated into the health risk assessment formula. The carcinogenic and non-carcinogenic health risks of each metal element are shown in Figure 5. The HI and HQ values of nine heavy metals found in the road dust from the three regions were generally lower than the safe level of <1, indicating that the non-carcinogenic risks caused by these metals were acceptable for both adults and children. Similarly, the CR and TCR values were all below the acceptable threshold (1 × 10⁻⁶), except for one point in the CA, after the gastric bioaccessible metals were used for carcinogenic risks. The bioaccessibility-based HI and TCR values for children within the WA, CA, and EA were found to be significantly lower than those assessed based on total concentration (HI: from 1.93 × 10⁻², 2.41 × 10⁻², and 2.38 × 10⁻² to 1.17 × 10⁻³, 1.44 × 10⁻³, and 1.22 × 10⁻³, respectively; TCR: from 1.40 × 10⁻⁶, 1.93 × 10⁻⁶, and 2.07 × 10⁻⁶ to 3.84 × 10⁻⁷, 4.97 × 10⁻⁷, and 3.70 × 10⁻⁷). However, children faced greater health risks than adults, attributed to their higher sensitivity to toxic metals and frequent hand-to-mouth activities [43].
Following the bioaccessibility adjustment, in addition to a significant reduction in health risks, the contribution rate of metal elements to risks also changed. Initially, based on the total metal content, As (43.4%), Cr (29.7%), and Pb (22.9%) were identified as the main contributors to health risk in the HI. However, when bioaccessible heavy metals were considered, the composition of the key metals was altered: V (29.7%), As (16.2%), and Mn (13.1%) were dominant in the WA; V (25.6%), Zn (14.2%), and Pb (13.5%) were dominant in the CA; and V (33.8%), Mn (15.6%), and As (15.2%) were dominant in the EA. This region-specific element risk change highlighted the central role of metal bioaccessibility in the assessment of risk. Overall, though the HI values were below the safe threshold after gastric bioaccessible metal adjustment, V became the leading contributor across the three study regions. When the bioaccessible metals were used for the carcinogenic risk assessment, the TCR exceedance rate reduced from 96.8% to 3.2%, showing that only one point exceeded the safety value (TCR > 1 × 10⁻⁶) in the CA.
Notably, Ni was still as the main contributor to carcinogenic risk, with a contribution rate of ~60% for children’s carcinogenic risk in the three areas after incorporating the bioaccessibility adjustment. However, Cd and As were still important contributors to TCR in all study areas, reaching ~30%. Therefore, V, Ni, Cd, and As in the study area constitute a potential health threat that cannot be ignored, especially for children.
To control health risks more accurately, pollution sources and bioaccessibility need to be combined. The results in this study showed that V became the new largest contributor to non-carcinogenic risk following bioaccessible fraction adjustment, and predominantly derived from traffic sources (65.9% for the WA and 75.5% for the CA) and solid waste/industrial activities (43.4% and 49.4% for the EA, respectively) according to the PMF model analysis. In addition, Mn, As, and Zn were the main contributors to HI in the WA and CA, and their pollution originated from traffic sources (59.5–70.7%) (Figure 1). Interestingly, previous studies have shown that Pb, as one of the main contributors to risk, mainly originates from traffic sources [16]; however, in this study, the Pb was mainly derived from natural sources. In summary, controlling traffic emissions is an effective management measure to reduce non-carcinogenic risks. In this study, Ni, as the main contributor to carcinogenic risk after bioaccessibility adjustment, contributed to more than 50% of the risk in all three regions. The primary source of Ni in the WA and CA was traffic, accounting for 58.7% and 55.6% of the total carcinogenic risks, respectively. However, solid waste and industrial activities were the dominant contributors in the EA, with contributions of 52.0% and 36.0%, respectively. Notably, when the contributions of industrial and traffic sources were combined, the contribution of Ni in the EA was 48.0%, which was consistent with the trend observed in the WA and CA. Because of urbanization, almost every city in China has a construction area similar to the EA. Hence, to reduce the health risks to urban residents exposed to dust, it is crucial for managers to strengthen the management of emissions from traffic and industrial sources.

4. Conclusions

This study integrated source analysis and health risk assessment and tested the applicability of this combined technique using road dust from Jingshi Road in Jinan City. The results indicated that traffic was the main source of pollution affecting the health risk in the WA and CA, while solid waste was the primary risk factor of concern in the EA. While traditional risk assessment based on total heavy metals may overestimate the actual risk, the inclusion of bioaccessibility parameters resulted in a more precise assessment, reflecting the different bioaccessibility properties of heavy metals in road dust among the regions (WA > CA > EA). The inclusion of bioaccessibility significantly changed the risk priority of the heavy metals in the road dust, revealing that the key heavy metals varied within the different regions after accounting for heavy metal dissolution characteristics during digestion. In particular, the change from a total concentration assessment to a bioaccessibility assessment resulted in V becoming the first metal to be considered for non-carcinogenic risk, whereas Ni assumed a central role in the carcinogenic risk assessment. This transition highlighted the importance of targeted control measures for traffic emission sources in the WA and CA, and industrial emission sources in the EA, to protect the health of sensitive populations, especially children.
This study examined the pivotal role of source analysis in the control of urban dust heavy metal pollution. It also highlighted the significance of a health risk assessment system integrated with bioaccessibility analysis in order to enhance the precision of risk prediction. Under the economic model of new and old kinetic energy conversion, this study conducted a precise health risk assessment of heavy metals in urban road dust, which can reflect the impact of this conversion model on urban environmental quality, so as to better guide the sustainable development of the economy and the environment. In the future, it is necessary to carry out continuous and more detailed research on the health risks of road dust during changes to economic models, such as different particle sizes, different functional areas, and different exposure pathways.

Supplementary Materials

The following supporting information can be downloaded at: https://www.mdpi.com/article/10.3390/su16156550/s1, Table S1: Dust exposure risk health risk assessment model calculated parameters and values; Table S2: Corresponding reference dose (RfD) and slope factor (SF) values for metals under ingestion exposure pathways in a health risk assessment model; Figure S1: Sampling location of study area; Figure S2: Metal element concentration (mg kg−1) of dust samples from Jingshi Road of Jinan. WA, CA, and WA represented west, central, and east area along Jingshi Road, respectively; Figure S3: Factor distribution of metal in road dust based on PMF model. (a–e) represents the factor profiles of metal elements in road dust in Jinan in WA, CA and EA from PMF model; Figure S4: Distribution of nine heavy metals in Jinan road dust in different fractions, (a), (b) and (c) is the speciation distribution of heavy metals in dust in WA, CA and EA, respectively. The fractions were operationally defined as follows: exchangeable fraction (F1); carbonate fraction (F2); Fe/Mn oxide fraction (F3); organic fraction (F4); and residual fraction (F5); Figure S5: The correlation between the bioaccessibility, the total concentration and fraction of heavy metals in the road dust of Jinan. * represents p < 0.05.

Author Contributions

Conceptualization, L.H. and J.L.; Methodology, S.C., Y.W., C.L. and Y.L.; Software, S.C.; Validation, Y.W.; Investigation, L.H., X.L. and Y.L.; Resources, L.H., Y.W., X.L. and J.L.; Data curation, S.C. and C.L.; Writing—original draft, S.C.; Writing—review & editing, L.H., H.L. and J.L.; Supervision, J.L.; Project administration, Y.W. All authors have read and agreed to the published version of the manuscript.

Funding

This work was supported in part by the National Natural Science Foundation of China (41807485), the Shandong Provincial Natural Science Foundation (ZR2019BD002), and the China Postdoctoral Science Foundation (2018T110705, 2017M622264).

Institutional Review Board Statement

Not applicable.

Informed Consent Statement

Not applicable.

Data Availability Statement

The original contributions presented in the study are included in the article/supplementary material, further inquiries can be directed to the corresponding author.

Conflicts of Interest

The author declares no conflicts of interest.

References

  1. Zheng, N.; Hou, S.; Wang, S.; Sun, S.; An, Q.; Li, P.; Li, X. Health risk assessment of heavy metals in street dust around a zinc smelting plant in China based on bioavailability and bioaccessibility. Ecotox. Environ. Safe 2020, 197, 110617. [Google Scholar] [CrossRef]
  2. Li, H.; Qian, X.; Hu, W.; Wang, Y.; Gao, H. Chemical speciation and human health risk of trace metals in urban street dusts from a metropolitan city, Nanjing, SE China. Sci. Total Environ. 2013, 456–457, 212–221. [Google Scholar] [CrossRef] [PubMed]
  3. Li, H.-B.; Zhao, D.; Li, J.; Li, S.-W.; Wang, N.; Juhasz, A.L.; Zhu, Y.-G.; Ma, L.Q. Using the SBRC Assay to Predict Lead Relative Bioavailability in Urban Soils: Contaminant Source and Correlation Model. Environ. Sci. Technol. 2016, 50, 4989–4996. [Google Scholar] [CrossRef] [PubMed]
  4. Zhao, L.; Yu, R.; Yan, Y.; Cheng, Y.; Hu, G.; Huang, H. Bioaccessibility and provenance of heavy metals in the park dust in a coastal city of southeast China. Appl. Geochem. 2020, 123, 104798. [Google Scholar] [CrossRef]
  5. Li, H.-H.; Chen, L.-J.; Yu, L.; Guo, Z.-B.; Shan, C.-Q.; Lin, J.-Q.; Gu, Y.-G.; Yang, Z.-B.; Yang, Y.-X.; Shao, J.-R.; et al. Pollution characteristics and risk assessment of human exposure to oral bioaccessibility of heavy metals via urban street dusts from different functional areas in Chengdu, China. Sci. Total Environ. 2017, 586, 1076–1084. [Google Scholar] [CrossRef] [PubMed]
  6. Dong, S.; Ochoa Gonzalez, R.; Harrison, R.M.; Green, D.; North, R.; Fowler, G.; Weiss, D. Isotopic signatures suggest important contributions from recycled gasoline, road dust and non-exhaust traffic sources for copper, zinc and lead in PM10 in London, United Kingdom. Atmos. Environ. 2017, 165, 88–98. [Google Scholar] [CrossRef]
  7. Li, H.-B.; Li, J.; Juhasz, A.L.; Ma, L.Q. Correlation of in Vivo Relative Bioavailability to in Vitro Bioaccessibility for Arsenic in Household Dust from China and Its Implication for Human Exposure Assessment. Environ. Sci. Technol. 2014, 48, 13652–13659. [Google Scholar] [CrossRef] [PubMed]
  8. Li, H.-B.; Cui, X.-Y.; Li, K.; Li, J.; Juhasz, A.L.; Ma, L.Q. Assessment of in Vitro Lead Bioaccessibility in House Dust and Its Relationship to in Vivo Lead Relative Bioavailability. Environ. Sci. Technol. 2014, 48, 8548–8555. [Google Scholar] [CrossRef]
  9. Wang, X.; Liu, E.; Lin, Q.; Liu, L.; Yuan, H.; Li, Z. Occurrence, sources and health risks of toxic metal(loid)s in road dust from a mega city (Nanjing) in China. Environ. Pollut. 2020, 263, 114518. [Google Scholar] [CrossRef]
  10. Jin, Y.; O’Connor, D.; Ok, Y.S.; Tsang, D.C.W.; Liu, A.; Hou, D. Assessment of sources of heavy metals in soil and dust at children’s playgrounds in Beijing using GIS and multivariate statistical analysis. Environ. Int. 2019, 124, 320–328. [Google Scholar] [CrossRef]
  11. Huang, J.; Wu, Y.; Sun, J.; Li, X.; Geng, X.; Zhao, M.; Sun, T.; Fan, Z. Health risk assessment of heavy metal(loid)s in park soils of the largest megacity in China by using Monte Carlo simulation coupled with Positive matrix factorization model. J. Hazard. Mater. 2021, 415, 125629. [Google Scholar] [CrossRef] [PubMed]
  12. Tian, S.; Liang, T.; Li, K.; Wang, L. Source and path identification of metals pollution in a mining area by PMF and rare earth element patterns in road dust. Sci. Total Environ. 2018, 633, 958–966. [Google Scholar] [CrossRef]
  13. Huang, F.; Liu, B.; Yu, Y.; Lv, L.; Luo, X.; Yin, F. Heavy metals in road dust across China: Occurrence, sources and health risk assessment. Bull. Environ. Contam. Toxicol. 2022, 109, 323–331. [Google Scholar] [CrossRef] [PubMed]
  14. Soltani, N.; Keshavarzi, B.; Moore, F.; Cave, M.; Sorooshian, A.; Mahmoudi, M.R.; Ahmadi, M.R.; Golshani, R. In vitro bioaccessibility, phase partitioning, and health risk of potentially toxic elements in dust of an iron mining and industrial complex. Ecotox. Environ. Safe 2021, 212, 111972. [Google Scholar] [CrossRef] [PubMed]
  15. Juhasz, A.L.; Weber, J.; Smith, E.; Naidu, R.; Rees, M.; Rofe, A.; Kuchel, T.; Sansom, L. Assessment of Four Commonly Employed in Vitro Arsenic Bioaccessibility Assays for Predicting in Vivo Relative Arsenic Bioavailability in Contaminated Soils. Environ. Sci. Technol. 2009, 43, 9487–9494. [Google Scholar] [CrossRef]
  16. Ma, J.; Li, Y.; Liu, Y.; Wang, X.; Lin, C.; Cheng, H. Metal(loid) bioaccessibility and children’s health risk assessment of soil and indoor dust from rural and urban school and residential areas. Environ. Geochem. Health 2020, 42, 1291–1303. [Google Scholar] [CrossRef]
  17. Luo, X.-S.; Ding, J.; Xu, B.; Wang, Y.-J.; Li, H.-B.; Yu, S. Incorporating bioaccessibility into human health risk assessments of heavy metals in urban park soils. Sci. Total Environ. 2012, 424, 88–96. [Google Scholar] [CrossRef]
  18. Sun, L.; Ng, J.C.; Tang, W.; Zhang, H.; Zhao, Y.; Shu, L. Assessment of human health risk due to lead in urban park soils using in vitro methods. Chemosphere 2021, 269, 128714. [Google Scholar] [CrossRef] [PubMed]
  19. Tessier, A.; Campbell, P.G.C.; Bisson, M. Sequential extraction procedure for the speciation of particulate trace metals. Anal. Chem. 1979, 51, 844–851. [Google Scholar] [CrossRef]
  20. Dodd, M.; Lee, D.; Nelson, J.; Verenitch, S.; Wilson, R. In vitro bioaccessibility round robin testing for arsenic and lead in standard reference materials and soil samples. Integr. Environ. Assess. Manag. 2024, 1–10. [Google Scholar] [CrossRef]
  21. US Environmental Protection Agency. Exposure Factors Handbook, 2011 ed.; Final Report; US Environmental Protection Agency: Washington, DC, USA, 2011; EPA/600/R-09/052F.
  22. Pan, H.; Lu, X.; Lei, K. A comprehensive analysis of heavy metals in urban road dust of Xi’an, China: Contamination, source apportionment and spatial distribution. Sci. Total Environ. 2017, 609, 1361–1369. [Google Scholar] [CrossRef] [PubMed]
  23. Li, Y.; Wang, Y.; Li, Y.; Li, T.; Mao, H.; Talbot, R.; Nie, X.; Wu, C.; Zhao, Y.; Hou, C.; et al. Characteristics and potential sources of atmospheric particulate mercury in Jinan, China. Sci. Total Environ. 2017, 574, 1424–1431. [Google Scholar] [CrossRef] [PubMed]
  24. Wang, X.; Liu, E.; Yan, M.; Zheng, S.; Fan, Y.; Sun, Y.; Li, Z.; Xu, J. Contamination and source apportionment of metals in urban road dust (Jinan, China) integrating the enrichment factor, receptor models (FA-NNC and PMF), local Moran’s index, Pb isotopes and source-oriented health risk. Sci. Total Environ. 2023, 878, 163211. [Google Scholar] [CrossRef] [PubMed]
  25. Hou, S.; Zheng, N.; Tang, L.; Ji, X.; Li, Y.; Hua, X. Pollution characteristics, sources, and health risk assessment of human exposure to Cu, Zn, Cd and Pb pollution in urban street dust across China between 2009 and 2018. Environ. Int. 2019, 128, 430–437. [Google Scholar] [CrossRef] [PubMed]
  26. Tang, F.; Li, Z.; Zhao, Y.; Sun, J.; Sun, J.; Liu, Z.; Xiao, T.; Cui, J. Geochemical Contamination, Speciation, and Bioaccessibility of Trace Metals in Road Dust of a Megacity (Guangzhou) in Southern China: Implications for Human Health. Int. J. Environ. Res. Public Health 2022, 19, 15942. [Google Scholar] [CrossRef] [PubMed]
  27. Wei, B.; Yang, L. A review of heavy metal contaminations in urban soils, urban road dusts and agricultural soils from China. Microchem. J. 2010, 94, 99–107. [Google Scholar] [CrossRef]
  28. Huang, M.; Wang, W.; Chan, C.Y.; Cheung, K.C.; Man, Y.B.; Wang, X.; Wong, M.H. Contamination and risk assessment (based on bioaccessibility via ingestion and inhalation) of metal(loid)s in outdoor and indoor particles from urban centers of Guangzhou, China. Sci. Total Environ. 2014, 479–480, 117–124. [Google Scholar] [CrossRef] [PubMed]
  29. Wei, X.; Gao, B.; Wang, P.; Zhou, H.; Lu, J. Pollution characteristics and health risk assessment of heavy metals in street dusts from different functional areas in Beijing, China. Ecotox. Environ. Safe 2015, 112, 186–192. [Google Scholar] [CrossRef] [PubMed]
  30. Ali, M.U.; Liu, G.; Yousaf, B.; Abbas, Q.; Ullah, H.; Munir, M.A.M.; Fu, B. Pollution characteristics and human health risks of potentially (eco)toxic elements (PTEs) in road dust from metropolitan area of Hefei, China. Chemosphere 2017, 181, 111–121. [Google Scholar] [CrossRef]
  31. Yang, Y.; Lu, X.; Yu, B.; Zuo, L.; Wang, L.; Lei, K.; Fan, P.; Liang, T.; Rennert, T.; Rinklebe, J. Source-specific risk judgement and environmental impact of potentially toxic elements in fine road dust from an integrated industrial city, North China. J. Hazard. Mater. 2023, 458, 131982. [Google Scholar] [CrossRef]
  32. Heidari, M.; Darijani, T.; Alipour, V. Heavy metal pollution of road dust in a city and its highly polluted suburb; quantitative source apportionment and source-specific ecological and health risk assessment. Chemosphere 2021, 273, 129656. [Google Scholar] [CrossRef] [PubMed]
  33. D’Adamo, I.; Ferella, F.; Rosa, P. Wasted liquid crystal displays as a source of value for e-waste treatment centers: A techno-economic analysis. Curr. Opin. Green Sustain. Chem. 2019, 19, 37–44. [Google Scholar] [CrossRef]
  34. Li, F.; Zhang, J.; Huang, J.; Huang, D.; Yang, J.; Song, Y.; Zeng, G. Heavy metals in road dust from Xiandao District, Changsha City, China: Characteristics, health risk assessment, and integrated source identification. Environ. Sci. Pollut. Res. 2016, 23, 13100–13113. [Google Scholar] [CrossRef] [PubMed]
  35. Aguilera, A.; Bautista, F.; Gutiérrez-Ruiz, M.; Ceniceros-Gómez, A.E.; Cejudo, R.; Goguitchaichvili, A. Heavy metal pollution of street dust in the largest city of Mexico, sources and health risk assessment. Environ. Monit. Assess. 2021, 193, 193. [Google Scholar] [CrossRef] [PubMed]
  36. Chen, X.; Lu, X. Contamination characteristics and source apportionment of potentially toxic elements in the topsoil of Huyi District, Xi’an City, China. Environ. Earth Sci. 2021, 80, 595. [Google Scholar] [CrossRef]
  37. Ayrault, S.; Catinon, M.; Boudouma, O.; Bordier, L.; Agnello, G.; Reynaud, S.; Tissut, M. Street Dust: Source and Sink of Heavy Metals To Urban Environment. In Proceedings of the E3S Web of Conferences, Rome, Italy, 23–27 September 2013; Volume 1. [Google Scholar] [CrossRef]
  38. Gope, M.; Masto, R.E.; George, J.; Hoque, R.R.; Balachandran, S. Bioavailability and health risk of some potentially toxic elements (Cd, Cu, Pb and Zn) in street dust of Asansol, India. Ecotox. Environ. Safe 2017, 138, 231–241. [Google Scholar] [CrossRef] [PubMed]
  39. Zhu, X.; Li, M.-Y.; Chen, X.-Q.; Wang, J.-Y.; Li, L.-Z.; Tu, C.; Luo, Y.-M.; Li, H.-B.; Ma, L.Q. As, Cd, and Pb relative bioavailability in contaminated soils: Coupling mouse bioassay with UBM assay. Environ. Int. 2019, 130, 104875. [Google Scholar] [CrossRef] [PubMed]
  40. Liu, B.; Luo, J.; Jiang, S.; Wang, Y.; Li, Y.; Zhang, X.; Zhou, S. Geochemical fractionation, bioavailability, and potential risk of heavy metals in sediments of the largest influent river into Chaohu Lake, China. Environ. Pollut. 2021, 290, 118018. [Google Scholar] [CrossRef]
  41. Padoan, E.; Romè, C.; Ajmone-Marsan, F. Bioaccessibility and size distribution of metals in road dust and roadside soils along a peri-urban transect. Sci. Total Environ. 2017, 601–602, 89–98. [Google Scholar] [CrossRef]
  42. Wang, S.; Wang, L.; Huan, Y.; Wang, R.; Liang, T. Concentrations, spatial distribution, sources and environmental health risks of potentially toxic elements in urban road dust across China. Sci. Total Environ. 2022, 805, 150266. [Google Scholar] [CrossRef]
  43. Wang, P.; Xue, J.; Zhu, Z. Comparison of heavy metal bioaccessibility between street dust and beach sediment: Particle size effect and environmental magnetism response. Sci. Total Environ. 2021, 777, 146081. [Google Scholar] [CrossRef] [PubMed]
Figure 1. Factor distribution of heavy metals in road dust based on PMF model. (ac) represent the percentage of contribution for each factor analyzed using the PMF model in the WA, CA, and EA, respectively. (df) represent the factor profiles of heavy metals derived from the PMF model in the WA, CA, and EA, respectively.
Sustainability 16 06550 g001
Figure 2. Comparison of bioaccessibility of heavy metals in road dust in Jinan. (a) Gastric phase (GP), (b) intestinal phase (IP).
Sustainability 16 06550 g002
Figure 3. Health risk assessment based on the total content of heavy metals in road dust. (ac) represent the non-carcinogenic risk parameters derived from the total quantity of heavy metals in different groups of people, presenting the HQ and HI for heavy metals at each sampling site, while (eg) illustrate the carcinogenic risk assessment also based on the total amount of heavy metals, encompassing the CR and TCR for heavy metals at each sampled location. (d,h) represent the contributions of different heavy metals to HI and TCR in children, respectively.
Sustainability 16 06550 g003
Figure 4. Comparison of the contributions of heavy metal elements from different pollution sources to carcinogenic and non-carcinogenic risks. (ad) show the differences in HQ and CR of each heavy metal element in industrial sources, natural sources, transport sources, and solid waste, respectively, within the WA, EA, and CA.
Sustainability 16 06550 g004
Figure 5. Health risk assessment based on gastric bioaccessibility of heavy metals in road dust. (ac) represent the NCR parameters of heavy metals in different groups of people, presenting the HQ and HI for heavy metals at each sampling site, while (eg) illustrate the carcinogenic risk assessment, encompassing the CR and TCR for heavy metals at each sampled location. (d,h) represent the contributions of different heavy metals to HI and TCR in children, respectively.
Sustainability 16 06550 g005
Table 1. Descriptive statistics of metal concentration (mg kg−1) in road dust in Jinan (n = 31).
Sample IDAsCdCrCuMnNiPbVZn
WA
Max12.10.4469.873.376728.188.654.3433
Min4.900.1540.619.831114.025.027.3125
Mean7.660.2452.944.150020.944.741.0245
SD2.400.1011.216.91615.1320.211.8122
CV(%)31.340.821.238.232.224.545.228.849.7
CA
Max11.89.2218328474675.626852.5592
Min5.940.0938.118.945117.013.740.6165
Mean8.041.7767.364.257430.271.545.1361
SD1.713.1236.865.882.915.272.73.26158
CV(%)21.317654.610214.450.31027.2443.9
EA
Max17.81.1891.468.3104951.511290.5750
Min7.860.1441.127.254119.523.743.8107
Mean10.60.3960.040.470831.446.756.6263
SD3.200.3317.612.215211.028.114.0202
CV(%)30.386.129.430.021.535.160.324.876.7
BV10.30.1467.82457330.12480.167.5
Abbreviations: CV, coefficient of variation; BV, background value. The guide values were in accordance with the soil geochemical baseline values and background values of the country and district in Shandong Province.
Table 2. Summary of the total concentrations of heavy metals (mg kg−1) in the road dust of Jinan and other cities in China.
CityAsCdCrCuMnNiPbVZnReference
WA, Jinan, Shandong 7.660.2452.944.150020.944.741.0245This study
CA, Jinan, Shandong8.041.7767.364.257430.271.545.1361This study
EA, Jinan, Shandong10.60.3960.040.470831.446.756.6263This study
Xiamen, Fujian 12.01.33143259-52.020243.6911[4]
Beijing-0.7284.769.9-25.2105-222[29]
Chengdu, Sichuan-1.6884.898.9-24.581.3-296[5]
Guangzhou, Guangdong21.30.73150117-35.415039.3475[26]
Hefei, Anhui2.00-13941.624128.6-31.4130[30]
Xi’an, Shanxi--14554.751130.812569.6269[22]
NanJing, Jiangsu13.90.72-133--102-281[9]
Shanghai8.300.3011540.4-37.445.086.4145[11]
Shijiazhuang, Hebei27.2 65.060.953924.961.5-438[31]
Disclaimer/Publisher’s Note: The statements, opinions and data contained in all publications are solely those of the individual author(s) and contributor(s) and not of MDPI and/or the editor(s). MDPI and/or the editor(s) disclaim responsibility for any injury to people or property resulting from any ideas, methods, instructions or products referred to in the content.

