Article

Evolution and Projection of Carbon Storage in Important Ecological Functional Areas of the Minjiang River Basin, 1985–2050

1
School of Civil and Surveying & Mapping Engineering, Jiangxi University of Science and Technology, Ganzhou 341000, China
2
The Engineering & Technical College, Chengdu University of Technology, Leshan 614000, China
3
Southwestern Institute of Physics, Chengdu 610041, China
*
Authors to whom correspondence should be addressed.
Sustainability 2024, 16(15), 6552; https://doi.org/10.3390/su16156552
Submission received: 22 June 2024 / Revised: 26 July 2024 / Accepted: 28 July 2024 / Published: 31 July 2024

Abstract

:
The alteration of land use and cover (LULC) and the landscape ecological risk index (LERI) significantly impact carbon storage. Examining the carbon storage services in ecologically significant places is crucial for achieving a harmonious relationship between economic development in the region, conservation of terrestrial ecosystems, and mitigation of carbon sink depletion. This study aims to provide a complete framework that integrates the PLUS, Fragstats, and InVEST models. This framework will be utilized to optimize LULC and LERI, specifically maximizing carbon storage. The analysis will be carried out over an extended duration and from various viewpoints. The results indicate that the MJRB ecosystem experienced three clearly defined phases: enhancement (1985–1995), degradation (1995–2010), and subsequent enhancement (2010–2020). The LERI of high-level and carbon storage patterns showed similar trends. The degradation of local terrestrial ecosystems can primarily be due to the widespread use of ecological land caused by socio-economic development. The Ecological Preservation Scenario is projected to increase 41.97 Tg and 115.18 Tg in carbon storage. In contrast, the urban development scenario showed a substantial decrease in carbon storage rates, namely 0.89% and 1.34%, primarily evident in the Chengdu urban zone. An analysis of coupling coordination revealed a negative relationship between carbon storage and high LERI, while a positive connection was observed with low LERI. This study established a framework for rapidly assessing and forecasting the trajectory of carbon storage. It aids in optimizing land use patterns, conserving areas with high carbon sequestration, and ensuring the establishment of high-quality ecosystems. This study serves as a guide for achieving regional “dual carbon” objectives.

1. Introduction

Increasing human activities emit substantial amounts of CO2 into the atmosphere, leading to global warming and triggering climate issues that threaten sustainable development [1,2]. Terrestrial ecosystems and atmospheric, marine, and terrestrial biomes form an integrated system capable of effectively regulating the climate and reducing CO2 levels [3,4]. Ecological spaces within terrestrial ecosystems, such as farmlands, forests, grasslands, and water, are considered the most crucial carbon sequestration areas [5,6]. Carbon storage (CS) is a vital metric for evaluating ecosystem services in terrestrial ecosystems. Rapid economic growth and accelerated urbanization are causing the rapid degradation of these ecological spaces, altering the spatial and temporal distribution patterns of Land Use and Land Cover (LULC) and further weakening the carbon sequestration function [7].
Carbon storage is crucial in mitigating climate change, maintaining ecosystem health, and supporting biodiversity. Various ecosystems, such as forests, wetlands, agricultural lands, and urban green spaces, contribute significantly to carbon storage. For example, forests absorb a large amount of atmospheric carbon dioxide, acting as essential carbon sinks and helping to mitigate climate change. Chowdhury [8] emphasizes that these forests absorb a significant portion of global carbon dioxide emissions, underscoring their importance in the global carbon cycle. Although covering a smaller global area than forests, wetlands store a substantial amount of carbon per unit area. Stewart [9] highlights that inland wetlands are vital carbon reservoirs, storing one-third of the world’s soil organic carbon, contributing significantly to carbon balance. Agriculture also plays a role in carbon storage. For instance, organic rice farming enhances soil carbon sequestration, which helps store carbon and improves soil health and fertility. Xia [10] discusses how crop residue return aids carbon storage and supports sustainable agriculture. Urban green spaces, including urban forests, also contribute to carbon storage. Ariluoma [11] conducted a study on the carbon sequestration capacity of urban green spaces, finding that tree planting in urban areas effectively mitigates climate change while also providing greenery.
LULC changes are a primary reason for the global carbon cycle imbalance and one of the most unstable factors affecting the terrestrial ecosystem carbon cycle [12,13,14]. Human activities contributed to alterations in the LULC and ecosystem function and structure and significant impacts on the regional carbon cycle and ecosystem [15,16]. Changes in different LULC types promote changes in the carbon cycle, even transforming carbon sinks into carbon sources. Quantitatively assessing the impact of regional LULC on ecological carbon storage is crucial for enhancing regional ecosystem service functions and mitigating climate change [17,18]. Primary methods for obtaining terrestrial ecosystem carbon storage include field surveys (high accuracy but high cost), remote sensing inversion (mainly targeting surface objects with difficulties in securing subsurface and biomass data) [19], modeling, and IPCC methods [20]. Modeling methods are preferred as they provide high-accuracy data on aboveground, underground, and biomass carbon storage [21]. In the past, carbon storage estimation was mainly based on obtaining basic data through field surveys, interpolating new research data by combining various spatial interpolation methods such as Kriging and optimizing the data using machine learning techniques. In contrast, geostatistical analysis was commonly used in result data analysis, and the LULC data were used more frequently in large-scale carbon storage estimation [22,23]. Combining the Integrated Valuation of Ecosystem Services and Tradeoffs (InVEST) version 3.13.0 with LULC yields accurate results and can reveal carbon storage changes across different times and spaces [24,25,26,27]. System dynamics models and cellular automata are used to predict the probability of LULC type changes and the future spatial–temporal distribution of land types, exploring the impact of future LULC changes on regional ecosystem carbon storage [5,28,29]. However, few studies have investigated the response mechanisms of LULC changes in large-scale important ecological function areas to carbon storage using the InVEST model, and studies anticipating land use change and their influence on ecosystem carbon sequestration under diverse development situations are especially unusual.
The spatial distribution of LULC is manifested in landscape patterns, the impacts of human activities on the regional ecosystem, and a combination of various natural environmental changes. These patterns are composed of patches whose shapes, types, numbers, and sizes are influenced by external forces. Simultaneously, patches within landscape patterns affect ecological processes and edge effects [30,31,32]. Changes in LULC alter landscape patterns, subsequently impacting the carbon cycle. Studying the impacts of landscape patterns on the carbon cycle is essential for analyzing carbon storage from a regional perspective and even more critical for achieving the “double carbon” goals. Changes in LULC types affect patch fragmentation, connectivity, number, and shape, directly impacting carbon sequestration capacity. Shu [33] found that optimizing industrial land structures and reducing industrial land patches can decrease carbon emissions. Shi [34] studied the relationship between carbon emissions and urban spatial morphology in 264 Chinese cities, finding that irregular and complex urban structures increase carbon emissions. In contrast, well-connected urban areas help reduce carbon emissions. The landscape ecological risk index (LERI) assesses external damage to ecosystem value and function, quantitatively evaluating regional spatial–temporal risk levels and revealing the factors that influence the ecosystems. Therefore, LERI is often used to assess ecological development. Cui [35] constructed an environmental risk assessment model to study the landscape ecological risk levels of the Qinling Mountains and revealed the distribution patterns of different risk levels. Humans more clearly influence changes in LULC, and alterations in LULC structure change landscape ecological patterns, affecting regional carbon sequestration capacity. Qu [36] found that changes in green space areas positively correlate with increased carbon storage and reduced LERI risks, indicating that protecting green and black land aids carbon sequestration and lowers landscape ecological risks. The interaction between ecosystem services and LERI directly influences ecological carbon sequestration functions. Therefore, environmental carbon sequestration and LERI were combined to assess regional ecological conditions, providing better references for regional LULC planning and management.
The Minjiang River Basin (MJRB) is the most crucial ecological function area in the upper reaches of the Yangtze River, serving as a vital shield for maintaining the environmental security of the Yangtze River and key to achieving China’s carbon peak and carbon neutrality (“dual carbon”) goals [37,38]. Additionally, the MJRB significantly differs from most regions in China in terms of land area, economic development, urbanization, and ecological structure, making it one of the core regions with the most prominent environmental environments. Since the implementation of China’s Western Development Strategy, significant changes have occurred in the LULC patterns of this region, with substantial increases in artificial surface areas, reductions in ecological land areas, increased carbon emissions, and significant impacts on the regional ecological environment and risks, leading to a series of environmental issues. Accurately and efficiently assessing regional terrestrial ecosystem carbon sequestration and investigating the link between environmental hazards and carbon sequestration is crucial. However, current research on ecological risks and carbon storage primarily focuses on vulnerable areas such as wetlands and coasts, with relatively few studies on important environmental function areas.
This study conducts a comprehensive analysis of a typical critical ecological function area using multi-factors (LULC driving factors), long time-series (65 years, ten points), and multi-perspectives (LULC, carbon storage, landscape patterns, LERI, spatial autocorrelation, and spatial differentiation). A framework for rapid carbon storage calculation and trend prediction was constructed, overcoming the limitations of previous studies and addressing the gaps in carbon storage research. The specific contributions include (1) analyzing LULC changes and influencing factors from 1985 to 2020, (2) analyzing changes in 12 landscape pattern indices from 1985 to 2020 and exploring the spatial–temporal changes and autocorrelation of LERI, (3) predicting LULC changes for 2030 and 2050, (4) calculating and analyzing carbon storage from 1985 to 2050 and its response relationship with LULC changes, (5) using an improved coupling harmonious degree model to analyze the relationship between carbon storage and LERI, and (6) proposing a land-use model focusing on ecological and farmland protection for the critical ecological function area of MJRB.

2. Materials and Methods

2.1. Study Area

MJRB is situated in the junction of the Sichuan Basin and the Qinghai-Tibet Plateau, namely at coordinates 100°32′–105°21′ E and 27°51′–34°19′ N. This region consists of 71 districts and counties from 7 cities and prefectures located within the drainage basins of the Minjiang, Dadu, and Qingyi Rivers (Figure 1). The eastern and western portions’ natural sceneries and geological features are differentiated. The northwestern region exhibits elevated terrain characterized by mountains and gorges, notable variations in altitude, an arid and chilly temperature, and a heightened ecological vulnerability. On the other hand, the middle and lower sections of the area have lower altitudes and are defined by hills and plains. These regions have a warm and humid environment, which has historically facilitated the growth of agriculture. The region has an average forest coverage of approximately 42%, highlighting its significance as a crucial place for ecological cultivation [39]. The main channel of the Minjiang River spans 711 km and has an annual flow of 90 billion cubic meters, making it the most water-rich tributary of the Yangtze River.

2.2. Data Sources and Preprocessing

The data utilized in this study encompass land classification, carbon density, socio-economic, climate, and environmental, as well as essential geographic datasets. The LULC for the analyzed region was derived using the 30 m resolution CLCD dataset provided by Professor Huang Xin’s team [40]. These CLCD data were reclassified to focus on six land categories: farmland, forest, grassland, water, artificial surfaces, and unused land. Fourteen types of data were selected as driving factors: soil type, slope, elevation, precipitation, temperature, population, Gross Domestic Product (GDP), distance to roads, distance to railways, distance to highways, and distance to rivers. Digital Elevation Model (DEM) data were sourced from NASA’s SRTM1 V3.0, river data from the Global Surface Water Explorer, and road, railway, and highway data from OpenStreetMap. GDP, population, soil type, precipitation, and temperature data were also acquired from the Resource and Environment Science and Data Center of the Chinese Academy of Sciences.

2.3. Methods

Cellular automata and Markov chains were initially introduced to analyze the LULC data. LULC state in the MJRB was subsequently simulated under various scenarios for the years 2030 and 2050 using the Patch-generating Land-Use Simulation Model (PLUS) version 1.4. Subsequently, we analyzed land utilization intensity and the spatial and temporal distribution of LERI over the period 1985–2020. The InVEST model was employed to quantitatively assess the changes in carbon storage under different scenarios from 1985 to 2050. Finally, we used the modified coupling method to analyze the impact relationship between carbon storage changes and ecological risks. Figure 2 displays the core research of this study.

2.3.1. LULC Analysis and Prediction Methods

This study analyzed and prognosed LULC using PLUS. This model integrates the LEAS and CARS, identifying driving factors for land expansion and predicting patch-level land use landscape evolution [16]. The PLUS module can effectively capture the spatial and temporal dynamics of LULC, and the embedded Markov chain can simulate the nonlinear relationship behind LULC at the patch level to accurately predict the impacts of LULC on potential ecosystem service functions under different policy scenarios in the future. The model includes modules for Kappa and Figure of Merit (FoM) coefficients. The Kappa coefficient, used to measure classification accuracy, indicates the modeling process’s precision [41,42,43], while the FoM coefficient assesses various performance aspects. In LULC simulation, the FoM indicator indicates the percentage of the junction to the union of real and anticipated modifications [44,45].
The PLUS model was employed to forecast the spatial and temporal distribution of future LULC. Initially, the LEAS module extracted land expansion data for the MJRB study area from 2005 to 2015. These data and 14 selected driving factors were processed using the Random Forest algorithm to determine the land development probabilities for six land use types in the MJRB region from 2005 to 2015. Subsequently, based on the 2015 LULC data and these development probabilities, the CARS module predicted the LULC data for 2010 and 2020 within the study area. The predicted data were compared with actual data to validate accuracy, optimize the model, and adjust the driving factors, ensuring the predictions met accuracy requirements. Finally, the CA-Markov model projected land use demand for future years. Using 2020 as the baseline and considering four future sustainable development scenarios, the LULC of the MJRB was projected for both 2030 and 2050, focusing on spatial and temporal patterns.

2.3.2. LULC Dynamic Degree

Land use dynamics accurately reflect the extent of changes in land use types and provide a quantitative evaluation of LULC changes. These dynamics encompass single land use dynamics and comprehensive land use dynamics. The solely dynamic degree rate can represent alterations in a particular land use type over a defined period in a specific area; the integrated dynamic degree rate can reflect the annual variation of all land use types within the entire district. The calculation formulas for these two types of land use dynamics are as follows:
S = ( A b A a ) / A a × 1 / T × 100 %
C = i = 1 n Δ L A i j / 2 i = 1 n L A i × 1 T × 100 %
where S and C represent the LULC solely dynamic degree and integrated dynamic degree, Aa and Ab are the areas of LULC types at the beginning and the end of the research period, respectively, T represents the duration of the study, i and j denote the LULC types, LAi is the initial area of land type i, and △LAi-j indicates the land area of type i converted to type j during the research period.

2.3.3. LandScape Pattern Index

The landscape pattern index provides a method for evaluating and analyzing regional landscapes’ spatial arrangement, function, and ecological service capacity, describing the characteristics of the LULC landscape structure and spatial configuration [46]. The Fragstats version 4.2.1 software, which is more frequently used in landscape pattern analysis, is based on geospatial data and evaluates landscape structure and spatial configuration characteristics by calculating various landscape indices. Considering the landscape features of the research area, 11 indicators were chosen to aid in the evaluation (Table S1 online).
Landscape ecological risk (LER) is a crucial component of landscape patterns, reflecting the stability and vulnerability of landscape ecosystems. LER comprehensively considers various environmental and risk factors to assess landscape ecosystems’ health and sustainable development capacity. LER indicates the ability of the study area to withstand external disturbances. A lower LER value signifies a more robust landscape recovery capability, while a higher LER value denotes a weaker resistance to external disturbances [47]. The landscape ecological risk index (LERI) for MJRB was constructed using the landscape disturbance index and vulnerability index to evaluate MJRB’s ecological disturbance degree. The formulas for the calculations are as follows:
L E R I k = i = 1 N A k i A k × D i × V i
where k is the grid, Aki is the landscape area of type i in the k-th grid, Ak is the k-th grid area, Di is the landscape disturbance index of type i, and Vi is the landscape fragility index.
Grids were selected as evaluation units to represent the spatiotemporal heterogeneity of landscape ecological risk visually. Based on comparative experiments and previous research findings [48], the study area was divided into 1845 landscape ecological risk evaluation grid units, each measuring 10 km × 10 km (Figure S1 online). Each grid’s LERI was calculated, and the results were assigned to the grid center.

2.3.4. Spatial Heterogeneity Analysis

Spatial heterogeneity primarily encompasses stratified heterogeneity (spatial differentiation) and local heterogeneity. Spatial stratified heterogeneity examines spatial differentiation and uncovers its driving forces, typically analyzed using a geographical detector. Spatial local heterogeneity reveals differences between a specific point and its surrounding attributes, generally analyzed using spatial autocorrelation methods.
The geographical detector is a model of the causes of statistical spatial variation. This method includes four main components: risk detection, ecological detection, factor detection, and interaction detection [49]. In this study, by constructing the links between natural, social, and economic factors and LULC changes, integrating related factors, and adopting factor detection and interaction detection methods, we investigated each factor’s degree of influence and mechanism of action individually and interactively on LULC changes. Using q-value to measure the contribution of the dependent variable is the main objective of factor detection, and Equations (4) and (5) are the factor detection formulas.
q = 1 1 N δ 2 h = 1 L N h δ h 2 = 1 S S W S S T
S S W = h = 1 L N h δ h 2 , S S T = N δ 2
where h represents the stratification of the influence factor of LULC change; Nh is the number of cells in layer h; N is the number of cells in the whole zone; δ h 2 and δ 2 are the stratified data and the area-wide variance, respectively; SSW and SST are the sum of the intra-stratum variance and the total variance of the whole area, respectively; q represents the interpretive capability of the factor, which is taken between the values of (0,1); higher q-values indicate a greater impact of the detection factor on the LULC.
Interaction detection analyzes the explanatory power of the interactions between different factors on regional target changes. In this study, ten detection factors from the LULC driving factors (Table 1) were utilized for single-factor detection and two-factor interaction detection on the spatiotemporal LULC change data from 1985 to 2020.
Spatial autocorrelation effectively describes the spatial clustering of geographical phenomena and assesses the dependence between variables within a region. The Local Moran’s I index can analyze the spatial positive and negative correlation of the data, and the Getis-Ord Gi* cold hotspot analysis model can statistically count the hotspots and cold spots with significance, which are introduced in this paper to analyze the correlation between LERI and carbon storage. Moran’s I index measures the degree of clustering or dispersion in spatial distribution [50], but it does not identify the specific locations of clusters. The Getis-Ord Gi* model accurately detects the spatial distribution of clustered areas. Combining these two methods provides a comprehensive understanding of the spatial distribution of elements. Equation (6) expresses in detail the algorithm of Moran’s I.
M o r a n s   I = n i = 1 n j = 1 n W i j ( x i x ¯ ) ( x j x ¯ ) / i = 1 n j = 1 n W i j i = 1 n ( x i x ¯ ) 2
where n is the total number of elements; xi and xj are the values of location i and j, respectively; x ¯ is the target mean value; Wij is the spatial weight matrix established at a fixed distance range. Moran’s I index takes the data [−1, 1]. Moran’s I is positive to indicate the existence of spatial positive. Moran’s I indicates the existence of spatial positive correlation, and the more significant the value, the larger the degree of aggregation of elements in the region. Negative Moran’s I indicates the existence of spatial negative correlation, and the smaller the value, the more significant the spatial difference of elements in the region. Zero Moran’s I indicates the absence of spatial correlation, and the elements are in the state of random distribution. The Getis-Ord Gi* formula calculation is as follows:
G i * ( d ) = i = 1 n W i j ( d ) X i / i = 1 n X i
where Wij is the spatial weight matrix between i and j; xi is the element value of space i; n is the total number of elements. A positive number for Gi*(d) indicates that the element values of this spatial unit and neighboring units are similar, and the spatial clustering tends to be tight (cold spots or hot spots); a negative number for Gi*(d) indicates that the element values of this spatial unit and neighboring units are similar. On the contrary, spatial clustering tends to be dispersed; a zero value for Gi*(d) indicates that the element values of this spatial unit and neighboring units present random independent distribution characteristics.

2.3.5. Sustainable Development Scenario Setting

To address the sustainable development and ecological protection needs of the MJRB, four sustainable development scenarios were established to simulate the spatiotemporal distribution of LULC for 2030 and 2050: (1) Natural Development Scenario (NDS), where LULC changes follow historical development trends without external policy interventions, allowing various land types to interchange; (2) Ecological Preservation Scenario (EPS), focused on protecting the environment and excellent socio-economic growth, promoting a transition into a “low-carbon” and “green” economy, with priority given to ecological land; (3) Farmland Preservation Scenario (FPS), guided by national farmland protection policies and food security, aimed at minimizing the conversion of farmland in MJRB to other land types, particularly limiting the conversion of farmland to artificial surfaces, thereby strengthening farmland protection and ensuring food production security; (4) Urban Construction Scenario (UCS), recognizing the significant potential for development within China’s socio-economic growth, with urbanization as a crucial aspect, prioritizing land use for economic development and urbanization in terms of quantity and scale. Based on these sustainable development scenarios, land conversion rules were established for NDS, EPS, FPS, and UCS (Table S2 online) to simulate future LULC changes under various scenarios. The development scenario is the same as the development focus; future development is affected by various factors. As a quantitative study of future changes in carbon storage due to changes in land types, we set the sustainable development scenario as a perfect state.

2.3.6. Carbon Storage Estimation Method

The InVEST is used to assess and model ecosystem services and their interrelationships. It is capable of mapping and valuing ecological services and helping stakeholders balance development and conservation objectives, thus facilitating informed decision-making. The module assesses how land use and management options affect ecosystem services such as carbon storage, water purification, and biodiversity. The InVEST model was employed to estimate the total carbon of the MJRB ecosystem from 1985 to 2050. This model categorizes LULC into four types of carbon pools: aboveground biomass carbon, belowground biomass carbon, soil organic carbon, and dead organic matter carbon. Due to the difficulty in accurately obtaining data on dead organic matter within the study area and to ensure the spatiotemporal changes in total carbon storage remain unaffected, this study considered only aboveground biomass, belowground biomass, and soil organic carbon pools for calculations [50,51]. The formula for calculating carbon storage in terrestrial ecosystems is as follows:
C k = C k _ a b o v e + C k _ b e l o w + C k _ s o i l + C k _ d e a d
C t o t a l = i = 1 m S k × C k ,   ( k = 1 ,   2 ,   ,   m )
where Ck is the carbon density (unit: Mg·C·hm−2) of the kth land class, Ck_above is the surface carbon density of the k-th land class, Ck_below is the subsurface carbon density of the kth land class, Ck_soil is the soil carbon density of the k-th land class, Ck_dead is the carbon density of the dead vegetation of the k-th land class, Ctotal is the total CS within the research region, Sk is the acreage of the study area, The sum of the acreage of the k-th land classes, m, is the type of land class in the study area.
Due to the absence of comprehensive carbon density values within the study area, a correction parameter method was utilized for adjustment. This method adjusts carbon density values on a national scale based on similar climatic conditions [52,53,54].
C S P = 3.3968 × M A P + 3996.1     ( R 2 = 0.11 )
C B P = 6.798 × e 0.0054 × M A P           ( R 2   =   0 . 70 )
C B T = 28 × M A T + 398     ( R 2 = 0.47 ,   P < 0.01 )
where CSP is the soil carbon density value (kg·C·m−2) obtained from mean annual precipitation, CBP is the biomass carbon density value (kg·C·m−2) obtained from annual rainfall, CBT is the biomass carbon density value (kg·C·m−2) obtained from mean annual temperature, MAP is the mean annual precipitation (mm), and MAT is the mean annual air temperature (°C).
The carbon density values were optimized using Formulas (10) to (12). By considering the annual average temperature and precipitation for China (9.9 °C/675 mm) and the MJRB (11.7 °C/917.7 mm), the carbon density correction coefficient for the MJRB was calculated.
K B = K B P × K B T = C M _ B P / C C _ B P × C M _ B T / C C _ B T
K S = C M _ S P / C C _ S P
where KBP is the carbon pool adjustment parameter for rainfall, KBT is the carbon pool adjustment parameter for temperature, CM is MJRB carbon pool, and CC is the whole country carbon pool; KB and KS are the correction factors for biomass carbon density and soil carbon density, respectively. Calculating the carbon density correction factor and synthesis of the national composite carbon density values obtained from the literature (Table S3 online) yielded the carbon pool data for the MJRB in the research region (Table 2).

2.3.7. Modified Coupled Coordination Degree Models

The coupling coordination degree model is a commonly used method for examining the interrelationships between multiple systems. Introducing a modified coupling degree model [55,56] enhances the accuracy of the results. In this study, the relationship between landscape ecological risk and carbon storage was evaluated by combining the coupling degree and coordination degree, resulting in a comprehensive evaluation index to determine the coupling coordination state of these two factors within the entire system. Equations (15)–(17) are the formulas for the coupling coordination degree.
C = 2 [ ( W × S ) / ( W + S ) 2 ] 1 / 2
T = α × W + β × S
D = ( C × T ) 1 / 2
where W represents CS, S is landscape ecological risk, C is the degree of coupling between CS and LERI, and the variable T serves as the metric for assessing the coupled coordinated development, with the coefficients α and β both set to 0.5, indicating that the enhancement of CS is equally essential as landscape ecological risk prevention. D is the degree of coupled coordination. CS and LERI were normalized to avoid differences in level and magnitude.

3. Results

3.1. Model Accuracy Verification

The LULC simulation is intricate and affected by policy, economic conditions, and natural factors [57,58]. The accuracy of LULC simulations directly impacts the validity of the research results. This study incorporated policy and natural economic factors, such as farmland, ecological protection, and land space planning policies, into the LULC simulation. To address the limitations of using a single model, the Markov, PLUS, and PLM models were integrated to simulate LULC across multiple periods. The Kappa and FoM coefficients were introduced for comprehensive accuracy validation to mitigate uncertainties associated with single validation models. The two sets of validation data simulated in this study yielded Kappa coefficients above 88.3%, overall accuracy above 92.3%, and FoM coefficients above 0.434, demonstrating the reliability of the prediction results [59,60].

3.2. MJRB LULC Changed in 1985–2000

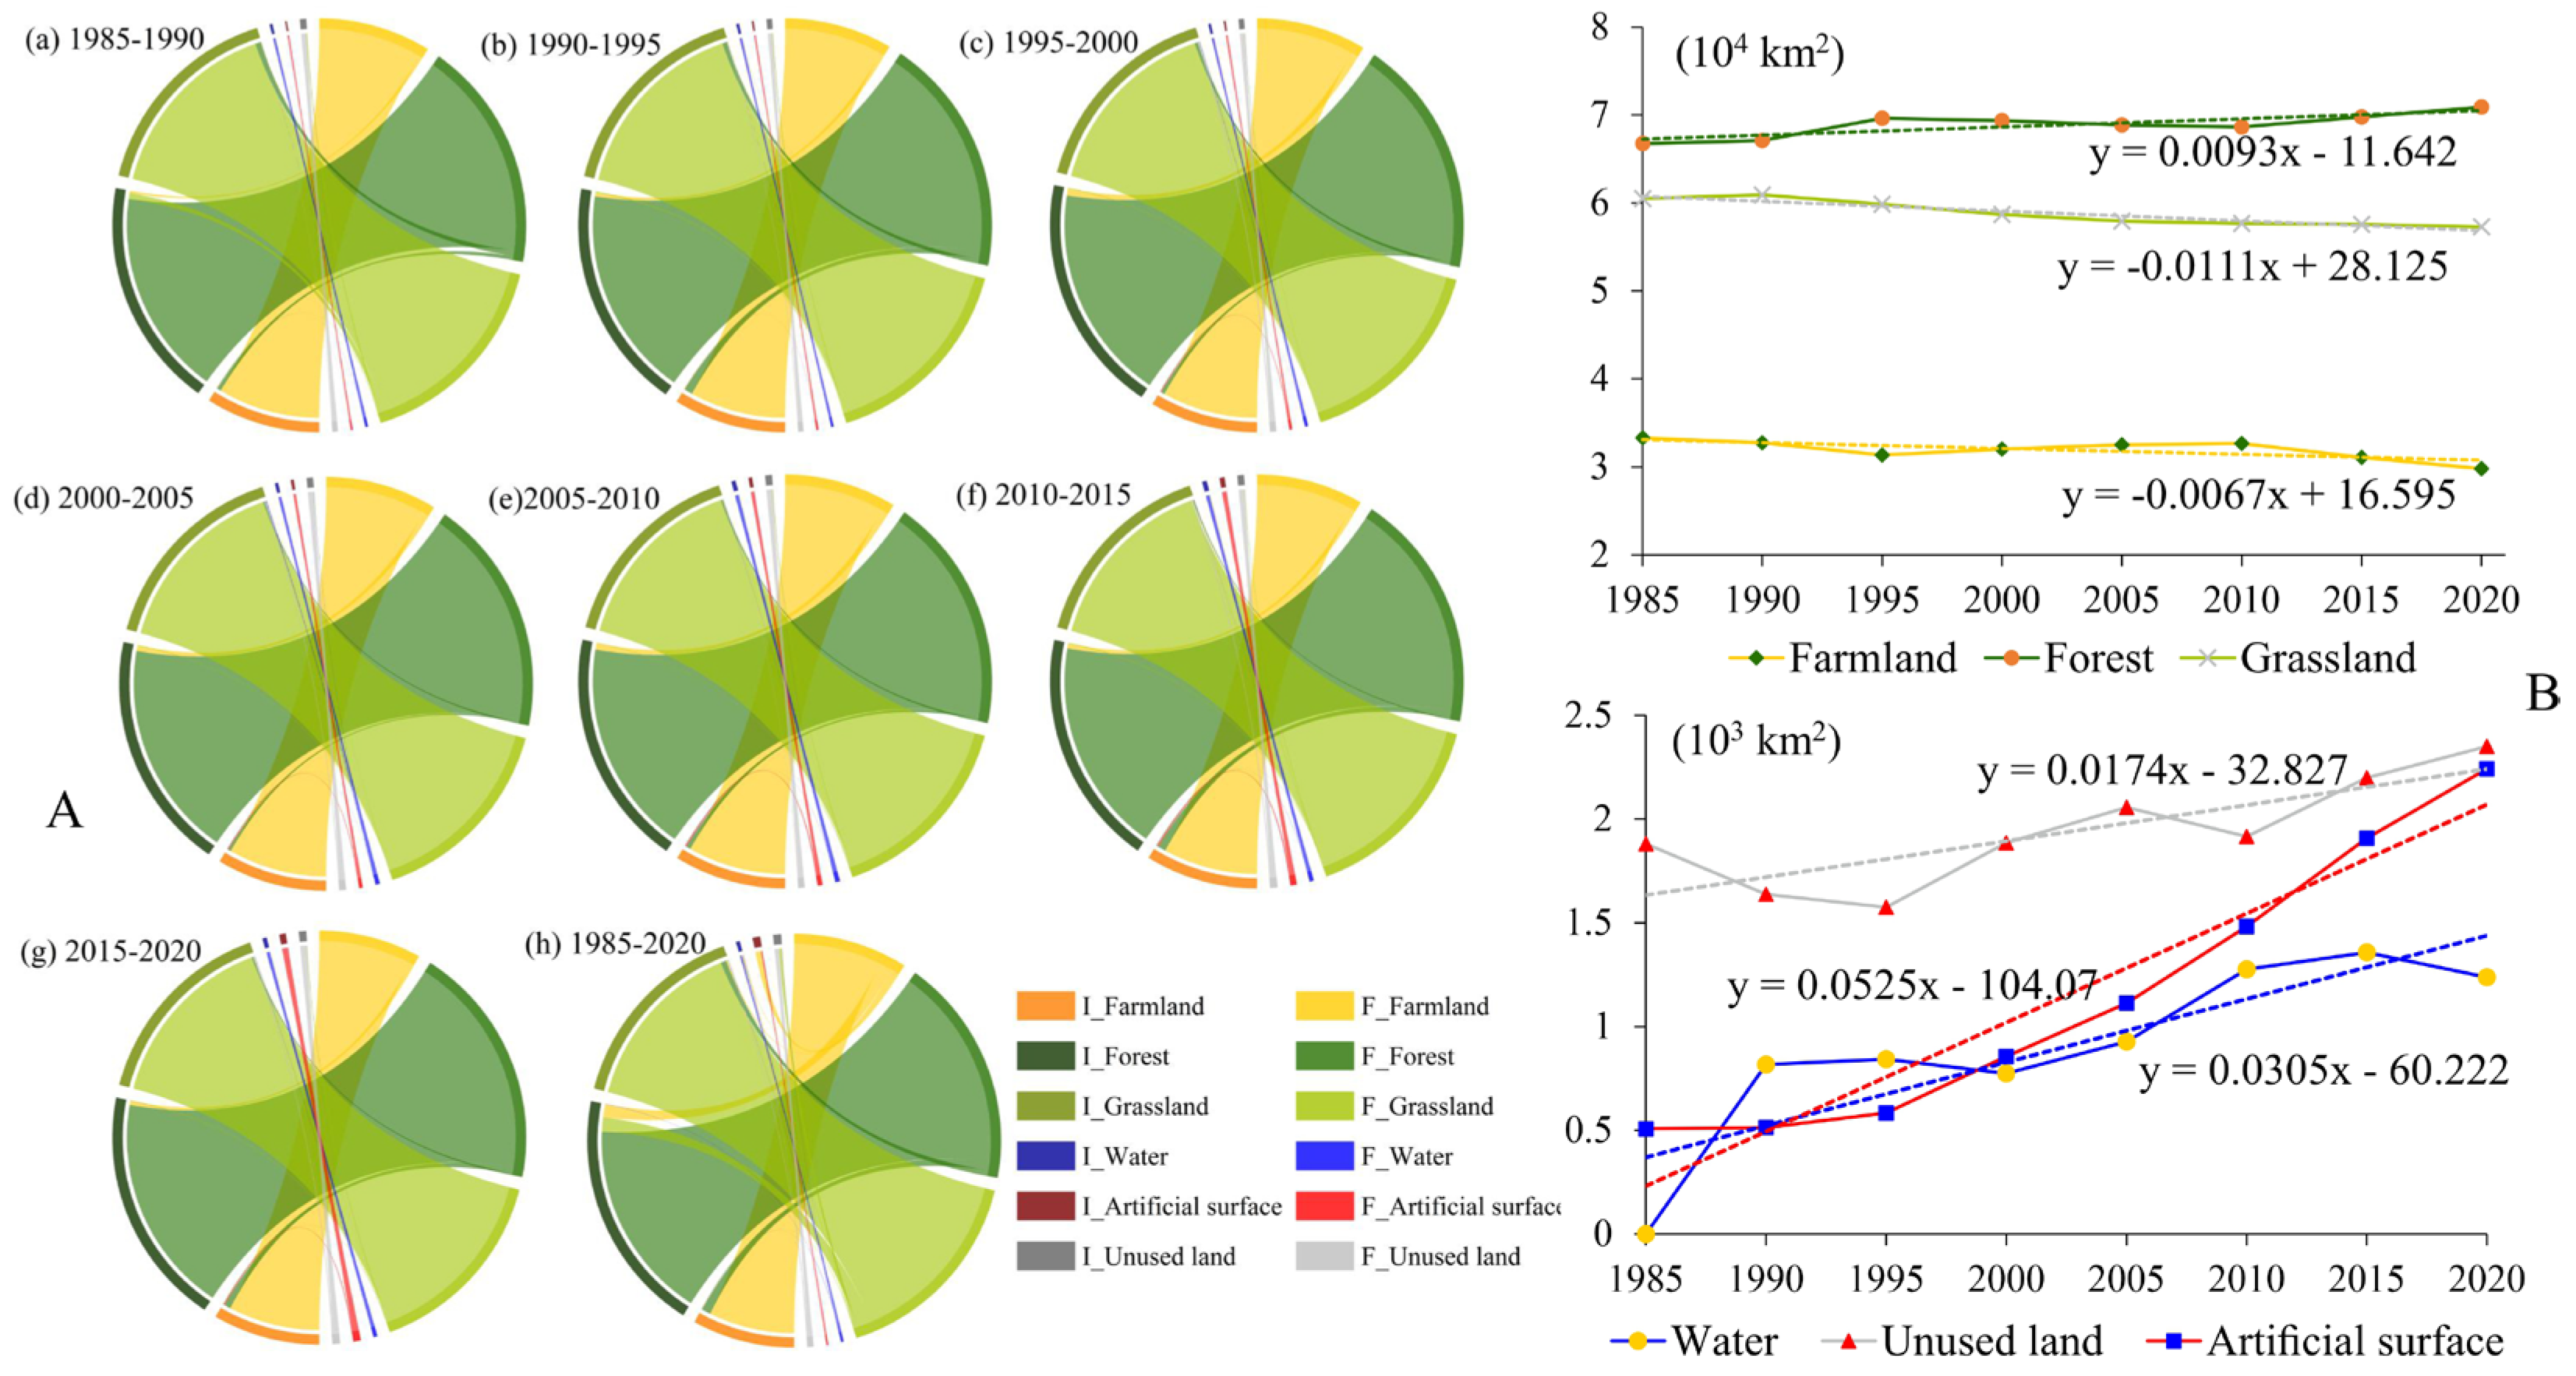
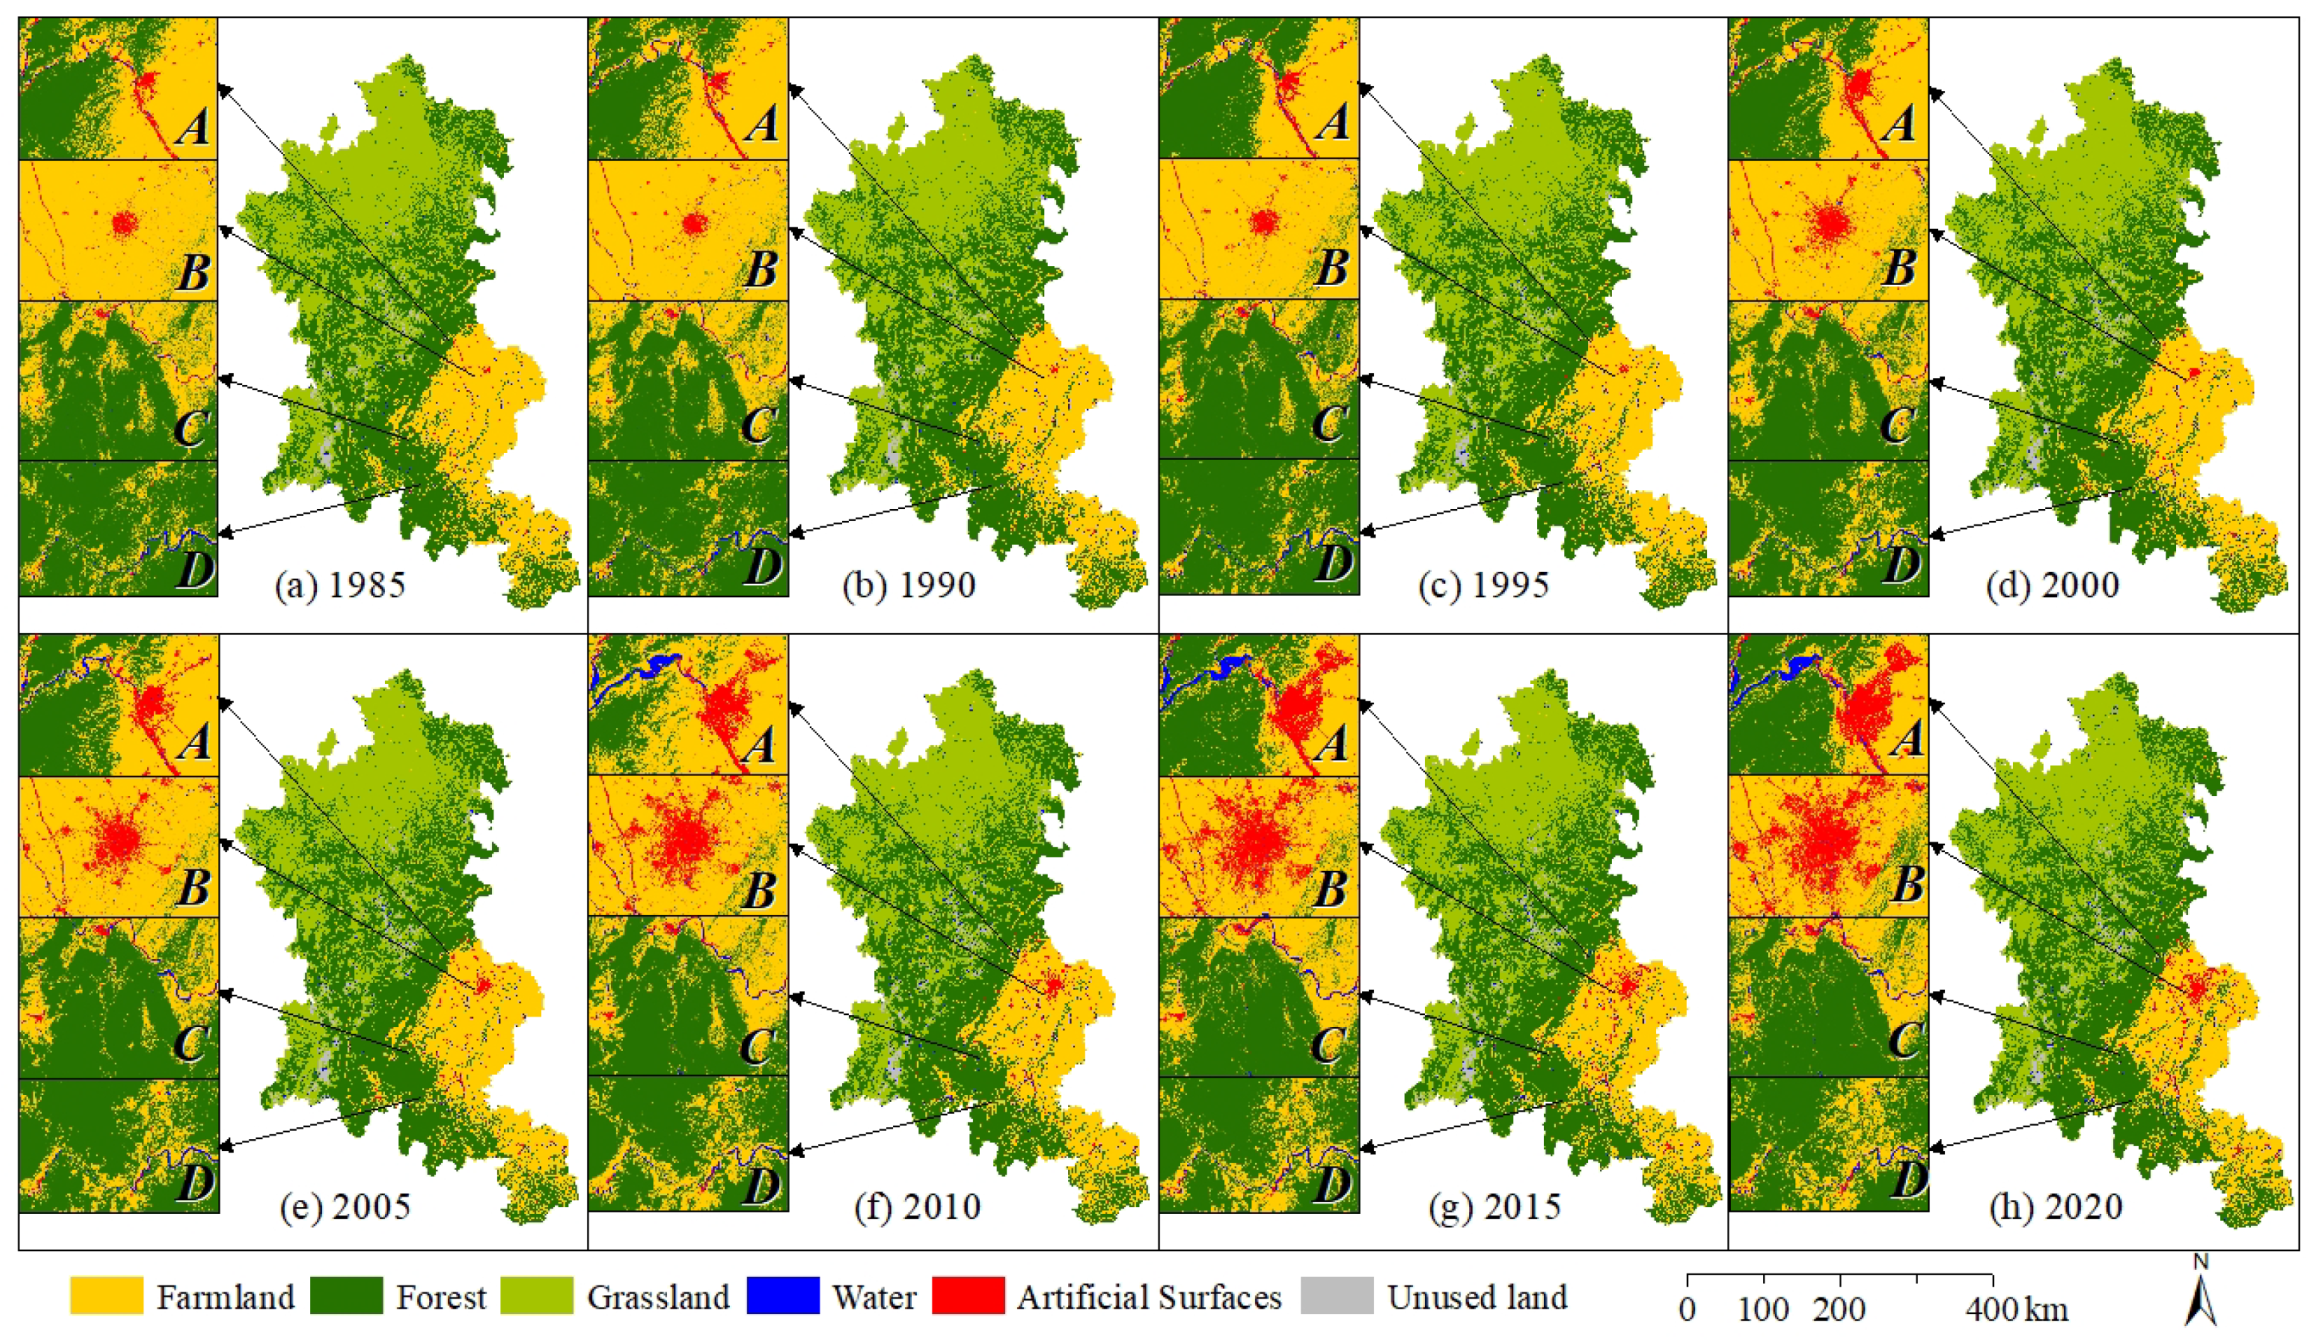
3.2.1. Spatial and Temporal Changes in LULC

Geostatistical analysis data (Table S4 online) and the LULC transition matrix (Figure 3A) indicate that from 1985 to 2020, farmland in the MJRB continuously decreased. Most farmland was converted into artificial surfaces, water, and forest. The farmland area decreased from 33,288.33 km2 to 29,795.32 km2 (from 20.33% to 18.20%). The rapid socio-economic development notably resulted in significant farmland occupation by artificial surfaces, posing a direct threat to food security if this trend continues. Forest gradually increased during this period, with an overall growth of 6%, primarily because farmland was converted into grassland. The expansion of forests has benefitted from the State’s execution of ecological protection, the creation of natural conservation forests, and the policy of converting cropland to forests. Grassland never exceeded 4% of the entire basin and continuously decreased, primarily converting to forest and unused land, aligning with national protective forest policies. Water saw a significant increase in the mid-1990s, growing by 43% over 35 years, primarily due to the conversion from farmland, grassland, and unused land (driven by Sichuan Province’s hydropower development strategy). During this period, artificial surfaces expanded to 2242.09 km2, mainly at the expense of farmland and water (due to rapid socio-economic development and urbanization). The area of unused land increased by 25%, primarily due to the conversion from grassland and water. Over the 35 years, the total LULC type changes in this region were predominantly (Figure 3B) forest > farmland > grassland > artificial surface > unused land > water.
From a spatiotemporal distribution perspective, the area and spatial distribution of different land types in the MJRB have undergone varying degrees of change, exhibiting multiple spatial characteristics. Notably, the expansion of artificial surfaces was primarily concentrated in the Chengdu urban circle (Figure 4), driven by the national Western Development policy and the strategic shift of industrial clusters to the southwest region. Additionally, the Minjiang and Dadu rivers within the basin provided crucial support for regional commercial and industrial development, increasing the demand for artificial surface land along the rivers. Urban expansion mainly encroached upon extensive surrounding farmland, forest, and water. By 2020, the total area of artificial surfaces had tripled compared to 1985, with artificial surfaces beginning to cluster within farmland areas (positions A, B, and C in Figure 4). Despite this, ecological conditions in some areas have improved. In Ya’an City, a considerable amount of farmland was converted to forest (pointion C in Figure 4); in the Dujiangyan area, Ya’an City, and Leshan City, the water area significantly expanded (Positions A, C, and D in Figure 4). Due to MJRB’s abundant water resources and significant water level gradient, numerous hydropower stations were constructed during China’s rapid economic growth, contributing to the increase in water area. Simultaneously, much of the forest was converted to farmland in Leshan City (position D in Figure 4).

3.2.2. LULC Types Transfer

The LULC transfer data for MJRB from 1985 to 2020 (Table S5 online) indicate that the ratios of farmland, forest, and grassland exceeded 20%. In contrast, the proportions of water, artificial surfaces, and unused land were less than 1.5%. Despite the small proportion of artificial surfaces, high conversion rates were observed among farmland, forest, grassland, and artificial surfaces. During the periods 1990–1995, 2010–2015, and 2015–2020, the most significant area conversion was from farmland to forest, with over 2000 km2 of farmland converted to forest. From 1995 to 2010, the net increase in farmland converted to forest was 2517 km2. The conversion volume from farmland to grassland remained stable with minimal changes across periods. The conversion volume from farmland to artificial surfaces was closely time-dependent. From 1985 to 1995, the conversion volume was less than 76 km2, but starting in 1995, the area of artificial surfaces increased significantly, with the increase from 2010 to 2015 being six times that from 1990 to 1995.
Forest covers the largest portion of the MJRB, showing a general pattern of initial increase, subsequent decrease, and then growth in area. Between 1990–1995, 2000–2005, and 2015–2020, the forest area increased by 3.75%, −0.75%, and 1.63%, respectively, resulting in an overall increase of 6.22%. Grassland area decreased by 5.31%, water area increased by 43.03%, unused land area increased by 24.98%, and artificial surface area increased by 341.90%. The results indicate that the increase in artificial surface area was primarily due to the conversion from farmland, forest, grassland, and water (Figure S2 online).

3.2.3. Land Use Dynamic Degree

An analysis of the LULC dynamics in the MJRB from 1985 to 2020 revealed significant changes in water, unused land, and artificial surfaces among the single land use dynamics. The dynamic change rate of artificial surfaces reached 9.3% between 1995 and 2020, primarily due to the small total area of artificial surfaces before 1995. Major housing reforms implemented in China from 1993 to 1998 emphasized housing commercialization and spurred the extensive construction of artificial surfaces. The water exhibited a substantial positive dynamic change rate between 1995 and 2010, driven by Sichuan Province’s Hydropower development policy. Grassland and forest showed relatively minor changes, with rates below 0.8%. Despite significant transfer areas, their large share of about 77% of the total area resulted in lower dynamic change rates. Farmland experienced a significant negative dynamic change rate throughout the study period, mainly due to rapid economic development and manufacturing and real estate development encroachment on large farmland areas in the Chengdu Plain, particularly evident between 2010 and 2020. Though modestly, the overall land use dynamic rate exhibited an increasing trend, with a maximum value of 0.32% between 1990 and 1995. The comprehensive land use dynamic rate in MJRB remained relatively stable (Figure 5).

3.2.4. LULC Type Spatiotemporal Divergence Drivers

The geographical detector detected single-factor and two-factor interactions in data from 1985 to 2020. The results of the single-factor detection (Table 3) indicate that the selected ten factors significantly drive the spatiotemporal changes of LULC in the MJRB (p < 0.001). While the explanatory power of each factor for LULC spatiotemporal changes varies across different periods, the overall differences are not substantial. Generally, the influence of these factors increases over various stages, although some driving factors weaken in later stages. Precipitation and DEM exhibit the highest explanatory power for LULC spatiotemporal changes, highlighting their significant impact on LULC changes. Railways, highways, and roads show moderate explanatory power, suggesting that LULC changes are influenced by transportation infrastructure to some extent but are not the most significant factors. The weakest explanatory factors are slope, population, GDP, and river, indicating that these factors do not significantly impact land use changes.
The results (Figure 6) of two-factor probing with geodetector show that the combined effects of multiple factors influence the spatiotemporal LULC changes in the MJRB. The interaction between two factors across different periods shows nonlinear or two-factor enhancement, with no independent relationships or weakened interactions observed. It means that the joint effect of any two drivers is more potent than that of a single driver, indicating that the LULC in the research region results from the joint effect of multiple drivers. The highest explanatory power for LULC spatiotemporal changes from 1985 to 2020 occurred between 2015 and 2020, resulting from the interaction between slope and temperature. The interaction between slope and temperature also performed well in other years, demonstrating that their combined effect on LULC changes is greater than the effect of either slope or temperature alone.
The interactions of DEM, slope, and temperature with GDP, population, and roads strongly influence the spatial and temporal changes of the MJRB LULC. In contrast, the interactions of the other factors are relatively weak, which reflects the characteristics of alpine basins.

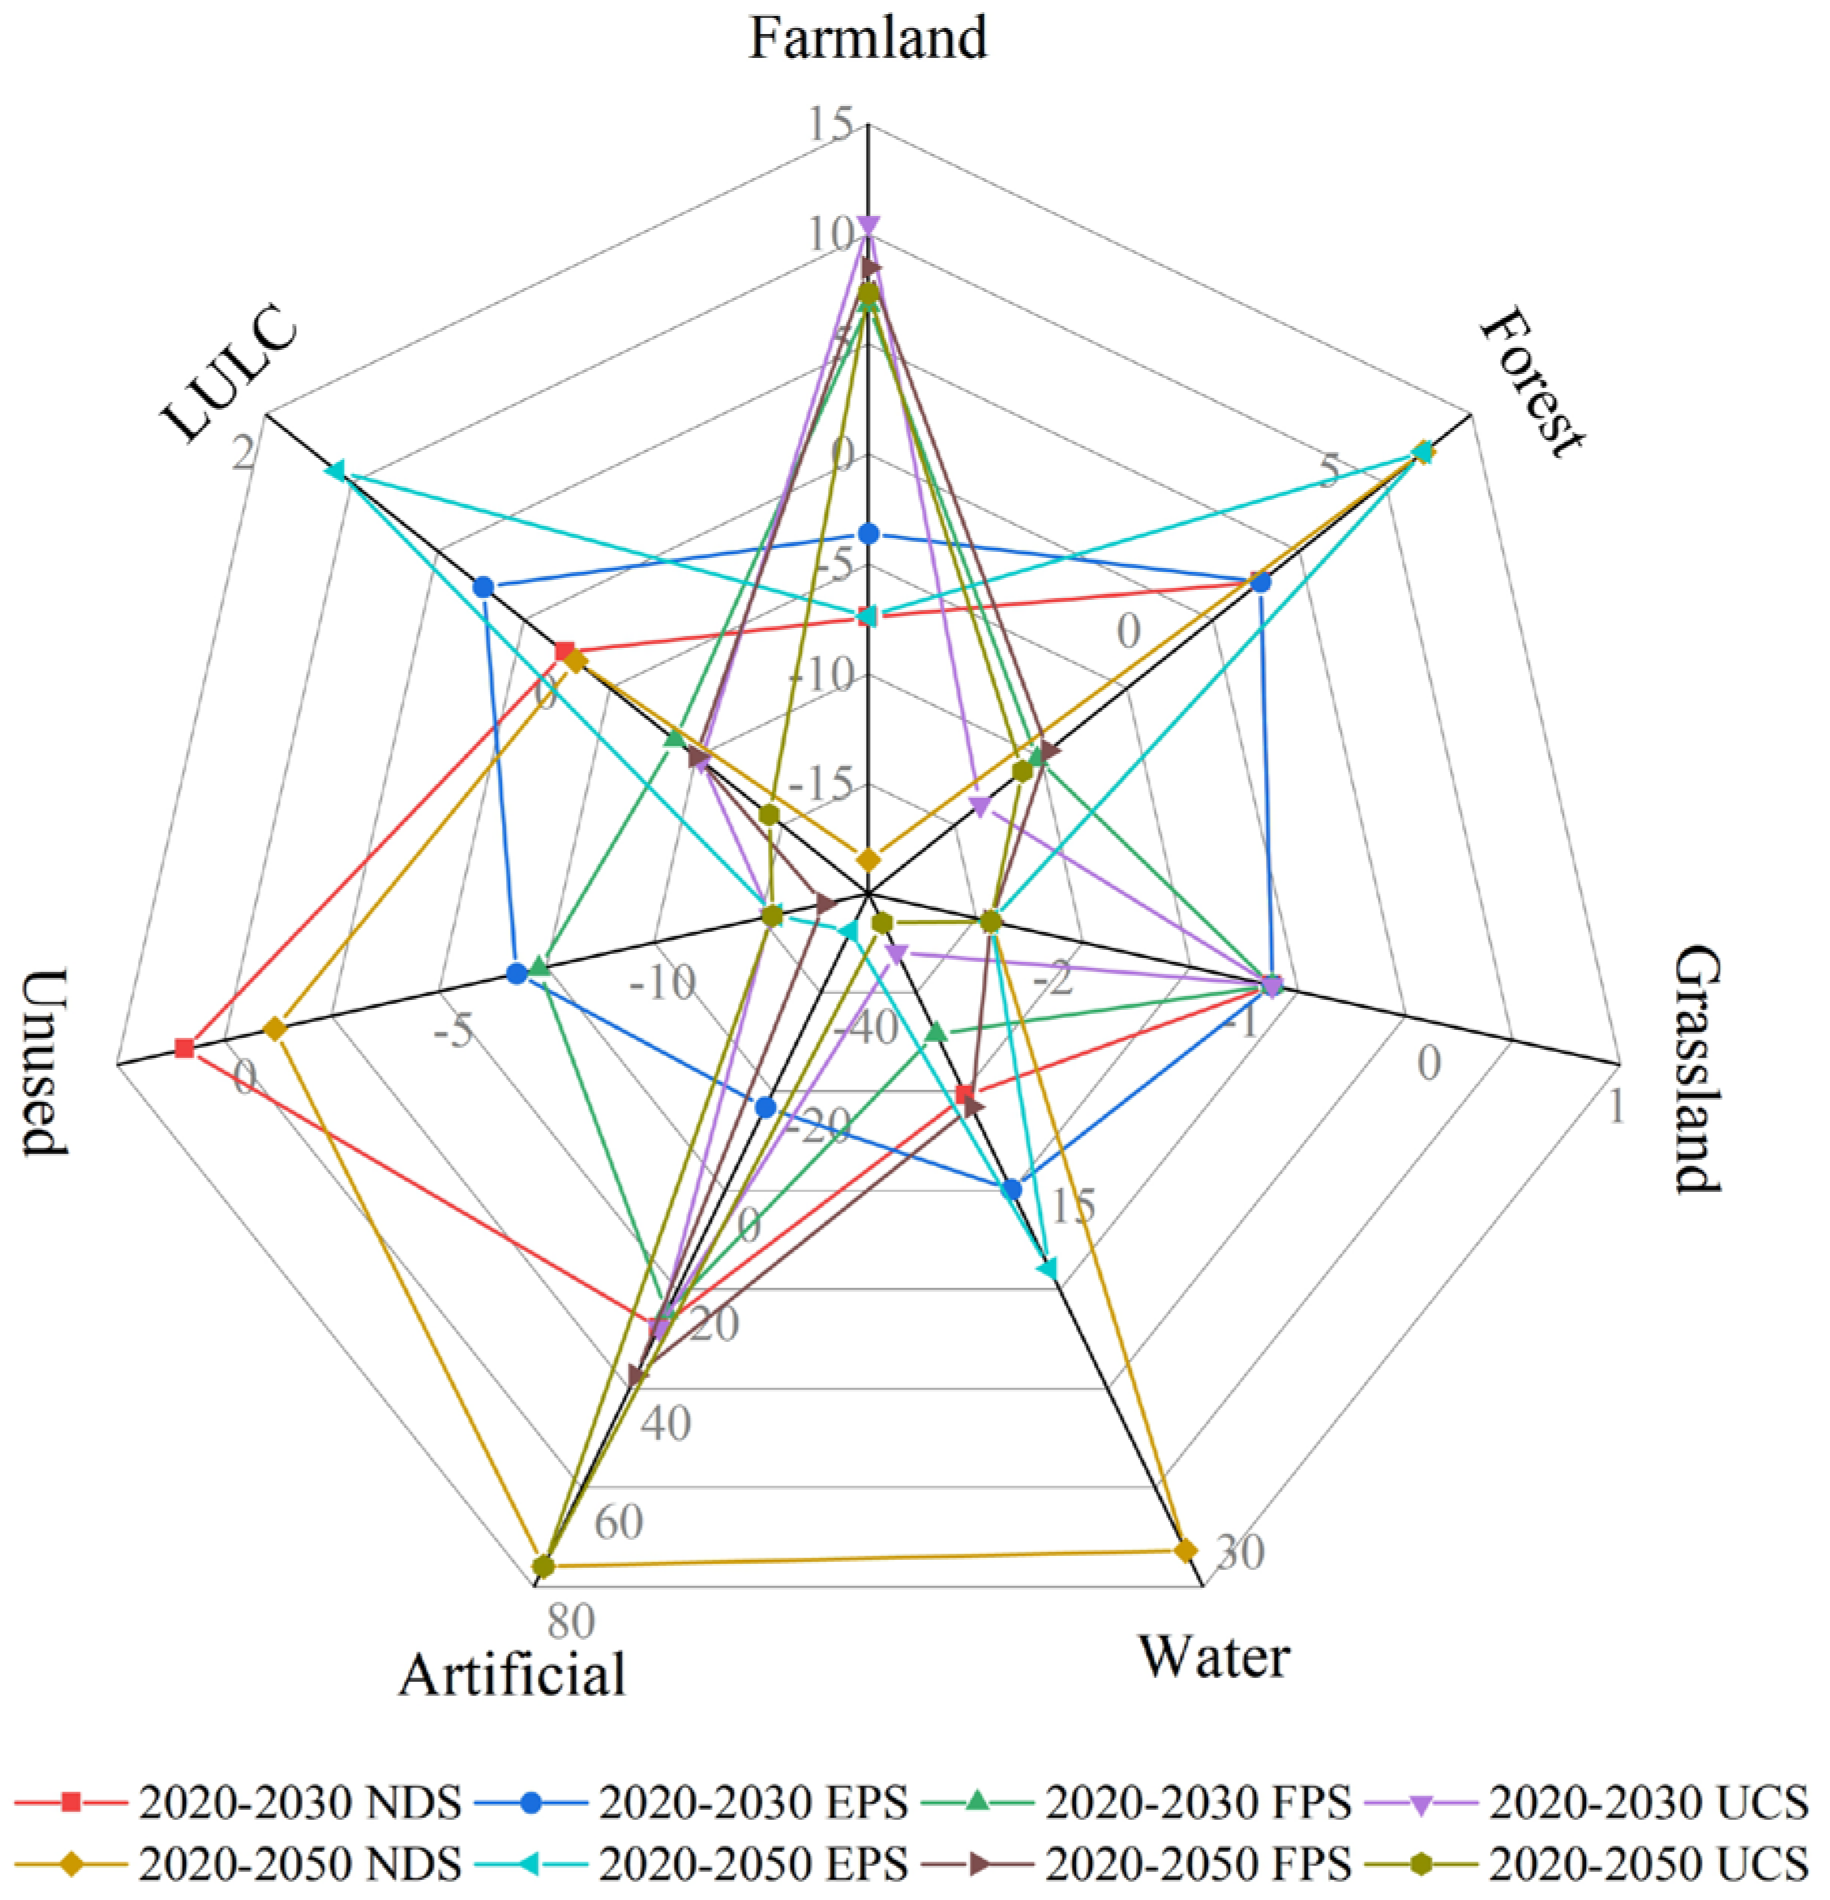
3.3. MJRB Multi-Scenario LULC Simulation from 2020 to 2050

This research utilizes PLUS version 1.4 software to model future land use. Initially, data from 2005 and 2015 were examined to identify expansion in the study area. The Random Forest algorithm was used to sample both expansion and driving factors. The LEAS identified the driving forces behind LULC changes and the development potential of various land categories. Subsequently, CARS was utilized. This model incorporated land category development potential, future land use demand, constraints, land conversion matrices, and neighborhood weights. The actual LULC data from 2005 were used to predict the spatiotemporal distribution of LULC for 2010 and 2020. The model’s reliability was assessed by comparing the predicted data with the exact values. The results indicated that the Kappa coefficients for the two validation datasets were above 88.3%, and the FoM coefficients exceeded 0.434, confirming the reliability of the model’s predictions. Finally, based on the four scenarios’ transition matrices and neighborhood weights, the LULC values for 2030 and 2050 were predicted and tested to meet the required standards. Adjustments to the parameters yielded four scenario-specific LULC datasets that met the criteria. The results are consistent with the predefined transfer matrix and the development scenarios. The multi-scenario LULC simulation process is illustrated in Figure 7b.
The land expansion simulation employed the Random Forest algorithm to process LULC classification data, thoroughly exploring the expansion and driving factors for each LULC category. This method accurately captured the development probabilities of various land categories and the contributions of driving factors to the expansion of each land category during the specified period (Figure 7a). In the expansion algorithm, the land use of T1 and T2 was randomly combined. Preliminary experiments indicated differences in land use combinations across different periods, but these differences did not significantly impact the overall results. The selection of driving factors aimed to include various elements such as topography, climate, economy, and society. Increasing the number of relevant factors was found to help improve the accuracy of the results.
Figure S3 (online) shows several significant features in the LULC scenarios from 2020 to 2030 and 2050. Forestland, grassland, and farmland remain the predominant land use types in the MJRB. With the advancement of urbanization, the area of artificial surfaces increases most rapidly under the UCS model (regions B and D of the UCS column in Figure 8), rising from 1.369% in 2020 to 1.747% in 2030 and reaching 2.407% by 2050. Farmland is better protected under the FPS model (region A of the FPS column in Figure 8), increasing from 18.196% in 2020 to 19.430% in 2030 and projected to reach 19.738% by 2050. During the study period, ecological land declines, particularly grassland, align with the overall trend. As economic development and urbanization accelerate, the expansion of artificial surfaces and farmland encroaches on large forest and grassland areas, leading to declining proportions. Forest increases only under the NDS and EPS models (regions C of the EPS column in Figure 8), reaching 46.251% by 2050, with the increased area mainly originating from farmland and grassland (Figure 8). The increase in forests under the NDS and EPS scenarios suggests a natural trend (region C of the NDS column in Figure 8). The change in forest area is positively correlated with external disturbances, consistent with natural development patterns. Water shows a growth trend under all scenarios, reaching a maximum of 0.917% under the NDS model by 2050. The increase in water area is a positive signal of ecological improvement and is directly related to the MJRB’s water management policies. Unused land shows a declining trend and is projected to reach its lowest value of 1.235% under the FPS model by 2050, down from 1.435% in 2020. Much unused land has been developed into farmland and grassland, consistent with China’s ecological and farmland protection policies.

3.4. Characteristics of Ecological Landscape Pattern Changes

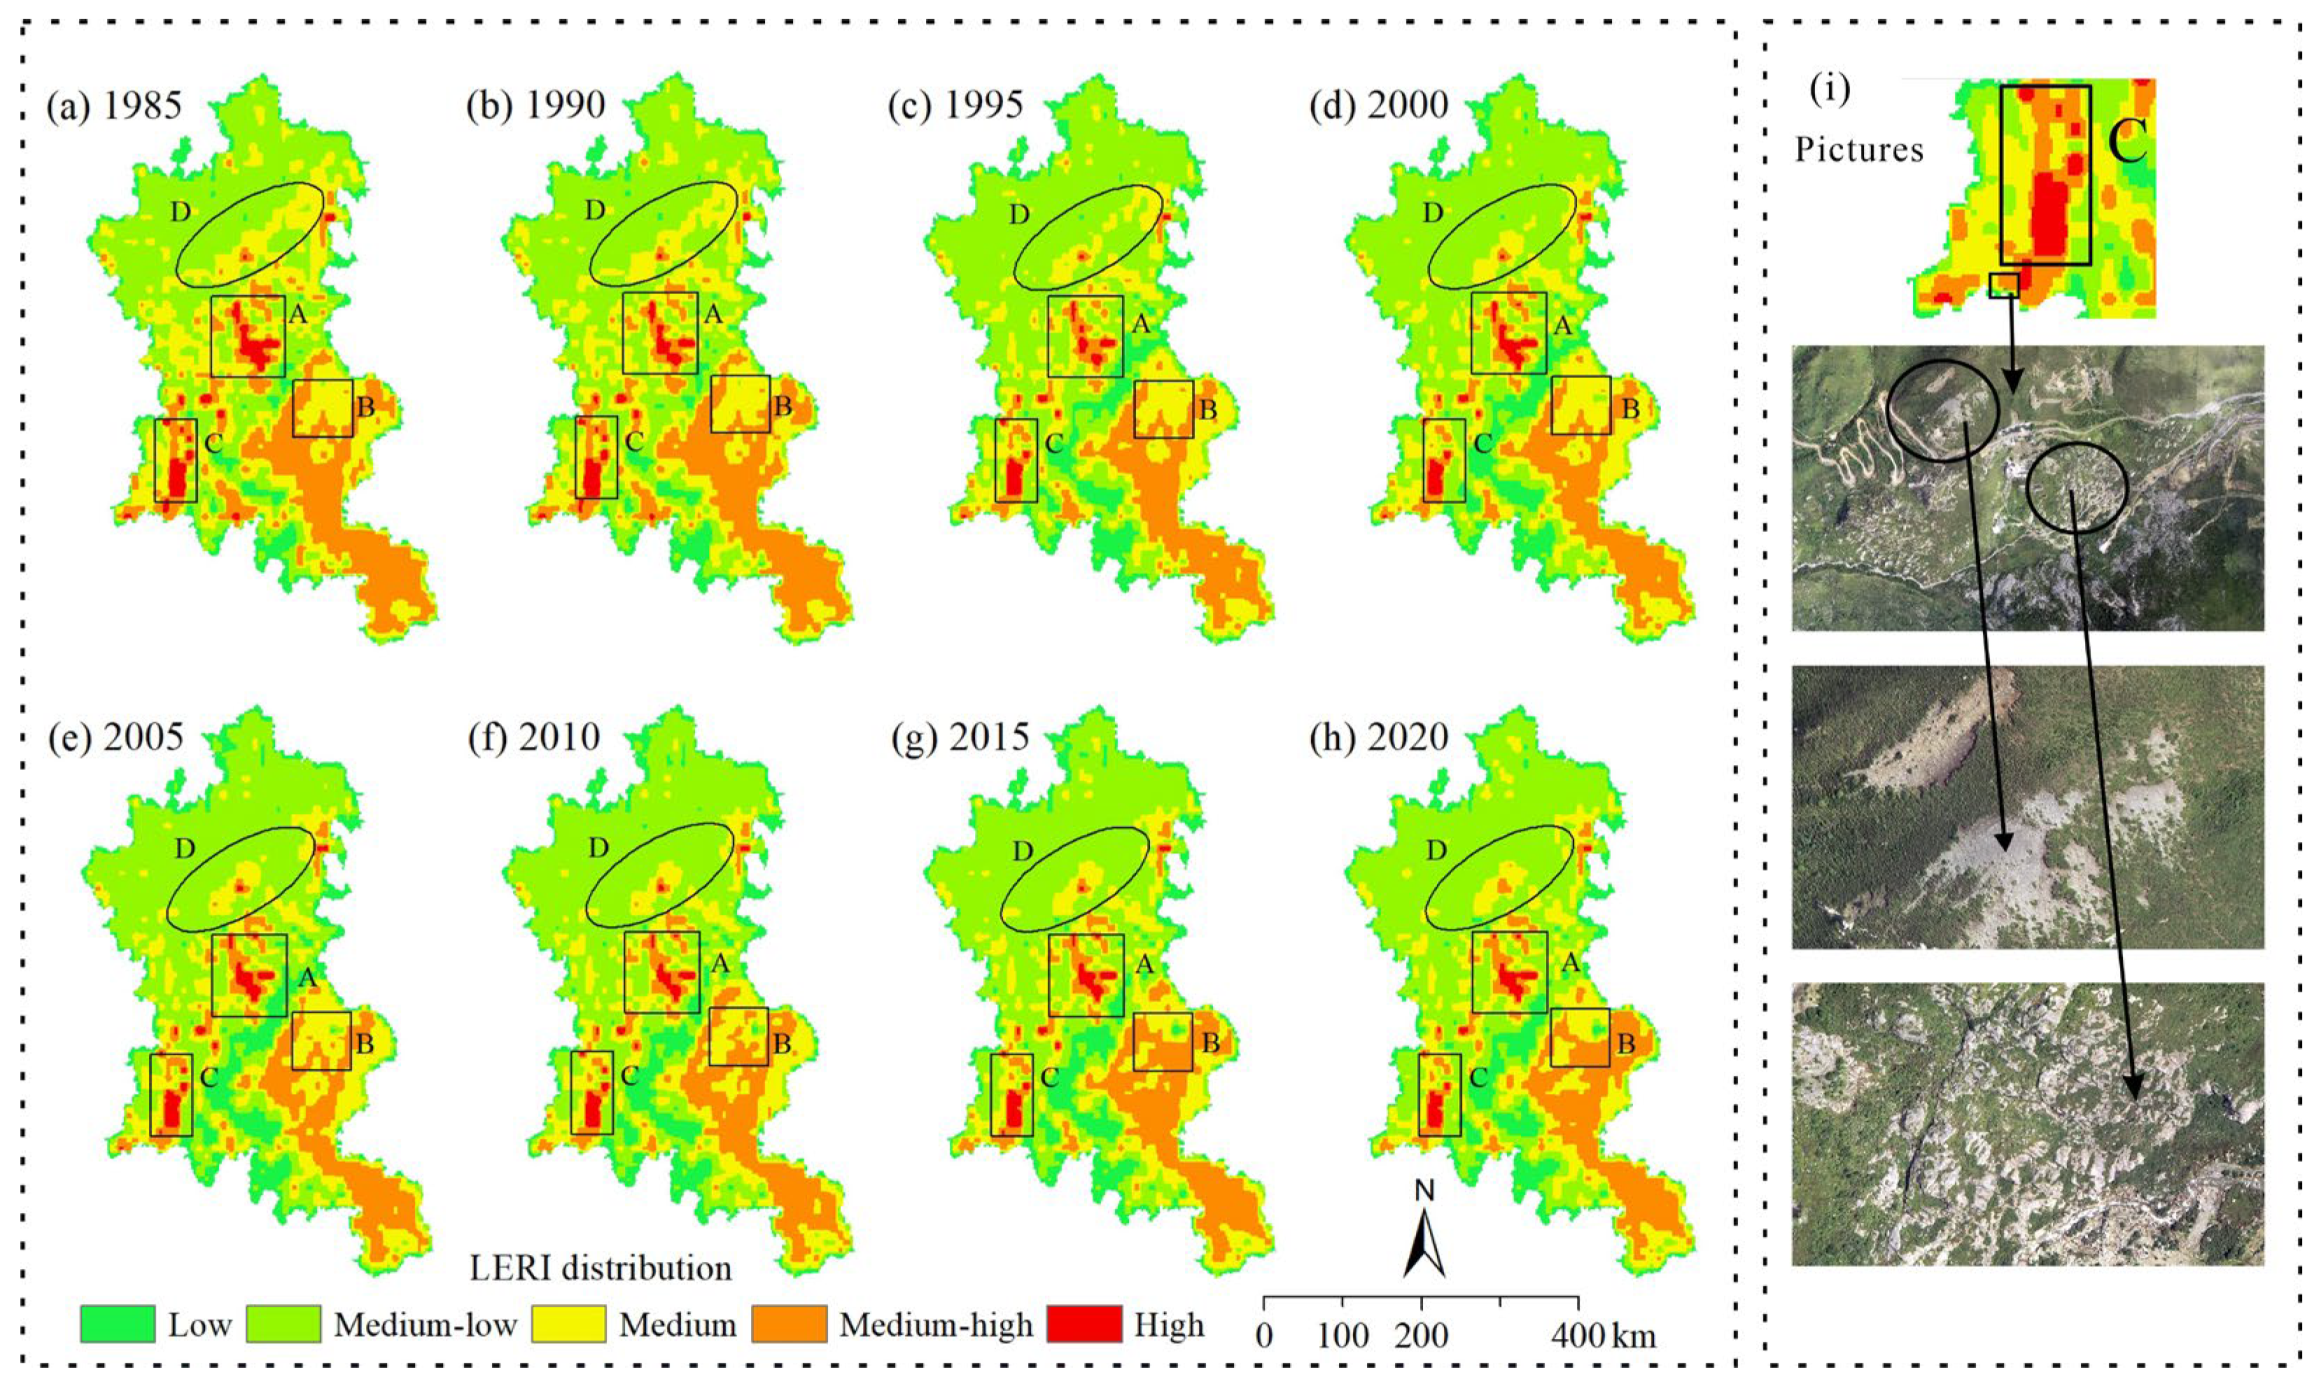
3.4.1. Characterization of Spatial and Temporal Variations in LERI

The overall LERI of the MJRB is low (region A in Figure 9), with medium and high-risk areas primarily distributed in the basin. Significant LERI changes are observed in the Chengdu urban region (region B in Figure 9), but the LERI values in this area have decreased. The decline in LERI in the metro area is attributed to accelerated urbanization, where other land types are converted into stable artificial surfaces, resulting in zones of minimal risk. In the northern sector of the MJRB, a zone with a low LERI is progressively emerging, particularly in the region marked as D in Figure 9. A comparison of imagery and policy documents reveals that in Aba Autonomous Prefecture, located in region D of Figure 9, natural forest cutting has decreased since the 1990s, with a complete ban on natural forest logging starting in September 1998. As shown in Figure 9, since 2000, the LERI in region D has gradually shifted to lower values. Region A of Figure 9 is located between Lixian and Xiaojin counties, where high altitude, harsh natural ecological conditions, and slow vegetation growth result in persistently high LERI. Region C of Figure 9 is situated in the Gongga Mountain Nature Reserve, where most areas are snow-covered year-round, and the surface vegetation primarily consists of alpine meadow (Figure 9i), with some areas exposed to gravel and naturally damaged vegetation, thereby exhibiting high risk.

3.4.2. LERI Spatial Autocorrelation Analysis

The spatial autocorrelation of LERI in the study area was analyzed using Local Moran’s I and Getis-Ord Gi* analyses (Figure 10). The findings show that during the entire study duration, MJRB’s LERI index maintained a significant positive correlation with Local Moran’s I, consistently above 0.51, indicating a spatial positive correlation. The Z-scores ranged between 30 and 32, well above the threshold value 2.58, indicating a highly clustered pattern. Notably, the p-values were all 0, below the minimum significance level of 0.01, suggesting that the observed spatial distribution pattern is highly unlikely to be a random event. Collectively, these indicators confirm that the clustering of LERI within the 99% confidence interval is reliable.
Cold spots in the MJRB are primarily located at the peripheries of the study area. In contrast, hot spots are concentrated in the plains and low hilly basins, with confidence levels decreasing outward. The spatial distribution of clusters and hot/cold spots is generally consistent. Local Moran’s I scatter plots and global spatial autocorrelation methods were used further to verify the spatial correlation of landscape ecological risk. The results (Figure 10A) show that from 1985 to 2020, LERI in MJRB exhibited a significant positive correlation, indicating spatial interdependence. Local Moran’s I showed a trend of increasing and then decreasing from 1985 to 2020, suggesting that with changes in LULC, the spatial heterogeneity and clustering of LERI decreased over time.

3.5. CS Change from 1985 to 2050

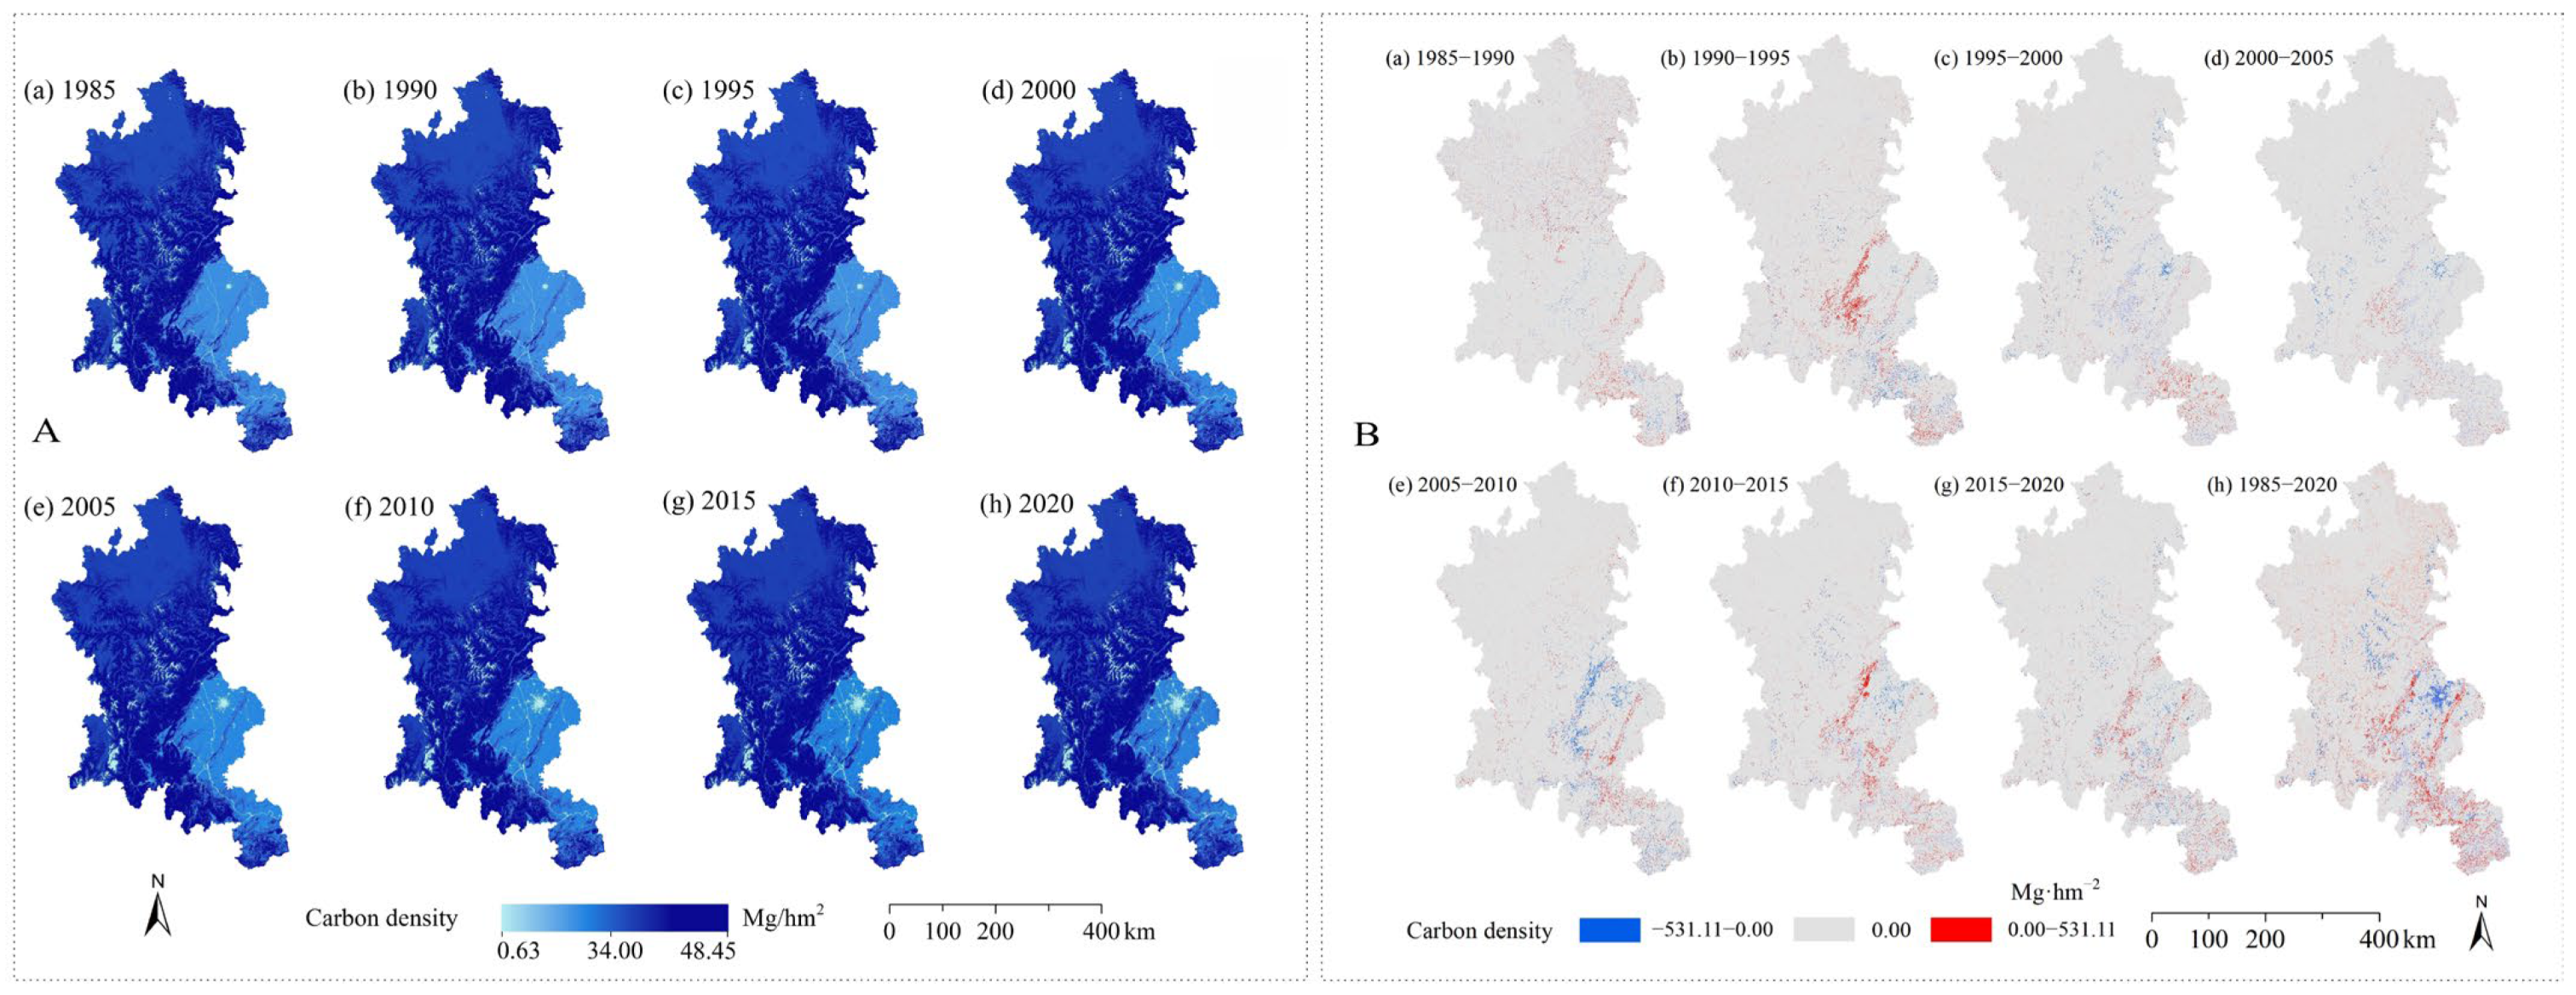
3.5.1. CS Change in MJRB from 1985 to 2020

The InVEST model was used to calculate the carbon storage in the MJRB from 1985 to 2020 (Figure 11A). The spatial distribution pattern of carbon storage in the MJRB did not change significantly over this period. Overall, carbon storage was highest in the central region, followed by the north and south, and lowest in the basin, presenting a spatial distribution pattern characterized by high levels in the west and central areas, lower levels in the east, and moderate levels in the north and south. High carbon storage values were mainly concentrated in the mountainous forest areas at the basin edges. In contrast, low carbon storage values were focused on the basin and surrounding water, areas predominantly consisting of farmland and artificial surfaces.
From 1985 to 2020, the total carbon storage in the MJRB decreased by 0.675%, with a cumulative loss of 51.36 Tg (Table S6 online). Carbon storage losses from farmland and grassland were 127.71 Tg and 147.54 Tg, respectively; the increase in forest area contributed to a gain of 223.35 Tg in carbon storage. Initially, the total carbon storage increased, peaking in 1995, then continuously declined, with a slight upward trend observed in 2020.
The study found that from 1985 to 2020, carbon storage in the MJRB responded significantly to LULC changes (Figure 11A). Carbon storage in farmland exhibited a volatile downward trend, reaching its lowest value in 2020 due to the continuous encroachment on farmland. Forest carbon storage generally increased but experienced a slight decline between 1995 and 2010, consistent with local farmland reclamation policies in Sichuan, which aligned with the concurrent increase in farmland carbon storage. Grassland carbon storage continuously declined due to extensive grassland destruction and a sharp decrease in area. With rapid socio-economic development and accelerated urbanization, the area of artificial surfaces increased rapidly, resulting in a stable rise in carbon storage, nearly tripling from the initial to the final period. Unused land carbon storage showed a volatile upward trend due to the conversion from other land types, leading to an increase in unused land area. Waterbody carbon storage initially rose but then declined, reaching its lowest point in 2020 due to Sichuan’s comprehensive management of small hydropower stations, which gradually reduced reservoir areas (Figure 11B).

3.5.2. MJRB CS Changes from 2020 to 2050

We estimated the carbon storage across various land types for four developmental scenarios projected for 2030 and 2050 (Table S6 online). The impact of future LULC changes on carbon storage varies significantly across various scenarios, although the spatial distribution pattern of carbon storage remains unchanged. Significant changes in carbon storage are concentrated around the basin (Figure S3 online).
Under the NDS scenario, the reduction in farmland in the MJRB leads to the most significant carbon storage loss (Figure 12). By 2030 and 2050, carbon storage is projected to decrease by 7.43% and 18.46% compared to 2020, respectively. In the FPS and UCS scenarios, farmland carbon storage increases significantly due to effective farmland protection measures. Forest carbon storage shows substantial growth, rising by 6.81% by 2050, comparable to the EPS scenario, indicating that forest develops well under both EPS and NDS scenarios. Grassland and unused land exhibit a continuous downward trend, with grassland carbon storage decreasing by 1.51% from 2030 to 2050 as grassland areas continue to be degraded. Conversely, water shows a constant upward trend. From 2030 to 2050, carbon storage on artificial surfaces will rise by 37.93% due to ongoing economic growth and urbanization, contributing to an expansion in these areas and significantly enhancing carbon storage. In the NDS scenario, the overall carbon storage will see a 0.06% reduction by 2050.
Under the EPS scenario, ecological land is well protected, leading to steady increases in carbon storage in forests and water. By 2030 and 2050, carbon storage is projected to increase by 2.75% and 6.81% compared to 2020, respectively. Significant losses are observed in farmland and grassland, with carbon storage decreasing by 1.67% and 3.84% over these periods. The decline in carbon storage on farmlands primarily results from the ecological strategy that transforms farmlands into forests. Artificial surfaces exhibit negative growth for the first time, primarily because many abandoned artificial surfaces are redeveloped into environmental land.
Under the FPS scenario, farmland carbon storage continues to increase, primarily due to implementing national farmland protection policies, which effectively restore farmland areas. Among the four scenarios, only FPS and UCS do not show a reduction in farmland carbon storage. Significant carbon reductions are observed in forest, grassland, and unused land. The reductions in carbon storage in forest and grassland are the largest among all land types, accounting for 1.71% and 2.10% of the total carbon storage in the FPS scenario for 2030 and 2050, respectively.
Under the UCS scenario, carbon storage in artificial surfaces increases further, with a growth rate reaching 76.10% by 2050. The reduction in carbon storage in forest, grassland, and unused land continues to grow, with a 2.43% reduction in total carbon storage under the UCS scenario. Farmland shows the most significant increase in carbon storage in 2030, with a 10.49% increase, while grassland shows the most significant reduction in 2030, with a 4.22% decrease, which later alleviates. Among the four sustainable development scenarios, it is observed that carbon storage in forests increases under the NDS and EPS scenarios. In contrast, the other scenarios exhibit varying degrees of carbon reduction (Figure S4 online). Carbon storage across the MJRB shows high levels centrally and westward, modest amounts to the north and south, and lower levels towards the east, with minimum values focused within the basin (Figure S5 online). The results indicate that implementing ecological protection measures helps enhance terrestrial carbon sequestration in the MJRB.

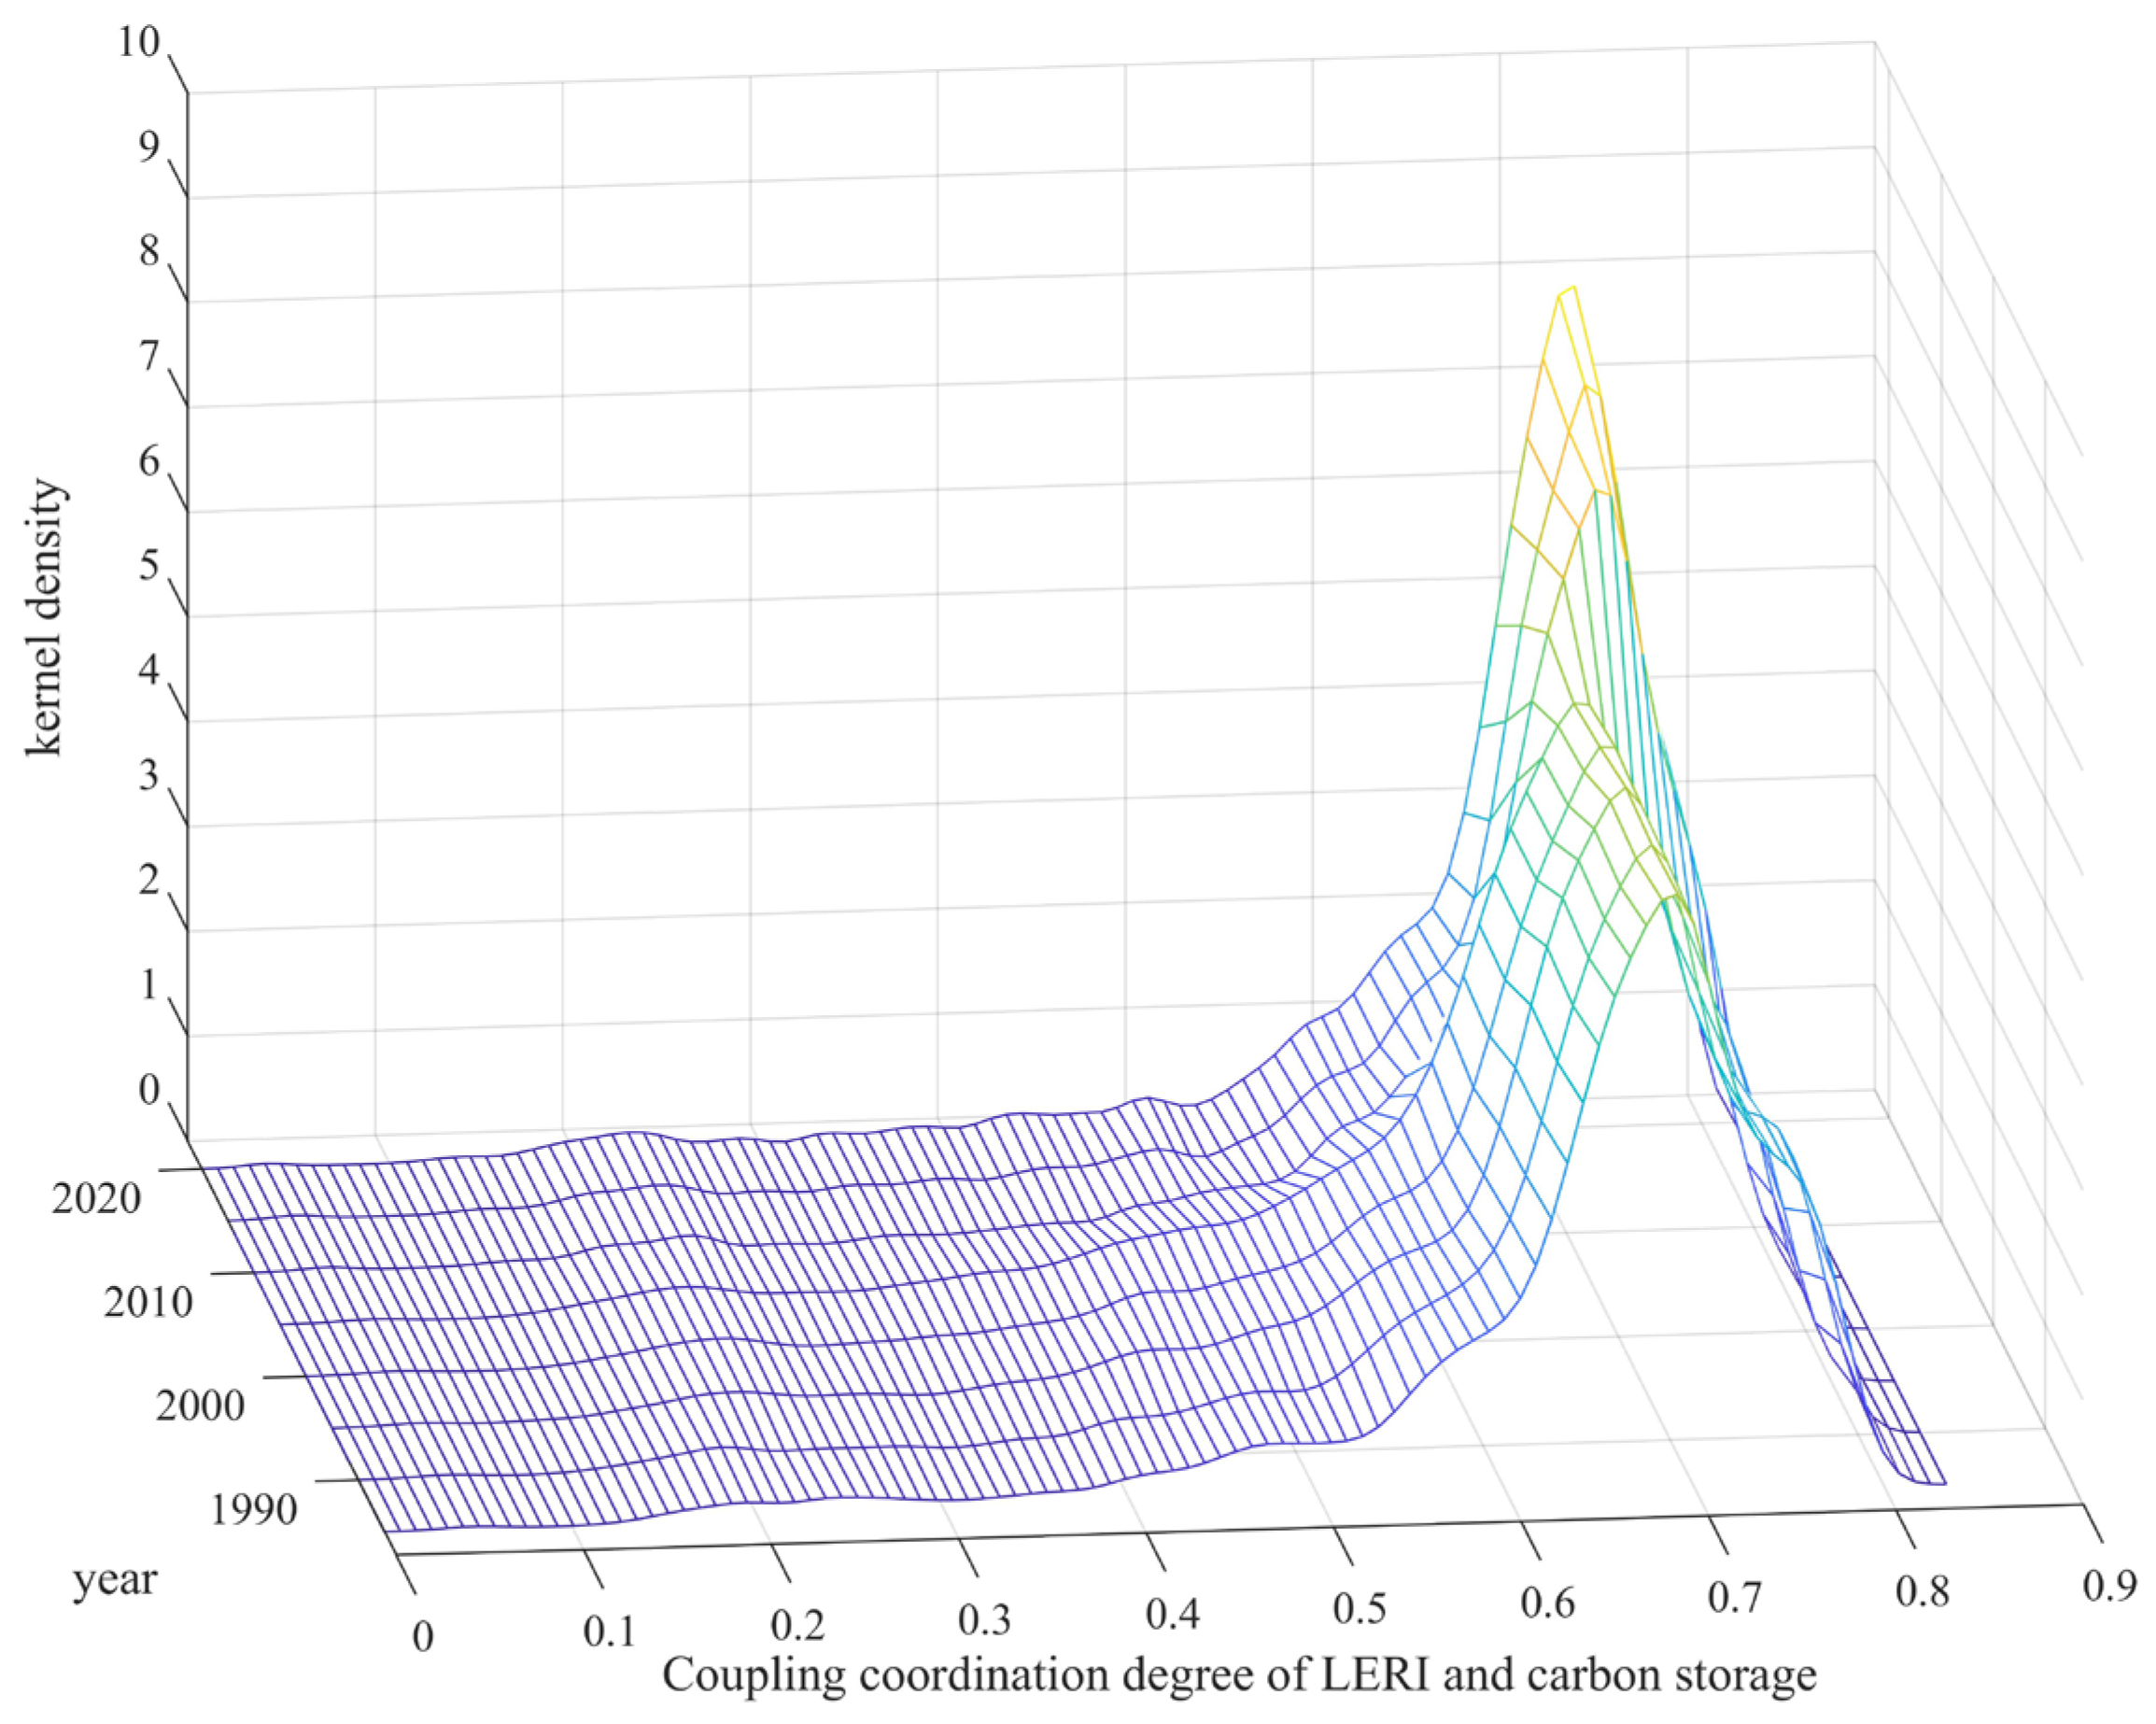
3.6. Degree of Harmonization of LERI and Carbon Storage Coupling

The study revealed significant differences in carbon storage and LERI across different periods in the MJRB. From 1985 to 1995, carbon storage was well distributed, and LERI levels were low. Between 1995 and 2010, carbon storage significantly decreased while LERI levels gradually increased. From 2010 to 2020, LERI fluctuated in high-risk areas, and implementing ecological protection measures led to increased carbon storage. Overall, the LERI risk index has remained high since 1995, indicating a need for further prevention and control measures and planning of the ecological landscape pattern. Carbon storage and LERI in the MJRB exhibit a high coupling correlation (coupling correlation > 0.9), indicating a strong relationship with a significant correlation at the ecological function and feature level. The coordination degree for both exceeds 0.2 across all periods, indicating that carbon storage and LERI in the MJRB maintain a generally consistent development trajectory. However, there is considerable room for optimization. Over the entire period, the coupling coordination degree shows a declining trend, indicating that intensified LULC-type conversion in the MJRB has reduced the interaction between carbon storage and LERI. Since 1995, economic development and construction land have extensively encroached on ecological land, reducing land use intensification and exacerbating ecological landscape disturbance, resulting in a strong response relationship between carbon storage and LERI.
The analysis covered the spatial and temporal trends of coupling coordination between carbon storage and LERI in the MJRB from 1985 to 2020 (Figure 12). Over time, areas with high coupling coordination levels gradually decreased, and the degree of clustering diminished. The stability of the landscape pattern was disrupted, primarily manifested by the fragmentation of contiguous land types into various other land types, with ecological land encroaching upon non-ecological land. This trend was more pronounced in ecologically fragile areas and the basin region.

4. Discussion

4.1. Impacts of LULC Changes on CS

4.1.1. Analysis of LULC Changes

The terrain and climate conditions dictate that the development speed of the basin is far superior to that of mountainous areas, aligning with the land type distribution. The study area has a significantly higher proportion of forest and grassland than the national average, and the proportion of unused land is also higher than in most regions. Significant changes have occurred in certain land types in the MJRB, particularly in artificial surfaces and farmland, as supported by the relevant literature [61,62]. These changes are indicative of rapid economic development and urbanization. Contrasting with the NDS scenario, the EPS scenario demonstrates significant growth in both farmland and ecological land, coupled with a decelerated rate of artificial surface expansion. This further indicates that the expansion of artificial surfaces in the MJRB is at the expense of ecological land and farmland. Notably, the increase and decrease in environmental lands, such as forest and grassland, are similar under both EPS and NDS scenarios, proving that ecological land can develop well without human intervention, consistent with other research findings [63,64].
The study found that from 1985 to 2020, farmland area decreased at an average annual rate of 0.30%. Rapid economic development and urbanization prompted artificial surfaces to acquire land resources from ecological land and farmland at an annual rate of 9.77%, significantly impacting the balance of regional landscape patterns. Based on LULC type conversion, LULC changes from 1985 to 2020 were divided into three stages: the initial evolution stage (1985–1995), the development stage (1995–2010), and the mature stage (2010–2020). In the first stage, the transformed land comprised 6.61% of MJRB’s entire area. Subsequently, the areas converted in the second and third stages represented 6.75% and 5.58% of the total, respectively.
Future LULC scenario simulations show that due to restrictions on certain human activities in the EPS and FPS models, the LULC type conversion rate is lowest in 2030, at 4.7% and 5.0%, respectively. Ecological land has significantly expanded, showcasing the success of environmental protection strategies. In contrast, the conversion rate under the UCS scenario is 7.5%, considerably higher than the NDS scenario’s 5.9%, mainly because the UCS model favors economic development and human activities. Further simulations for the 2050 land use scenarios show that the conversion trends are consistent with those in 2030, validating that the predicted data trends are accurate and conform to development patterns.

4.1.2. CS Response Changes Caused by LULC Dynamics

Changes in LULC types lead to ecosystem alterations, affecting regional carbon emissions and sequestration [65]. When studying the relationship between ecosystems and “dual carbon” goals, LULC type conversions must be considered. Ecological land (forest, grassland, and water) is crucial for carbon sequestration and is a significant carbon sink. In this study, the conversion of farmland, forest, and grassland in the MJRB accounted for more than 90% of the total conversion area. During economic development and urbanization, extensive farmland, unused land, and water were converted into low-carbon-density artificial surfaces, reducing overall carbon storage in the study area. This result aligns with related studies [19,23]. Across the three phases of LULC development (1985–1995, 1995–2010, 2010–2020), the carbon storage within ecological land exhibited a trend of increase, decrease, and subsequent increase. The cumulative changes in carbon storage were 125.24 Tg, −152.47 Tg, and 103.34 Tg, respectively. Significant alterations in carbon storage predominantly occurred within MJRB’s basin regions, where transformations of land types were extensive. The results indicate that regions with intense land type changes experience substantial carbon storage losses [65,66]. Given this situation, it is necessary to plan regional LULC utilization with long-term development in mind, controlling the intensity of LULC changes under development.
Under the four future scenarios, the influence of LULC on carbon storage aligns with earlier periods. Areas with intense land use changes exhibit significant carbon storage changes. In the mid-term (2030) land use scenario, carbon storage under the NDS scenario shows a change of +0.86 Tg, while the EPS scenario exhibits a positive growth of +41.97 Tg, mainly due to a significant increase in high-carbon-density land types and a slowed expansion of low-carbon-density artificial surfaces in the MJRB. Forest and grassland have significant carbon sequestration potential; thus, policies should be formulated to protect ecological land to achieve “dual carbon” goals. Environmental protection policies should guide humans to reduce ecological damage, and an ecological compensation mechanism is a viable option. Such mechanisms can effectively mitigate human activity impacts on ecological land, achieving better carbon sequestration, consistent with the findings of Koh [67]. The FPS scenario shows a carbon storage change of −54.06 Tg, and the UCS scenario shows −67.36 Tg. These scenarios prioritize farmland development and urban construction land under rapid economic growth, neglecting ecological land. Consequently, extensive tracts of environmental and previously idle territories undergo transformation, markedly expanding areas characterized by low carbon density. The long-term (2050) land use scenario further validates future land use trends, confirming the credibility of mid-term simulations. The carbon storage trends in 2050 under the four scenarios are consistent with those in 2030, with more significant changes over 30 years. The study finds that under the NDS scenario, developing six LULC types is unrestricted, leading to continuous carbon storage decline, detrimental to the “dual carbon” goals. Proper planning and policies must constrain LULC development. The EPS scenario shows peak carbon storage increments, further proving that increasing ecological land enhances carbon sequestration [68].

4.2. Impact of LERI on Carbon Storage

Investigating the relationship between landscape ecological risk and carbon storage is crucial for achieving sustainable development and “dual carbon” goals. Previous studies have primarily focused on the impact of land use changes on carbon storage, which presents significant limitations and cannot fully capture overall carbon changes. This study introduces landscape ecological risk by analyzing the relationship between LULC and carbon storage, offering a more comprehensive evaluation of carbon storage changes. Using a modified coupling coordination model, we conducted an in-depth analysis of the relationship between landscape ecological risk and carbon storage.
The kernel density curve in the study area shows an overall backward shift (Figure 13 and Figure 14), indicating an overall increase in the coupling coordination degree between LERI and carbon storage in the MJRB. This suggests that the absolute difference in coupling coordination levels between LERI and carbon storage within the MJRB is expanding. It also reflects that the initial coupling coordination degree between LERI and carbon storage in the MJRB was at a high level, with better development of coupling advantages. The results demonstrate that LERI significantly impacts the coordination of carbon storage, and reducing LERI is crucial for the overall enhancement of carbon storage.
Different levels of LERI exhibit varying correlations with carbon storage. Regions with medium, medium-high, and high LERI are negatively correlated with carbon storage, indicating that natural or human disturbances significantly impact the ecosystem, thereby negatively affecting carbon storage [36]. The natural environment also substantially impacts the ecosystem; for instance, harsh conditions in high-altitude areas cause severe ecological damage, resulting in high-risk LERI and severely hindering carbon sequestration. Conversely, more extensive areas with low LERI indicate better ecological conditions conducive to carbon sequestration. In regions with frequent human activities, the ecosystem is damaged, LERI levels increase, and carbon sequestration is adversely affected. To achieve “dual carbon” goals, the frequency and intensity of human activities in ecological areas should be minimized.

4.3. Limitations and Future Work

This study developed a model to analyze LULC changes, landscape patterns, and carbon storage variations, assessing the impact of land use and landscape patterns on carbon storage across different spatial and temporal scales. However, several limitations exist.
Firstly, utilizing CLCD data along with the CA–Markov model for forecasting failed to consider the impact of policy and socio-economic elements on LULC distribution; Meanwhile, although the predicted LULC considers as many influencing factors as possible, the predicted results are subject to the impression of the model algorithm and various factors in the field, and there is a certain degree of randomness in the results, introducing some uncertainty into the simulation results. Predictive data must integrate the immediate effects of policy directions and socio-economic influences to yield more precise outcomes. Future research should integrate various data sources, particularly high-resolution imagery data.
Secondly, the study area’s complex terrain, ranging from alpine regions to subtropical basins, results in significant differences in carbon density values, necessitating adjustments. The model primarily focused on land type changes when calculating the region’s overall carbon storage, neglecting the differences in the carbon sequestration capacities of various vegetation types. This oversight needs to be revised when calculating carbon storage’s spatial and temporal distribution. Additionally, when examining the relationship between landscape patterns and carbon sequestration, the study did not consider the impact of landscape indices at different risk levels on carbon sequestration, providing only a macro-level analysis. This could lead to inaccuracies in predicting carbon storage trends. Future research should explore the interactions between different land types, landscape patterns, and carbon storage at a micro level.
In addition, we offer several recommendations: first, regional departments should formulate detailed and feasible ecological land protection policies based on land spatial planning to ensure the stability of environmental land; second, they should effectively restore damaged ecological land and other land types; and finally, they should establish a regional environmental network to ensure ecological sustainability and corridor connectivity.

5. Conclusions

This study developed an evaluation framework for carbon storage changes in the MJRB from 1985 to 2020, integrating LULC, carbon storage, and LERI. This comprehensive and objective approach provides a robust method for future ecological risk assessments and carbon sequestration studies. The main conclusions are as follows:
The MJRB experienced significant LULC changes across three stages: initial (1985–1995), developmental (1995–2010), and maturity (2010–2020). Extensive agricultural land was converted to artificial surfaces, resulting in a cumulative carbon storage loss of 51.36 Tg, primarily due to the conversion of farmland and grassland, whereas forests remained the main carbon sink. Spatially, carbon storage in MJRB exhibited a “high in the west, low in the east, moderate in the north and south” pattern. High carbon storage areas were concentrated in the forested edges of the Sichuan Basin, while low values were found at the basin bottom. The most significant loss of carbon storage occurred in the rapidly developing Chengdu urban area, where urban expansion significantly encroached upon surrounding ecological lands.
Future land use predictions for 2030 and 2050 indicate that under the UCS, the area of artificial surfaces increased the fastest, from 1.369% in 2020 to 1.747% in 2030 and 2.407% in 2050. In the FPS, farmland was effectively preserved, ecological land decreased, and the rate of artificial surface expansion slowed. In the EPS and NDS, ecological land was improved significantly. Total carbon storage is projected to increase substantially only under the EPS, while FPS and UCS predict significant decreases, and the NDS moderates the declining trend.
From 1985 to 2020, the LERI remained low overall, with medium to high-risk areas mainly distributed around the basin periphery. The Chengdu urban area showed the most significant reduction in LERI, primarily due to rapid urbanization concentrating artificial surfaces. Coupling coordination analysis revealed a negative correlation between carbon storage and medium-high LERI and a positive correlation with low LERI. Maintaining a low LERI and reducing human disturbance on ecological land benefit ecological carbon sequestration.

Supplementary Materials

The following supporting information can be downloaded at: https://www.mdpi.com/article/10.3390/su16156552/s1. Figure S1: The LERI computational grid in the MJRB study area; Figure S2: Variation LULC types in MJRB from 1985 to 2020; Figure S3: LULC simulation result and land class for different scenarios in 2030 and 2050; Figure S4: Carbon storage changes caused by LULC changes in different scenarios from 2020 to the future; Figure S5: Spatial distribution of carbon storage (changes) in MJRB from 2020 to 2050; Table S1: Landscape pattern indexes and meaning; Table S2: LULC transfer matrix under different scenarios; Table S3: Carbon density of each LULC type in China; Table S4: Statistics of the types of LULC in MJRB from 1985 to 2020; Table S5: LULC transfer matrix of MJRB from 1985 to 2020; Table S6: Carbon storage of MJRB from 1985 to 2050. References [23,69,70,71,72,73,74] are cited in the supplementary materials.

Author Contributions

Conceptualization, X.L. and X.H.; methodology, X.L. and Y.C.; software, X.H.; validation, X.H. and Y.J.; formal analysis, X.H.; investigation, X.H., Y.J. and X.G.; resources, X.L. and Y.C.; data curation, X.H. and X.G.; writing—original draft preparation, X.H.; writing—review and editing, X.L., Y.C. and R.A.; visualization, X.H.; supervision, X.L. and Y.C.; project administration, X.L. and Y.C.; funding acquisition, X.L. and Y.C. All authors have read and agreed to the published version of the manuscript.

Funding

This research was supported by the National Natural Science Foundation of China [Grant No. 42171437, 42261072] and the Scientific Research Fund of Leshan Science and Technology Bureau.

Institutional Review Board Statement

Not applicable.

Informed Consent Statement

Not applicable.

Data Availability Statement

The CLCD dataset is available from https://zenodo.org/records/5816591 (accessed on 20 August 2023); other data will be available upon request.

Conflicts of Interest

The authors declare no conflicts of interest.

Abbreviations

The following abbreviations are used in this manuscript:
LULCLand use/land cover;
MJRBMinjiang River Basin;
NDSNatural Development Scenario;
EPSEcological Preservation Scenario;
FPSFarmland Preservation Scenario;
UCSUrban Construction Scenario;
CSCarbon Storage;
InVESTIntegrated Valuation of Ecosystem Services and Tradeoffs;
PLUSPatch-generating Land-Use Simulation Model;
LER(I)Landscape Ecological Risk (Index);
LEASLand Expansion Analysis Strategy;
CARSCellular Automata model based on the multi-type Random Seeds mechanism.

References

  1. Chen, C.; Lui, H.; Hsieh, C.; Yanagi, T.; Kosugi, N.; Ishii, M.; Gong, G. Deep oceans may acidify faster than anticipated due to global warming. Nat. Clim. Chang. 2017, 7, 890–894. [Google Scholar] [CrossRef]
  2. Samset, B.H.; Zhou, C.; Fuglestvedt, J.S.; Lund, M.T.; Marotzke, J.; Zelinka, M.D. Steady global surface warming from 1973 to 2022 but increased warming rate after 1990. Commun. Earth Environ. 2023, 4, 400. [Google Scholar] [CrossRef]
  3. Crowther, T.W.; Todd-Brown, K.E.O.; Rowe, C.W.; Wieder, W.R.; Carey, J.C.; Machmuller, M.B.; Snoek, B.L.; Fang, S.; Zhou, G.; Allison, S.D.; et al. Quantifying global soil carbon losses in response to warming. Nature 2016, 540, 104–108. [Google Scholar] [CrossRef]
  4. Doetterl, S.; Stevens, A.; Six, J.; Merckx, R.; Van Oost, K.; Casanova Pinto, M.; Casanova-Katny, A.; Munoz, C.; Boudin, M.; Zagal Venegas, E.; et al. Soil carbon storage controlled by interactions between geochemistry and climate. Nat. Geosci. 2015, 8, 780–783. [Google Scholar] [CrossRef]
  5. He, C.; Zhang, D.; Huang, Q.; Zhao, Y. Assessing the potential impacts of urban expansion on regional carbon storage by linking the LUSD-urban and InVEST models. Environ. Model. Softw. 2016, 75, 44–58. [Google Scholar] [CrossRef]
  6. Mengist, W.; Soromessa, T.; Feyisa, G.L. Responses of carbon sequestration service for landscape dynamics in the Kaffa biosphere reserve, southwest Ethiopia. Environ. Impact Assess. Rev. 2023, 98, 106960. [Google Scholar] [CrossRef]
  7. Liu, Q.; Yang, D.; Cao, L.; Anderson, B. Assessment and Prediction of Carbon Storage Based on Land Use/Land Cover Dynamics in the Tropics: A Case Study of Hainan Island, China. Land 2022, 11, 244. [Google Scholar] [CrossRef]
  8. Chowdhury, P.K.R.; Brown, D.G. Modeling the effects of carbon payments and forest owner cooperatives on carbon storage and revenue in Pacific Northwest forestlands. Land Use Policy 2023, 131, 106725. [Google Scholar] [CrossRef]
  9. Stewart, A.J.; Halabisky, M.; Babcock, C.; Butman, D.E.; D’Amore, D.V.; Moskal, L.M. Revealing the hidden carbon in forested wetland soils. Nat. Commun. 2024, 15, 726. [Google Scholar] [CrossRef]
  10. Xia, L.; Lam, S.K.; Wolf, B.; Kiese, R.; Chen, D.; Butterbach-Bahl, K. Trade-offs between soil carbon sequestration and reactive nitrogen losses under straw return in global agroecosystems. Glob. Chang. Biol. 2018, 24, 5919–5932. [Google Scholar] [CrossRef]
  11. Ariluoma, M.; Ottelin, J.; Hautamäki, R.; Tuhkanen, E.-M.; Mänttäri, M. Carbon sequestration and storage potential of urban green in residential yards: A case study from Helsinki. Urban For. Urban Green. 2021, 57, 126939. [Google Scholar] [CrossRef]
  12. Xu, D.; Sun, H.; Wang, J.; Wang, N.; Zuo, Y.; Mosa, A.A.; Yin, X. Global trends and current advances regarding greenhouse gases in constructed wetlands: A bibliometric-based quantitative review over the last 40 years. Ecol. Eng. 2023, 193, 107018. [Google Scholar] [CrossRef]
  13. Houghton, R.A.; Skole, D.L.; Nobre, C.A.; Hackler, J.L.; Lawrence, K.T.; Chomentowski, W.H. Annual fluxes of carbon from deforestation and regrowth in the Brazilian Amazon. Nature 2000, 403, 301–304. [Google Scholar] [CrossRef]
  14. Levy, P.E.; Friend, A.D.; White, A.; Cannell, M.G.R. The Influence of Land Use Change On Global-Scale Fluxes of Carbon from Terrestrial Ecosystems. Clim. Chang. 2004, 67, 185–209. [Google Scholar] [CrossRef]
  15. Li, Y.; Cao, Z.; Long, H.; Liu, Y.; Li, W. Dynamic analysis of ecological environment combined with land cover and NDVI changes and implications for sustainable urban–rural development: The case of Mu Us Sandy Land, China. J. Clean. Prod. 2017, 142, 697–715. [Google Scholar] [CrossRef]
  16. Wang, C.; Jiang, Q.; Shao, Y.; Sun, S.; Xiao, L.; Guo, J. Ecological environment assessment based on land use simulation: A case study in the Heihe River Basin. Sci. Total Environ. 2019, 697, 133928. [Google Scholar] [CrossRef] [PubMed]
  17. Kuittinen, M.; Moinel, C.; Adalgeirsdottir, K. Carbon sequestration through urban ecosystem services: A case study from Finland. Sci. Total Environ. 2016, 563–564, 623–632. [Google Scholar] [CrossRef]
  18. Yang, D.; Zhu, C.; Li, J.; Li, Y.; Zhang, X.; Yang, C.; Chu, S. Exploring the supply and demand imbalance of carbon and carbon-related ecosystem services for dual-carbon goal ecological management in the Huaihe River Ecological Economic Belt. Sci. Total Environ. 2024, 912, 169169. [Google Scholar] [CrossRef]
  19. Waleed, M.; Sajjad, M.; Shazil, M.S. Urbanization-led land cover change impacts terrestrial carbon storage capacity: A high-resolution remote sensing-based nation-wide assessment in Pakistan (1990–2020). Environ. Impact Assess. Rev. 2024, 105, 107396. [Google Scholar] [CrossRef]
  20. Liang, X.; Guan, Q.; Clarke, K.C.; Liu, S.; Wang, B.; Yao, Y. Understanding the drivers of sustainable land expansion using a patch-generating land use simulation (PLUS) model: A case study in Wuhan, China. Comput. Environ. Urban Syst. 2021, 85, 101569. [Google Scholar] [CrossRef]
  21. Nichols, J.E.; Peteet, D.M. Rapid expansion of northern peatlands and doubled estimate of carbon storage. Nat. Geosci. 2019, 12, 917–921. [Google Scholar] [CrossRef]
  22. De Vos, B.; Cools, N.; Ilvesniemi, H.; Vesterdal, L.; Vanguelova, E.; Carnicelli, S. Benchmark values for forest soil carbon stocks in Europe: Results from a large scale forest soil survey. Geoderma 2015, 251–252, 33–46. [Google Scholar] [CrossRef]
  23. Wu, F.; Wang, Z. Assessing the impact of urban land expansion on ecosystem carbon storage: A case study of the Changzhutan metropolitan area, China. Ecol. Indic. 2023, 154, 110688. [Google Scholar] [CrossRef]
  24. Gao, L.; Tao, F.; Liu, R.; Wang, Z.; Leng, H.; Zhou, T. Multi-scenario simulation and ecological risk analysis of land use based on the PLUS model: A case study of Nanjing. Sustain. Cities Soc. 2022, 85, 104055. [Google Scholar] [CrossRef]
  25. Wang, Z.; Zeng, J.; Chen, W. Impact of urban expansion on carbon storage under multi-scenario simulations in Wuhan, China. Environ. Sci. Pollut. Res. 2022, 29, 45507–45526. [Google Scholar] [CrossRef] [PubMed]
  26. Halmy, M.W.A.; Gessler, P.E.; Hicke, J.A.; Salem, B.B. Land use/land cover change detection and prediction in the north-western coastal desert of Egypt using Markov-CA. Appl. Geogr. 2015, 63, 101–112. [Google Scholar] [CrossRef]
  27. Cao, M.; Tian, Y.; Wu, K.; Chen, M.; Chen, Y.; Hu, X.; Sun, Z.; Zuo, L.; Lin, J.; Luo, L.; et al. Future land-use change and its impact on terrestrial ecosystem carbon pool evolution along the Silk Road under SDG scenarios. Sci. Bull. 2023, 68, 740–749. [Google Scholar] [CrossRef]
  28. Zhao, M.; He, Z.; Du, J.; Chen, L.; Lin, P.; Fang, S. Assessing the effects of ecological engineering on carbon storage by linking the CA-Markov and InVEST models. Ecol. Indic. 2019, 98, 29–38. [Google Scholar] [CrossRef]
  29. Gao, Z.; Liu, J.; Cao, M.; Li, K.; Tao, B. Impacts of land-use and climate changes on ecosystem productivity and carbon cycle in the cropping-grazing transitional zone in China. Sci. China Ser. D Earth Sci. 2005, 48, 1479–1491. [Google Scholar] [CrossRef]
  30. Liu, X.; Li, S.; Wang, S.; Bian, Z.; Zhou, W.; Wang, C. Effects of farmland landscape pattern on spatial distribution of soil organic carbon in Lower Liaohe Plain of northeastern China. Ecol. Indic. 2022, 145, 109652. [Google Scholar] [CrossRef]
  31. Shi, N.; Yu, Y.; Liang, S.; Ren, Y.; Liu, M. Effects of urban green spaces landscape pattern on carbon sink among urban ecological function areas at the appropriate scale: A case study in Xi’an. Ecol. Indic. 2024, 158, 111427. [Google Scholar] [CrossRef]
  32. Jiang, Y.; Ouyang, B.; Yan, Z. The Response of Carbon Storage to Multi-Objective Land Use/Cover Spatial Optimization and Vulnerability Assessment. Sustainability 2024, 16, 2235. [Google Scholar] [CrossRef]
  33. Shu, H.; Xiong, P.-P. Reallocation planning of urban industrial land for structure optimization and emission reduction: A practical analysis of urban agglomeration in China’s Yangtze River Delta. Land Use Policy 2019, 81, 604–623. [Google Scholar] [CrossRef]
  34. Shi, K.; Xu, T.; Li, Y.; Chen, Z.; Gong, W.; Wu, J.; Yu, B. Effects of urban forms on CO2 emissions in China from a multi-perspective analysis. J. Environ. Manag. 2020, 262, 110300. [Google Scholar] [CrossRef] [PubMed]
  35. Cui, L.; Zhao, Y.; Liu, J.; Han, L.; Ao, Y.; Yin, S. Landscape ecological risk assessment in Qinling Mountain. Geol. J. 2018, 53, 342–351. [Google Scholar] [CrossRef]
  36. Qu, C.; Li, W.; Xu, J.; Shi, S. Blackland Conservation and Utilization, Carbon Storage and Ecological Risk in Green Space: A Case Study from Heilongjiang Province in China. Int. J. Environ. Res. Public Health 2023, 20, 3154. [Google Scholar] [CrossRef] [PubMed]
  37. Zhang, J.; Zhang, P.; Wang, R.; Liu, Y.; Lu, S. Identifying the coupling coordination relationship between urbanization and forest ecological security and its impact mechanism: Case study of the Yangtze River Economic Belt, China. J. Environ. Manag. 2023, 342, 118327. [Google Scholar] [CrossRef] [PubMed]
  38. Pan, Z.; Gao, G.; Fu, B. Spatiotemporal changes and driving forces of ecosystem vulnerability in the Yangtze River Basin, China: Quantification using habitat-structure-function framework. Sci. Total Environ. 2022, 835, 155494. [Google Scholar] [CrossRef]
  39. Zhang, S.; Yang, P.; Xia, J.; Qi, K.; Wang, W.; Cai, W.; Chen, N. Research and Analysis of Ecological Environment Quality in the Middle Reaches of the Yangtze River Basin between 2000 and 2019. Remote Sens. 2021, 13, 4475. [Google Scholar] [CrossRef]
  40. Yang, J.; Huang, X. The 30 m annual land cover dataset and its dynamics in China from 1990 to 2019. Earth Syst. Sci. Data 2021, 13, 3907–3925. [Google Scholar] [CrossRef]
  41. Huang, D.; Huang, J.; Liu, T. Delimiting urban growth boundaries using the CLUE-S model with village administrative boundaries. Land Use Policy 2019, 82, 422–435. [Google Scholar] [CrossRef]
  42. Li, L.; Huang, X.; Yang, H. A new framework for identifying ecological conservation and restoration areas to enhance carbon storage. Ecol. Indic. 2023, 154, 110523. [Google Scholar] [CrossRef]
  43. Lin, W.; Sun, Y.; Nijhuis, S.; Wang, Z. Scenario-based flood risk assessment for urbanizing deltas using future land-use simulation (FLUS): Guangzhou Metropolitan Area as a case study. Sci. Total Environ. 2020, 739, 139899. [Google Scholar] [CrossRef] [PubMed]
  44. Perica, S.; Foufoula Georgiou, E. Model for multiscale disaggregation of spatial rainfall based on coupling meteorological and scaling descriptions. J. Geophys. Res. Atmos. 1996, 101, 26347–26361. [Google Scholar] [CrossRef]
  45. Pontius, R.G.; Boersma, W.; Castella, J.-C.; Clarke, K.; de Nijs, T.; Dietzel, C.; Duan, Z.; Fotsing, E.; Goldstein, N.; Kok, K.; et al. Comparing the input, output, and validation maps for several models of land change. Ann. Reg. Sci. 2008, 42, 11–37. [Google Scholar] [CrossRef]
  46. Huang, C.; Zhao, D.; Deng, L. Landscape pattern simulation for ecosystem service value regulation of Three Gorges Reservoir Area, China. Environ. Impact Assess. Rev. 2022, 95, 106798. [Google Scholar] [CrossRef]
  47. Zhang, Z.; Gong, J.; Plaza, A.; Yang, J.; Li, J.; Tao, X.; Wu, Z.; Li, S. Long-term assessment of ecological risk dynamics in Wuhan, China: Multi-perspective spatiotemporal variation analysis. Environ. Impact Assess. Rev. 2024, 105, 107372. [Google Scholar] [CrossRef]
  48. Zhang, W.; Chang, W.J.; Zhu, Z.C.; Hui, Z. Landscape ecological risk assessment of Chinese coastal cities based on land use change. Appl. Geogr. 2020, 117, 102174. [Google Scholar] [CrossRef]
  49. Wang, J.; Zhang, T.; Fu, B. A measure of spatial stratified heterogeneity. Ecol. Indic. 2016, 67, 250–256. [Google Scholar] [CrossRef]
  50. Jin, F.; Lee, L. On the bootstrap for Moran’s I test for spatial dependence. J. Econom. 2015, 184, 295–314. [Google Scholar] [CrossRef]
  51. Lai, L.; Huang, X.; Yang, H.; Chuai, X.; Zhang, M.; Zhong, T.; Chen, Z.; Chen, Y.; Wang, X.; Thompson, J.R. Carbon emissions from land-use change and management in China between 1990 and 2010. Sci. Adv. 2016, 2, e1601063. [Google Scholar] [CrossRef]
  52. Zhou, J.; Zhao, Y.; Huang, P.; Zhao, X.; Feng, W.; Li, Q.; Xue, D.; Dou, J.; Shi, W.; Wei, W.; et al. Impacts of ecological restoration projects on the ecosystem carbon storage of inland river basin in arid area, China. Ecol. Indic. 2020, 118, 106803. [Google Scholar] [CrossRef]
  53. Giardina, C.P.; Ryan, M.G. Evidence that decomposition rates of organic carbon in mineral soil do not vary with temperature. Nature 2000, 404, 858–861. [Google Scholar] [CrossRef]
  54. Raich, J.W.; Nadelhoffer, K.J. Belowground Carbon Allocation in Forest Ecosystems: Global Trends. Ecology 1989, 70, 1346–1354. [Google Scholar] [CrossRef]
  55. Alam, S.A.; Starr, M.; Clark, B.J.F. Tree biomass and soil organic carbon densities across the Sudanese woodland savannah: A regional carbon sequestration study. J. Arid. Environ. 2013, 89, 67–76. [Google Scholar] [CrossRef]
  56. Wang, S.; Kong, W.; Ren, L.; Zhi, D.; Dai, B. Research on misuses and modification of coupling coordination degree model in China. J. Nat. Resour. 2021, 36, 793–810. [Google Scholar] [CrossRef]
  57. Da Cunha, E.; Walter, F.; Smail, I.; Swinbank, A.; Simpson, J.; Decarli, R.; Hodge, J.; Weiss, A.; van der Werf, P.; Bertoldi, F.; et al. An alma survey of sub-millimeter galaxies in the extended chandra deep field south: Physical properties derived from ultraviolet-to-radio modeling. Astrophys. J. 2015, 806, 110. [Google Scholar] [CrossRef]
  58. Mansour, S.; Al-Belushi, M.; Al-Awadhi, T. Monitoring land use and land cover changes in the mountainous cities of Oman using GIS and CA-Markov modelling techniques. Land Use Policy 2020, 91, 104414. [Google Scholar] [CrossRef]
  59. Han, J.; Hu, Z.; Wang, P.; Yan, Z.; Li, G.; Zhang, Y.; Zhou, T. Spatio-temporal evolution and optimization analysis of ecosystem service value—A case study of coal resource-based city group in Shandong, China. J. Clean. Prod. 2022, 363, 132602. [Google Scholar] [CrossRef]
  60. Wang, Q.; Guan, Q.; Sun, Y.; Du, Q.; Xiao, X.; Luo, H.; Zhang, J.; Mi, J. Simulation of future land use/cover change (LUCC) in typical watersheds of arid regions under multiple scenarios. J. Environ. Manag. 2023, 335, 117543. [Google Scholar] [CrossRef]
  61. Wang, Z.; Ou, L.; Chen, M. Evolution characteristics, drivers and trends of rural residential land in mountainous economic circle: A case study of Chengdu-Chongqing area, China. Ecol. Indic. 2023, 154, 110585. [Google Scholar] [CrossRef]
  62. Li, W.; Xiang, M.; Duan, L.; Liu, Y.; Yang, X.; Mei, H.; Wei, Y.; Zhang, J.; Deng, L. Simulation of land utilization change and ecosystem service value evolution in Tibetan area of Sichuan Province. Alex. Eng. J. 2023, 70, 13–23. [Google Scholar] [CrossRef]
  63. Li, Q.; Shi, X.; Wu, Q. Effects of protection and restoration on reducing ecological vulnerability. Sci. Total Environ. 2021, 761, 143180. [Google Scholar] [CrossRef]
  64. Troupin, D.; Carmel, Y. Landscape patterns of development under two alternative scenarios: Implications for conservation. Land Use Policy 2016, 54, 221–234. [Google Scholar] [CrossRef]
  65. Carter Berry, Z.; Jones, K.W.; Gomez Aguilar, L.R.; Congalton, R.G.; Holwerda, F.; Kolka, R.; Looker, N.; Lopez Ramirez, S.M.; Manson, R.; Mayer, A.; et al. Evaluating ecosystem service trade-offs along a land-use intensification gradient in central Veracruz, Mexico. Ecosyst. Serv. 2020, 45, 101181. [Google Scholar] [CrossRef]
  66. Sahle, M.; Saito, O.; Fürst, C.; Yeshitela, K. Quantification and mapping of the supply of and demand for carbon storage and sequestration service in woody biomass and soil to mitigate climate change in the socio-ecological environment. Sci. Total Environ. 2018, 624, 342–354. [Google Scholar] [CrossRef]
  67. Koh, N.S.; Hahn, T.; Ituarte-Lima, C. Safeguards for enhancing ecological compensation in Sweden. Land Use Policy 2017, 64, 186–199. [Google Scholar] [CrossRef]
  68. Zhu, L.; Song, R.; Sun, S.; Li, Y.; Hu, K. Land use/land cover change and its impact on ecosystem carbon storage in coastal areas of China from 1980 to 2050. Ecol. Indic. 2022, 142, 109178. [Google Scholar] [CrossRef]
  69. Fang, J.; Liu, G.; Xu, S. Biomass and net production of forest vegetation in China. Acta Ecol. Sin. 1996, 16, 497. [Google Scholar]
  70. Li, K.; Wang, S.; Cao, M. Vegetation and soil carbon storage in China. Sci. China (Earth Sci.) 2004, 47, 49–57. [Google Scholar] [CrossRef]
  71. Xie, X.; Sun, B.; Zhou, H. Estimation and spatial distribution of soil organic carbon density and storage in China. Acta Pedol. Sin. 2004, 41, 35–43. [Google Scholar]
  72. Zhang, G.; Liu, S.; Zhang, Y.; Miao, N.; Wang, H. Aboveground biomass dynamics of subalpine old-growth forest in the upper reach of the Minjiang River. Acta Ecol. Sin. 2008, 28, 3176–3184. [Google Scholar] [CrossRef]
  73. Xu, L.; Yu, G.; He, N.; Wang, Q.; Gao, Y.; Wen, D.; Li, S.; Niu, S.; Ge, J. Carbon storage in China’s terrestrial ecosystems: A synthesis. Sci. Rep. 2018, 8, 2806. [Google Scholar] [CrossRef]
  74. Xu, L.; He, N.; Yu, G. A Dataset of Carbon Density in Chinese Terrestrial Ecosystems (2010s). 2018. Available online: https://www.scidb.cn/en/detail?dataSetId=633694461066477570 (accessed on 22 June 2024).
Figure 1. The location (a) and DEM map (b) of the Minjiang River Basin in the study area.
Sustainability 16 06552 g001
Figure 2. Technology roadmap for carbon storage research framework considering LULC and landscape patterns.
Sustainability 16 06552 g002
Figure 3. LULC dynamics in MJRB from 1985 to 2020. (A): Chord diagram of LULC type flows. (B): Trend diagram. “I_” represents the initial stage, “F_” represents the final stage.
Sustainability 16 06552 g003
Figure 4. Spatial distribution of LULC types in MJRB from 1985 to 2020 (A, B, C, and D are the four different positions in the figure; (ah) are LULC distribution maps at different times).
Sustainability 16 06552 g004
Figure 5. Dynamic degree of land use in MJRB from 1985 to 2020 (T1: 1985–1990, T2: 1990–1995, T3: 1995–2000, T4: 2000–2005, T5: 2005–2010, T6: 2010–2015, T7: 2015–2020, (a) Single land use dynamic degree, (b) Integrated land use dynamic degree).
Sustainability 16 06552 g005
Figure 6. Two-factor interactive results for the drivers of change in MJRB LULC from 1985 to 2020.
Sustainability 16 06552 g006
Figure 7. Multi-scenario LULC simulation flowchart. (a): Random Forest-based site expansion algorithm flow. (b): Multi-scenario LULC site simulation flow.
Sustainability 16 06552 g007
Figure 8. Results of landform changes under the four scenarios in 2023 and 2050. Note: The horizontal axes of 2020, 2030, and 2050 denote the years, and the vertical axes of NDS, EPS, FPS, and UCS denote the four development scenarios in 2030 and 2050, respectively; A is the local of Wenchuan County; B is the local of the Chengdu metropolitan area; C is the local of Longquan mountain range; D is the local of Meishan and Leshan urban agglomerations. Regions A, B, C, and D will change significantly in the four future development scenarios.
Sustainability 16 06552 g008
Figure 9. LERI changes. Note: (ah) show the LERI change from 1985 to 2020; (i) shows the site mapping of unmanned aerial vehicle imagery in high-altitude areas (taken by the team in July 2022). A, B, C, and D represent 4 different positions on the figure.
Sustainability 16 06552 g009
Figure 10. Changes in spatial autocorrelation of LERI in MJRB from 1985 to 2020 and Local Moran’s I scatter plot (The small picture shows the clustering pattern). Note: (A) shows LERI spatial autocorrelation variation; (B) shows Local Moran’s I scatter plot for LERI.
Sustainability 16 06552 g010
Figure 11. Spatial distribution of carbon storage in MJRB from 1985 to 2020. Note: (A) illustrates the spatial distribution of carbon storage; (B) depicts the spatial changes in carbon storage; (ah) represent carbon data graphs at different times.
Sustainability 16 06552 g011
Figure 12. Rates of variation in carbon storage within different scenarios in MJRB between 2020 and 2030, extending to 2050.
Sustainability 16 06552 g012
Figure 13. Spatial distribution of carbon storage and LERI coupling coordination degree in MJRB from 1985 to 2020 (carbon storage and LERI coupling coordination degree divided into five classes).
Sustainability 16 06552 g013
Figure 14. Kernel density curve of coupling coordinating degree between LERI and carbon storage in MJRB from 1985 to 2020.
Sustainability 16 06552 g014
Table 1. Drivers for LULC spatial evolution in the MJRB.
TypeImpact FactorCodeClassification
Topographic and
climatic data
DEMX15
SlopX25
PrecipitationX35
TemperatureX45
Socioeconomic dataPopulationX55
GDPX65
RiverX75
RailwayX85
HighwayX95
RoadsX105
Table 2. Carbon density for six land types in MJRB (Mg·C·hm2).
LULC TypeCaboveCbelowCsoil
Farmland19.41229.33122.61
Forest135.71329.3673.09
Grassland100.31245.81113.00
Water8.530.000.00
Artificial surface7.100.000.00
Unused land3.690.0017.76
Table 3. Single factor detection results and LULC changes from 1985 to 2020.
FactorsT1T2T3T4T5T6T7T1–T3T3–T5T5–T7
q StatisticDifference Variation
X10.0140.2020.240.2320.2520.2740.2840.2260.0120.032
X20.0380.0160.0160.0190.020.0240.028−0.0220.0040.008
X30.0360.2250.2280.2020.2320.2550.2550.1920.0040.023
X40.0140.1990.2470.2380.2480.2730.2890.2330.0010.041
X50.0190.0620.0850.0910.1060.1220.120.0660.0210.014
X60.0280.0490.0650.070.0860.1120.0880.0370.0210.002
X70.0140.0240.0310.0240.0380.0460.0260.0170.007−0.012
X80.0420.1560.1680.1570.1960.2090.1910.1260.028−0.005
X90.030.130.1460.1270.1640.1810.1630.1160.018−0.001
X100.0360.1370.1610.1380.180.1960.1770.1250.019−0.003
Note: T1: 1985–1990; T2: 1990–1995; T3: 1995–2000; T4: 2000–2005; T5: 2005–2010; T6: 2010–2015; T7: 2015–2020; ↑ means increase, ↓ means decrease.
Disclaimer/Publisher’s Note: The statements, opinions and data contained in all publications are solely those of the individual author(s) and contributor(s) and not of MDPI and/or the editor(s). MDPI and/or the editor(s) disclaim responsibility for any injury to people or property resulting from any ideas, methods, instructions or products referred to in the content.

