Article

Sustainable Thermal Comfort by Age Group in Shopping Malls: Multi-Year Winter Surveys in a Severely Cold Region

1
Department of Resources and Civil Engineering, Northeastern University, Shenyang 110819, China
2
Department of Jangho Architecture College, Northeastern University, Shenyang 110819, China
3
Department of Automation Science and Electrical Engineering, Beihang University, Beijing 100191, China
*
Author to whom correspondence should be addressed.
Sustainability 2024, 16(15), 6563; https://doi.org/10.3390/su16156563
Submission received: 3 July 2024 / Revised: 23 July 2024 / Accepted: 30 July 2024 / Published: 31 July 2024

Abstract

:
The current Chinese standard utilizes a single thermal comfort index guide to regulate indoor parameters for public buildings. However, heating, ventilation, and air conditioning (HVAC) settings often do not align with the occupant’s needs. To address this, a 2-year winter field survey was conducted in four large-scale shopping malls across severely cold regions of China, considering the complex age structure of mall visitors. Physical environmental parameters were measured, and a subjective questionnaire yielded 1464 valid responses. Neutral temperatures for different age groups were 17.4 °C for children (0–12 years of age), 19.3 °C for early youth (13–24), 20.0 °C for mature youth (25–44), and 23.3 °C for middle-aged adults (45–59). The limit of the 80% acceptable temperature range for the children and early youth was lower than the current Chinese GB 50736 standard, suggesting that HVAC temperatures for the corresponding shopping malls can be appropriately reduced for the target consumer groups. Significant differences occurred between customers’ demand for thermal environments in shopping malls and various standards. These findings provide valuable insights into energy-efficient architectural design and operational management of shopping malls in the Shenyang area, promoting the sustainable development of human thermal comfort environments.

1. Introduction

The proliferation of large-scale shopping malls across China has surged recently owing to the rapid expansion of both the economy and urbanization [1,2,3]. As of 2020, the total stock floor area of shopping malls within the country reached 32.3 billion m2, with a completed construction area rate surpassing 250 million m2·yr−1, compared to less than 100 million m2·yr−1 in 2010. In 2014, shopping malls replaced office buildings across China as the predominant type of the largest annual completed construction area of all public building types [4].
As large shopping mall buildings undergo major functional transformations, building managers have analyzed various factors to optimize business and environmental operations, including the characteristics, habits, preferences, and abilities of target consumer groups, as well as business thematic and format distribution, which play a crucial role in determining the proportion of different business forms within malls and the appropriate spatial environment of malls. An excellent thermal environment in shopping malls impacts customer satisfaction and purchasing behavior. However, building managers often increase indoor set temperatures to the upper standard limits during winter, focusing only on controlling indoor temperature rather than thermal comfort [5]. The current heating, ventilation, and air conditioning (HVAC) design parameters for shopping malls in winter, as specified under China’s “Civil Building Heating, Ventilation, and Air Conditioning Design Code” (GB 50736), range from 18 to 24 °C [6]; however, no corresponding adjustment has been made to these parameters for shopping malls located across distinct climatic regions, nor to cater to the thermal comfort requirements of different age groups. People in shopping malls have different needs for comfortable indoor temperatures [7,8,9]. Consequently, these standards may not meet customers’ requirements adequately, as excessively high or low temperatures can cause severe customer discomfort [10,11,12]. In summary, excessively high indoor temperatures in shopping malls during winter can negatively affect consumers’ shopping experience and lead to a tremendous waste of energy, which is not aligned with contemporary societal sustainability development objectives.
Most research on thermal comfort revolves around single-function buildings, such as classrooms, offices, and dormitories, where human behavior patterns and type of user are relatively fixed. In contrast, in shopping complexes, there are larger differences between these two aspects [13]. Shopping malls exhibit a more complex age composition among visitors, and preferences for indoor thermal conditions vary across different age groups. Most individuals exhibit a moderate level of physical activity rather than leading a sedentary lifestyle, resulting in a shift in their metabolic rate [14]. However, few studies have evaluated or predicted the differences in thermal comfort in the same environment by age. The relationship between the indoor thermal environment and customer satisfaction remains unclear in severely cold regions.
To achieve this objective, this study implemented physical environmental measurements and subjective questionnaire surveys over two years across four large shopping mall buildings during winter in Shenyang, China. The primary objectives of this study were to (1) analyze the characteristics of the actual indoor thermal environment parameters during winter and investigate the actual thermal sensation of different age groups, (2) determine the comfortable temperature ranges suitable for four respective target consumer age groups, based on shopping mall locations, and (3) explore indoor adaptive measures in shopping malls. To optimize the thermal environment of shopping malls, the focus should be on the comfort needs of common-activity spaces across ages. The findings of this study can serve as an invaluable reference for the relevant standards, operation management of shopping malls, and social sustainable development objectives in severely cold regions of China.

2. Materials and Methods

2.1. Basic Information

Shenyang City (Liaoning Province, China) had a total resident population of 9.118 million in 2022, according to the 2022 census. This city was selected for analysis owing to its geographical location in the severely cold climatic area of Northeast China (123°43′ E, 41°77′ N), with minimum daily winter temperatures of −32.9 °C and a lowest monthly average temperature of −11.2 °C [15]. The region has a multi-year average relative humidity of 63% and multi-year average wind speed of 3.1 m/s with the SW wind direction and is frost-free for 150–170 days per year. Meteorological data throughout the study period were obtained from the China Meteorological Administration (http://weather.cma.cn) (Figure 1); the query deadline was 31 December 2023, revealing winter minimum and maximum temperatures of −27 °C and 10 °C, respectively, across the study period.
The concentrated winter heating period in the Shenyang region is from 1 November to 31 March of the following year. Here, the months with stable outdoor temperatures were selected for the survey. Accordingly, by the end of 2023, environmental measurements and subjective questionnaire surveys were carried out over seven months (1 December 2021–28 February 2022, 1 December 2022–28 February 2023, and 1–31 December 2023), with survey times from 10:00 to 21:30.

2.2. Environmental Parameter Measurements

The measured indoor environmental parameters were air temperature (Ta), black globe temperature (Tg), relative humidity (RH), and air velocity (Va). Table 1 presents the range, accuracy, and model of the measurement equipment used (Jantytech, Beijing, China); these parameters conform to the International Organization for Standardization (ISO) 7726 standard [16] and the Chinese JGJ/T 347 standard [17]. These devices were selected based on their convenience for mobile measurements. Measurements were conducted in various locations, such as entrances/exits, atria, businesses, and public spaces. The survey area for the questionnaire was situated 5 m away from the air conditioning vent to avoid the impact of airflow velocity. The readings were taken near customers, with sensors positioned 1.1 m [16] above the ground. When participants completed the questionnaire, the operators maintained an appropriate distance to minimize interference.

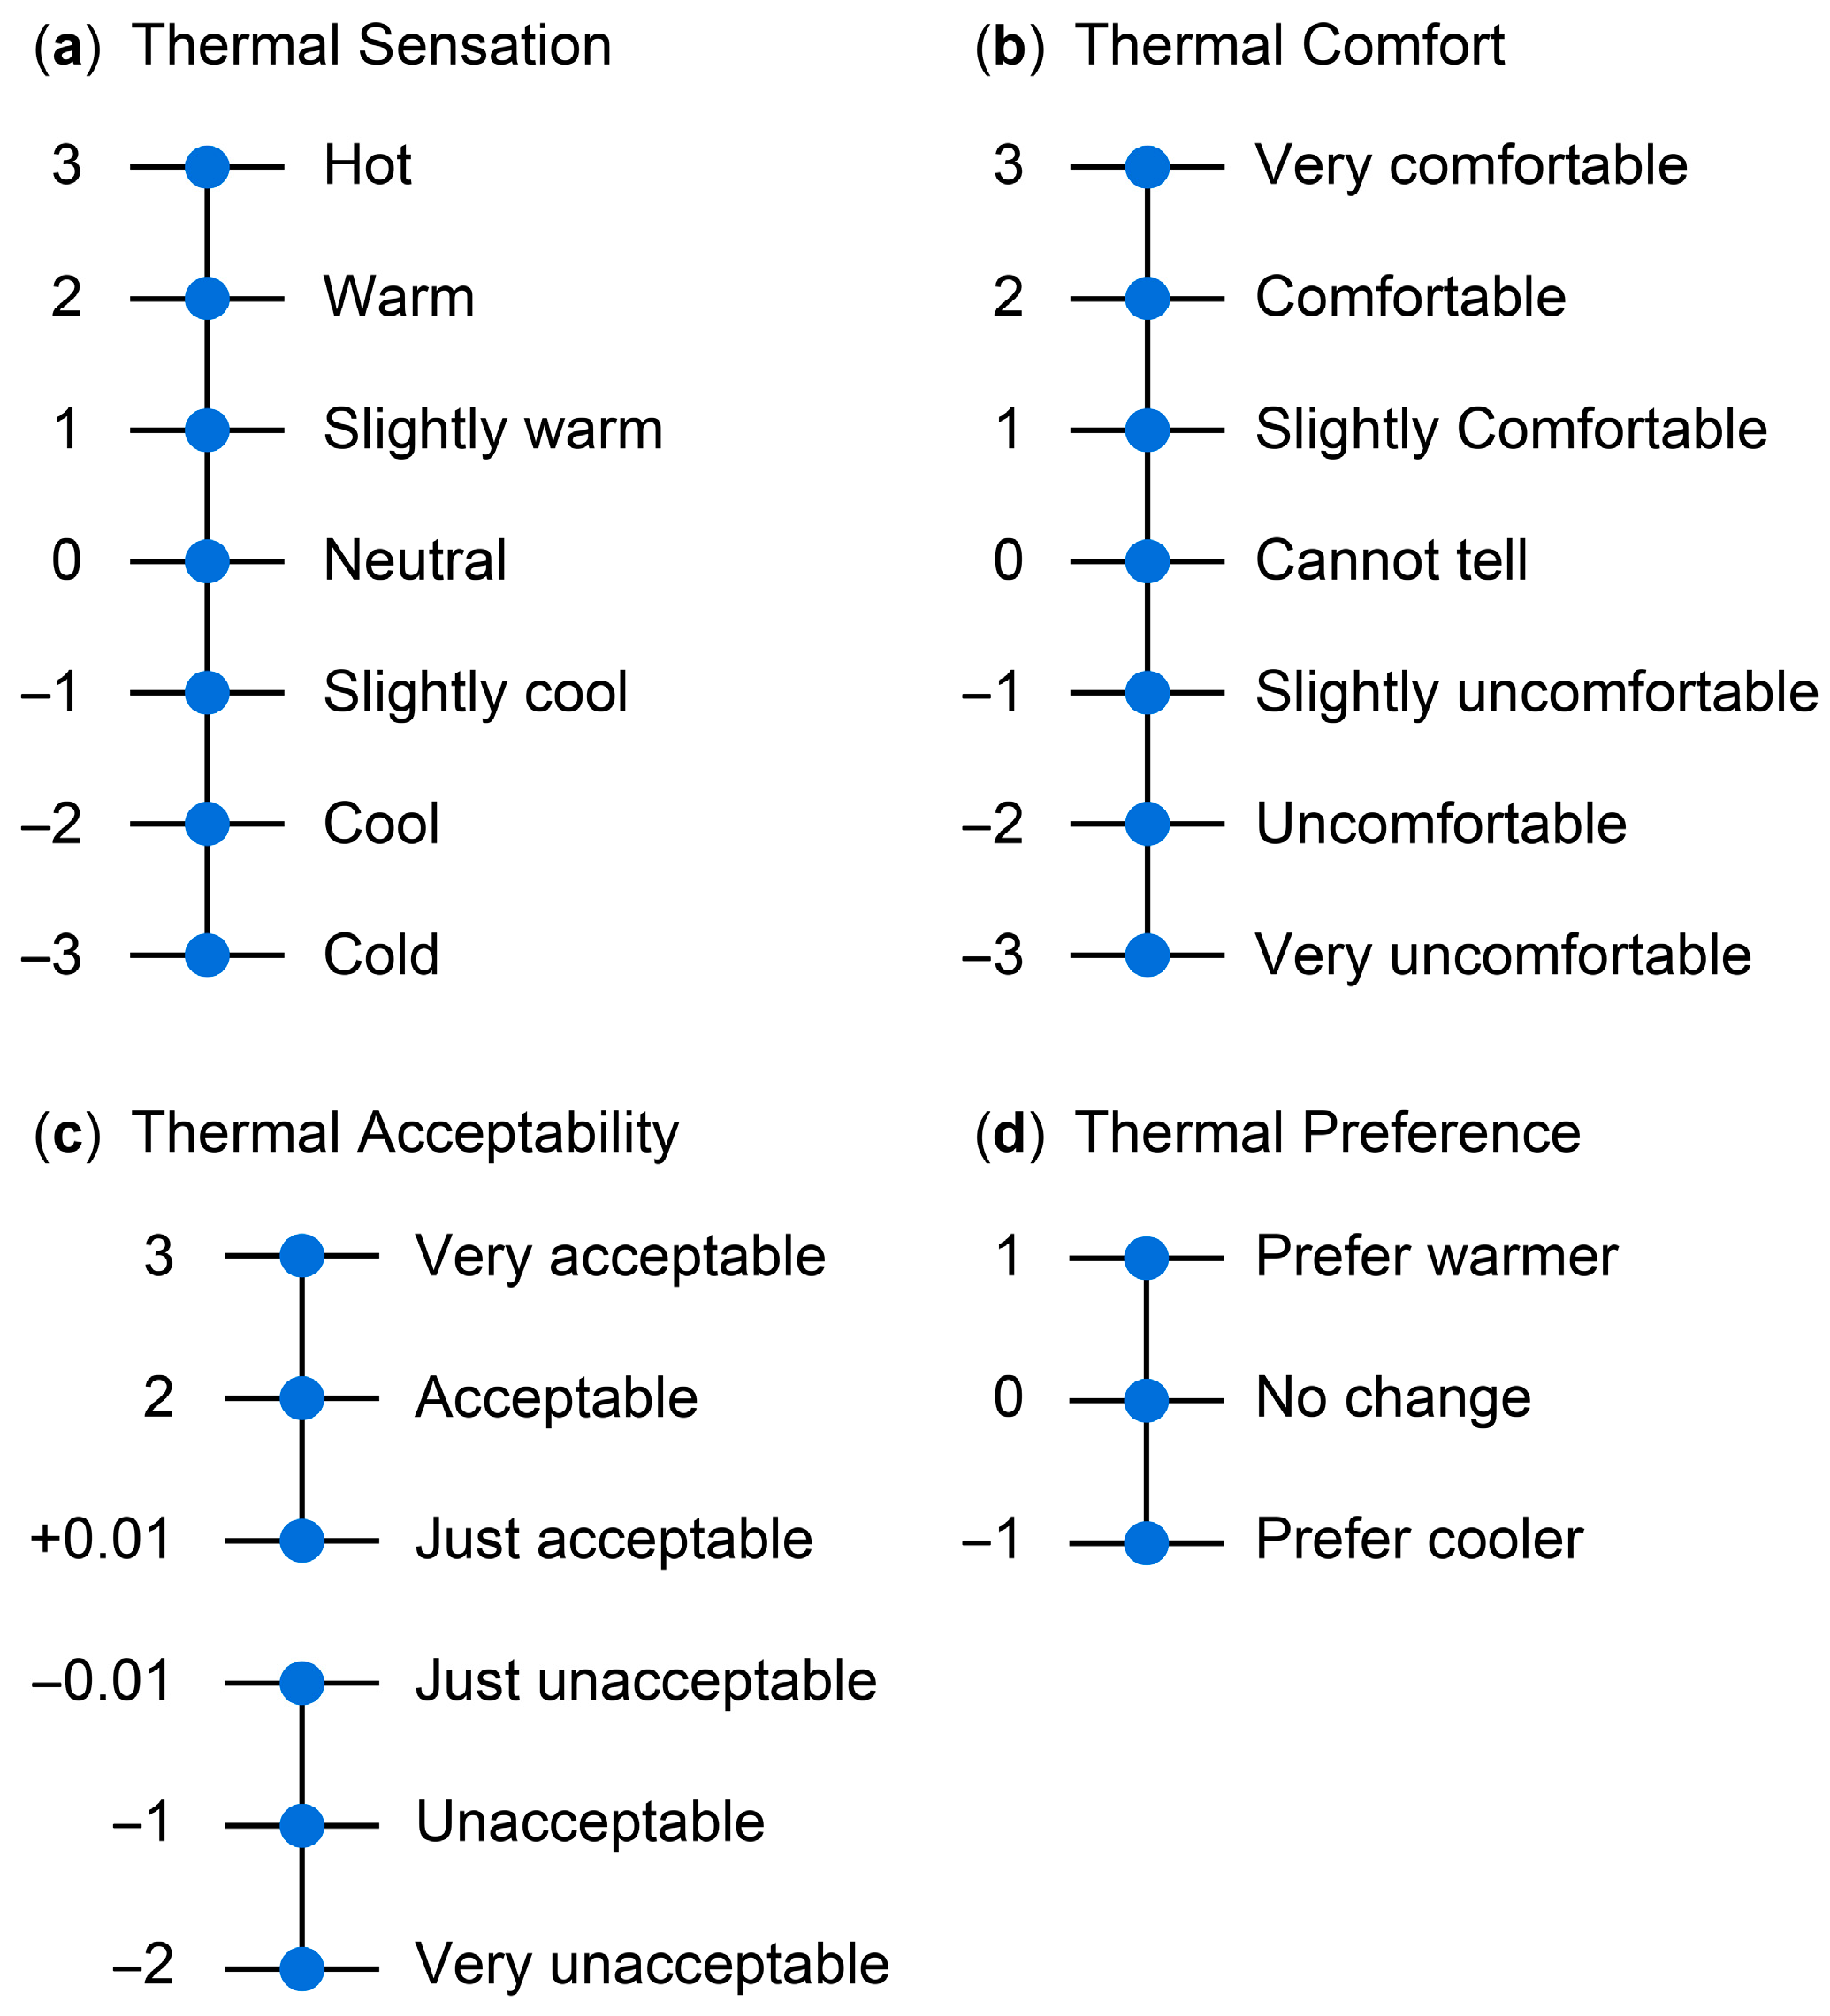
2.3. Questionnaire Survey

Following World Health Organization standards [18], individuals up to 44 years of age are categorized as youth, 45–59 as middle-aged, and over 60 as elderly. However, owing to the wide age range of the youth category, this survey combined the analysis of different shopping mall positions. The youth category was further divided into three stages: children (0–12 years), who cannot act autonomously and must be accompanied by a guardian; early youth (‘Youth 1’; 13–24 years), mostly comprising young people attending educational institutions and with weak consumption power; and mature youth (‘Youth 2’; 25–44 years), adults who earn a living and have some spending power. Older people were excluded from the analysis due to low participation rates in shopping mall visits during winter and the associated inconvenience of completing the questionnaire. For children, the survey questions were summarized and were asked by their parents to assist with questionnaire completion. To ensure consistency among respondents, all questionnaires were completed by customers engaged in moderate physical exercise (i.e., walking).
During the survey, standardized paper questionnaires were randomly distributed in shopping malls. These asked about basic information (age, gender, height, weight, clothing, clothing adjustment behavior, etc.), as well as subjective evaluations, including thermal sensation vote (TSV), thermal comfort vote (TCV), thermal acceptability vote (TAV), and thermal preference vote (TPV). Subjective evaluation was based on a seven-level rating scale for adults (American Society of Heating, Refrigerating, and Air-Conditioning Engineers [ASHRAE] [19]) (Figure 2). Following Mellor and Moore [20], to facilitate children’s understanding when evaluating their thermal comfort, the TCV was condensed into five-option scales (presented in Supplementary S1). The grade definitions in the TSV scale [21] were explained to customers, as well as other relevant issues before the questionnaire was completed (presented in Supplementary S2); they then provided informed consent by signing the appropriate form. Owing to the high mobility of people in shopping malls, survey times and locations varied. While the customers completed the subjective questionnaire, the surrounding physical environmental parameters were recorded. The measurement time for each parameter was ≥5 min.
A total of 1612 questionnaires were collected in the field survey. According to the thermal-comfort research data-processing method [22,23], the validity of votes is commonly judged using the absolute value of (TSV + TPV). For instance, “TSV + TPV = 4” represents self-contradictory feedback, which implies that the subject voted “+3” for TSV (i.e., hot), but they still wanted to be warmer (TPV, +1); alternatively, a subject voted for “−3” for TSV (i.e., cold), but they still wanted to be cooler (TPV, −1). Therefore, in this study, responses with “TSV + TPV < −3” or “TSV + TPV > 3” were regarded as invalid. After excluding invalid responses, a total of 1464 valid responses were collected across the study period; the relevant information pertaining to these groups is presented in Table 2.

2.4. Human Metabolic Rates

Metabolism is the process by which the human body consumes energy during physical activity and can be expressed as heat loss (W·m−2). Numerous factors affect the metabolic rate, including the type of activity, age, and gender. The unit of metabolic equivalent for the human body is the met. As defined by the ISO 7730 [24] standard, in a thermally comfortable environment, the metabolic equivalent for the sedentary human body is 1 met (equivalent to 58.15 W·m−2). “Leisurely walking” throughout a shopping mall represents an activity with low metabolic rates (1.7 met, or 100 W·m−2). The value in the standard is established for adults; thus, related studies on metabolic rates in children have suggested that theirs should be revised [25,26,27]. According to Amorim [28], the resting metabolic rates of children (7–11 years old) in sedentary states of either sitting or lying down are 1012–1420 and 1131–1358 kcal·day−1, respectively, with a mean metabolic rate value of 1147.9 kcal·day−1 and converted basal power of 55.6 W. In 2012, Despoina [29] further synthesized the results of Havenith [26] and Amorim [28] to compare the metabolic rates of adults and children, revealing that based on the average body surface area of a 10-year-old child of 1.14 m2, this could be converted to a resting metabolic rate of (55.6 W/1.14 m2) = 48.8 W/m2 for children. The value of the active metabolic rate for children in this study was therefore corrected to 83.9 W/m2.

2.5. Thermal Resistance of Clothing

According to the projection combination recommended by the standard of Thermal Environmental Conditions for Human Habitation [19], the thermal resistance of clothing can be calculated according to Equation (1). The projected thermal resistance of clothing during walking activities is presented in Equation (2).
I c l 0.82   I c l i + 0.161
I c l is the thermal resistance value (clo) of a complete set of garments and I c l i is the thermal resistance value (clo) for a single garment.
I c l   a c t i v e = I c l × ( 0.6 + 0.4 M ) 1.2   met < M < 2.0   met
I c l is the thermal resistance of clothing without activity (clo), I c l   a c t i v e is the clothing’s thermal resistance when walking, and M is the metabolic rate (met).
During winter, clothing selection is influenced by the prevailing outdoor temperatures; thus, the attire typically includes underwear, sweaters or shirts, thermal pants, overpants, down jackets, and shoes. Although people can change their clothing in warmer indoor environments, this is often restricted to removing their coats in public areas owing to practical constraints. According to the equation, the clothing thermal resistance value ranged from 0.75 to 1.68 clo. According to “China’s Indoor Thermal Environmental Conditions” [30] and the characteristics of the Shenyang region, daily outdoor clothing thermal resistance during winter ranges closer to 1.2–1.8 clo. Thus, the clothing thermal resistance values in this survey satisfied the principle of daily wear in winter.
Using measurements of children’s weight, skin surface area, and the percentage area covered by clothes, in conjunction with the equation for calculating the thermal resistance of clothing proposed by McCullough [31], Havenith [26] substituted the measured parameters into the equation, finding that any differences between the thermal resistance of adults’ and children’s clothing were negligible during the same season. Thus, the thermal resistance calculation of children’s clothing in this study is consistent with that of adults.

2.6. Indicator Selection and Treatment

The operative temperature (Top) was selected as the thermal environment evaluation index as it integrates both convective and radiative heat exchange between the environment and the human body [32] and is considered more accurate for describing the thermal sensation of residents in cold areas. Top can be derived from Equations (3) and (4):
T o p = h c T a + h r T r h c + h r
The measured parameters include air temperature, black globe temperature, and airflow velocity.
T r = [ ( T g + 273 ) 4 + 2.5 × 10 8 × v 0.6 × ( T g T a ) ] 1 / 4 273
h c is the convective heat exchange coefficient (W·m−2·°C−1), h r is the radiative heat exchange coefficient (W·m−2·°C−1), T r is the mean radiant temperature (°C), Tg is the black globe temperature (°C), Ta is the air temperature (°C), and v is the airflow velocity (m·s−1).
According to the ASHRAE 55 standard [19], under an airflow velocity < 0.2 m·s−1, the difference between the air temperature and the average radiative temperature is <4 °C; thus, the convection heat exchange coefficient and radiation heat exchange coefficient can be considered equal. All surveys and measurements were carried out in a state of zero wind to avoid the effects of airflow velocity; therefore, the T o p was simplified using Equation (5):
T o p = 0.5 T a + 0.5 T r
Ta and Tr are the mean air temperature (°C) and radiant temperature (°C), respectively.
The running mean air temperature method was applied according to the ASHRAE Standard 55 [19]. To better represent the majority, the data were analyzed using the temperature–frequency (i.e., Bin) method by dividing them into bins with indoor operative temperature intervals of 0.5 °C. Here, for the regression analysis, the average temperature of each bin was taken as the independent variable. In contrast, the mean thermal sensation (MTS) of TSV and average predicted mean vote (PMV) were used as dependent variables to minimize error. The PMV values were calculated using the program introduced in ASHRAE [19]. Statistical analysis of subjective evaluation data was performed using IBM SPSS Statistics for Windows version 24 (IBM Corp., Armonk, NY, USA). Differences were considered significant at the 0.05 level.
The preferred temperature (PT) analysis is based on the binary logistic regression principle, and the logistic function is shown in Equation (6).
f ( z ) = e z 1 + e z = 1 1 + e z
The concept of logistic regression (odds) is that the probability of an event refers to the ratio of the probability of the event occurring to the probability of the event not occurring. Assuming the probability of the event occurring is p, the binomial logistic regression model is shown in Equation (7):
l n ( p 1 p ) = l n ( p ( Y = 1 x ) 1 p ( Y = 1 x ) )

3. Results

3.1. Case Studies

All commercial shopping malls considered here were >100,000 m2 in area, with full-height atria and adjoining public areas. To ensure adequate representativeness of diverse consumer groups across ages, preliminary screenings were undertaken at 20 large shopping malls in Shenyang to assess the proportions of business types and customers’ ages. The four malls with the most distinctive representativeness were selected for further analysis (Table 3). A certain regularity in customer age and business type proportion in each shopping mall was observed. The proportion of customers in the target consumer group was greater than in the other age groups.

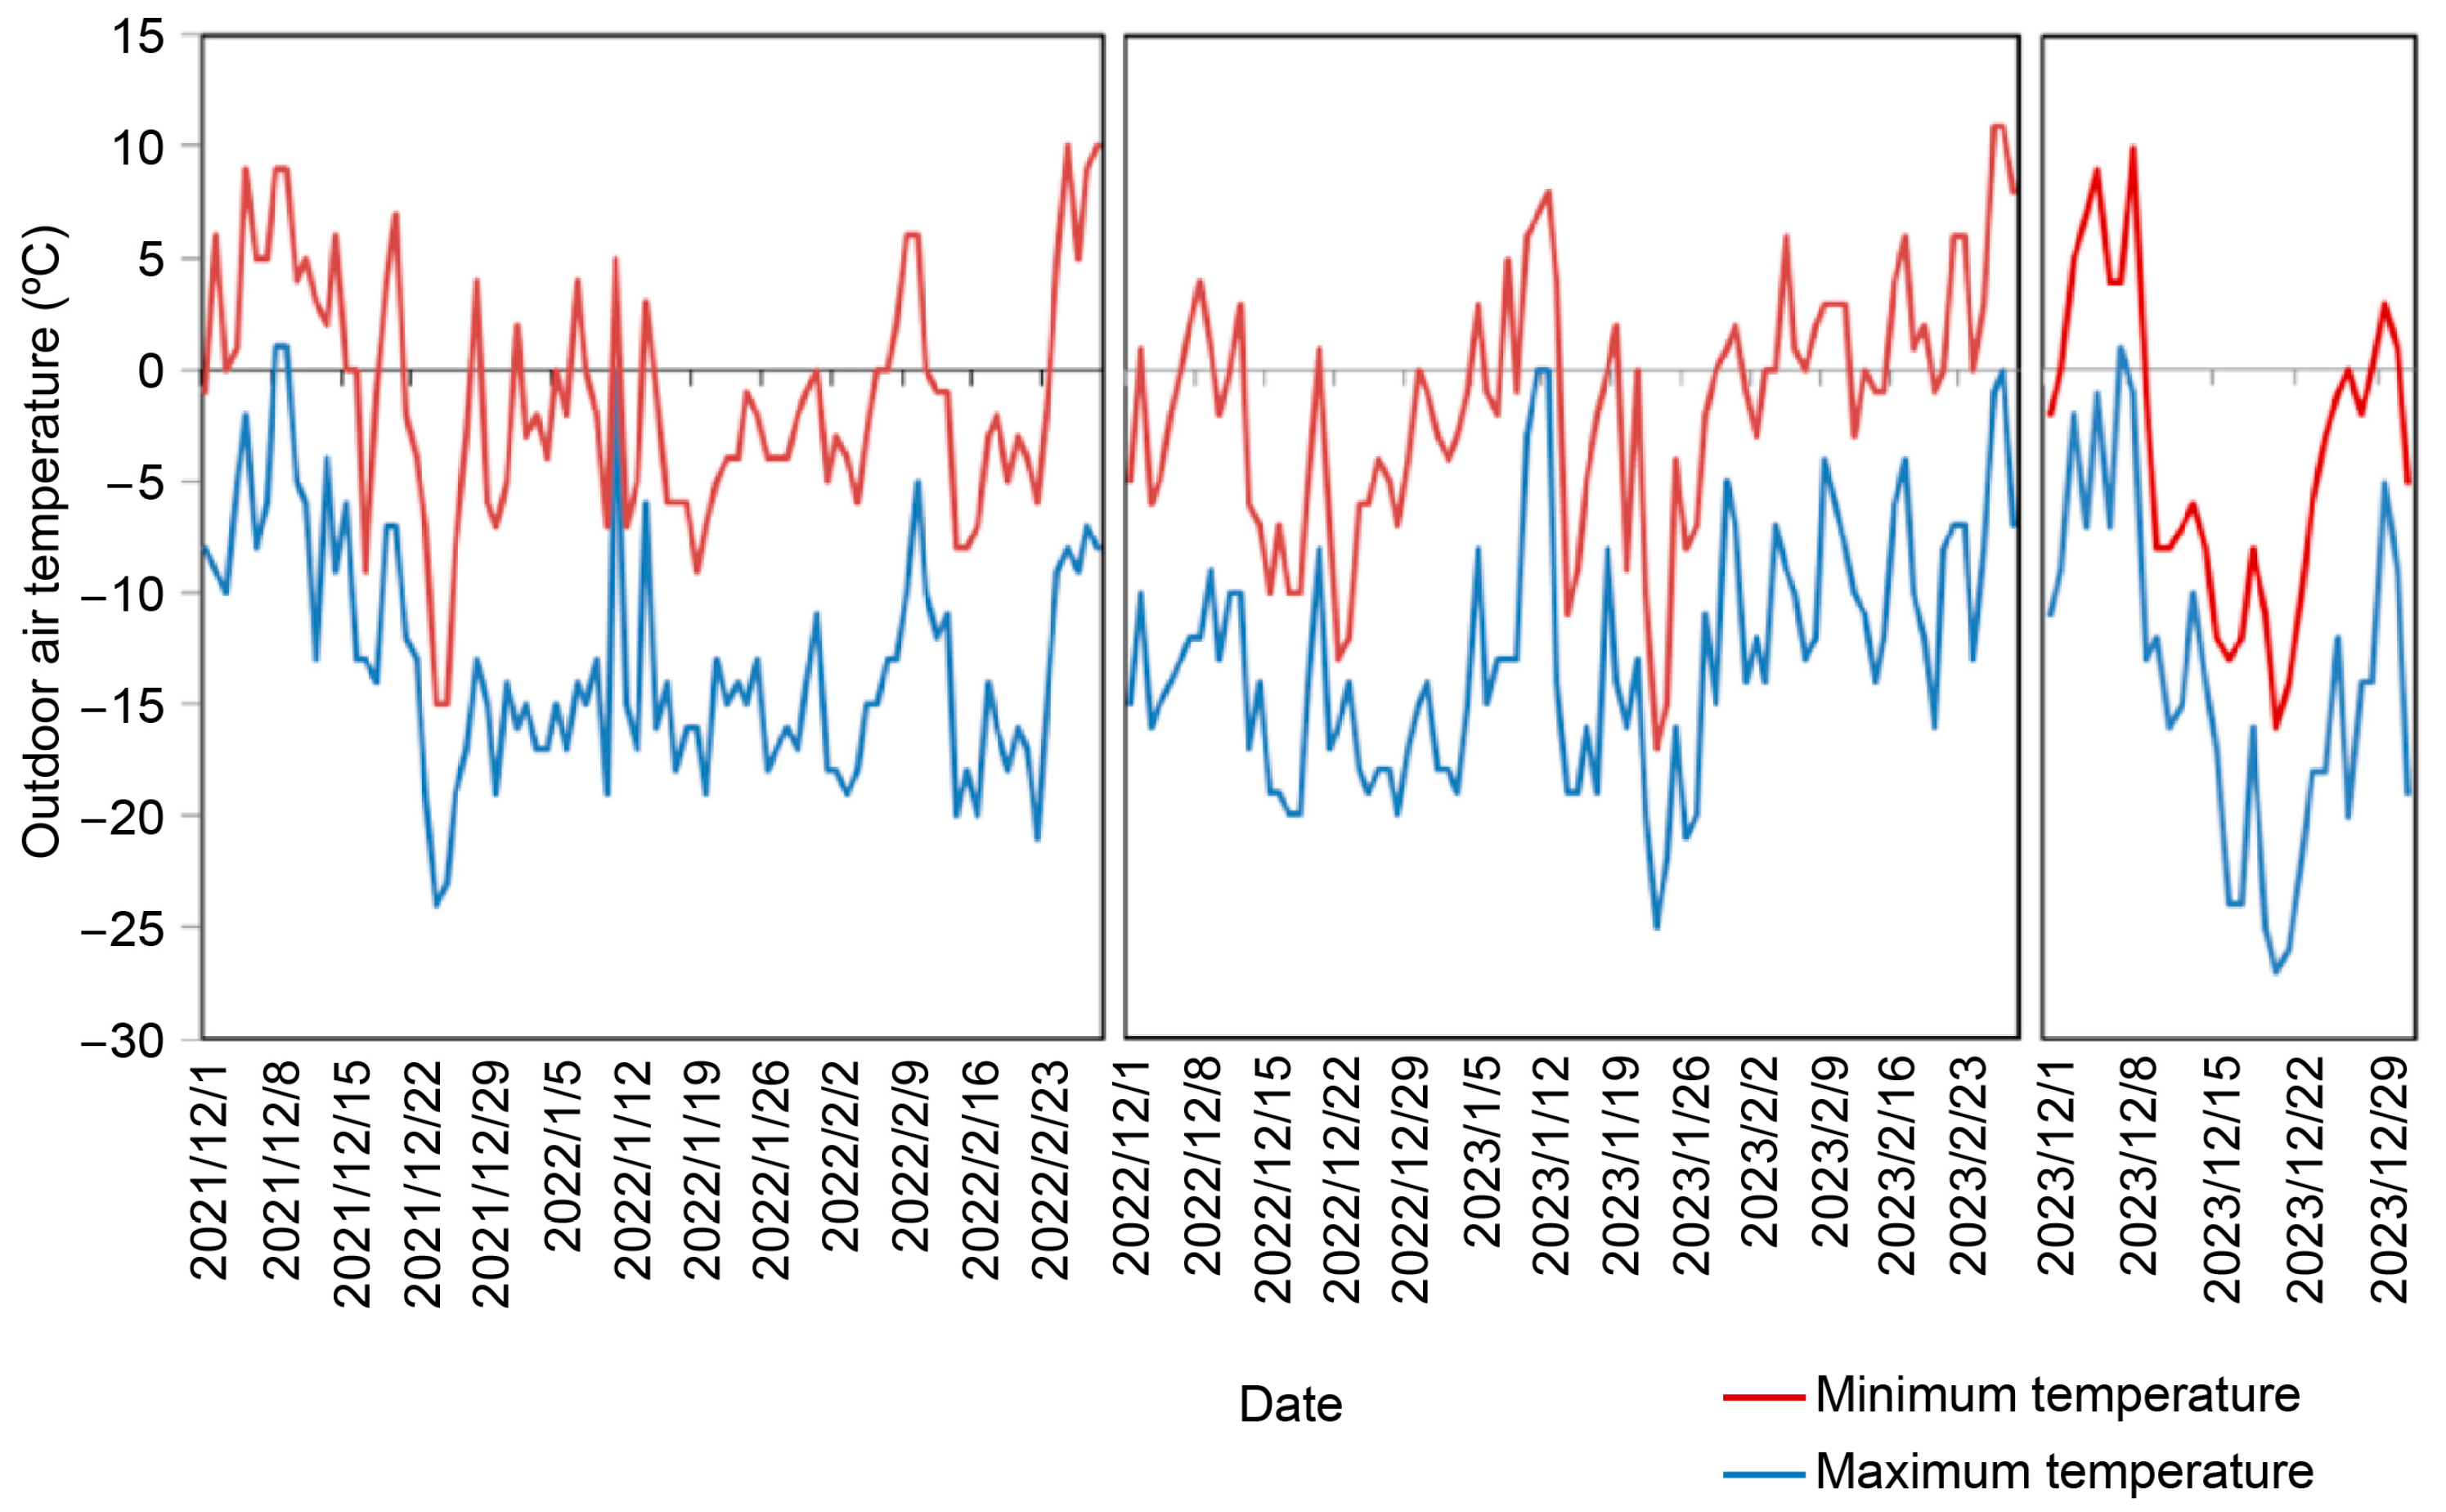
3.2. Analysis of Indoor Thermal Environments

A total of 1416 indoor environmental parameter datasets were collected in this study. The overall average environmental conditions and calculated clothing thermal resistance data are listed in Table 4. According to GB 50736 [6], the winter design temperature for concentrated heating in severely cold regions should range between 18 and 24 °C, with an RH ≥ 30% and wind speed ≤ 0.2 m·s−1 for optimal thermal comfort. Notably, the maximum indoor temperatures observed across the measurement periods exceeded this upper limit (24 °C) by 3–5 °C. In contrast, the average indoor air temperatures were close to the average operative temperature (Top), indicative of weak radiative effects. The RH was far below the specified lower limit; however, the wind speed successfully met the specification requirements. Overall, the observed indoor shopping mall temperatures were too high, and the RH was too low. The average temperature difference between indoor and outdoor environments reached 35–45 °C. There was insufficient ventilation due to the inability to open windows during winter; therefore, the dense indoor passenger flow affected local ventilation, leading to the failure to meet the standard requirements.

3.3. Evaluation of Subjective Questionnaires

To standardize the data treatment across the age groups and achieve a more uniform comparative analysis, for adults, the TCV categories “Very comfortable” (3) and “Comfortable” (2) were pooled as “Comfortable” (2), and the categories “Uncomfortable” (−2) and “Very uncomfortable” (−3) were pooled as “Uncomfortable” (−2). The overall distributions of TSV, TCV, TAV, and TPV across each age group are shown in Figure 3. Regarding TSV, 74.2% were “warm”, which was 25% higher than for the middle-aged group, indicating that children were relatively more sensitive to warm environments (Figure 3a). Comparatively, the middle-aged group preferred warmer environments, with 62.7% feeling “Comfortable” (Figure 3b). More than 68.7% of the middle-aged group and 61.1% of the children considered the current environment to be “Acceptable”, whereas slightly more of the youth considered it to be “Unacceptable” (Figure 3c). Regarding TPV, >42% of customers would have liked it to be cooler, whereas 21.4% of the middle-aged group would have preferred it to be warmer in cooler parts of the malls (Figure 3d).

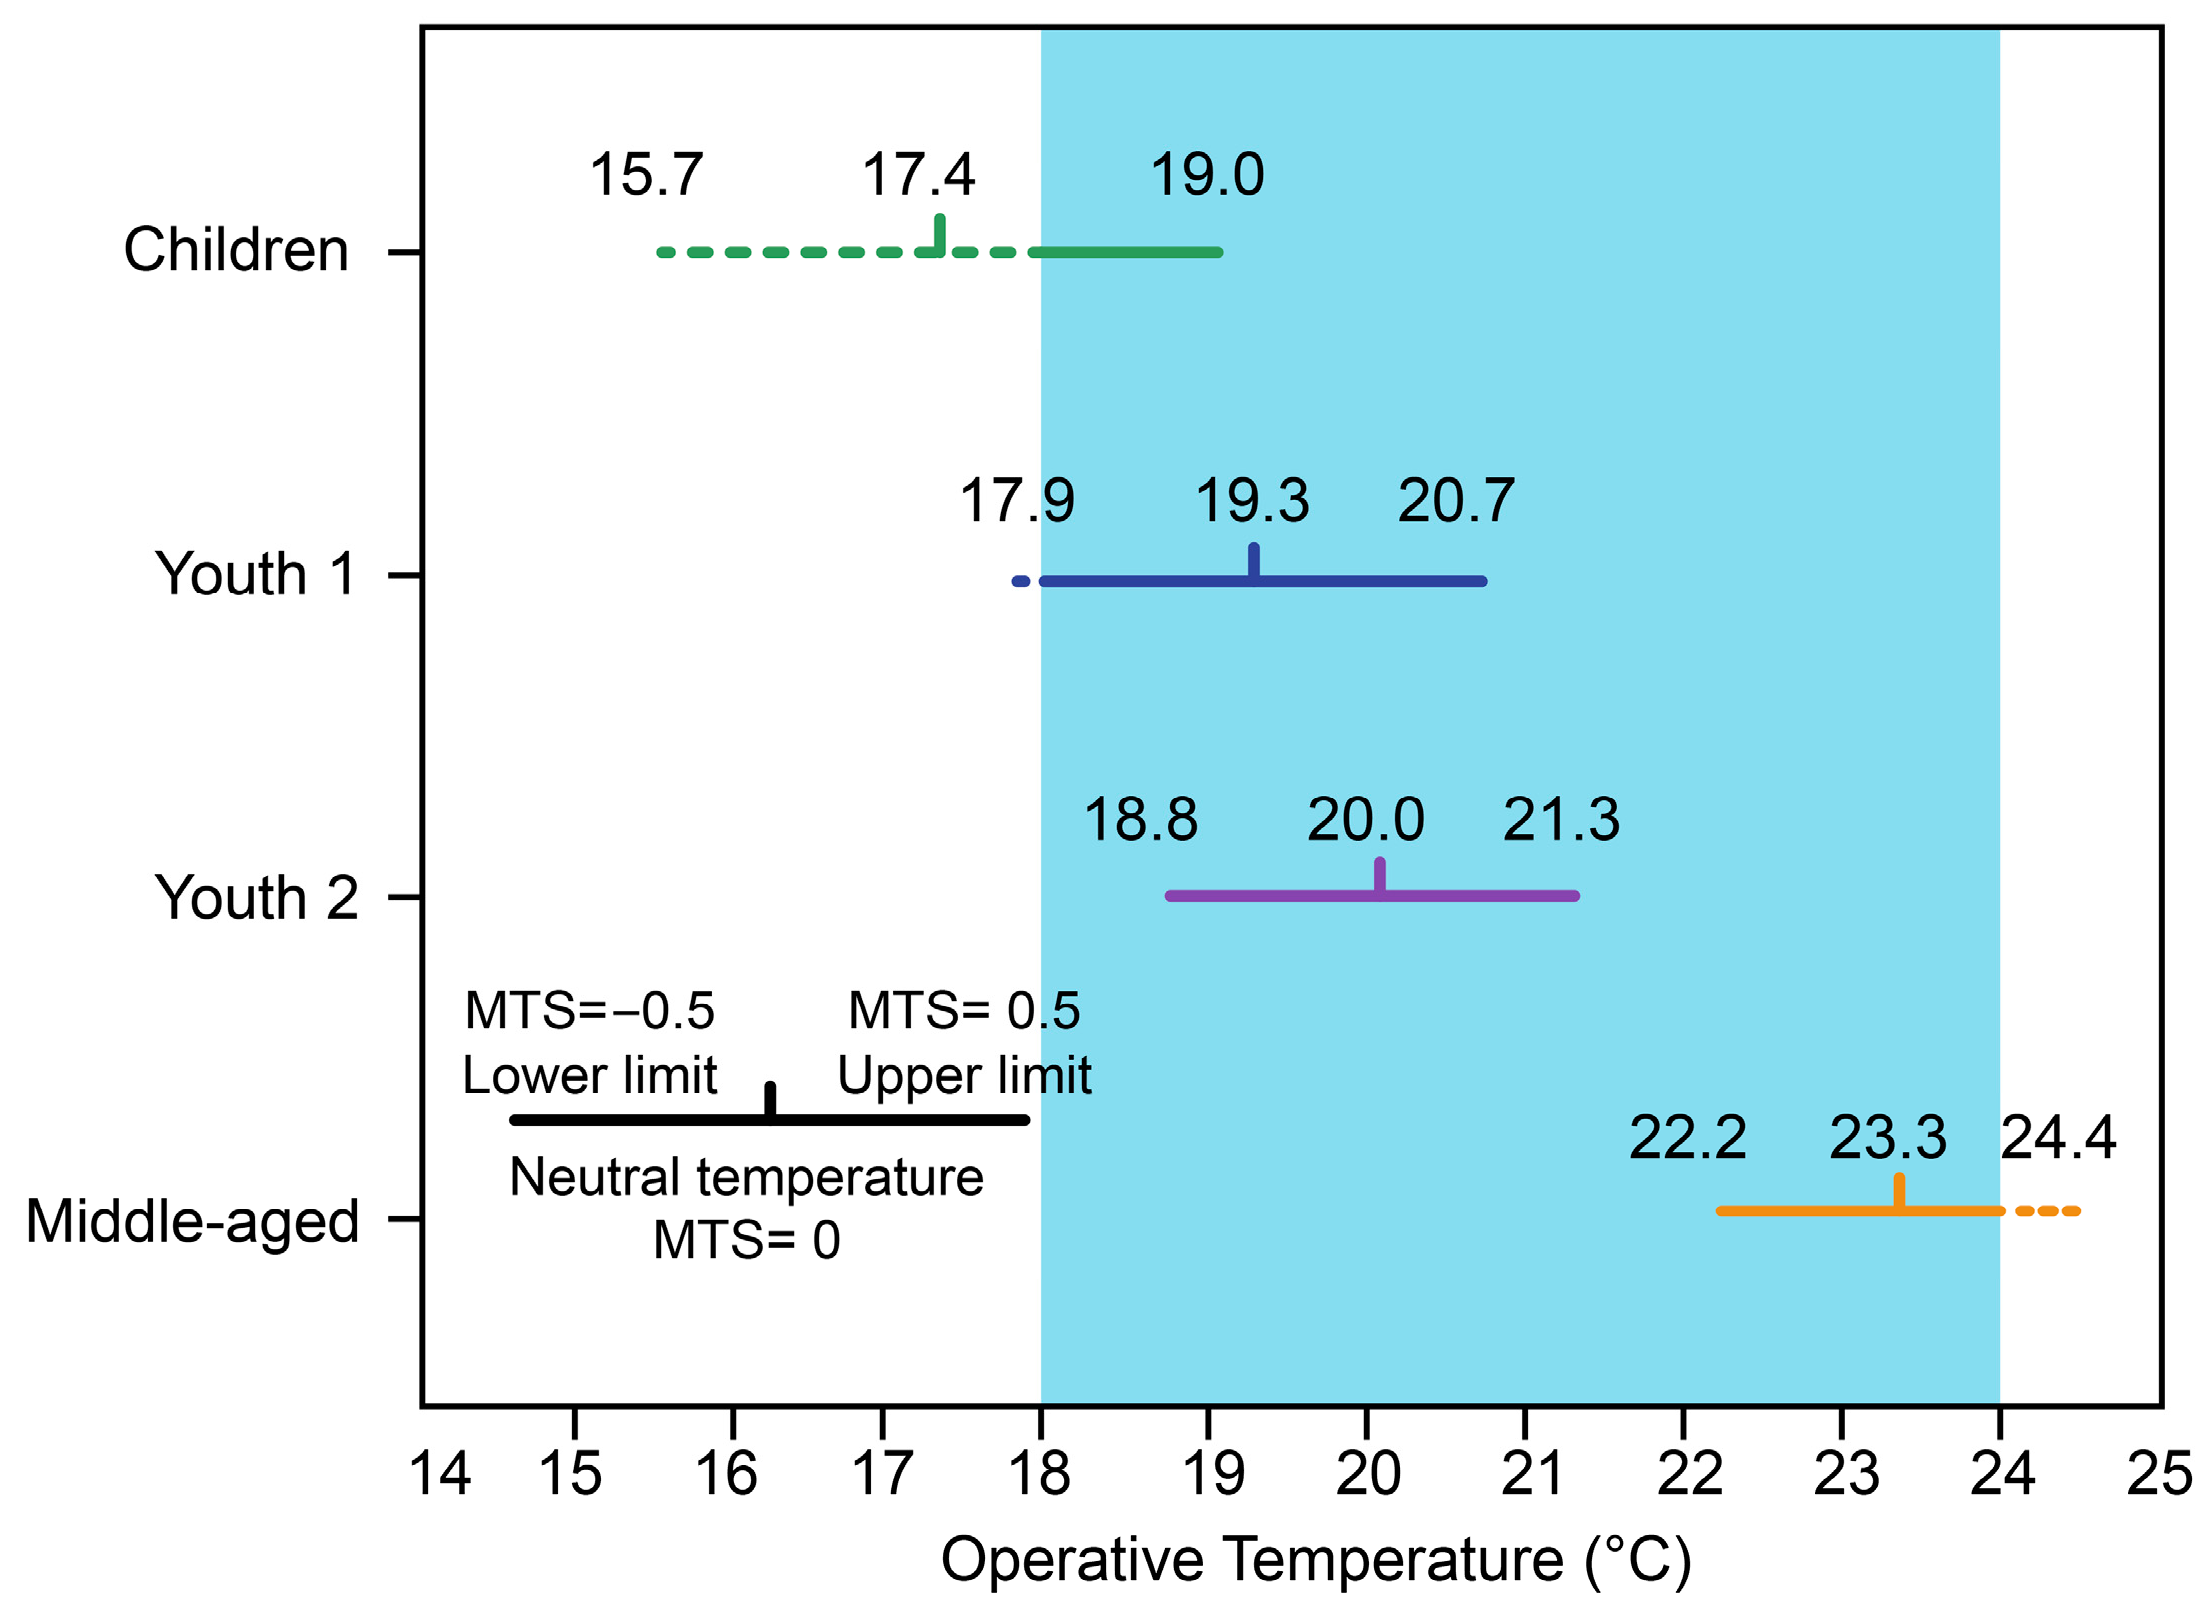
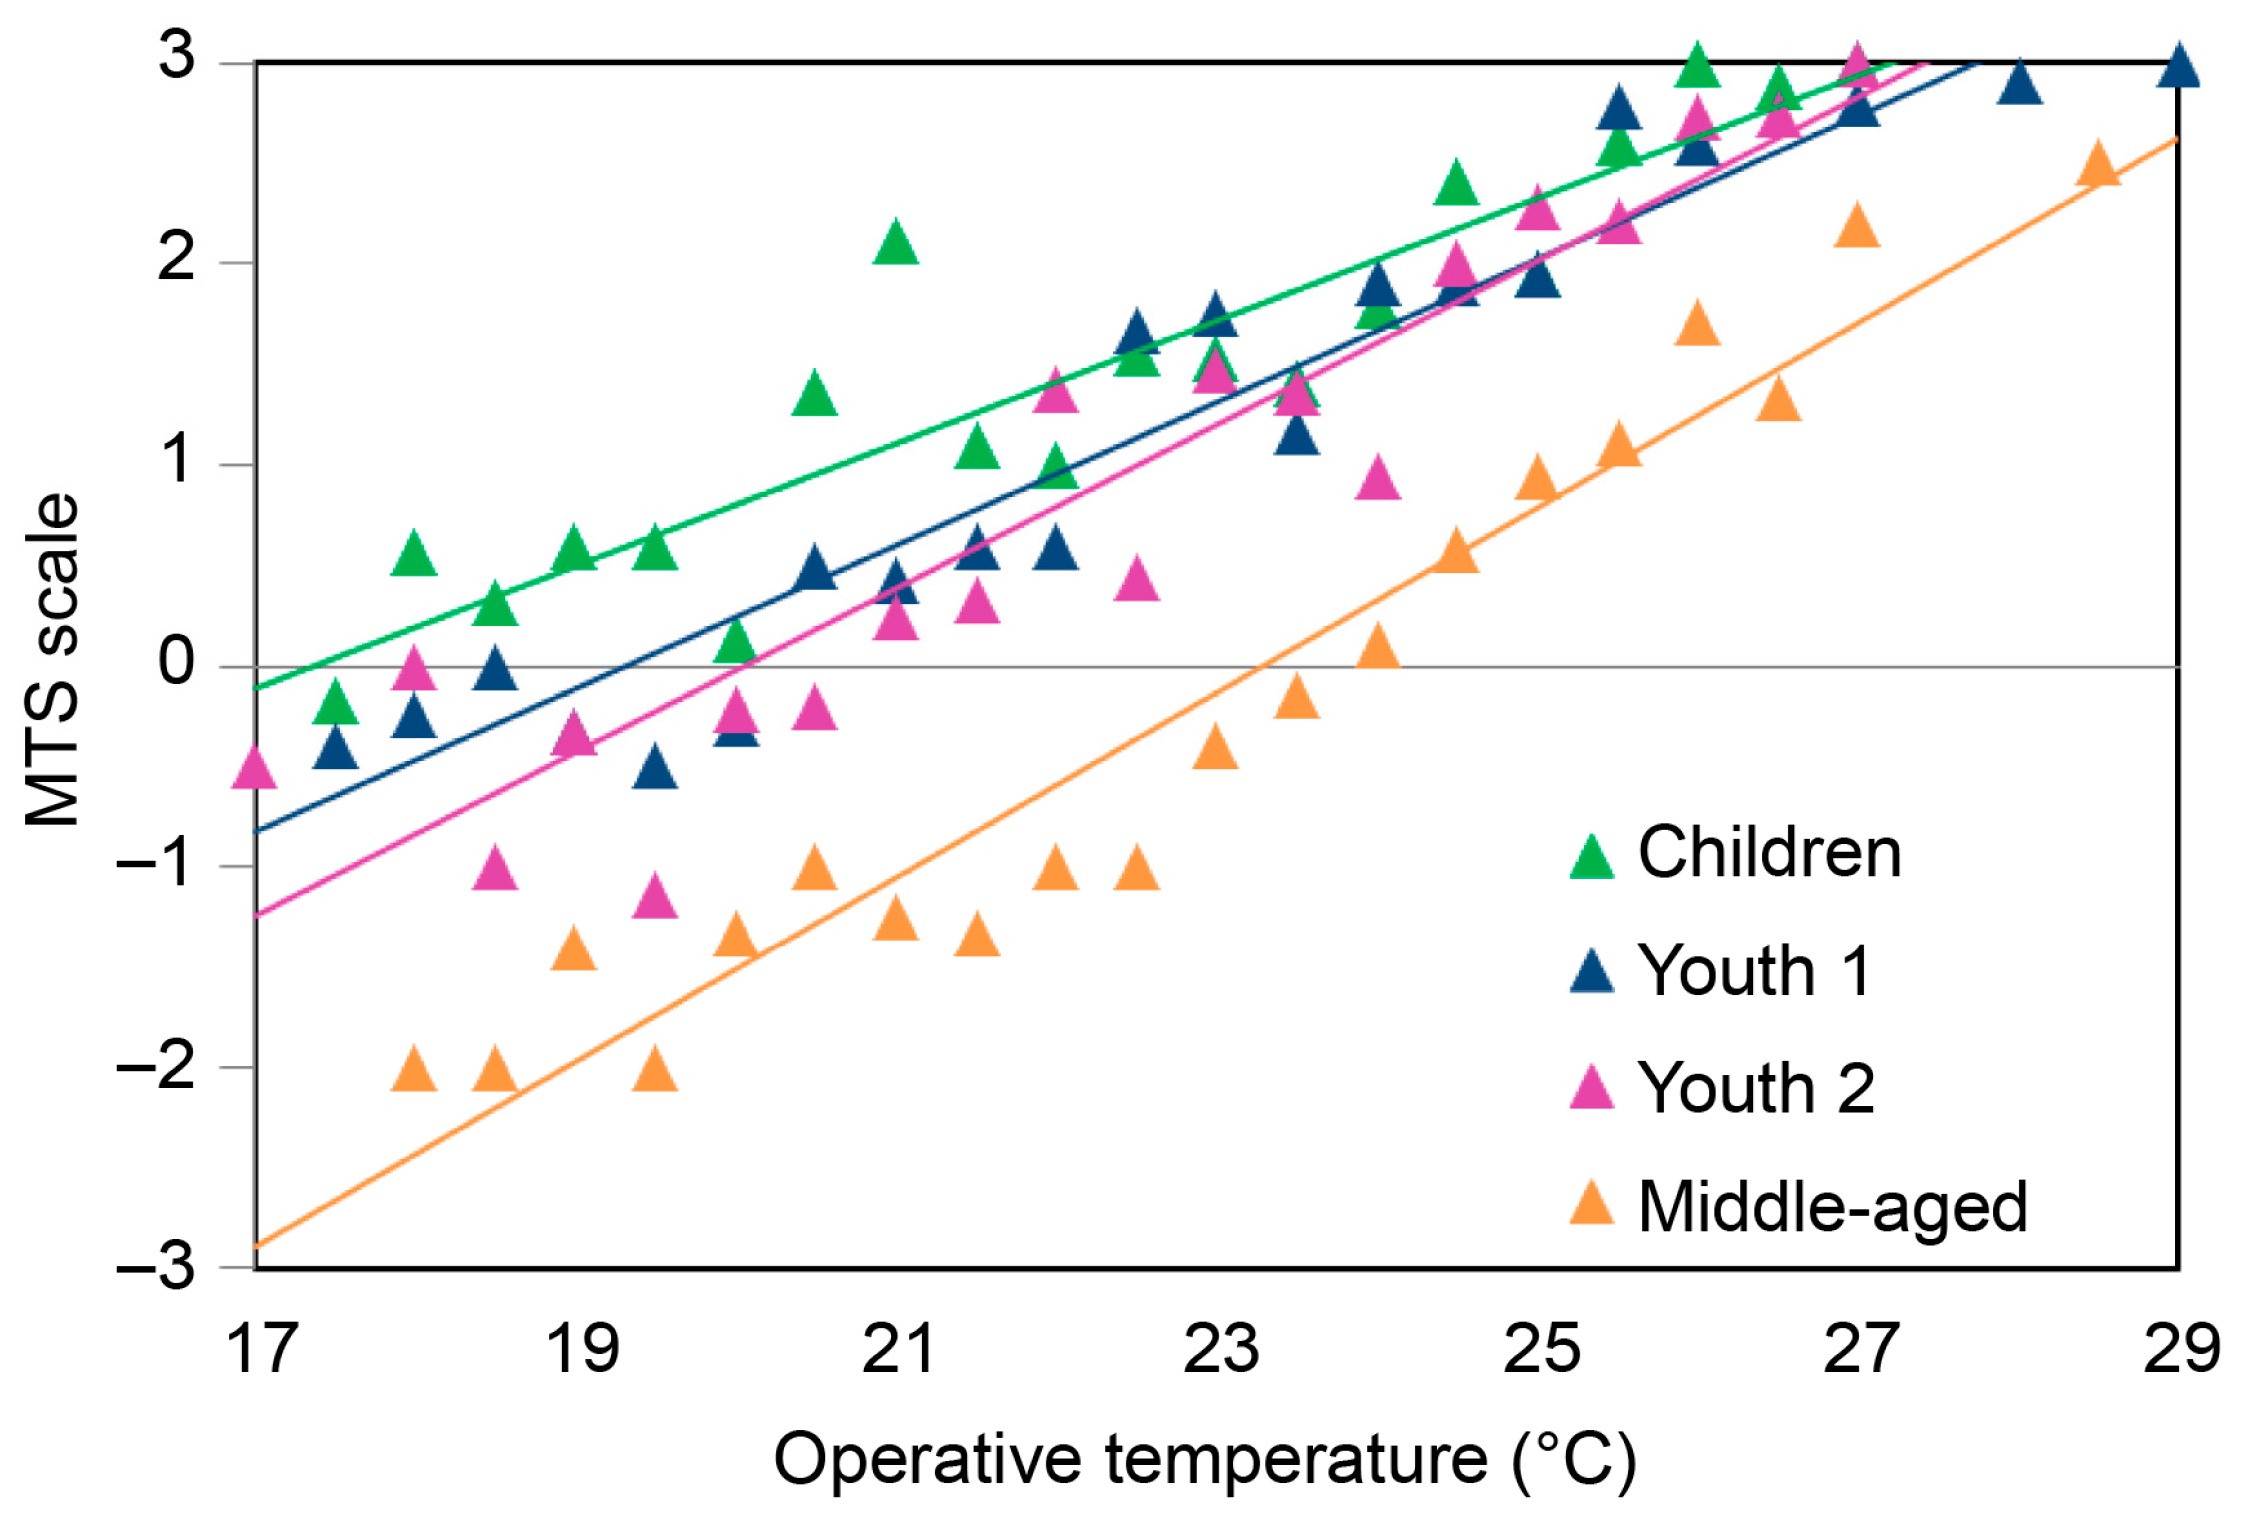
3.4. Comparison of MTS and PMV across Age Groups

The relationships between indoor Top and MTS and PMV over the different age groups are shown in Figure 4, where each data point represents the mean TSV and PMV for visitors across 0.5 °C temperature intervals. All of the data showed strong positive correlations. A high coefficient of determination between the customer’s actual thermal sensation MTS and Top indicates that MTS can effectively predict the actual thermal sensation of the human body. The trend in MTS varied owing to the different sensitivities of each age group and indoor temperatures. Here, the linear regression equation for the middle-aged group produced the strongest gradient, indicating a higher sensitivity to temperature changes than the other age groups. The MTS and PMV regression lines for all age groups did not overlap but had deviations, indicating that the PMV model could not accurately predict actual thermal sensation. Notably, the PMV model is based on a steady-state prediction, whereas shopping malls are composed of a combination of venues such as public areas and shops. The customers were in a constant thermal transient state and had likely experienced the initial temperature change upon entering the mall. However, this factor was not considered by the PMV model. Comparatively, the MTS regression line was generally higher than the PMV’s, and its variability increased with Top; this suggested that, overall, PMV underestimated the actual thermal sensation in warm environments, and the measured values of people’s sensitivity to temperature were higher than the predicted values of PMV.
MTS and PMV were set to 0 to calculate the neutral temperatures (Tn) for the different age groups to further compare the differences between MTS and the predicted values. The actual Tn values, 17.4 °C and 23.3 °C for the children and middle-aged groups, respectively (Regression Equations (8) and (10)), were lower than the respective predicted values (19.3 °C and 23.4 °C (Regression Equations (9) and (11))); this could be attributed to the thermal resistance of clothing. Although parents usually remove children’s coats in shopping malls, this may not considerably affect their actual thermal sensation, as they are usually more active:
M T S c h i l d r e n = 0.3053 T o p 5.3058 ,   R 2 = 0.8533
P M V c h i l d r e n = 0.164 T o p 3.1662 ,   R 2 = 0.9452
M T S m i d d l e a g e d   = 0.4594 T o p 10.693 ,   R 2 = 0.9417
P M V m i d d l e a g e d   = 0.2814 T o p 6.592 ,   R 2 = 0.9562
The actual Tn values of youth categories 1 and 2, 19.3 °C and 20.0 °C, respectively (Regression Equations (12) and (14)), were higher than the respective predicted values, 19.1 °C and 19.4 °C (Regression Equations (13) and (15)).
M T S y o u t h   1 = 0.356 T o p 6.8783 ,   R 2 = 0.9244
P M V y o u t h   1 = 0.1514 T o p 2.8972 ,   R 2 = 0.9211
M T S y o u t h   2 = 0.4069 T o p 8.1534 ,   R 2 = 0.8791
P M V y o u t h   2 = 0.1564 T o p 3.0405 ,   R 2 = 0.9218
Different means of transportation will affect the thermal resistance values of clothing to a certain extent. For example, early young people usually use fewer private cars and more public transport such as subways and buses; therefore, when they go out, their clothing will be more determined by the outdoor temperatures and tend to provide greater insulation when outdoor temperatures are low. In contrast, more mature young people choose private cars more often and spend less time outdoors; therefore, their clothing is less affected by outdoor temperature. Therefore, Youth 1 had higher cold tolerance, and its actual Tn was approximately the same as the predicted Tn.
Figure 5 presents the Tn and comfortable temperature interval ranges derived from the MTS regression equation. The temperatures for MTS values of −0.5 and 0.5 were taken as the lower and upper limit comfort range values, respectively. Here, the blue square covers the 18–24 °C temperature range specified by national standards [7], whereas dashed lines indicate the “Acceptable” temperature limits falling outside this range.
The figure shows that the lower limit of children’s comfort range was markedly lower than that for adults, with a difference of 2–6 °C, suggesting that children can adapt more easily to cooler environments. In contrast, the lower limit of the middle-aged group’s comfort range was notably higher than that of all other age groups, indicating their preference for warmer environments. Children exhibited a wider comfort range than the other age groups, indicating their overall lower sensitivity to indoor temperatures than adults.

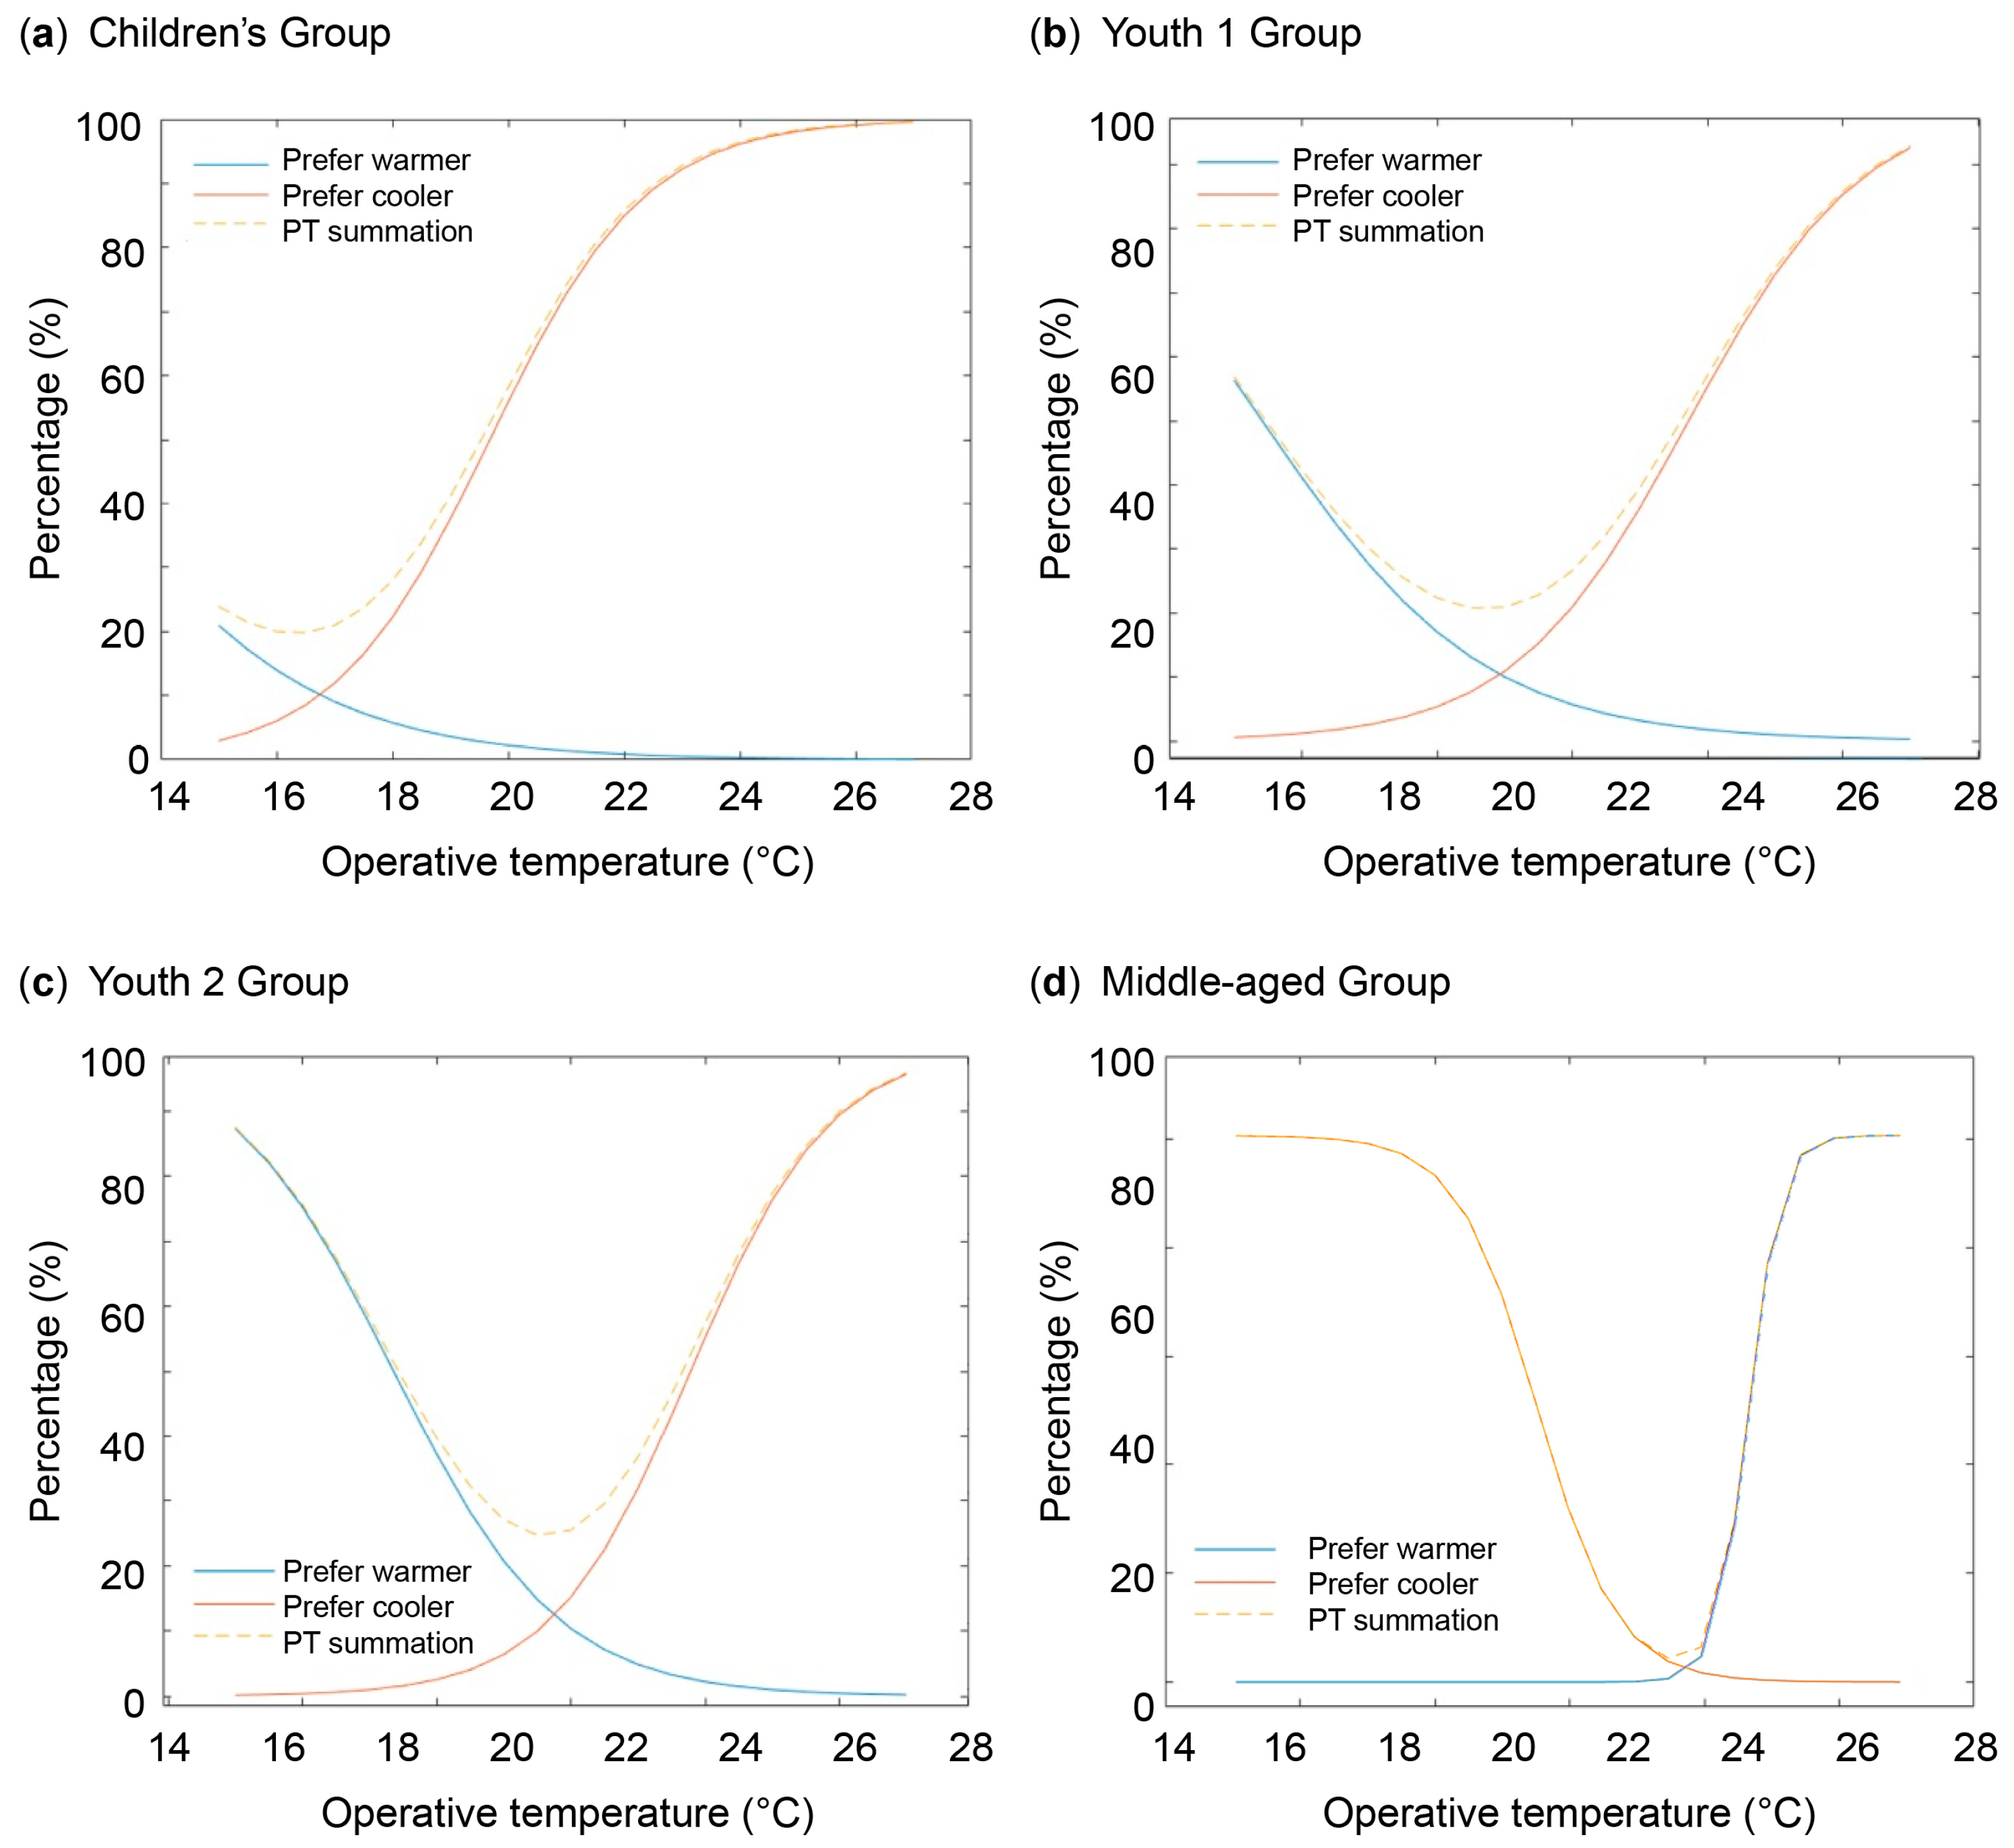
3.5. Preferred Temperature

PT has been extensively studied to determine people’s thermal expectations in actual environments [12,33,34]. The present study assigned values of either 0 or 1 to the Top expectation of each age group at different temperatures, where those who chose “expect cooler” were assigned a value of 1, and those who did not were assigned a value of 0. Those who chose “expect warmer” were assigned a value of 1, and those who did not were 0. These assignments were employed as the dependent variables, whereas the temperatures were used as independent variables for logistic regression analysis. The coefficients and statistics of the logistic regression equations for the PT judgments are presented in Supplementary S3. Table 5 shows the PT regression equations of each age group. Based on the equation coefficients, each age group’s judgment for “expect cooler” was positively correlated with Top, whereas “expect warmer” was negatively correlated. All equation coefficients were significant (p < 0.05), with those for the middle-aged group showing, particularly good explanatory rates (87.2% and 85.2% for expect cooler and expect warmer, respectively).
Based on the calculation using the equations, the expected temperatures were 16.8 °C, 20.9 °C, 21.4 °C, and 24.5 °C for the children, Youth 1, Youth 2, and middle-aged groups, respectively. The PT for the children’s group was notably lower than the Tn, further supporting children’s preference for slightly cooler indoor environments. The exponential function graph of the probability p of each expected temperature judgment for each age group was constructed in MATLAB (Copyright R2018b). These findings reflect the stronger sensitivity and reactions of the middle-aged group to temperature, as indicated by their greater reactions to slightly cooler or warmer environments (Figure 6).

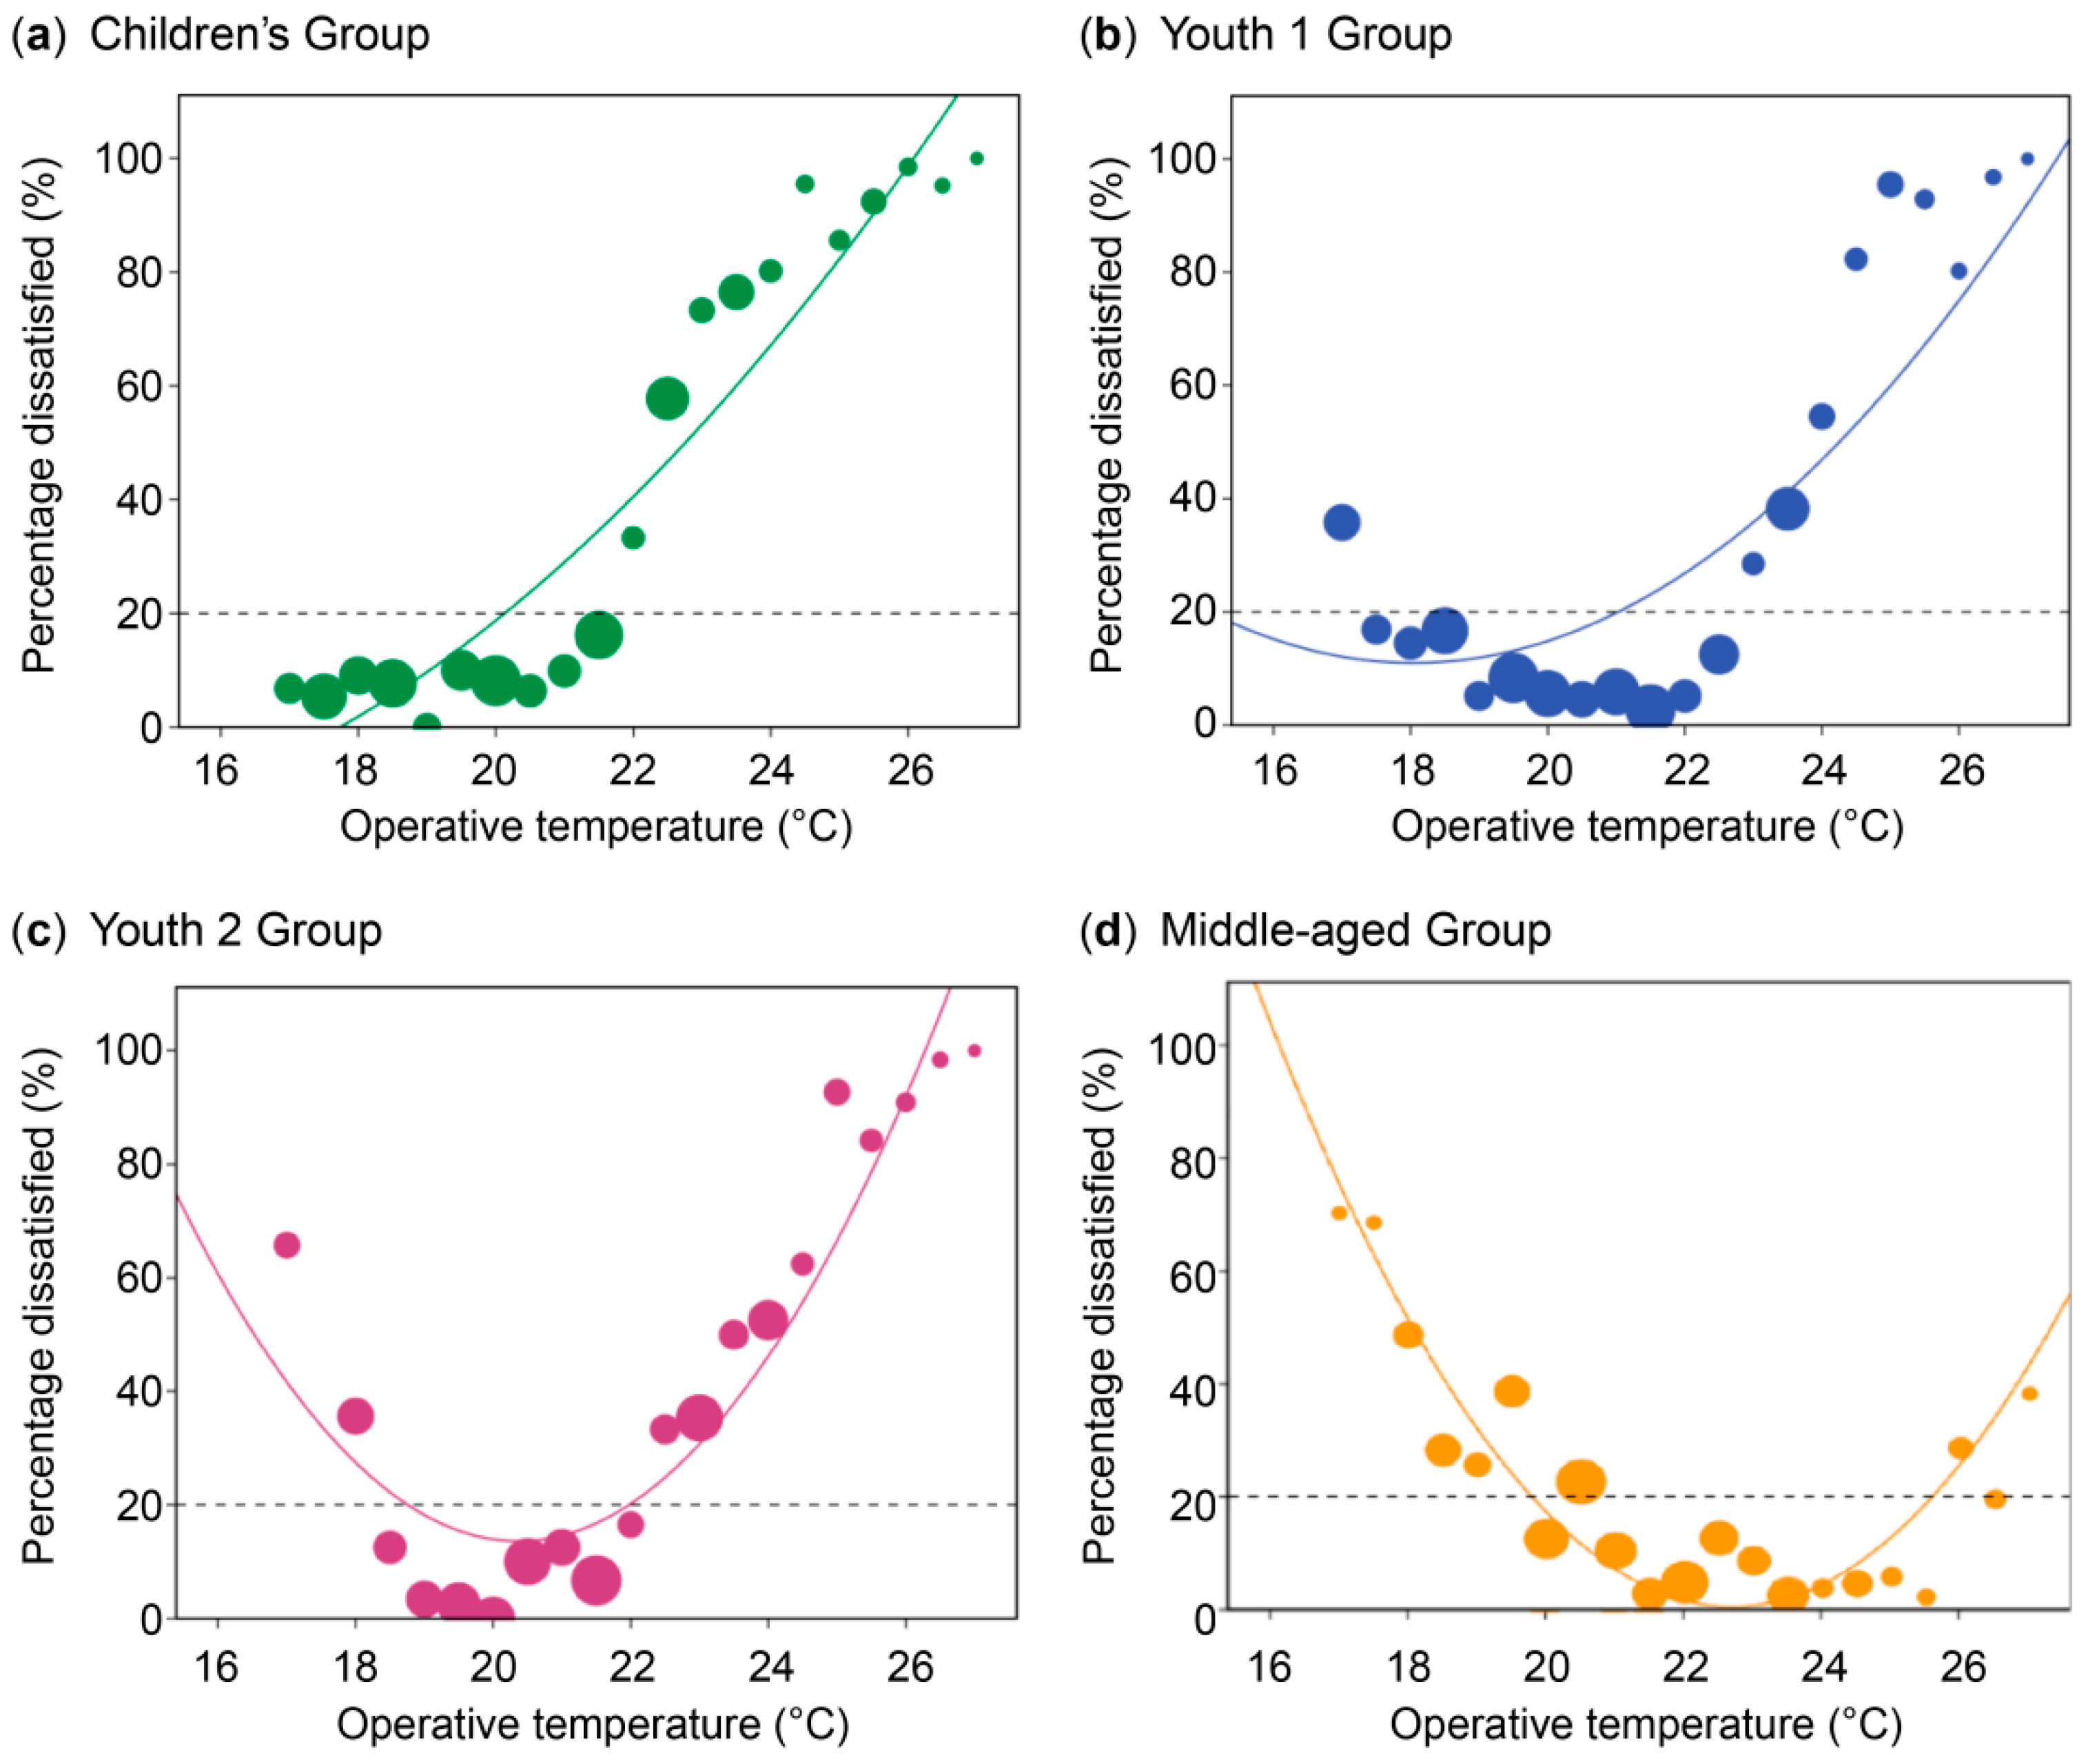
3.6. Thermal Acceptance Rate

A direct evaluation method was used in the survey to determine the thermal environment acceptability rate. To more intuitively express the curve change of acceptability, the TAV scores from “Just acceptable” to “Very acceptable” on the subjective evaluation scale were grouped as “Acceptable”. In contrast, TAV scores from “Very unacceptable” to “Just unacceptable” were considered “Unacceptable”. Quadratic regression of these scores against the corresponding T o p was performed. The relationship between the actual percentage dissatisfied (PD*) in each age group and T o p was obtained (Figure 7). The trend was described using a second-order polynomial equation (Table 6). The ASHRAE [19] and ISO 7730 [24] standards stipulate that an environment with an 80% acceptance rate (i.e., a temperature of predicted percentage dissatisfied (PPD) ≤ 20%) is the critical value for describing an indoor climate as “acceptable”. In the present study, the overall acceptable T o p temperature range was calculated to be 15–26.1 °C. Here, the lower limit of 80% acceptable range for children and Youth 1 was notably below the range of 18–24 °C presented in the GB 50736 design standard for temperatures in winter [6]. However, the indoor temperature in shopping malls can reach 29 °C, substantially higher than the upper 80% limit. Accordingly, this sector shows enormous potential for energy saving and efficiency improvements.
The operating temperature corresponding to the MTS of children was derived via Equation (9). When MTS = 0, PD* was 3%. Therefore, the sampled children in Shenyang did not express a strong opinion on the thermal environment, with the minimum value of PD* falling below the PMV predictions. When the temperature deviated from neutral levels, the predicted PPD increased faster than PD*, indicating children’s sensitivity to temperature was lower than the PMV prediction. This wider acceptable temperature range of children compared with the other sampled groups can be seen in Table 6.

4. Discussion

4.1. Adaptation Measures

Regarding clothing insulation, Figure 8 shows the values obtained for the different age groups in the shopping mall during winter. The average clothing insulation values were ranked as follows: middle-aged (1.36 clo) > Youth 1 (1.25 clo) > children (1.12 clo) > Youth 2 (1.1 clo). The middle-aged group had significantly higher clothing insulation than other age groups, followed by the Young 1 group (p < 0.05).
The variation in the average clothing thermal resistance with T o p over the different age groups is shown in Figure 9. Specifically, clothing thermal resistance was negatively correlated with T o p according to regression Equation (16). Owing to the influence of the winter outdoor climate; people tend to wear more clothes; thus, the adaptive behavior of customers inside shopping malls is substantially influenced by the indoor temperature, even though clothing adjustments can improve adaptability to current indoor thermal environments. Nonetheless, there are some limitations to the clothing-based adjustments because these are public places. People can adapt to a cool environment but feel uncomfortable in a hot environment. The equation slope coefficients in Equation (16) were −0.0493 for the children, −0.0272 for Youth 1, −0.0172 for Youth 2, and −0.0148 for middle-aged groups. These values reflect that children were more flexible in adjusting their clothing, partly owing to the assistance of their parents.
In contrast, middle-aged shoppers reported that removing their coats would hinder their activities. Coupled with their lack of sensitivity to relatively warmer environments, middle-aged shoppers adjusted their clothing to a lesser extent. For the children group, the regression had an R2 of 0.6226, similar to that observed by Teli et al. [29] concerning the relationship between children’s average clothing thermal resistance and operative temperature (R2 = 0.677).
{ C L O C h i l d r e n = 0.0493 T O P + 2.2206 ;   R 2 = 0.6226 C L O Y o u t h   1 = 0.0272   T O P + 1.7094 ;   R 2 = 0.5921 C L O Y o u t h   2 = 0.0172   T O P + 1.5063 ;   R 2 = 0.2354 C L O M i d d l e a g e = 0.0148   T O P + 1.549 ;   R 2 = 0.1627
Additionally, there was a significant correlation (p < 0.05) between the mean clothing thermal resistance and Top for the children and Youth 1 groups, indicating that both could more effectively adapt to the environment by adjusting their clothing (R2 values of −0.789 for children, −0.769 for Youth 1, −0.485 for Youth 2, and −0.403 for the middle-aged group; Table 7). These values were similar to the R2 values for the relationship between clothing thermal resistance and Top in severely cold regions reported by Zhaojun [35].

4.2. Differences in Heat Perception for Different Age Groups

The MTS values in each age group were further compared and analyzed (Figure 10). As supported by Figure 3c, children displayed both higher tolerance and satisfaction than adults in non-neutral situations. The comfort range of children shown in Figure 5 supports that children prefer cooler environments than adults [36]. Similarly, the regression equation gradients showed significant variability in MTS by age group. Children were sensitive to increasing temperatures, whereas middle-aged patrons were more sensitive to decreasing temperatures. Furthermore, children’s heat perception in cooler environments was higher than that predicted by the PMV model, a finding reported elsewhere [37,38].
The vertical change in the air temperature measured within the malls in the present study reached 10 °C (from 17.2 °C on the ground floor to 27.4 °C on the upper floors), with the vast majority of respondents reporting notably warmer indoor temperatures (Figure 3a; Table 4). This finding is likely related to each mall’s full-height atrium, glass ceilings, and local HVAC settings. During winter, mall HVAC managers typically set high temperatures to ensure patron comfort; however, this process leads directly to the vertical layering of the temperature distribution [39]. Accordingly, the observed overheating phenomenon in shopping malls’ middle and upper floors is consistent with the results of similar analyses [40,41]. By contrast, atriums without glass ceilings are more easily designed to meet the requirements for comfortable temperatures.

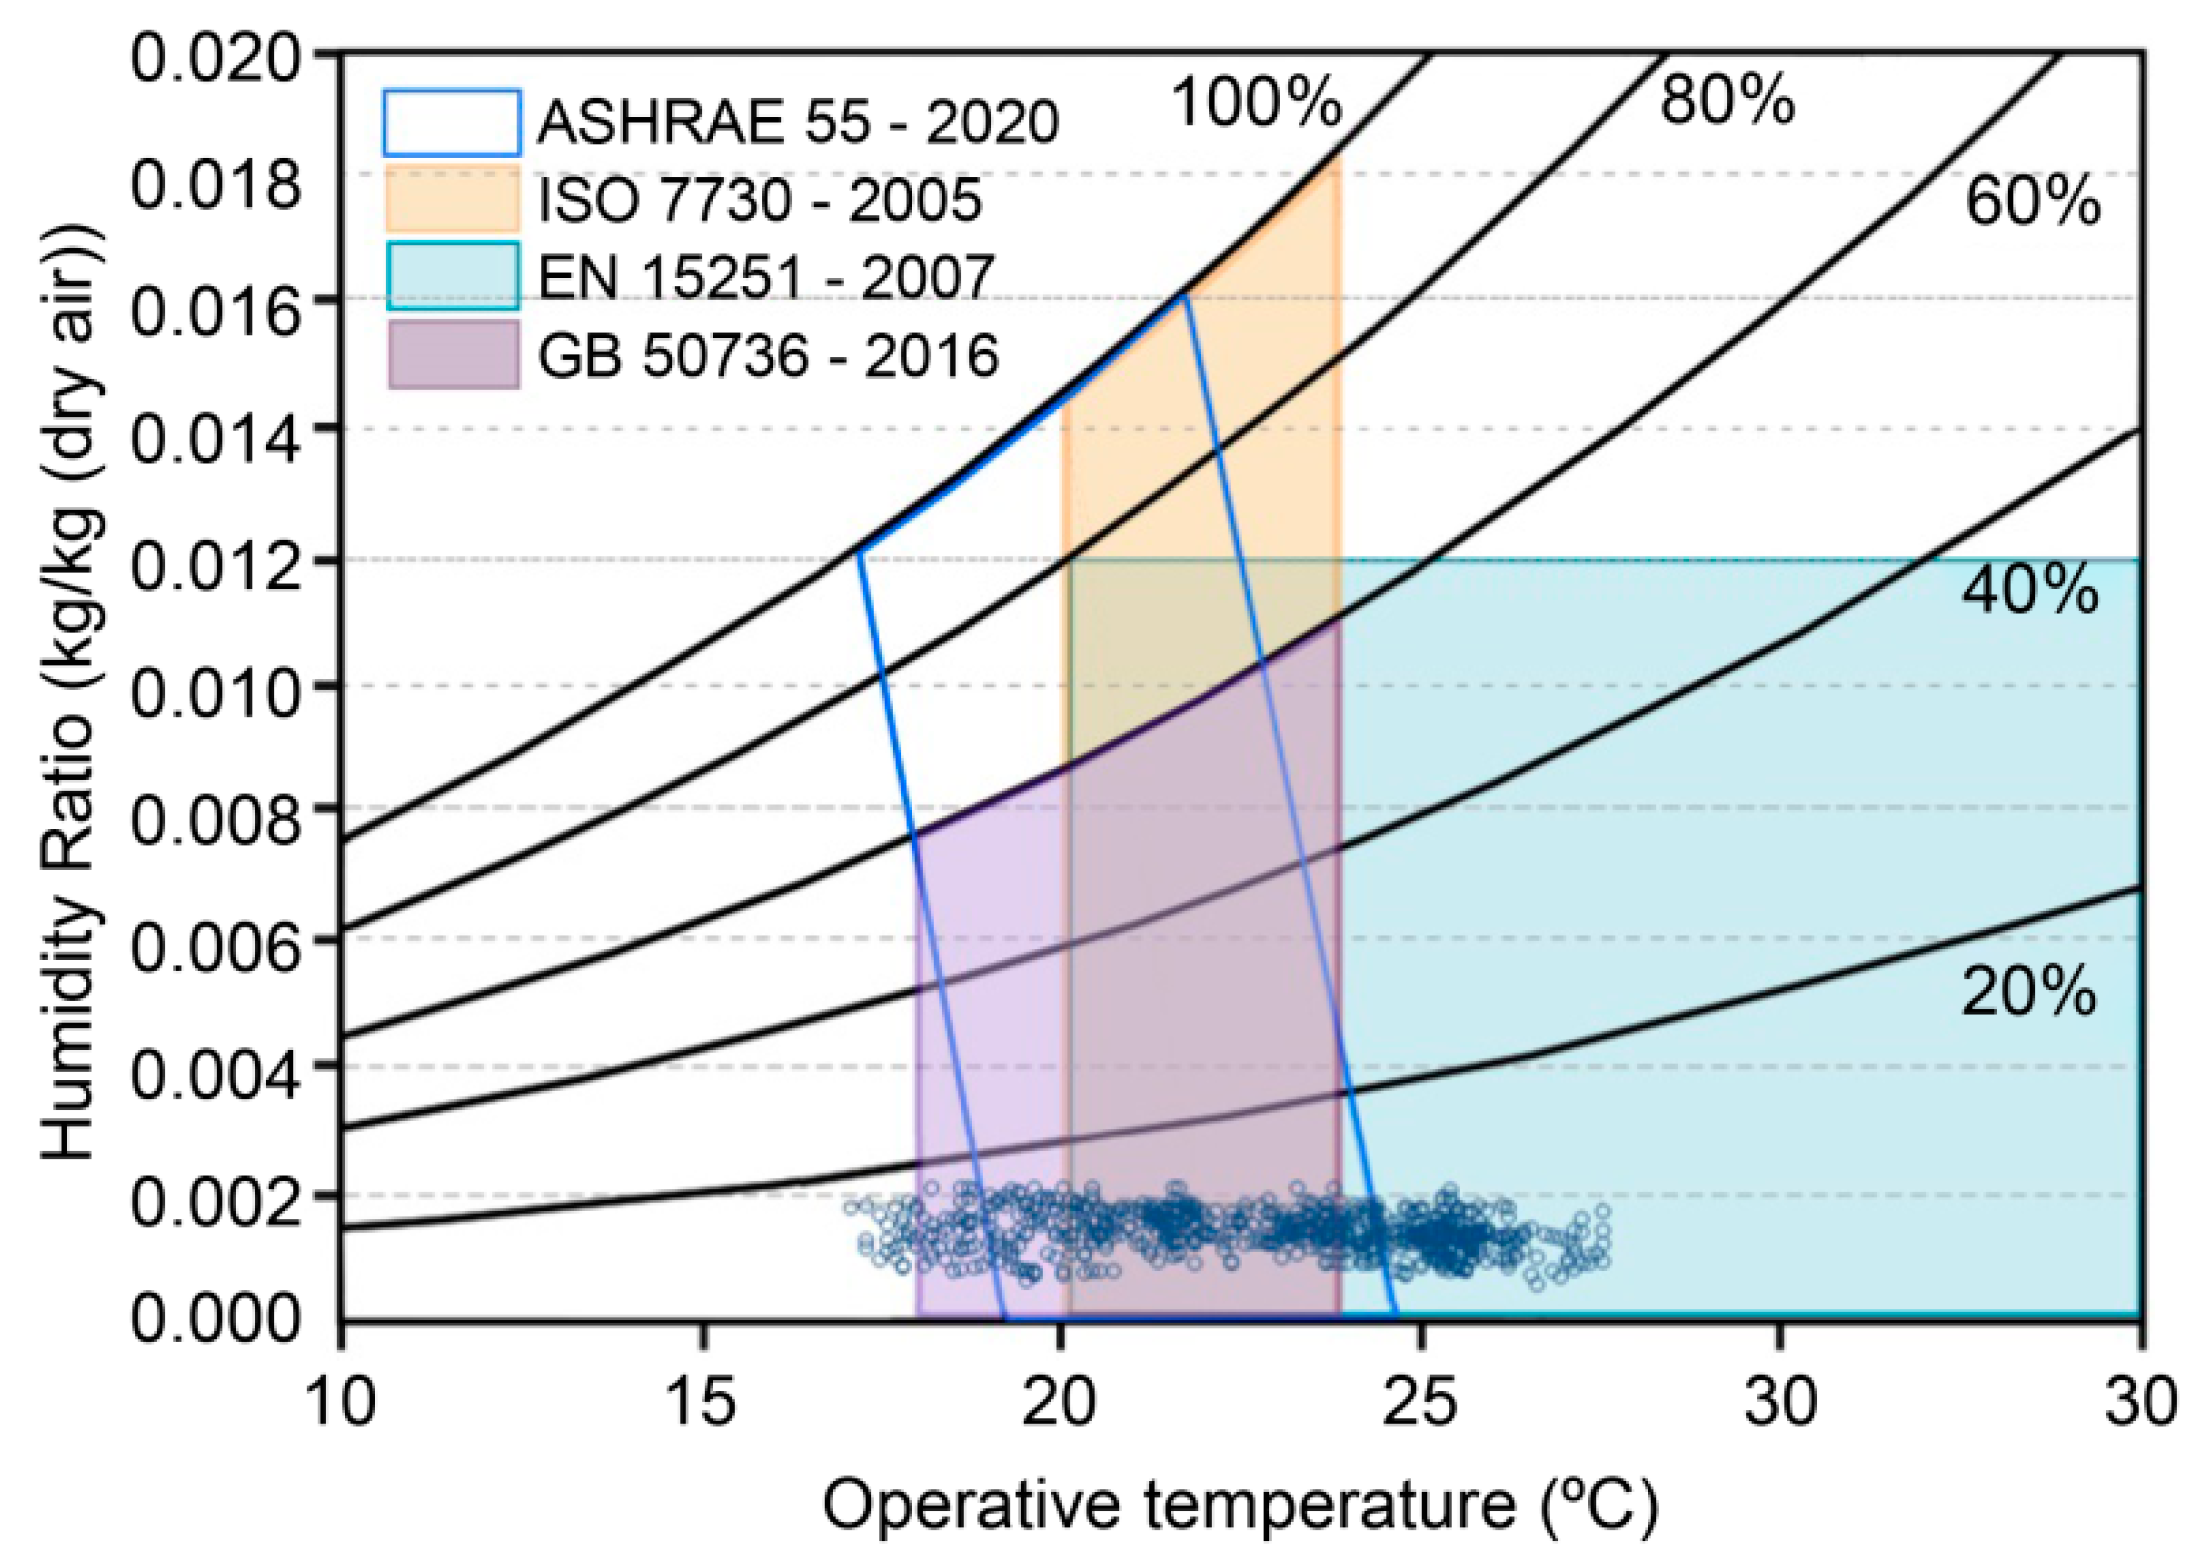
4.3. Comparison with Existing Standards

In severely cold regions, the winter is cold and long, the temperature difference between day and night is very large, and the indoor-heating environment is relatively closed. Under air conditioning or heating, the indoor thermal environment is less affected by outdoor conditions. It can be considered that the indoor neutral temperature does not change with the outdoor temperature [42]. Consequently, the remainder of this discussion does not focus on the relationship between the outdoor climate and indoor ambient temperature.
The comparison with the current standard is shown in Figure 11 (an enthalpy humidity chart). ASHRAE [19] provides the comfort zone of the indoor thermal environment in winter. This comfort range represents the thermal environment parameters in which the PMV index of the human body is within ±0.5 under conditions in which the human metabolic rate is between 1.0 and 1.3 met. The thermal resistance of winter clothing is 1.0 clo. The European design standard EN 15251 [43] refers to the minimum indoor temperature range during winter heating when the thermal resistance of winter clothing is 1.0 clo, and the metabolic rate is 1.2 met. The Chinese standard GB 50736 [6] specifies a comfort zone of 18–24 °C and RH ≤ 60%. The comfortable temperature ranges obtained in this survey were 15.7–19.0, 17.9–20.7, 18.8–21.3, and 22.2–24.4 °C for the children, Youth 1, Youth 2, and middle-aged groups, respectively. The ranges were lower than the standard comfort range for all groups except the middle-aged group. The thermal resistance of the clothing worn was higher than the 1.0 clo recommended by the standard. Of the respondents, 45.6% were in an environment beyond the thermal comfort range of Chinese standards. The lower limit of the acceptable temperature in this study was 3–5 °C lower than the standard. Hence, a significant gap exists between customers’ thermal needs in shopping malls and the various standards.

4.4. Comparison with Previous Studies on Thermal Comfort of Groups

This study yielded an overall winter comfort range of 15.0–22.1 °C in shopping malls within the severely cold area analyzed. Although this range was similar to that found in other studies [12,44,45], it was lower than the winter indoor comfort range according to the ASHRAE (19.5–23.0 °C) [19] and ISO 7730 standards (20.0–24.0 °C) [24]. Importantly, the main reason for this difference is that those standards are based on a metabolic rate of 70 W·m−2 and the thermal resistance value of clothing (0.155 m2·°C·W−1). Table 8 summarizes the main findings of previous studies on mall buildings and the thermal comfort of certain groups (mostly adults). The present study yielded Tn values of 17.38 °C for the children, 19.32 °C for Youth 1, 20.04 °C for Youth 2, and 23.3 °C for middle-aged groups, which are consistent with values obtained in numerous previous studies [8,12,41,46,47,48,49,50]. Comparatively, Zhang et al. [44] reported a Tn for people over 40 years of 17.9 °C, whereas that for those under 40 years was 18.5 °C. Although this pattern (a negative relationship between age and warmth) differed from that observed here, the overall comfort ranges derived were similar. Here, children were comfortable at temperatures ~3.5 °C lower than adults, notably 0.5 °C greater than that revealed by Yun et al. [51]; this may have been because the present study was conducted on participants in a moderately active state, which in turn affects metabolic rates and the corresponding comfort range. In the present analysis, children also displayed a slightly lower upper limit, but an equal lower limit to that reported by Chen et al. [45]. Regarding the acceptable winter indoor temperature range, the Tn values and comfort ranges in different regions can vary owing to different outdoor temperatures, resulting in differences in clothing insulation and activity type. Nevertheless, the results obtained here are similar to those of other studies, with slight variations observed among the different age groups.

4.5. Application of Thermal Comfort Needs by Age Group in Shopping Malls

Although many studies have examined thermal comfort, most have not differentiated between age groups, focusing instead on targeted representative locations such as kindergartens for children, high schools for adolescents, or offices and residential buildings for adults. As the age composition can be complex in various important public places such as shopping malls, hospitals, and subway stations, it is essential to analyze the characteristics of such target buildings and consider a variety of population groups to establish an optimal comfortable environment that satisfies most people in shared indoor spaces. Special attention must be paid to the comfort of children, as they are less able to make decisions regarding their clothing, which is often at the discretion of their guardians, and engage in a more diverse range of activities than adults. The thermal comfort of middle-aged people also demands additional attention regarding potential negative health impacts.
Based on the positioning of the mall, setting appropriate indoor temperatures that cater to the needs of the target consumer group remains important. The distribution of different retail formats in the mall, as shown in Table 3, attracts corresponding target consumer groups. Temperature control strategies can be adjusted depending on the consumer group and the purpose of each floor, and corresponding temperature values based on the actual conditions of distinct functional areas, such as children’s play, education and training, video games, and shopping and dining.
The analysis of subjective and objective data reveals that shopping malls in the Shenyang area face the issue of overheating during winter. By implementing appropriate temperature control strategies, while ensuring thermal comfort, segmenting according to age can better satisfy sustainable lifestyles, leading to reduced operating costs, resource consumption, and promoting low-carbon and green development goals.

4.6. Limitations and Future Research

In future studies, additional data on elderly people will be collected to improve the adaptive model for mall buildings in severely cold regions. In addition, this study did not consider the difference in gender demand for thermal comfort, as the sales areas for men’s and women’s wear in the shopping mall are separate and should be subdivided. Future research should attempt to obtain the thermal comfort temperature interval of each functional area according to the corresponding target group and simulate the comprehensive temperature setting of each functional area by considering the proportion of people of different ages. Finally, energy consumption analyses can be performed to more accurately evaluate the energy-saving potential during winter.
Future research will also conduct on-site analysis for other complex public building types with diverse age compositions, such as hospitals and subway stations. Additionally, differences in climatic regions will be explored to investigate the broader human thermal comfort experience.

5. Conclusions

A field survey of thermal comfort was conducted across four different shopping malls in Shenyang, a severely cold region of China. The different thermal comfort needs of each age group in shopping malls were analyzed, incorporating the measurement of environmental parameters along with subjective questionnaires. The following conclusions were drawn:
(1) From the perspective of physical environmental parameters, during winter in Shenyang, shopping mall buildings faced the common issues of relatively hot and dry indoor environments (RH = 10.0–22.5%), resulting in energy waste and customer discomfort. Indoor air temperature differed greatly during winter (17.2–27.4 °C), with 74.2% of the children, 67.7% of the early youth, 68.2% of the mature youth, and 49.2% of the middle-aged groups responding to “warm” thermal sensation. Accordingly, over 42% of consumers expected a cooler indoor environment than they experienced.
(2) The actual neutral temperatures for the children, Youth 1, Youth 2, and middle-aged groups were 17.4, 19.3, 20.0, and 23.3 °C, respectively. Additional variability (not only related to age) was observed based on outdoor climate and clothing adjustments. Furthermore, children were comfortable at temperatures ~3.5 °C lower than adults.
(3) The subjective survey data analysis revealed that the 80% acceptance operative temperature ranges were ~20.1, 15–21.1, 18.8–21.9, and 20.3–22.1 °C for the children, Youth 1, Youth 2, and middle-aged groups. The lower limits of the 80% acceptable temperature range for children and early youth were notably lower than the winter comfort range according to the GB 50736 [6] standard (18–24 °C).
(4) Children were more sensitive to increasing temperatures, whereas the middle-aged group was more sensitive to decreasing temperatures; therefore, it was observed that children were better adapted to lower-temperature environments, whereas middle-aged adults were better adapted to warm environments. Furthermore, middle-aged adults were more sensitive to overall temperature changes, expressing stronger expectations under slightly higher or lower temperatures. Children’s MTS also displayed a wider comfort range than that of adults, supporting the idea that children are less sensitive to indoor temperatures.
(5) The thermal comfort ranges of the different age-groups presented here can provide recommendations for a more effective optimal temperature control and sustainability objectives in shopping malls in severely cold regions during winter, potentially imparting energy-saving benefits and aiding the management of HVAC operations.

Supplementary Materials

The following supporting information can be downloaded at: https://www.mdpi.com/article/10.3390/su16156563/s1. Supplementary S1: Questionnaire for children; Supplementary S2: Definitions of TSV scales; Supplementary S3: Logistic regression equation coefficients and statistics for temperature sensing expectation judgments across each age group.

Author Contributions

Conceptualization, X.S., J.Z. and J.A.; Data Curation, X.S.; Formal analysis, X.S., Funding Acquisition, J.Z.; Investigation, X.S., J.A., C.D., X.Z. and L.C.; Methodology, X.S. and M.M.; Project administration, X.S. and J.Z.; Resources, J.Z.; Software, X.S. and M.M.; Supervision, J.Z.; Validation, M.M.; Visualization, X.S.; Writing—Original Draft, X.S.; Writing—Review and Editing, X.S., J.Z., J.A., C.D., X.Z. and L.C. All authors have read and agreed to the published version of the manuscript.

Funding

This research was funded by the National Natural Science Foundation of China [Contract No. 51678370; Recipient: Jiuhong Zhang].

Institutional Review Board Statement

The study was conducted in accordance with the Declaration of Helsinki, and approved by the Ethics Committee of School of Northeastern University.

Informed Consent Statement

Informed consent was obtained from all survey participants in the study.

Data Availability Statement

The datasets generated during and/or analyzed during the current study are available from the corresponding author on reasonable request.

Acknowledgments

We extend our gratitude to all the individuals who took part in the survey.

Conflicts of Interest

The authors declare no conflicts of interest.

References

  1. Du, X.; Zhang, Y.; Lv, Z. Investigations and Analysis of Indoor Environment Quality of Green and Conventional Shopping Mall Buildings Based on Customers’ Perception. Build. Environ. 2020, 177, 106851. [Google Scholar] [CrossRef]
  2. Wei, W. Research on the Breakthrough of Shopping Center in the Age of Inventory; Bus. News: Shenzhen, China, 2020; Volume 27, pp. 129–130. [Google Scholar]
  3. Zhang, L.; Zhou, J.; Hui, E.C. Which Types of Shopping Malls Affect Housing Prices? From the Perspective of Spatial Accessibility. Habitat Int. 2020, 96, 102118. [Google Scholar] [CrossRef]
  4. Construction Energy Efficiency Research Center. Annual Development and Research Report on Construction Energy Efficiency in China 2022; Tsinghua University (China Architecture Industry Press): Beijing, China, 2022. [Google Scholar]
  5. Fang, W. Investigation and Analysis of Building Energy Consumption of Large Shopping Malls in Shenyang. Constr. Budg. 2017, 04, 19–23. [Google Scholar] [CrossRef]
  6. GB 50736; Design Code for Heating Ventilation and Air Conditioning of Civil Buildings. Ministry of Housing and Urban-Rural Development of The People’s Republic of China: Beijing, China, 2016. (In Chinese)
  7. d’Ambrosio Alfano, F.R.; Dell’Isola, M.; Ficco, G.; Palella, B.I.; Riccio, G.; Frattolillo, A. Thermal Comfort in Supermarket’s Refrigerated Areas: An Integrated Survey in Central Italy. Build. Environ. 2019, 166, 106410. [Google Scholar] [CrossRef]
  8. Lu, L.; Tong, L.; Haiying, W.; Jinyu, L.; Hongyu, G. Research on Thermal Comfort of Different People in a Large Shopping Mall in Qingdao. J. Qingdao Univ. Sci. Technol. 2019, 40, 84–90. (In Chinese) [Google Scholar]
  9. Yan, J.W.; Zhu, B.; Zhou, X. Thermal Comfort About Two Groups of People in Shopping Mall During the Summer Season in Hot Summer and Warm Winter Region. Build. Energy Effic. 2018, 46, 84–88. [Google Scholar]
  10. Avantaggiato, M.; Belleri, A.; Oberegger, U.F.; Pasut, W. Unlocking Thermal Comfort in Transitional Spaces: A Field Study in Three Italian Shopping Centres. Build. Environ. 2021, 188, 107428. [Google Scholar] [CrossRef]
  11. Wang, J.H.; Hou, Q.F.; Ma, B.C. Test and Research on Indoor Thermal Environment of Lanzhou Mall Building in Winter. Archit. Eng. Des. Manag. 2014, 40, 67–69. [Google Scholar]
  12. Zhao, S.; Yang, L.; Gao, S.; Li, M.; Yan, H.; Zhai, Y. Field Investigation on the Thermal Environment and Thermal Comfort in Shopping Malls in the Cold Zone of China. Build. Environ. 2022, 214, 108892. [Google Scholar] [CrossRef]
  13. Sirhan, N.; Golan, S. Efficient PMV Computation for Public Environments with Transient Populations. Energy Build. 2021, 231, 110523. [Google Scholar] [CrossRef]
  14. Guohui, F.; Ziqiang, Z.; Jiasen, S.; Yong, H. Cause Analysis of Deviation of Measured Value of Human Thermal Sensation from Predicted Value. J. Shenyang Jianzhu Univ. (Nat. Sci.) 2013, 39, 525–530. (In Chinese) [Google Scholar]
  15. GB 50176-2016; Code for Thermal Design of Civil Buildings. Ministry of Housing and Urban-Rural Development of The People’s Republic of China: Beijing, China, 2016.
  16. ISO 7726; Ergonomics of the Thermal Environment—Instruments for Measuring Physical Quantities; International Organization for Standardization. ISO: Geneva, Switzerland, 1998.
  17. JGJ/T 347; Standard of Test Methods for Thermal Environment of Building. China Architecture & Building Press: Beijing, China, 2014.
  18. Ahmad, O.B.; Boschi-Pinto, C.; Lopez, A.D.; Murray, C.J.; Lozano, R.; Inoue, M. Age Standardization of Rates: A new WHO standard. World Health Organization, 2001, No. 31. Available online: https://www.researchgate.net/publication/284696312 (accessed on 29 July 2024).
  19. Thermal Comfort. Chapter 9. In ASHRAE Handbook Fundamentals; American Society of Heating, Refrigerating and Air Conditioning Engineers: Atlanta, GA, USA, 2020.
  20. Mellor, D.; Moore, K.A. The Use of Likert Scales with Children. J. Pediatr. Psychol. 2014, 39, 369–379. [Google Scholar] [CrossRef] [PubMed]
  21. Juan, Y. Study on the Influence of Physiological Thermal Adaptation on Thermal Response Under Different Indoor Thermal Experiences. Ph.D. Thesis, Donghua University, Shanghai, China, 2011; p. 11. [Google Scholar]
  22. Corgnati, S.P.; Ansaldi, R.; Filippi, M. Thermal Comfort in Italian Classrooms Under Free Running Conditions During Mid Seasons: Assessment Through Objective and Subjective Approaches. Build. Environ. 2009, 44, 785–792. [Google Scholar] [CrossRef]
  23. Yang, B.; Olofsson, T.; Wang, F.M.; Lu, W.Z. Thermal Comfort in Primary School Classrooms: A Case Study Under Subarctic Climate Area of Sweden. Build. Environ. 2018, 135, 237–245. [Google Scholar] [CrossRef]
  24. ISO 7730; Ergonomics of the Thermal Environment e Analytical Determination and Interpretation of Thermal Comfort Using Calculation of the PMV and PPD Indices and Local Thermal Comfort Criteria (International Standardisation Organisation). ISO: Geneva, Switzerland, 2005.
  25. Bouchard, C.; Tremblay, A.; Leblanc, C.; Lortie, G.; Savard, R.; Thériault, G. A Method to Assess Energy Expenditure in Children and Adults. Am. J. Clin. Nutr. 1983, 37, 461–467. [Google Scholar] [CrossRef] [PubMed]
  26. Havenith, G. Metabolic Rate and Clothing Insulation Data of Children and Adolescents During Various School Activities. Ergonomics 2007, 50, 1689–1701. [Google Scholar] [CrossRef] [PubMed]
  27. Ter Mors, S.; Hensen, J.L.M.; Loomans, M.G.L.C.; Boerstra, A.C. Adaptive Thermal Comfort in Primary School Classrooms: Creating and Validating PMV-Based Comfort Charts. Build. Environ. 2011, 46, 2454–2461. [Google Scholar] [CrossRef]
  28. Amorim, P. Energy Expenditure and Physical Activity Patterns in Children: Applicability of Simultaneous Methods. Ph.D. Thesis, Queensland University of Technology, Brisbane, QLD, Australia, 2007. [Google Scholar]
  29. Teli, D.; Jentsch, M.F.; James, P.A.B. Naturally ventilated classrooms: An assessment of existing comfort models for predicting the thermal sensation and preference of primary school children. Energy Build. 2012, 53, 166–182. [Google Scholar] [CrossRef]
  30. GB/T5701-2008; General Administration of Quality Supervision, Inspection and Quarantine of the People’s Republic of China. China Indoor Thermal Environmental Conditions; China Architecture Industry Press: Beijing, China, 2008.
  31. McCullough, E.A. A Comprehensive Database for Estimating Clothing Insulation; Kansas State University: Manhattan, KS, USA, 1984. [Google Scholar]
  32. Zhaojun, W. Selection of Thermal Comfort Indexes in the Field Study. J. HV&AC 2004, 34, 39–42. [Google Scholar]
  33. Singh, M.K.; Ooka, R.; Rijal, H.B.; Takasu, M. Adaptive Thermal Comfort in the Offices of North-East India in Autumn Season. Build. Environ. 2017, 124, 14–30. [Google Scholar] [CrossRef]
  34. Zander, K.K.; van Hoof, J.; Carter, S.; Garnett, S.T. Living comfortably with heat in Australia-preferred indoor temperatures and climate zones. Sust. Cities Soc. 2023, 96, 104706. [Google Scholar] [CrossRef]
  35. Zhaojun, W. Comprehensive Fuzzy Evaluation of Indoor Thermal Environment in Cold Area; Harbin Institute of Technology: Harbin, China, 2002. [Google Scholar]
  36. Hwang, R.-L.; Lin, T.-P.; Chen, C.-P.; Kuo, N.-J. Investigating the Adaptive Model of Thermal Comfort for Naturally Ventilated School Buildings in Taiwan. Int. J. Biometeorol. 2009, 53, 189–200. [Google Scholar] [CrossRef] [PubMed]
  37. Liu, Y.; Jiang, J.; Wang, D.; Liu, J. The Indoor Thermal Environment of Rural School Classrooms in Northwestern China. Indoor Built Environ. 2017, 26, 662–679. [Google Scholar] [CrossRef]
  38. Wang, D.; Jiang, J.; Liu, Y.; Wang, Y.; Xu, Y.; Liu, J. Student Responses to Classroom Thermal Environments in Rural Primary and Secondary Schools in Winter. Build. Environ. 2017, 115, 104–117. [Google Scholar] [CrossRef]
  39. Zhao, K.; Liu, X.; Ge, J. Performance Investigation of Convective and Radiant Heat Removal Methods in Large Spaces. Energy Build. 2020, 208, 109650. [Google Scholar] [CrossRef]
  40. Dang, R.; Yan, Z.W.; Liu, K.X.; Liu, G. Research on Indoor Thermal Comfort Evaluation Model for Large Commercial Complex in Cold Area in Winter. Build. Sci. 2017, 33, 16–21. (In Chinese) [Google Scholar] [CrossRef]
  41. Moosavi, L.; Mahyuddin, N.; Ab Ghafar, N.; Azzam Ismail, M. Thermal Performance of Atria: An Overview of Natural Ventilation Effective Designs. Renew. Sustain. Energy Rev. 2014, 34, 654–670. [Google Scholar] [CrossRef]
  42. Cao, B. Study on the Influence of Climate and Building Environment on Human Thermal Adaptability. Ph.D. Thesis, Tsinghua University, Beijing, China, 2012. [Google Scholar]
  43. EN 15251; Indoor Environmental Input Parameters for Design and Indoor Air Quality, Thermal Environment, Lighting and Acoustics. European Committee for Standardization (CEN): Brussels, Belgium, 2007; pp. 1–52.
  44. Zhang, P.H.; Niu, R.P.; Chen, Q.Z.; Dai, F.; Li, G. Field Study on Thermal Comfort of Marketplace in the Winter of Shenyang. J. Shenyang Inst. Civ. Eng. Archit. 2004, 20, 220–223. [Google Scholar]
  45. Chen, W.; Deng, Y.; Cao, B. An Experimental Study on the Difference in Thermal Comfort Perception between Preschool Children and Their Parents. J. Build. Eng. 2022, 56, 104723. [Google Scholar] [CrossRef]
  46. Han, X. Low-Power Design Strategy of Cold Region Commercial Building Based on Comfortable Thermal Environment. Master’s Thesis, Shenyang Architectural University, Shenyang, China, 2015. [Google Scholar]
  47. Simone, A.; Della Crociata, S.D.; Martellotta, F. The Influence of Clothing Distribution and Local Discomfort on the Assessment of Global Thermal Comfort. Build. Environ. 2013, 59, 644–653. [Google Scholar] [CrossRef]
  48. Xiaojian, W.; Hongxia, Y.; Shuai, H.; Ran, Y. Study on Indoor Thermal Comfort of Atrium Space in Commercial Complex in Autumn. Archit. Cult. 2022, 214, 197–199. [Google Scholar] [CrossRef]
  49. Ruina, Z. Research on Entrance Transition Space of Commercial Complexes in Hot and Humid Regions Based on Human Thermal Comfort; South China University of Technology: Guangzhou, China, 2020. [Google Scholar]
  50. Ce, H. Adaptive Model of Thermal Comfort in Frosty Zone; Harbin Institute of Technology: Harbin, China, 2013. [Google Scholar]
  51. Yun, H.; Nam, I.; Kim, J.; Yang, J.; Lee, K.; Sohn, J. A Field Study of Thermal Comfort for Kindergarten Children in Korea: An Assessment of Existing Models and Preferences of Children. Build. Environ. 2014, 75, 182–189. [Google Scholar] [CrossRef]
Figure 1. During the study period, there were daily outdoor air temperatures in Shenyang City (Liaoning Province, China).
Sustainability 16 06563 g001
Figure 2. Subjective thermal evaluation scale.
Sustainability 16 06563 g002
Figure 3. Subjective evaluation distributions across age groups.
Sustainability 16 06563 g003
Figure 4. Relationship between MTS and PMV for different age groups and indoor operative temperatures.
Sustainability 16 06563 g004
Figure 5. Neutral and comfortable temperature ranges by age group.
Sustainability 16 06563 g005
Figure 6. Warm and cold judgment cross charts of current temperature expectations for each age group: (a) children’s group, (b) Youth 1, (c) Youth 2, and (d) middle-aged.
Sustainability 16 06563 g006
Figure 7. Comparison of the actual 80% acceptance range in the different age groups.
Sustainability 16 06563 g007
Figure 8. Distribution of clothing insulation in each age group.
Sustainability 16 06563 g008
Figure 9. Relationships between average clothing thermal resistance and operative temperature.
Sustainability 16 06563 g009
Figure 10. Relationships between MTS and Top in each age group.
Sustainability 16 06563 g010
Figure 11. Comfort ranges of the existing standard thermal environments. The scatter points show the respondents’ thermal environment parameters.
Sustainability 16 06563 g011
Table 1. Characteristics of thermal environmental measurement equipment.
ParameterEquipment ModelRangeAccuracyEquipment Picture
HostJT2180Sustainability 16 06563 i001
Air Temperature (°C)JT2180−20 to 85 °C±0.5 °CSustainability 16 06563 i002
Black Globe Temperature (°C)JT2180 (50 mm)−20 to 85 °C±0.5 °CSustainability 16 06563 i003
Air velocity (m·s−1)JT21800.05–2.0 m/s
2.0–5.0 m/s
±(0.05 m/s + 2%)
±(0.1 m/s ± 2%)
Sustainability 16 06563 i004
Relative Humidity (%)JTR080–100±1.5% RHSustainability 16 06563 i005
RH, relative humidity.
Table 2. Descriptive statistics of the respondent sample group.
Age GroupAge Division (years)No. of SamplesHeight (cm)Weight (kg)
Children0–12452131.1 ± 20.330.7 ± 10.6
Youth 113–24324168.3 ± 12.258.2 ± 22.4
Youth 225–44424171.3 ± 11.866.1 ± 22.8
Middle-aged45–59264169.5 ± 11.567.3 ± 20.5
Table 3. Case-study information. (a) Description of the four shopping malls. (b) Proportions of indoor business types in each shopping mall. (c) Proportions of customers by age group.
(a)
NameArea (District)Commercial Area (m2)No. of FloorsNo. of Shops
Mall 1Dadong243,829Aboveground: 8 Belowground: 2717
Mall 2Heping103,900Aboveground: 4 Belowground: 1249
Mall 3Hunnan150,000Aboveground: 5 Belowground: 2418
Mall 4Heping240,000Aboveground: 8 Belowground: 2339
(b)
NameRetail (%)Catering (%)Children-Related (%)Entertainment (%)Life Services (%)
Mall 133.610.239.79.76.8
Mall 244.340.20.014.01.5
Mall 382.310.82.52.91.5
Mall 481.45.711.21.00.7
(c)
Name0–12 (%)13–24 (%)25–44 (%)45–59 (%)60+ (%)
Mall 132.04.755.23.74.4
Mall 22.761.431.73.70.6
Mall 38.321.855.011.23.7
Mall 43.416.030.939.710.0
Table 4. Overall environmental parameters and thermal resistance values of clothing.
ParameterMeanMin.Max.Std. Dev.
Ta (°C)23.117.227.42.45
Top (°C)23.817.429.52.93
RH (%)16.510.022.52.65
Va (m·s−1)0.100.010.240.04
Clo (clo)1.220.751.680.16
Table 5. Probability equations for warm and cold expectations of each age group at current temperatures.
RespondentRegression Equation for “Expect Cooler”Regression Equation for “Expect Warmer”PT (°C)
Children p = e 14.684   +   0.746   ·   t e 14.684   +   0.746   ·   t + 1 p = e 6.021     0.490   ·   t e 6.021     0.490   ·   t + 1 16.8
Youth 1 p = e 18.338   +   0.773   ·   t e 18.338   +   0.773   ·   t + 1 p = e 10.675     0.613   ·   t e 10.675     0.613   ·   t + 1 20.9
Youth 2 p = e 22.977   +   0.996   ·   t e 22.977   +   0.996   ·   t + 1 p = e 15.857     0.819   ·   t e 15.857     0.819   ·   t + 1 21.4
Middle-aged p = e 103.845   +   4.201   ·   t e 103.845   +   4.201   ·   t + 1 p = e 35.606     1.653   ·   t e 35.606     1.653   ·   t + 1 24.5
Table 6. Regression equations for the acceptable temperature range in the different age groups.
Age GroupEquation80% Acceptance Temperature Range (°C)
Children P D * = 0.0061 x 2 0.1468 x + 0.69
(R2 = 0.8954)
~20.1
Youth 1 P D * = 0.0101 x 2 0.3646 x + 3.3996
(R2 = 0.8024)
15.0~21.1
Youth 2 P D * = 0.0247 x 2 1.0063 x + 10.384
(R2 = 0.8728)
18.8~21.9
Middle-aged P D * = 0.0181 x 2 0.8338 x + 9.4353
(R2 = 0.7627)
20.0~26.1
PD*, percentage dissatisfied.
Table 7. Correlation analysis of mean clothing thermal resistance and Top in each age group.
ChildrenYouth 1Youth 2Middle-Aged
TemperaturePearson’s correlation−0.789 **−0.769 **−0.485 *−0.403
Sig. (2-tailed)<0.001<0.0010.0300.078
** Correlation is significant at the 0.01 level (2-tailed). * Correlation is significant at the 0.05 level (2-tailed).
Table 8. Summary of previous studies on shopping malls.
AuthorYearLocationTn (°C)80% Acceptance Range (°C)
Liu et al. [8]2018Qingdao, China22.6–––
Zhao et al. [12]2022Xi’an, China17.416.4–23.2
Dang et al. [40]2017Beijing, China19.816.3–23.3
Zhang et al. [44]2004Shenyang, China18.916.6–21.3
Chen et al. [45]2022Beijing, ChinaChildren: 20.1
Parents: 22.3
Children: 16.7–23.4
Parents: 20.7–23.9
Han [46]2015Shenyang, China19.117.3–20.8
Simone et al. [47]2013Italy; France20.316.0–21.9
Wang et al. [48]2022Handan, China22.117.7–27.3
Ruina [49]2020Guangzhou, China23.618.8–26.3
Ce [50]2013Harbin, China20.618.7–22.61
Yun et al. [51]2014Seoul, Korea22.1–––
Disclaimer/Publisher’s Note: The statements, opinions and data contained in all publications are solely those of the individual author(s) and contributor(s) and not of MDPI and/or the editor(s). MDPI and/or the editor(s) disclaim responsibility for any injury to people or property resulting from any ideas, methods, instructions or products referred to in the content.

