Abstract
In today’s increasingly competitive globalization, innovation is crucial to technological development, and original innovations have become the high horse in the fight for market dominance by enterprises and governments. However, extracting original innovative technologies from patent data faces challenges such as anomalous data and lengthy analysis cycles, making it difficult for traditional models to achieve high-precision identification. Therefore, we propose a Multi-Dimensional Robust Stacking (MDRS) model to deeply analyze patent data, extract leading indicators, and accurately identify cutting-edge technologies. The MDRS model is divided into four stages: single indicator construction, robust indicator mining, hyper-robust indicator construction, and the pioneering technology analysis phase. Based on this model, we construct a technological development matrix to analyze core 3D-printing technologies across the industry chain. The results show that the MDRS model significantly enhances the accuracy and robustness of technology forecasting, elucidates the mechanisms of technological leadership across different stages and application scenarios, and provides new methods for quantitative analysis of technological trends. This enhances the accuracy and robustness of traditional patent data analysis, aiding governments and enterprises in optimizing resource allocation and improving market competitiveness.
1. Introduction
With the continuous advancement of the new industrial revolution, market competition has become increasingly intense, and innovation has become the life force of technological development. Original innovations have a revolutionary impact on industries and are fundamental for businesses and governments to enhance their overall strength and secure a dominant market position. These innovations not only fundamentally advance industries by triggering new technological trends, opening new market demands, and initiating new cycles of creative development, but they also achieve fundamental transformations in production modes [1]. Globally, from governments to enterprises, various entities have proposed corresponding technological strategic plans to stimulate and foster original innovations [2]. For instance, to mitigate the financial crisis, the U.S. government implemented a series of policies, such as tax incentives, R&D funding, and research platforms, to encourage enterprises to engage in original innovations and stimulate economic growth [3]. Germany released its “National Industrial Strategy 2030” as early as 2019, aiming to support original innovations to maintain a leading position in the global market [4]. In 2024, China issued the “Guidelines for China’s Major Tax and Fee Incentives to Support Scientific and Technological Innovation”, intending to integrate various industries through governmental targeting, realize high-speed technological reforms and distinguish itself in the international arena through original innovations [5]. Apple Inc. has been adopting the strategy of ‘production first, technology first’, aiming to lead global trends through technological innovation [6].
The new technology strategic planning aims to anticipate future technological trends and application scenarios with a focus on medium- to long-term technological development and market demand [7]. It employs methods such as frontier technology exploration, interdisciplinary research, trend analysis, and industry foresight reports to predict and innovate, emphasizing creativity and foresight [8]. In contrast, traditional technology mining primarily optimizes and improves existing technologies, concentrating on enhancing their performance and efficiency and addressing specific problems [9]. This approach relies more on internal research and development (R&D) teams and existing resources with lower risk and relatively stable returns. However, new technology strategic planning requires substantial resource investment in basic research and long-term projects, including cross-departmental collaboration and external expert support [10]. Although this approach entails higher risks, its potential success could yield disruptive returns and market advantages. These factors indicate that there remains room for improvement in new technology strategic planning in terms of foresight, interdisciplinary collaboration, resource investment, and long-term returns [11].
Vertical extension and horizontal expansion of the technological levels based on pioneering technologies can drive industry innovation and reform [12]. In depth exploration of pioneering technologies can effectively reduce the misjudgment of technology direction by enterprises and governments in the process of technological innovation, improving the efficiency of technological innovation. An increasing number of researchers have conducted systematic and in-depth studies on pioneering technologies. For example, Arundel et al., based on PACE theory, conducted surveys and interviews with over 100 companies to summarize and refine the characteristics of pioneering technologies [13]. Byun et al. used patent data to select appropriate indicators and established a technological innovation model to analyze and predict the development direction of pioneering technologies in different fields, aiding enterprises in formulating technology development strategies [14]. Barragan-Ocana et al. designed standardized indicators to determine the technological leadership index, measuring and visualizing the development of innovative technologies across countries [15]. However, the current analysis of pioneering technologies mainly remains at the qualitative level, lacking comprehensive quantitative descriptions of their scope. Moreover, existing research primarily identifies pioneering technologies based on their application prospects in the industry with few studies focusing on technologies that have a long-term leading role. Pioneering technologies with original innovative significance are scarce, have a comprehensive technological base, a wide range of impacts, a long development cycle, and significant differences in external characteristics. These factors make it particularly difficult to accurately predict pioneering technologies with the potential for original innovations. As a result of these differences, pioneering technology mining demonstrates significant advantages in new technology strategic planning. Not only can it effectively fill the gaps in current research, but it can also provide new perspectives and methods in technology trend prediction, interdisciplinary cooperation, and resource allocation. Pioneering technology mining emphasizes future possibilities and long-term development and is committed to discovering and fostering technologies with transformative potential, providing strategic guidance for enterprises and governments to take the initiative in the fierce market competition.
In the modern technology-driven economic environment, patents serve as important carriers of innovative technologies, and the quality and quantity of patents have become key indicators for measuring innovation strength [16]. The publication of patents often precedes their market application, making the prediction and analysis of technological development trends through patent data particularly important. However, traditional patent analysis methods exhibit numerous limitations when addressing technological changes and market demand variations. For example, single indicators are susceptible to anomalous data when confronted with technological complexity and diversity, resulting in less accurate analytical results.
The stacking model integrates multiple base models and uses their predictions as input features for a secondary model, enhancing prediction accuracy [17]. By combining these predictions, stacking models effectively address the limitations of traditional patent analysis methods, improving their ability to cope with technological and market demand changes. Traditional stacking models typically employ simple models like linear regression as secondary models, achieving better predictive power [18,19]. Recent advancements in stacking models have increased their complexity and efficiency with deep learning techniques further integrating base model outputs nonlinearly. This expansion has broadened their application, notably in fields like financial forecasting and image recognition [20,21]. However, these traditional algorithms often have simplistic feature constructions, relying heavily on initial data and basic preprocessing, lacking specialized methods for handling anomalous data and capturing complex data relationships. They focus primarily on improving prediction accuracy with less emphasis on higher-level strategic analysis and applications.
To address these challenges, this study introduces a Multi-Dimensional Robust Stacking (MDRS) model, which innovatively handles patent data, enabling the precise identification of original innovative technologies and overcoming the limitations of existing methods in dealing with anomalous data and complexity. The MDRS model enhances the accuracy and robustness of technology predictions through comprehensive patent data mining and analysis. Its multi-stage analysis method effectively handles data anomalies and provides a thorough quantitative analysis of technology trends, offering theoretical and strategic insights for governmental and enterprise technological development plans.
Initially, the study constructs leading indicators from dimensions such as technology popularity, authority, and the inventor’s social relationships (ISRs), improving model input quality [22]. However, single indicators can lead to misjudgments when dealing with outliers, necessitating more robust methods. In the robust indicator mining phase, classical data mining models combine single indicators directly and indirectly, ensuring the model handles anomalies more effectively and guaranteeing composite metric reliability. To overcome outlier impacts on predictive accuracy, a ridge-shaped fuzzy membership function describes the nonlinear effects of leading indicators [23], while a constraint-nested model checks for redundancy and selects robust, comprehensive indicators, addressing the shortcomings of single indicators in dealing with technological complexity.
Although robust indicators improve analysis reliability, their predictive accuracy still requires enhancement. To solve this, the study introduces hyper-robust indicators by integrating neural network models, specifically the Backpropagation Neural Network (BPNN), enhancing prediction accuracy and robustness [24]. This approach ensures highly accurate predictive results, providing a more reliable basis for technological development planning. Compared to traditional stacking models that use simpler regression models, the innovative introduction of a neural network model for nonlinear integration significantly improves the ability to capture complex data patterns.
Existing research primarily focuses on the qualitative analysis of technology, lacking comprehensive quantitative descriptions of cutting-edge technologies and typically identifying them based on application prospects alone. This study fills this gap by constructing a technological development matrix based on the MDRS model results, analyzing the leading positions of upstream, midstream, and downstream technologies within the industry chain [25]. This method accurately identifies foundational innovative technologies across various sectors, providing deeper strategic insights and aiding governments and enterprises in formulating appropriate technological development plans.
The remainder of this paper is organized as follows: Section 2 reviews the research on pioneering technologies, the role of patent analysis in technology trend forecasting, and the shortcomings of existing studies. Section 3 then elaborates on the purpose, methods, and four stages of constructing the MDRS model. Section 4 provides a detailed discussion of data sources, selection criteria, and experimental results, demonstrating the application effects of the MDRS model in predicting 3D-printing technology and comparing it with traditional models. Finally, the study discusses the theoretical contributions of the MDRS model in the field of technology forecasting and innovation, emphasizing its practical application value in guiding technology strategic planning and promoting the development of 3D-printing technology. The study also points out the limitations and future research directions.
2. Literature Review
Pioneering technologies refer to groundbreaking technologies that hold a central position in their field, significantly influencing other technologies and contributing substantially to technological development. In other words, pioneering technologies are indispensable within their specific domains [26]. They play a crucial role in industrial diversification and stable development. Currently, the analysis of pioneering technologies primarily focuses on their qualitative characteristics. For example, at the content level, the construction of characteristic frameworks mainly relies on macro-background factors, such as market conditions, rather than on micro-characteristics like technology [27]. Recently, the quantitative analysis of patents has garnered scholars’ attention for the study of pioneering technologies. The citation relationships among patents can be objectively visualized through patent networks, allowing the measurement of each node’s core degree within the network [28]. One study explored the dynamic process of technological innovation by analyzing the relationship between collaboration networks and structural holes [29]. Additionally, patent citation networks have been used to identify emerging technologies by analyzing citation relationships and determining the importance of specific patents within the network [30]. However, the existing literature mainly analyzes pioneering technologies from a macro-perspective: from the market. Most methods are suitable only for identifying pioneering technologies in the growth and maturity stages rather than in the nascent stage. In addition, most research focuses on the impact of technology on the market from a corporate perspective, neglecting the characteristics of the technology itself [31].
Patent research enables a comprehensive analysis of trends in technological innovation, aiding companies and governments in developing strategic plans for research and proposing new commercial technology products, enhancing market competitiveness [32]. For instance, patent data can predict the development trends of photovoltaic technology, thus providing a scientific basis for companies to formulate their R&D strategies [33]. Most current patent mining methods use a fixed mining model to identify the dominant role of patents, ignoring the impact of anomalous pioneering technologies and long analysis cycles on predictive model performance [34]. Although existing methods can analyze the paths of technological innovation and evolution through patent citation networks [35], they exhibit significant limitations when it comes to identifying nascent technologies. For example, the study found that although patent citation networks can effectively analyze technological innovation paths, there are still deficiencies in early-stage technology identification, necessitating more methods and tools to address this gap [36]. In addition, machine learning and genetic algorithms were used to validate the effectiveness of the model, providing reference for improving the accuracy of technical recognition [37]. Therefore, identifying pioneering technologies in their early development stages is not only feasible but also necessary.
To overcome these shortcomings, this study proposes the MDRS model. This model extracts highly robust leading indicators that comprehensively reflect the characteristics of pioneering technologies, allowing for the accurate identification of pioneering technologies in the early stages of technological development. By using this model, this study can not only identify and predict emerging technology directions but also provide scientific strategic planning bases for technology development for companies and governments, effectively enhancing market competitiveness and technological innovation capabilities.
3. MDRS Model
This study aims to construct the MDRS model to identify and refine pioneering technologies. This objective is achieved through multi-dimensional analysis, a multiple-fusion model, a constraint-nested model, and BPNN. The core of the research revolves around the pioneering technology analysis framework for new technology strategic planning. The MDRS model encompasses four phases: the single indicator construction phase, the robust indicator mining phase, the hyper-robust indicator construction phase, and the pioneering technology analysis phase.
To maintain an edge in the complex environment of industrial transformation, firms and countries need to improve their market competitiveness through innovative products and technologies. This study proposes the MDRS model to identify pioneering technologies at different industrial stages. The model aims to help governments and firms develop appropriate, original, and innovative technology development programs in dynamic markets to maintain their core competitive positions. Patents with a high number of indirect citations and broad technological coverage are considered pioneering technology patents. Therefore, the study assesses the leadership of patents by considering the number of indirect citations and the scope of the technology areas covered. Figure 1 shows the framework of the MDRS model.
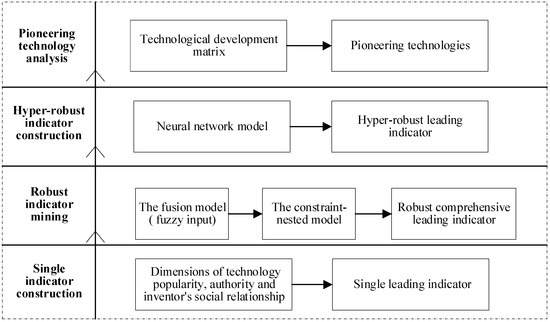
Figure 1.
Framework of MDRS model.
In the single indicator construction phase, this study systematically summarizes and describes the leading position of patents from three dimensions: technology popularity, authority, and ISR. The goal of this stage is to extract single indicators that can accurately reflect the leading position of technologies, thus laying a foundation for subsequent analyses. In the robust indicator mining phase, classic data mining models are employed to directly or indirectly combine single leading indicators to construct comprehensive leading indicators. These comprehensive indicators accurately delineate technologies that hold significantly diverse leading positions. To overcome the impact of outlier data on predictive accuracy, this study introduces the ridge-shaped fuzzy membership function to precisely describe the nonlinear influence of single leading indicators on the leading positions of technologies. Simultaneously, the constraint-nested model is used to check for redundancy and select robust, comprehensive leading indicators that can encompass the leading positions suggested by other indicators, ensuring the robustness and accuracy of the model. In the hyper-robust indicator construction phase, neural network models are incorporated to nonlinearly integrate single leading indicators and robust comprehensive leading indicators [38]. This process aims to further enhance predictive accuracy by ultimately constructing hyper-robust indicators. These hyper-robust indicators can more comprehensively reflect the technologies’ leading positions, providing a more reliable basis for technology development planning. Finally, in the pioneering technology analysis phase, based on the results of the MDRS model, a technological development matrix is constructed, analyzing the leading positions of upstream, midstream, and downstream technologies in the industry. Through this systematic analytical approach, strategically significant pioneering technologies can be accurately identified and refined. This provides valuable recommendations for governments and enterprises to formulate technology development plans for emerging industries.
3.1. Definition of Lead Size
Measuring technological leadership is a key issue in new technology strategic planning. Existing studies have extensively utilized patent citation data to assess the technological impact. For example, Balland et al. [39] investigated the technological resilience of US cities by analyzing the small-world characteristics and centrality of cities in the patent citation network, which provides important insights for assessing regional innovation systems and informing urban innovation policies. On the other hand, Trajtenberg [40] pointed out that patent citations are not only an indicator of innovation but also reflect the causal relationship between citations and cited patents. Meyer [41] compared patent citations with citations in the scientific literature, further revealing the complexity of patent citations within the network. However, existing studies mainly focus on direct patent citations, ignoring indirect citations and the breadth of technological fields. As indirect citations involve complex network structures, the impact of patents on the industry can be assessed more effectively. We propose using the lead size indicators to measure technology leadership, including the number of indirect patent citations and the number of International Patent Classification (IPC) categories. This approach overcomes the shortcomings of existing quantitative analyses. The leading size indicator not only provides a more comprehensive picture of the technological impact of patents but also reveals their widespread application in different technological fields. This method provides a new perspective for technology trend forecasting, interdisciplinary cooperation, and resource allocation, and it becomes an effective guiding tool for enterprises and governments in their strategic planning of new technologies. By adopting the leading size, groundbreaking technologies with the potential for original innovation can be more accurately predicted, gaps in existing research can be filled, and the accuracy and usefulness of measuring technological leadership can be improved.
The more frequently a patent is cited, the greater its impact within the field [27]. Patent citations can be categorized into direct and indirect citations. A direct citation occurs when Patent A is directly cited by Patent B, establishing a direct citation relationship. Indirect citation happens when Patent A is cited by Patent B, and subsequently, Patent B is cited by Patent C, creating an indirect citation relationship between Patent A and Patent C. Compared to direct citations, indirect citations are more numerous, and their citation distances and complex citation networks can more effectively assess the patent’s impact on the industry. Since pioneering technologies provide knowledge support for numerous patents and involve a wide range of technological fields, there is a positive correlation between the leading size of a patent and the number of indirect citations it receives as well as the scope of technological fields it covers (i.e., the number of IPC categories each patent includes). Consequently, this paper defines the leading size of a patent as follows:
where is the number of indirect citations, refers to the quantity of IPC contained in the patent itself, and indicates the value with the largest number of IPC in all patents belonging to the same subdivision as the patent. The greater the number of indirect citations and the technology involved, the greater the leading degree. Since the influence of the number of patent indirect citations on the leading size shows a decreasing effect, when the number of indirect citations reaches a certain value, the influence will decrease.
3.2. Construction of Single Leading Indicators
In new technology strategic planning, the mining and analysis of pioneering technologies is of great significance to the formulation of the direction of technological development and innovation strategies. Proposing and applying new indicators can provide a more comprehensive understanding of technological dynamics and trends and also improve the accuracy of forecasting technological impact and decision-making effectiveness. This study analyzes the characteristics of pioneering technologies from two perspectives: knowledge content perception and patent value significance perception. Knowledge content perception is mainly analyzed from the technology dimension, focusing on the degree of innovation and acceptance of the technology, and its core feature is the feasibility and scalability of the technology. These features make technology popularity one of the most important indicators of pioneering technologies. The perception of patent value significance, on the other hand, starts with the social attribution dimension, which mainly examines the R&D background of the patented technology, emphasizing the importance of patent authority and inventors’ social relationships, thus constructing a comprehensive evaluation system. This system consists of 11 single leading indicators that highly summarize the leading characteristics of the technology to ensure the completeness and accuracy of the indicators.
3.2.1. Technology Popularity
The current research on the measurement of technological leadership in new technology strategic planning primarily focuses on the novelty of technology, core foundational technologies, and the breadth and depth of the knowledge base. These characteristics are particularly important in defining early-stage pioneering technologies. A fundamental method of measuring such technology is through the analysis of patents using the IPC system. The IPC system classifies patents based on technological fields and functions, representing the principles or fields of technology. In the early stages, patents often exhibit a broad knowledge base but relatively weak technological depth due to the limitations of technology and market conditions. However, this breadth is crucial for guiding the development of various specialized fields later on. Tong and Frame [42] studied the relationship between the number of patents and patent value, noting that a higher number of patents generally indicates higher technological innovation value and quality. Despite significant progress in measuring technological leadership, current research still has some shortcomings, including insufficient attention to the dynamic relationship between patent characteristics and market conditions and inadequate research on the evolving nature of technological value over time. To address these issues, this study proposes the concept of technology popularity, which is defined by four key indicators: technological demand, technological differentiation, technological foundation, and technological importance. Integrating these indicators provides a more comprehensive assessment, leading to a deeper understanding of technological impact and potential. This approach not only fills gaps in existing research but also enhances the strategic planning process by providing a reliable tool for measuring leadership.
3.2.2. Authority
In today’s technology-driven global economy, metrics for measuring technological leadership are crucial for strategic planning especially for companies and research institutions focusing on pioneering technologies. Although recent research on technological leadership has become more diversified and in depth, significant gaps remain. Traditionally, technological leadership has relied on quantitative metrics such as the number of patents and citation counts. However, these metrics often overlook the quality and authority behind the patents, making it difficult to fully reflect the depth and breadth of technological innovation. Studies by Isobe et al. [43] and Tseng et al. [44] indicated that quantitative metrics alone are insufficient to measure the actual impact and application value of technology, necessitating more complex evaluation methods. Moreover, research shows that technological leadership is closely related to the background and authority of patent holders. Ziedonis [45] emphasized that the technological background and market position of patent holders significantly impact the actual value of their patents. Therefore, the evaluation of technological leadership should consider not only the patents themselves but also the comprehensive strength of the patent holders, including their specialization and market influence. However, existing research lacks an in-depth exploration of how to systematically evaluate the authority of patent holders, particularly in the context of international and cross-disciplinary technological development [46]. To fill this gap, this study proposes “authority” as a new dimension of technological leadership. Authority evaluates the authority of patent holders and their R&D background from four aspects: the scale and quality of the patent application country, the reputation and influence of the patent holders in the relevant technological field, the degree of specialization of the patent holders, and the global market share and technological innovation capability of the patent holders. This comprehensive evaluation method considers not only the quantity and citations of technological innovations but also deeply analyzes the background and authority of patent holders, providing a more accurate reflection of the actual impact and market value of technology.
3.2.3. ISR
ISR plays a critical role in the development and influence of pioneering technologies. Pioneering technology inventors (i.e., patent applicants) often exhibit strong social attributes in scientific research with core inventors placing greater importance on the social network of scientific research than ordinary inventors. When patent inventors have cooperative relationships and are from the same patent institution or geographical location, the probability of the patent being cited increases [47]. To fill gaps in existing research, we propose a new measurement metric—the ISRs. The ISRs consist of three key indicators: the self-citation relationship, the citation relationship, and the cooperation relationship. By quantifying the social relationship network of inventors, the ISRs can more accurately predict the leadership and development potential of technology. The self-citation relationship reflects the continuous investment and confidence of inventors in their research; the citation relationship demonstrates the recognition and influence of the technology among peers; and the cooperation relationship reflects the capability for interdisciplinary and inter-institutional collaborative innovation. The ISRs provide a more comprehensive and quantitative description of pioneering technologies, addressing the shortcomings of existing research in prospective prediction and the identification of long-term pioneering technologies. By introducing the ISRs, new technology strategic planning can more effectively identify and nurture transformative technologies, providing important support for strategic decision making in technological innovation for enterprises and governments [48,49].
This study fills existing research gaps by constructing and comprehensively analyzing systematic indicators for the three core dimensions of technology popularity, patent authority, and the ISRs. Specifically, this study constructs a set of systematic indicators, including 11 single leading indicators, based on the two levels of knowledge content perception value and patent value significance perception. These indicators highly summarize the leading characteristics of technology, ensuring their completeness and accuracy. By systematically integrating and analyzing the relationships between these indicators, this study reveals the dynamic mechanisms and influencing factors of technological development, providing new insights and methods for further research on pioneering technologies. Table 1 lists the 11 single leading indicators in the three dimensions of technology popularity, authority, and the ISRs.

Table 1.
Single leading indicators of patents.
3.3. Fuzzification of Single Leading Indicators and Construction of Robust Comprehensive Leading Indicators
3.3.1. Fuzzification of Single Leading Indicators
In the process of identifying pioneering technologies in new technology strategic planning, the adoption of fuzzy indicators holds significant importance and value. Existing research has already made progress in the field of fuzzy comprehensive evaluation. For instance, Zadeh [50] proposed the fuzzy set theory, which provided a fundamental mathematical framework for handling uncertainty and fuzziness, allowing researchers to quantify fuzzy concepts such as “pioneering” and “lagging”. However, there remains a paucity of research on how to apply these fuzzy methods to the actual analysis of technological leading indicators, especially in the specific context of new technology strategic planning. Moreover, Dubois and Didier [51] further developed fuzzy set theory by introducing the concept of fuzzy membership functions and offering practical tools for the quantification of fuzzy indicators. Nevertheless, how to determine the thresholds of fuzzy membership functions and adjust them based on actual data to enhance model adaptability and accuracy remains an underexplored area. Chen and Hwang [52] explored the application of fuzzy methods in multiple-criteria decision making, providing significant theoretical support for the fuzzification of technologically leading indicators. However, detailed methods and practical case studies on integrating fuzzified technological leading indicators with enterprise strategic planning to achieve technological innovation and market competitiveness remain scarce.
The leading patent technology indicators significantly differ from other patents, exhibiting distinct anomalous characteristics. Furthermore, the influence of different technology-leading indicators on technological leadership varies across different numerical ranges. To mitigate the impact of outliers on algorithm accuracy, we rely on expert experience and employ fuzzy methods to rationally quantify the technology-leading indicators at different levels. This is aimed at accurately describing the nonlinear impact of different technology-leading indicators across different numerical ranges, achieving a more detailed fuzzy comprehensive evaluation. Each leading indicator is fuzzified into five levels, and a ridge-shaped fuzzy membership function is constructed based on prior knowledge. Figure 2 shows an example of a fuzzy membership function. This study draws on the theory of interval fuzzy membership functions [50,51]. The range of characteristic values is determined by and , and an adaptive fuzzy membership model is established based on these values. and are two thresholds used for each indicator. The distance between the actual value of an indicator and these two thresholds allows for a more precise analysis of membership degrees. When the characteristic value is close to , the membership degree for the high-quality grade is larger; conversely, it is more likely to belong to a low-quality grade. The thresholds are determined based on the actual values of the indicators, selecting and that minimize the model’s mean squared error represents the limit value, which is the maximum value of each single leading indicator.
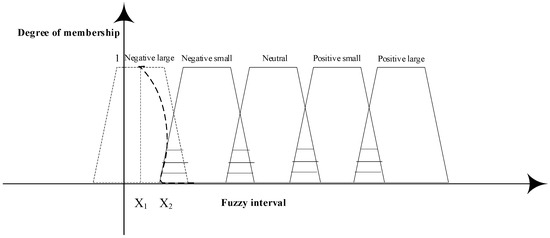
Figure 2.
The membership function of the evaluation indicator relative to each division level.
The model presented in this study utilizes a ridge-shaped fuzzy membership function derived from the sigmoid function. By categorizing five indicator levels, we developed an adaptively adjustable membership function to quantify the membership degree of each leading indicator concerning the leading role level of patent technology. Additionally, we established the relationship between two quality levels, as demonstrated in Equation (2), enabling a more precise determination of the overall positive effect’s membership degree.
where , and is the actual value of a single leading indicator. According to the size of , the effect level of a single leading indicator can be accurately analyzed. The value of ranges from 0 to 1. When the value is close to 1, it belongs to the higher (e.g., positive large) of the two adjacent quality levels, and when it is close to 0, it is classified as the low-quality level (e.g., positive small).
Defuzzification is a crucial step in fuzzy prediction analysis. Common techniques include the maximum membership method, the barycenter technique, and the weighted average method. To derive the mapping from a fuzzy set to a crisp set and convert the fuzzy value into an accurate output, it is essential to analyze the true and universal impact of each indicator on patents. To achieve a more precise fit of the leading effect of patents, we employed the barycenter method for defuzzification, as illustrated in Equation (3). For the discrete threshold case with (m) output quantization levels,
where is the membership function of formula (2), is the number of output levels, the value of in this study is 5, and represents the value of at the level.
3.3.2. Construction of Robust Comprehensive Leading Indicators
Current research on ensemble models has made significant progress. For example, Breiman [53] introduced the Random Forest method, which is a model that constructs multiple decision trees and integrates their results, excelling in handling complex data and improving prediction accuracy. In addition, Kuncheva [54] provided a detailed account of various classifier ensemble methods, including weighted averaging and voting. Hastie et al. [55] also explored the application of nonlinear models such as neural networks in data integration, further expanding the scope of ensemble models. Despite the rich theoretical and methodological support provided by existing research on ensemble models, several research gaps remain. Firstly, existing studies primarily focus on the algorithmic aspects of model integration with relatively little research on how to apply these ensemble models in the practical context of new technology strategic planning. Secondly, there is a lack of systematic methodological guidance on how to eliminate redundancy among indicators and enhance the effectiveness of comprehensive leading indicators through ensemble models. Finally, specific application cases for integrating ensemble models with corporate technology strategic planning to enhance technological innovation and market competitiveness are limited. This study aims to address these gaps by using various ensemble models to deeply explore single leading indicators and construct comprehensive leading indicators. The single leading indicators describe the technological leadership characteristics from different dimensions. To ensure the accuracy of these indicators, this study employed multiple-fusion models, including direct fusion models like regression and indirect fusion models like neural networks. These models deeply mine the single leading indicators to construct comprehensive indicators that accurately depict the leading role of technologies with significantly different leadership characteristics. The specific fusion models used are shown in Table 2.
Table 2.
Direct and indirect fusion models.
The study constructs multiple constraint-nested equations through 14 comprehensive leading indicators and uses t-tests to further refine these indicators, ensuring they are suitable for diverse leadership characteristics. Based on the significance of the test results, robust, comprehensive indicators that can effectively cover the leadership roles of other indicators are selected, ensuring no correlation or redundancy among the selected indicators. Figure 3 shows the framework of the constraint-nested test model for leading indicators.
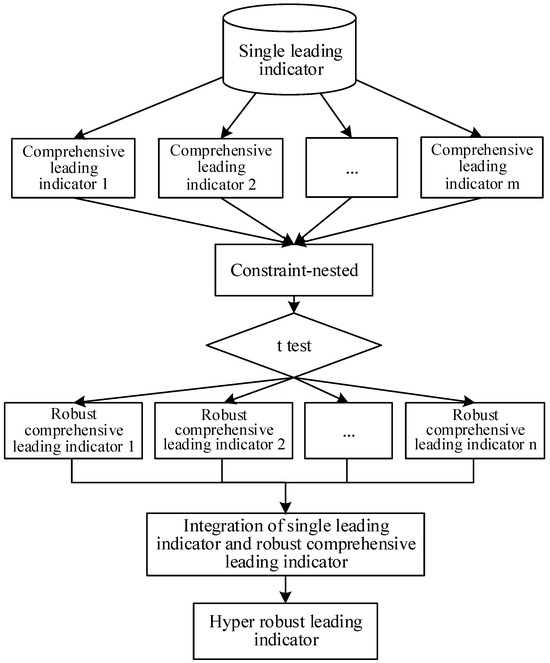
Figure 3.
The constraint-nested test model of leading indicators.
The specific test process for the constraint-nested model is as follows. The first step is to set up the multiple linear regression model by taking each comprehensive leading indicator as the independent variable and the true value of technology leading size as the dependent variable, as shown in Formula (4). The second step is to select the coefficient of a comprehensive leading indicator arbitrarily from Formula (4), consider the pairwise linear correlation between it and other indicator coefficients, and then construct the hypothesis , as shown in Formula (5). The third step is to perform a -test using Formula (6) and analyze whether the test result is significant. In step 4, if the comprehensive leading indicator is nested in other indicators, i.e., is accepted, it is redundant and should be removed. In step 5, repeat the first four steps until each comprehensive leading indicator is tested, and robust comprehensive leading indicators that are not nested by other indicators can be screened out one by one.
In these formulas, is the unconstrained model, and are the constant, is the model parameter composed of comprehensive leading indicators, and is the regression coefficient of the corresponding parameter.
The statistic index of the -test is as follows.
where is the sample estimated value of , and is the standard error value of .
3.4. Construction of Hyper-Robust Leading Indicators
In the process of identifying pioneering technologies in new technology strategic planning, constructing hyper-robust, comprehensive technological leading indicators is of significant importance and value. Single leading indicators and robust, comprehensive leading indicators systematically summarize the technological leadership characteristics based on patent data. However, to predict pioneering technologies early and improve the accuracy of robust indicators, this study combines a neural network model to nonlinearly integrate single leading indicators and robust comprehensive leading indicators, constructing hyper-robust leading indicators with high precision and strong robustness. Using these hyper-robust leading indicators can effectively avoid judgment errors and omissions caused by abnormal data, enhancing the scientific reliability of overall technology strategic planning.
Current research on neural network models has achieved significant progress. For example, Rumelhart et al. [56] first proposed the backpropagation algorithm, providing an effective method for training neural networks. Subsequently, Ciresan et al. [57] presented a flexible and high-performance convolutional neural network model that showcased the powerful nonlinear mapping and efficient learning capabilities of deep neural networks, furthering the work on applying gradient-based learning methods to visual recognition tasks. Moreover, Hinton and Salakhutdinov [58] introduced deep belief networks, significantly improving feature extraction and data integration through multi-layer neural network training. Despite the rich theoretical and practical support provided by existing research on neural network models, several research gaps remain in their specific application in new technology strategic planning. Firstly, existing research mainly focuses on algorithm optimization and the performance improvement of neural networks with relatively little research on how to apply these models to the actual integration and analysis of technologically leading indicators. Secondly, there is a lack of systematic methodological guidance on how to use a neural network model to construct hyper-robust leading indicators, ensuring high precision and strong robustness of the indicators. Finally, specific application cases for integrating the neural network model with technology strategic planning to enhance technological innovation and market competitiveness are limited.
To fill these research gaps, this study adopts the BPNN model to nonlinearly integrate single leading indicators and robust comprehensive leading indicators, constructing super-robust leading indicators with high precision and strong robustness. Specifically, utilizing the adaptive learning capability of the BPNN model, this study deeply explores and extracts indicators that truly reflect technological leadership characteristics and graphically demonstrate the working mechanisms of these models.
BPNN is a classic neural network model known for its adaptive learning and nonlinear mapping capabilities, which ensure high accuracy and efficiency in analysis. Leveraging BPNN, this study further explores and extracts super-robust leading indicators that most accurately reflect leading features from single and robust comprehensive leading indicators. The goal is to analyze the leading status of each technology, aiding governments and enterprises in formulating effective technological strategic plans. The diagram of BPNN is shown in Figure 4.
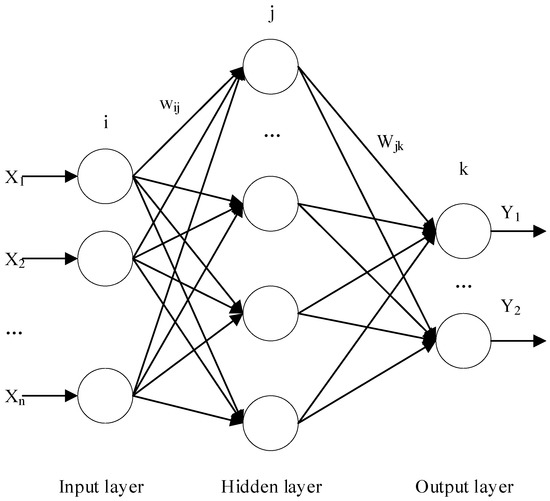
Figure 4.
Diagram of 3-layer BPNN.
Here, is the input value, i.e., the single leading indicators and robust comprehensive leading indicators, and is the number of input nodes. is the connection weight value between input layer node and hidden layer node . is the connection weight value between the hidden layer node and output layer node . is the output value, i.e., the leading size of technology.
3.5. Technological Development Matrix
Accurately identifying original innovative technologies at various positions in the industrial chain is crucial in new technology strategic planning. To this end, this study proposes a new technological strategic matrix, the technological development matrix, aiming to construct a more precise identification system based on the leading size and position of each technology to help governments and enterprises formulate more reasonable development plans for original innovative technologies.
The pioneering technological development matrix conducts an in-depth analysis of the leading size of each technology. To more accurately identify original innovative technologies at different positions in the industrial chain, the technological development matrix classifies technologies based on their upstream, midstream, and downstream positions in the industrial chain, according to the model’s analysis results. This approach combines technological advantages and strategic objectives to select appropriate pioneering technologies, formulating correct development plans for original innovative technologies.
The authority of pioneering technologies can be summarized in two dimensions: technical breadth and technical depth. Technical breadth refers to the scope of the technology’s influence; the larger the leading size, the more technological fields it can influence. Technical depth indicates the position of the technology within the industrial chain, as illustrated in Figure 5, which encompasses the upstream, midstream, and downstream sectors of the industry. The development potential of technology varies significantly across these industrial chain positions. For instance, in the case of 3D printing, upstream technology focuses on fundamental technologies like materials, which have a broad impact on other technological fields. Conversely, downstream technology is primarily concerned with application fields, which have a more limited scope of influence.

Figure 5.
Three-dimensional (3D)-printing technology industry chain.
Current research on technology evaluation and identification has made some progress. For example, Porter and Newman [59] used technology influence indicators in patent analysis to provide a quantitative basis for technology evaluation. Zhu and Guan [60] emphasized the role of technology networks in the process of technological innovation, demonstrating the complexity and importance of technological interconnectedness. Although these studies provide important insights into technology evaluation, research gaps remain in the area of new technology strategic matrices. Firstly, existing methods rarely consider the segmentation and evaluation of technologies at different positions in the industrial chain. Secondly, there is a lack of systematic methods and empirical research on how to combine technological breadth and depth to construct a comprehensive evaluation system. Finally, existing research focuses more on the evaluation of single technologies, while comprehensive analysis and strategic planning across multiple technology fields remain insufficient.
This study attempts to fill the above research gaps through the technological development matrix. Specifically, this matrix segments technologies based on technological breadth (scope of impact) and technological depth (position in the industrial chain), dividing technologies into nine quadrants by combining vertical technological breadth and horizontal technological depth. This matrix comprehensively assesses the actual position and impact of technologies in the industrial chain, providing an innovative identification and evaluation tool for enterprises and governments in technology strategic planning and helping to better identify and leverage the potential of original innovative technologies, effectively enhancing technological innovation capability and competitiveness.
As shown in Figure 6, the technological development matrix is divided into nine quadrants based on vertical technology breadth and horizontal technology depth. Considering the industrial stage of the pioneering technologies, the technical breadth is categorized into three sections: downstream, midstream, and upstream. The quadrant is determined by the position of the technology within the industry chain. According to the technology leading size predicted by the model, the technical depth is segmented into three levels: low, medium, and high. If the predicted leading size of the technology is less than η, it is classified as low. If the size falls between η and θ, it is classified as medium. If the size exceeds θ, it is classified as high. The matrix, therefore, comprises nine parts with four levels of categorization: low, medium, high, and authority.
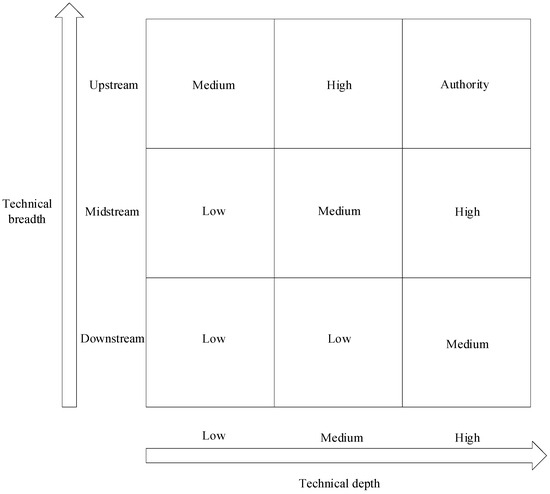
Figure 6.
Technological development matrix.
3.5.1. Low Level
When both the technical breadth and depth are low, or one is medium while the other is low, the technology is classified as low-level technology. Technologies in this category have minimal influence on other technologies within the industry, involving few technical fields and indirect citations. At this level, the leading role of such technologies in the industry is not significant, making them unsuitable as focal points for enterprises and governments.
3.5.2. Medium Level
When both technical depth and breadth are at a medium level, or one is high while the other is medium, the technology is classified as medium-level technology. Technologies in this category have a moderate influence on industrial development and tend to impact specific technical fields significantly. These technologies are suitable for enterprises and governments to conduct strategic research and planning in certain technical areas.
3.5.3. High Level
When either technical depth or breadth is high, while the other is medium, the technology is classified as high-level technology. Technologies in this category have a significant influence on the technological development and transformation of the entire industry, often holding a leading position in most technical fields. These technologies are critical for enterprises and governments aiming to achieve strategic technological advancements.
3.5.4. Authority Level
When both technical depth and breadth are high, the technology is classified as authoritative. Technologies in this category are highly influential both in terms of the number of technical fields they encompass and their leading role within the industry. Despite being foundational and widely referenced due to their early development, the scope for expansion and innovation is limited. Consequently, such technologies are not ideal for strategic technological development. Given their fully explored potential, the opportunities for breakthrough innovations are minimal, and thus enterprises and governments need not prioritize these technologies heavily.
4. Analysis of Experimental Results
4.1. Experiment Data Set
As an emerging industry [61], the 3D-printing industry is still in its development stage. To capture the market’s strategic high ground and maintain strong competitiveness, companies must identify industry trends in advance and engage in original technological innovation. Thus, this study selects the 3D-printing industry as the experimental case for the MDRS model. By analyzing the evolution of 3D-printing technology through patent information, pioneering technologies for original innovation can be identified.
The Derwent Database, the most comprehensive international patent database, contains over 14 million basic patents and 20 million utility patents. Therefore, this study used it as the source of experimental data [62]. The search criteria were set to topic = 3D printing and time span = 1963–2018, yielding 7015 related patent records. Ultimately, 1500 valid patents were selected based on their patent indicator values.
4.2. Parameter Analysis of MDRS Model
In this section, the influence of different values of X1 and X2 on the accuracy of the MDRS model was analyzed. The mean squared error (MSE) of the model was used to determine the optimal thresholds. When assessing the impact of a single leading indicator’s X1, all other indicators’ X1 and all X2 values were held constant. X1 ranged from 0.1 to 0.5, and X2 ranged from 0.5 to 1.0, with increments of 0.1 for each experiment. The optimal thresholds of X1 and X2 for each single leading indicator are presented in Table 3.
Table 3.
Fuzzy membership thresholds of 11 single leading indicators.
4.3. Results of the Constraint-Nested Test
Using the constraint-nested test model principle, this study analyzed the validity and redundancy of 14 comprehensive leading indicators. Each indicator was tested individually to ensure the robustness of the comprehensive leading indicators.
When = 0, the comprehensive leading indicator was tested. The critical value for the t-test was set at 1.98, which was based on a significance level of 0.05 [63]. If the t-test result for the constraint-nested model was less than 1.98, the corresponding comprehensive leading indicator was deemed redundant, as shown in Table 4. Seven comprehensive leading indicators—REG1, REG3, REG4, REG5, BPNN, GRNN, and SVM—were found to be robust. These single and comprehensive leading indicators were then input into the BPNN for a comprehensive analysis of the patent technology’s leading size.
Table 4.
The t-test results of the constraint-nested model of comprehensive leading indicators.
To verify the effectiveness of the hyper-robust leading indicators constructed by BPNN, comparative experiments were carried out to compare its performance with other conventional prediction models, which predicted the leading size of the technology based on the single leading indicators. As shown in Table 5, the average MSE of the MDRS model is the lowest compared to conventional models, indicating that the prediction based on hyper-robust leading indicators is more accurate. Specifically, the LTDMM model achieved the lowest MSE of 0.28, whereas the SVM model had the highest MSE of 1.33. Other models, including various regression models and BPNN, had intermediate MSE values ranging from 0.47 to 0.80. These results demonstrates that the comprehensive evaluation model is practical for evaluating and identifying pioneering technologies in the 3D-printing industry and confirms that the fusion model has a stronger generalization ability, effectively improving prediction outcomes.
Table 5.
Comparison of prediction error among MDRS model and conventional models.
To further validate the effectiveness of the constraint-nested model, this study introduced a novel comprehensive evaluation model, the Non-Constraint-Nested Pioneering Technologies Detection and Measurement model (NO-MDRS model). This model bypasses the redundancy test for comprehensive leading indicators and incorporates all 14 indicators into the analysis of patent technology’s leading size. The maximum, minimum, and average error values of the two models were extracted for comparison.
Table 6 reveals that the maximum, average, and minimum MSE of the constraint-nested MDRS model are lower than those of the NO-MDRS model. Specifically, the maximum MSE for the constraint-nested MDRS model is 0.43, while it is 0.56 for the NO-MDRS model. The average MSE for the constraint-nested model is 0.28 compared to 0.47 for the NO-MDRS model. Lastly, the minimum MSE for the constraint-nested model is 0.24, whereas it is 0.35 for the NO-MDRS model. This indicates that the constraint-nested model efficiently removes redundant indicators and identifies robust, comprehensive leading indicators that encapsulate the leading effects of other indicators, enhancing the MDRS model’s robustness. Furthermore, the constraint-nested model effectively mitigates the impact of outlier characteristics on the model’s predictive performance. Consequently, the constraint-nested MDRS model is highly dependable and capable of accurately assessing the leading size of various technologies.
Table 6.
Comparison of prediction error between MDRS model and NO-MDRS model.
4.4. Technological Development Matrix of the 3D-Printing Industry
The market demand for the 3D-printing industry is diverse and dispersed, leading to varying development trends across different technical fields [63]. To thoroughly analyze the leading role of patent technology, this study categorized the technical fields into upstream, midstream, and downstream sectors of the 3D-printing industry. As illustrated in Figure 6, the upstream sector mainly involves basic materials like plastic and metal. The midstream sector encompasses printing equipment and manufacturing technologies. The downstream sector includes application fields of the 3D-printing industry, covering various industries such as medical and food.
In the context of the rapid development of modern industry and technology, 3D-printing technology has become an important force to promote change in various industries. To scientifically plan and manage the development of 3D-printing technology, the 3D technological development matrix built based on the MDRS model provides a clear classification of technology depth and breadth through a comprehensive analysis of the leading scale and industry position of each patented technology. This matrix not only provides a theoretical basis for enterprises and governments to formulate technology strategies but also helps to clarify the role and value of different technologies in the industrial chain by refining the classification of technologies.
First, using the MDRS model, the leading size of each patent technology was analyzed and predicted. All patents within the same technical field were integrated using the IPC for a comprehensive analysis. This enabled a deep analysis of the pioneering technological potential in the 3D-printing industry. When analyzed from the perspective of industry position, significant differences were found in the leading sizes of various technologies. Based on the prediction results, the development space for the industrial technology field was summarized and refined. As shown in Figure 7, the technological development matrix was constructed with a classification coefficient η set to 4 and θ set to 13. Considering the urgency and benefit of strategic technology deployment by enterprises and governments, this study divided the development space of the technology field into two categories: small and large. Based on their position in the technological development matrix, patent technologies worthy of attention have been identified.
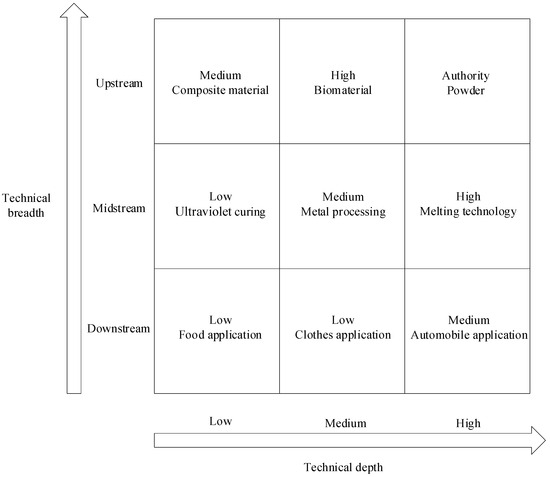
Figure 7.
The technological development matrix of the 3D-printing industry.
4.4.1. Low-Level Technology: Food Application and Clothes Application
Food applications and clothing industry technologies are classified as low-level technologies, meaning that their technical depth and breadth are low. Food application technology has the potential for personalized food manufacturing and nutrition control but has less impact on the industry. Existing studies mostly focus on its technical implementation [64], but there are insufficient studies on market promotion and consumer acceptance. Therefore, it is recommended to integrate health trends into strategic planning, develop personalized and nutrition-controlled foods, and strengthen market promotion and consumer education to fill the gaps in market application research. Although the technology depth of the clothing industry is medium, the breadth is low, and the influence is limited. However, 3D-printing technology has significant advantages in clothing customization and rapid response to market demands [65]. It is suggested that through cooperation with fashion designers and brands, the application of 3D printing in the customized production of clothing should be enhanced, the market coverage should be expanded, and the market acceptance should be enhanced to make up for the shortcomings of the market application research of apparel 3D-printing technology.
4.4.2. Middle-Level Technology: Automobile Application, Metal Processing, and Composite Material
Technology in the automobile industry is classified as a mid-level technology with high technical depth and low breadth. Three-dimensional (3D)-printing technology has significant advantages in the manufacturing of auto parts [66], but most of the existing research focuses on technical realization and pays insufficient attention to its standardization and large-scale application. It is suggested to deepen cooperation with automobile manufacturers, promote the standardization and scale application of 3D-printing technology in parts production, and fill the research gaps in this field. As a medium-level technology, the depth and breadth of metal processing are medium. This technology has significant application potential in many fields, but existing research has focused on its technical realization [67]. It is suggested that in strategic planning, the research, development, and application of metal processing technology in the fields of aerospace and high-end manufacturing should be promoted, the universality and application depth of the technology should be improved, and the research gap in metal processing technology in the field of high-end manufacturing should be filled. Composite material is classified as a medium technology because its technical depth is low and its breadth is high. This technology has shown strong application potential in several fields. It is suggested to increase investment in the R&D of composite technology, encourage the application of composite technology in multiple fields, such as aerospace and construction, improve its market coverage and technical influence, and make up for the research gaps in the application of composite technology in multiple fields.
4.4.3. High-Level Technology: Melting Technology and Biomaterial
Melting technology is a high-level technology; its technical depth is high and its breadth is medium. This technology has a significant impact on the development of the entire industry [68]. It is recommended to promote the innovation of smelting technology in strategic planning, especially the development of new materials and alloys, improve the adaptability and application breadth of technology in many fields, and fill the research gap of smelting technology in the application of new materials. Biomaterials are classified as high-level technologies with medium technical depth and high breadth. Biotechnology has important applications in the medical and pharmaceutical fields [69]. It is suggested to strengthen cooperation with medical and pharmaceutical companies, promote the application of biotechnology in personalized medicine and drug R&D, enhance its industry influence, and make up for the lack of research in personalized medicine applications.
4.4.4. Authoritative Level Technology: Powder Industry Technology
The technology of the powder industry is classified as authoritative technology with high technical depth and breadth. Despite its limited scope for expansion and innovation, it is highly influential in several areas [70]. It is recommended to focus on the maintenance and optimization of the technology to ensure its dominance in key areas. Through continuous optimization and maintenance, the long-term performance and lasting influence of the technology are maintained, and the research gap in the continuous influence of authoritative technology is filled.
In technology fields with limited development potential, both enterprises and governments should consider reducing their research investments when formulating technology strategic plans. Technologies classified as low, medium, or authority in the technology development matrix have relatively small innovation and expansion potential. Consequently, obtaining significant benefits from these fields requires a substantial long-term investment in human and material resources, which can hinder the rapid development and economic efficiency of enterprises. For instance, the field of 3D-printing food technology is situated at the downstream application level of the industry. It offers limited support and integration with other technical fields, thus restricting its horizontal expansion potential. Additionally, due to the extensive R&D duration and maturity of the technology, its vertical expansion potential is also constrained. Conversely, in technology fields with substantial development potential, enterprises and governments should focus on vigorous development. Technologies in the high category of the matrix exhibit significant industry-leading characteristics and occupy middle- to upper-stream positions within the industry. These technologies are highly influential and supportive of other technical fields. Given their considerable leading capacity and expansive development potential, strategic investment and research in these technologies can lead to transformative breakthroughs. Furthermore, these fields can integrate with other technologies to foster innovation. For example, melting technology, while a molding method in the 3D-printing industry, can also be applied to solid waste treatment and other areas, creating new market segments and fulfilling emerging user demands [71].
In conclusion, the new technology strategic planning based on the 3D technological development matrix not only enriches the research of technology management and strategic planning in theory but also provides a scientific basis and operational guidelines for the promotion and application of 3D-printing technology in practice. Through systematic analysis and precise quantification of the depth and breadth of technology, it can effectively guide enterprises and research institutions to develop more targeted and forward-looking technology development strategies and promote the comprehensive development and technological innovation of the 3D-printing industry.
5. Conclusions and Implications
Breakthrough innovations stem from original innovation research, which is a crucial method for helping enterprises gain a competitive edge in the fiercely competitive market. The core of original innovations lies in identifying frontier technologies that lead industry innovation and technological expansion. By the early identification and screening of leading technologies and formulating correct development plans for original innovative technologies, companies and governments can effectively reduce misjudgments regarding technological directions in the innovation process, improving the efficiency of technological innovation. However, due to the scarcity of leading technologies, their metric values significantly differ from other technologies, displaying outlier characteristics, which poses substantial challenges to the prediction of pioneering technologies.
Therefore, this study proposes a pioneering technology mining method that delves deeply into pioneering technologies to reduce misjudgments by enterprises and governments during the innovation process and improve innovation efficiency. Compared with the study by Kim and Bae [72], which suggests a novel approach to forecasting promising technology using patent analysis, our research presents a Multi-Dimensional Robust Stacking (MDRS) model that can more precisely predict frontier technologies. In addition, our research emphasizes original innovation and frontier technology more than the approach by Park and Yoon [73], who explore technological opportunities for convergence by predicting potential technological knowledge flows between heterogeneous fields; our MDRS model delves deeper into analyzing and mining frontier technologies from patent data, providing more targeted technological development strategies for enterprises and governments. Furthermore, compared to Liu et al. [74], who developed a method for mapping the technology evolution path using a non-parametric topic model, our study incorporates multiple patent indicators to improve the comprehensiveness and accuracy of technology path mapping. By proposing the MDRS model, this research systematically enhances the accuracy and robustness of technology trend predictions, particularly in the analysis of patent data. It achieves the construction of single, robust, and hyper-robust indicators. These indicators, through comprehensive patent data analysis, describe the leading characteristics of technologies and overcome the limitations of traditional analysis methods.
5.1. Theoretical Implications
The innovative MDRS model presented in this study represents a significant advancement over traditional patent data analysis methods. Conventional approaches often rely on single-dimensional indicators and are susceptible to outlier data, resulting in lower prediction accuracy. For instance, some studies have highlighted the limitations of traditional single-dimensional models in capturing the complexity and dynamism of technology evolution, which MDRS effectively addresses [75,76]. Our MDRS model overcomes these limitations by integrating multi-dimensional single leading indicators to construct robust composite indicators, which are further enhanced through nonlinear fusion using BPNN. This approach markedly improves both the accuracy and robustness of predictions, providing a novel methodology for the quantitative analysis of technology trends. Furthermore, by analyzing technology leadership across dimensions such as technology popularity, authority, and the inventor’s social relationships, this study uncovers the intrinsic mechanisms of technological leadership at various stages and application scenarios. This multi-dimensional analysis enriches the theoretical framework of technological innovation and leadership, offering a solid foundation for future research. The work of Fleming et al. on the importance of inventor networks in technological advancement further supports our findings on social relationships as a critical dimension [77]. In addition, the study underscores the importance of interdisciplinary cooperation in technological strategic planning, introducing new methods and tools for integrating and applying data across multiple disciplines, fostering effective resource allocation and collaborative innovation.
5.2. Practical Implications
The application of the MDRS model provides precise guidance for technology strategic planning, which is demonstrated by the 3D-printing technology strategic planning support matrix. This matrix offers a clear theoretical basis for formulating development strategies, helping to identify core technologies at various industrial stages. This guidance enables rational resource allocation, facilitating feasible technology plans and enhancing market competitiveness. Echoing the practical implications discussed by McAfee et al., in their study on strategic planning in the AI industry, our model’s application also underscores the necessity of tailored strategies for different technological contexts [78].
Moreover, the model’s ability to identify long-term leading original innovation technologies reduces misjudgments in technology direction, improving the efficiency of innovation processes for enterprises and governments. This aligns with the conclusions of Rohrbeck et al. [79], who emphasized the value of accurate technology forecasting in minimizing strategic risks. By focusing on the 3D-printing industry, the study offers insights into technology trends and strategic value, supporting emerging industries’ growth. For the 3D-printing industry, the government should formulate a special development plan, promoting the coordinated development of upstream and downstream enterprises in the 3D-printing industry chain, forming a complete industrial ecosystem. Implementation strategies include using the MDRS model to regularly analyze 3D-printing technology trends, creating differentiated policy support systems for various stages of development (e.g., R&D support, market promotion, talent introduction), promoting industrial clustering and collaborative innovation. The evaluation mechanism should establish a set of industry development indicators for the 3D-printing sector (such as technological innovation capability, market size, and completeness of the industry chain), regularly assessing the industry’s development status and adjusting and optimizing policy measures based on evaluation results.
All in all, the findings assist governments in formulating policies that support original innovation technologies, optimizing tax incentives, R&D funding, and other measures, and ultimately fostering technological innovation and economic growth in enterprises.
5.3. Future Research
Despite the MDRS model’s ability to accurately predict the development potential and industry trends of technology, this study has several limitations that require improvement in future research. The current analysis is limited to the examination of leading characteristics of patent technology from the perspective of technical content and the background of patent development, overlooking the influence of other dimensions such as the specific details of patent content. This limitation may affect the comprehensive evaluation of technological leadership capabilities, as the details within the patent text often contain critical innovation information and potential application scenarios. Future research should delve deeper into the content of patent texts and combine quantitative and qualitative analytical methods to assess the impact and innovativeness of technology, providing a more comprehensive and accurate assessment of technological leadership capabilities.
Additionally, in certain technological fields, the number of patent applications may be low, or the quality of patents may vary, both of which could impact the model’s predictive performance. To address these issues, future research should explore the integration of multiple data sources, such as scientific literature, market reports, and social media trends, to supplement the shortcomings of patent data and enhance the comprehensiveness and accuracy of technology predictions. Through these improvements, the research will be better equipped to capture the dynamics of technological development and provide stronger support for industrial innovation.
Author Contributions
Conceptualization, S.L.; Methodology, L.Z.; Validation, L.Z.; Investigation, L.Z.; Writing—original draft, Z.L., Y.T. and W.Z.; Writing—review & editing, Y.T., W.Z., X.K. and Z.Y.; Visualization, Z.L.; Project administration, S.L.; Funding acquisition, S.L. All authors have read and agreed to the published version of the manuscript.
Funding
This work is supported by grants from the National Natural Science Foundation of China (71871135 and 72271155).
Data Availability Statement
The raw data supporting the conclusions of this article will be made available by the authors on request.
Conflicts of Interest
The authors declare no conflict of interest.
References
- Zhou, J.; Guo, A.; Chen, Y.; Chen, J. Original Innovation through Inter-Organizational Collaboration: Empirical Evidence from University-Focused Alliance Portfolio in China. Sustainability 2022, 14, 6162. [Google Scholar] [CrossRef]
- Li, H.; Wu, S.P.; Fan, S.J. A research of high-tech industry’s original innovation system and evaluation of the system’s creative capability. In Proceedings of the 2014 International Conference on Management Science & Engineering 21th Annual Conference Proceedings, Helsinki, Finland, 17–19 August 2014; pp. 1738–1746. [Google Scholar]
- Atanassov, J.; Liu, X. Can Corporate Income Tax Cuts Stimulate Innovation? J. Financ. Quant. Anal. 2020, 55, 1415–1465. [Google Scholar] [CrossRef]
- Schneider, E. Germany’s Industrial strategy 2030, EU competition policy and the Crisis of New Constitutionalism. (Geo-)political economy of a contested paradigm shift. New Political Econ. 2023, 28, 241–258. [Google Scholar] [CrossRef]
- Yu, P.; Gong, R.; Sampat, M. Blockchain technology in China’s digital economy: Balancing regulation and innovation. In Regulatory Aspects of Artificial Intelligence on Blockchain; IGI Global: Hershey, PA, USA, 2022; pp. 132–157. [Google Scholar]
- Barley, B.; Kitamura, A.; Loar, T.; Ramon-Samayoa, E.; Yuzon, J.; Daim, T.U. An Investigation of the Motivations and Strategies behind Apple’s Product Design. In Innovation Management in the Intelligent World: Cases and Tools; Springer: Cham, Switzerland, 2020; pp. 3–27. [Google Scholar]
- Calleja-Sanz, G.; Olivella-Nadal, J.; Solé-Parellada, F. Technology Forecasting: Recent Trends and New Methods. In Research Methodology in Management and Industrial Engineering; Springer: Cham, Switzerland, 2020; pp. 45–69. [Google Scholar]
- Akbari, M.; Khodayari, M.; Khaleghi, A.; Danesh, M.; Padash, H. Technological innovation research in the last six decades: A bibliometric analysis. Eur. J. Innov. Manag. 2021, 24, 1806–1831. [Google Scholar] [CrossRef]
- Azimi, S.; Rahmani, R.; Fateh-rad, M. Investment cost optimization for industrial project portfolios using technology mining. Technol. Forecast. Soc. Chang. 2019, 138, 243–253. [Google Scholar] [CrossRef]
- Daim, T.U.; Pizarro, M.; Talla, R. Planning and Roadmapping Technological Innovations; Springer International Publishing: Cham, Switzerland, 2014. [Google Scholar]
- Weigand, K.; Flanagan, T.; Dye, K.; Jones, P. Collaborative foresight: Complementing long-horizon strategic planning. Technol. Forecast. Soc. Change 2014, 85, 134–152. [Google Scholar] [CrossRef]
- Ma, D.; Zhu, Q. Innovation in emerging economies: Research on the digital economy driving high-quality green development. J. Bus. Res. 2022, 145, 801–813. [Google Scholar] [CrossRef]
- Arundel, A.; van de Paal, G.; Soete, L. Innovation Strategies of Europe’s Largest Firms. Results of the PACE Survey. In European Innovation Monitoring System, Report; Maastricht: MERIT, Maastricht, The Netherlands, 1995. [Google Scholar]
- Byun, J.; Sung, T.-E.; Park, H.-W. Technological innovation strategy: How do technology life cycles change by technological area. Technol. Anal. Strateg. Manag. 2018, 30, 98–112. [Google Scholar] [CrossRef]
- Barragán-Ocaña, A.; Reyes-Ruiz, G.; Olmos-Peña, S.; Gómez-Viquez, H. Approach to the identification of an alternative technological innovation index. Scientometrics 2020, 122, 23–45. [Google Scholar] [CrossRef]
- Cecere, G.; Corrocher, N.; Gossart, C.; Ozman, M. Technological pervasiveness and variety of innovators in Green ICT: A patent-based analysis. Res. Policy 2014, 43, 1827–1839. [Google Scholar] [CrossRef]
- Wolpert, D.H. Stacked generalization. Neural Netw. 1992, 5, 241–259. [Google Scholar] [CrossRef]
- Jun, S.P.; Lee, J.S.; Lee, J. Method of improving the performance of public-private innovation networks by linking heterogeneous DBs: Prediction using ensemble and PPDM models. Technol. Forecast. Soc. Chang. 2020, 161, 120258. [Google Scholar] [CrossRef]
- Natekin, A.; Knoll, A. Gradient boosting machines, a tutorial. Front. Neurorobotics 2013, 7, 21. [Google Scholar] [CrossRef]
- Tsai, C.F.; Chen, M.L. Credit rating by hybrid machine learning techniques. Appl. Soft Comput. 2010, 10, 374–380. [Google Scholar] [CrossRef]
- He, K.; Zhang, X.; Ren, S.; Sun, J. Deep residual learning for image recognition. In Proceedings of the IEEE Conference on Computer Vision and Pattern Recognition, Las Vegas, NV, USA, 27–30 June 2016; pp. 770–778. [Google Scholar]
- Lee, C.; Kwon, O.; Kim, M.; Kwon, D. Early identification of emerging technologies: A machine learning approach using multiple patent indicators. Technol. Forecast. Soc. Change 2018, 127, 291–303. [Google Scholar] [CrossRef]
- Bhattacharyya, R.; Mukherjee, S. Fuzzy Membership Function Evaluation by Non-Linear Regression: An Algorithmic Approach. Fuzzy Inf. Eng. 2020, 12, 412–434. [Google Scholar] [CrossRef]
- Kumar, G.; Singh, U.P.; Jain, S. Swarm Intelligence Based Hybrid Neural Network Approach for Stock Price Forecasting. Comput. Econ. 2022, 60, 991–1039. [Google Scholar] [CrossRef]
- Liu, Y.; Li, H.; Guan, J.; Liu, X.; Guan, Q.; Sun, Q. Influence of different factors on prices of upstream, middle and downstream products in China’s whole steel industry chain: Based on Adaptive Neural Fuzzy Inference System. Resour. Policy 2019, 60, 134–142. [Google Scholar] [CrossRef]
- Gerybadze, A. R&D, Innovation and Growth: Performance of the World’s Leading Technology Corporations. In Innovation and International Corporate Growth; Springer: Berlin/Heidelberg, Germany, 2010; pp. 11–30. [Google Scholar]
- Meng, H.; Chen, X.; Wang, C.; Zhang, B.; Zhou, Z. Research on the Evaluation of Digital Village Development Readiness: Taking Changfeng County as an Example. Int. J. Educ. Humanit. 2022, 2, 155–159. [Google Scholar] [CrossRef]
- Lee, P.-C.; Su, H.-N. Quantitative mapping of scientific research—The case of electrical conducting polymer nanocomposite. Technol. Forecast. Soc. Chang. 2011, 78, 132–151. [Google Scholar] [CrossRef]
- Ahuja, G. Collaboration Networks, Structural Holes, and Innovation: A Longitudinal Study. Adm. Sci. Q. 2000, 45, 425–455. [Google Scholar] [CrossRef]
- Smojver, V.; Štorga, M.; Zovak, G. Exploring Knowledge Flow within a Technology Domain by Conducting a Dynamic Analysis of a Patent Co-Citation Network. J. Knowl. Manag. 2021, 25, 433–453. [Google Scholar] [CrossRef]
- Ritala, P.; Sainio, L.M. Coopetition for Radical Innovation: Technology, Market and Business-Model Perspectives. Technol. Anal. Strateg. Manag. 2014, 26, 155–169. [Google Scholar] [CrossRef]
- Jiaxuan, W. Link prediction of directed knowledge network based on patent co-citation. In Proceedings of the 2023 IEEE 3rd International Conference on Data Science and Computer Application (ICDSCA), Dalian, China, 27–29 October 2023; pp. 21–27. [Google Scholar]
- Li, X.; Xie, Q.; Jiang, J.; Zhou, Y.; Huang, L. Identifying and monitoring the development trends of emerging technologies using patent analysis and Twitter data mining: The case of perovskite solar cell technology. Technol. Forecast. Soc. Chang. 2019, 146, 687–705. [Google Scholar] [CrossRef]
- Zhang, L.; Li, L.; Li, T. Patent Mining: A Survey. SIGKDD Explor. Newsl. 2015, 16, 1–19. [Google Scholar] [CrossRef]
- Kumar, V.; Lai, K.-K.; Chang, Y.-H.; Bhatt, P.C.; Su, F.-P. A structural analysis approach to identify technology innovation and evolution path: A case of m-payment technology ecosystem. J. Knowl. Manag. 2021, 25, 477–499. [Google Scholar] [CrossRef]
- Suominen, A.; Seppänen, M.; Dedehayir, O. A bibliometric review on innovation systems and ecosystems: A research agenda. Eur. J. Innov. Manag. 2019, 22, 335–360. [Google Scholar] [CrossRef]
- Li, S.; Zhu, B.; Zhang, Y.; Liu, F.; Yu, Z. A Two-Stage Nonlinear User Satisfaction Decision Model Based on Online Review Mining: Considering Non-Compensatory and Compensatory Stages. J. Theor. Appl. Electron. Commer. Res. 2024, 19, 272–296. [Google Scholar] [CrossRef]
- Namoun, A.; Alshanqiti, A. Predicting Student Performance Using Data Mining and Learning Analytics Techniques: A Systematic Literature Review. Appl. Sci. 2021, 11, 237. [Google Scholar] [CrossRef]
- Balland, P.A.; Rigby, D.; Boschma, R. The technological resilience of US cities. Camb. J. Reg. Econ. Soc. 2015, 8, 167–184. [Google Scholar] [CrossRef]
- Trajtenberg, M. A Penny for Your Quotes: Patent Citations and the Value of Innovations. RAND J. Econ. 1990, 21, 172–187. [Google Scholar] [CrossRef]
- Meyer, M. What is Special about Patent Citations? Differences between Scientific and Patent Citations. Scientometrics 2000, 49, 93–123. [Google Scholar] [CrossRef]
- Tong, X.; Frame, J.D. Measuring national technological performance with patent claims data. Res. Policy 1994, 23, 133–141. [Google Scholar] [CrossRef]
- Isobe, T.; Makino, S.; Montgomery, D.B. Technological capabilities and firm performance: The case of small manufacturing firms in Japan. Asia Pac. J. Manag. 2008, 25, 413–428. [Google Scholar] [CrossRef]
- Tseng, C.-Y.; Lin, S.-C.; Pai, D.-C.; Tung, C.-W. The relationship between innovation network and innovation capability: A social network perspective. Technol. Anal. Strateg. Manag. 2016, 28, 1029–1040. [Google Scholar] [CrossRef]
- Ziedonis, R.H. Don’t Fence Me In: Fragmented Markets for Technology and the Patent Acquisition Strategies of Firms. Manag. Sci. 2004, 50, 804–820. [Google Scholar] [CrossRef]
- Stek, P.E.; van Geenhuizen, M.S. The influence of international research interaction on national innovation performance: A bibliometric approach. Technol. Forecast. Soc. Chang. 2016, 110, 61–70. [Google Scholar] [CrossRef]
- Klitkou, A.; Patel, P.; Campos, A. Linkages between technical universities and industry measured by co-authorship and patent data. In Proceedings of the Third Conference on Micro Evidence on Innovation in Developing Economies (MEIDE), Rio de Janeiro, Brazil, 10–12 May 2009. [Google Scholar]
- Hekkert, M.P.; Suurs, R.A.A.; Negro, S.O.; Kuhlmann, S.; Smits, R.E.H.M. Functions of innovation systems: A new approach for analysing technological change. Technol. Forecast. Soc. Chang. 2007, 74, 413–432. [Google Scholar] [CrossRef]
- Yam, R.C.M.; Lo, W.; Tang, E.P.Y.; Lau, A.K.W. Analysis of sources of innovation, technological innovation capabilities, and performance: An empirical study of Hong Kong manufacturing industries. Res. Policy 2011, 40, 391–402. [Google Scholar] [CrossRef]
- Zadeh, L.A. Fuzzy sets. Inf. Control 1965, 8, 338–353. [Google Scholar] [CrossRef]
- Dubois, D.J. Fuzzy Sets and Systems: Theory and Applications; Academic Press: Cambridge, MA, USA, 1980; Volume 144. [Google Scholar]
- Chen, S.-J.; Hwang, C.-L. (Eds.) Fuzzy Multiple Attribute Decision Making Methods. In Fuzzy Multiple Attribute Decision Making: Methods and Applications; Springer: Berlin/Heidelberg, Germany, 1992; pp. 289–486. [Google Scholar]
- Breiman, L. Bagging predictors. Mach. Learn. 1996, 24, 123–140. [Google Scholar] [CrossRef]
- Kuncheva, L.I. Combining Pattern Classifiers: Methods and Algorithms; John Wiley & Sons: Hoboken, NJ, USA, 2014. [Google Scholar]
- Hastie, T.; Tibshirani, R.; Friedman, J.H.; Friedman, J.H. The Elements of Statistical Learning: Data Mining, Inference, and Prediction; Springer: New York, NY, USA, 2009; Volume 2. [Google Scholar]
- Rumelhart, D.E.; Hinton, G.E.; Williams, R.J. Learning representations by back-propagating errors. Nature 1986, 323, 533–536. [Google Scholar] [CrossRef]
- Ciresan, D.C.; Meier, U.; Masci, J.; Gambardella, L.M.; Schmidhuber, J. Flexible, high performance convolutional neural networks for image classification. In Proceedings of the Twenty-Second International Joint Conference on Artificial Intelligence, Barcelona, Spain, 16–22 July 2011. [Google Scholar]
- Hinton, G.E.; Salakhutdinov, R.R. Using deep belief nets to learn covariance kernels for Gaussian processes. Adv. Neural Inf. Process. Syst. 2007, 20, 1249–1256. [Google Scholar]
- Porter, A.L.; Newman, N.C. Mining external R&D. Technovation 2011, 31, 171–176. [Google Scholar]
- Zhu, W.; Guan, J. A bibliometric study of service innovation research: Based on complex network analysis. Scientometrics 2013, 94, 1195–1216. [Google Scholar] [CrossRef]
- The Industrial Research Institute. 2016 R&D Trends Forecast. Res.-Technol. Manag. 2016, 59, 30–38. [Google Scholar]
- Kim, T.K.; Park, J.H. More about the basic assumptions of t-test: Normality and sample size. Korean J. Anesthesiol. 2019, 72, 331–335. [Google Scholar] [CrossRef] [PubMed]
- Ghilan, A.; Chiriac, A.P.; Nita, L.E.; Rusu, A.G.; Neamtu, I.; Chiriac, V.M. Trends in 3D Printing Processes for Biomedical Field: Opportunities and Challenges. J. Polym. Environ. 2020, 28, 1345–1367. [Google Scholar] [CrossRef]
- Zhao, L.; Zhang, M.; Chitrakar, B.; Adhikari, B. Recent advances in functional 3D printing of foods: A review of functions of ingredients and internal structures. Crit. Rev. Food Sci. Nutr. 2021, 61, 3489–3503. [Google Scholar] [CrossRef]
- Vaezi, M.; Chianrabutra, S.; Mellor, B.; Yang, S. Multiple material additive manufacturing—Part 1: A review. Virtual Phys. Prototyp. 2013, 8, 19–50. [Google Scholar] [CrossRef]
- Attaran, M. The rise of 3-D printing: The advantages of additive manufacturing over traditional manufacturing. Bus. Horiz. 2017, 60, 677–688. [Google Scholar] [CrossRef]
- Fleischer, T.; Decker, M.; Fiedeler, U. Assessing emerging technologies—Methodological challenges and the case of nanotechnologies. Technol. Forecast. Soc. Chang. 2005, 72, 1112–1121. [Google Scholar] [CrossRef]
- Cui, C.; Hu, B.; Zhao, L.; Liu, S. Titanium alloy production technology, market prospects and industry development. Mater. Des. 2011, 32, 1684–1691. [Google Scholar] [CrossRef]
- Masson, P.; Tonello, C.; Balny, C. High-Pressure Biotechnology in Medicine and Pharmaceutical Science. J. Biomed. Biotechnol. 2001, 1, 85–88. [Google Scholar] [CrossRef] [PubMed]
- Wang, X.; Yang, H.; Yu, X.; Hu, C.; Hu, J.; Li, R.; Zhang, Y. Functional metal powders: Design, properties, applications, and prospects. Mater. Sci. Eng. B 2022, 280, 115708. [Google Scholar] [CrossRef]
- Mikula, K.; Skrzypczak, D.; Izydorczyk, G.; Warchoł, J.; Moustakas, K.; Chojnacka, K.; Witek-Krowiak, A. 3D printing filament as a second life of waste plastics—A review. Environ. Sci. Pollut. Res. 2021, 28, 12321–12333. [Google Scholar] [CrossRef]
- Kim, G.; Bae, J. A Novel Approach to Forecast Promising Technology through Patent Analysis. Technol. Forecast. Soc. Chang. 2017, 117, 228–237. [Google Scholar] [CrossRef]
- Park, I.; Yoon, B. Technological Opportunity Discovery for Technological Convergence Based on the Prediction of Technology Knowledge Flow in a Citation Network. J. Informetr. 2018, 12, 1199–1222. [Google Scholar] [CrossRef]
- Aleixandre-Tudó, J.L.; Bolaños-Pizarro, M.; Aleixandre, J.L.; Aleixandre-Benavent, R. Worldwide Scientific Research on Nanotechnology: A Bibliometric Analysis of Tendencies, Funding, and Challenges. J. Agric. Food Chem. 2020, 68, 9158–9170. [Google Scholar] [CrossRef]
- Arthur, W.B. The Nature of Technology: What It Is and How It Evolves; Penguin UK: London, UK, 2010. [Google Scholar]
- Murmann, J.P. Knowledge and Competitive Advantage: The Coevolution of Firms, Technology, and National Institutions; Cambridge University Press: Cambridge, UK, 2003. [Google Scholar]
- Fleming, L.; Mingo, S.; Chen, D. Collaborative brokerage, generative creativity, and creative success. Adm. Sci. Q. 2007, 52, 443–475. [Google Scholar] [CrossRef]
- Brynjolfsson, E.; McAfee, A. Machine, Platform, Crowd: Harnessing our Digital Future; WW Norton & Company: New York, NY, USA, 2017; p. 564. [Google Scholar]
- Rohrbeck, R. Corporate Foresight: Towards a Maturity Model for the Future Orientation of a Firm; Springer Science & Business Media: Berlin/Heidelberg, Germany, 2010. [Google Scholar]


Disclaimer/Publisher’s Note: The statements, opinions and data contained in all publications are solely those of the individual author(s) and contributor(s) and not of MDPI and/or the editor(s). MDPI and/or the editor(s) disclaim responsibility for any injury to people or property resulting from any ideas, methods, instructions or products referred to in the content. |
© 2024 by the authors. Licensee MDPI, Basel, Switzerland. This article is an open access article distributed under the terms and conditions of the Creative Commons Attribution (CC BY) license (https://creativecommons.org/licenses/by/4.0/).