Article

Post-Disaster Performance and Restoration Sequences of Interdependent Critical Infrastructure Systems Considering Various Socioeconomic Impacts

School of Management Science and Engineering, Central University of Finance and Economics, Beijing 100081, China
*
Author to whom correspondence should be addressed.
Sustainability 2024, 16(15), 6609; https://doi.org/10.3390/su16156609
Submission received: 8 May 2024 / Revised: 17 July 2024 / Accepted: 30 July 2024 / Published: 2 August 2024
(This article belongs to the Section Hazards and Sustainability)

Abstract

:
The failures of interdependent critical infrastructure systems (CISs) caused by disasters could result in significant impacts on the economy and society of cities. Although existing studies have proposed several socioeconomic impact indicators of CIS failures, using these indicators as optimization objectives of restoration sequences, most of them only selected one indicator and failed to reveal their differences. This study aims to analyze the differences between various socioeconomic impact indicators in evaluating post-disaster CIS performance and to identify their effects on the optimized restoration sequences. To achieve this objective, this study simulates the failure propagation and recovery process of CISs, based on network modeling, and constructs six socioeconomic impact indicators for evaluating CIS performance and optimizing the restoration sequence. Then, this study analyzes the effects of different socioeconomic impact indicators by comparing the differences between post-disaster CIS performance, as well as the corresponding restoration sequence and recovery efficiency, among five groups. The results indicate that ignoring social impacts would significantly underestimate the consequences of CIS failures, and the restoration sequence aimed at minimizing social impact differs from other methods, with the recovery efficiency in regards to the social impact notably lower than that of the economic impact. This implies that evaluating the multidimensional social impacts is essential for accurately understanding the worst-case consequences of CIS failures with a bottom-line perspective.

1. Introduction

Critical infrastructure systems (CISs), such as the electric power system and the water supply network, constitute vital assets for cities, playing a fundamental role in delivering essential commodities necessary for the smooth functioning of urban systems. Safeguarding CISs is paramount, as this significantly influences a city’s ability to respond to disasters and facilitate post-hazard recovery [1]. This interdependency, characterized by the interactive relationship between various CISs [2], has been proven to aggravate failure propagation among CISs and hinder the recovery after disaster events, resulting in great impacts on the economy and society of cities [3]. For instance, when Hurricane Katrina struck New Orleans in 2005, the majority of buildings, highways, and infrastructure facilities were covered by floodwaters [4], leading to direct losses exceeding one hundred billion U.S. dollars, with nearly half of the population permanently leaving the city [5]. In the 2008 snow disaster in southern China, heavy snowfall damaged power lines and led to a surge in residential heating demands. Moreover, road closures due to heavy snow made it difficult for rescue personnel and fuel to reach the affected areas, further exacerbating the impact on the lives of residents. Simultaneously, the paralysis of transportation facilities resulted in millions of travelers being stranded at stations, causing significant social impacts.
The variation in CIS performance serves as a metric for evaluating the impact of disasters on CISs [6]. Various CIS performance indicators have been proposed in the literature, including topology-based indicators [7,8], the properties of commodities delivered by CISs [9,10,11], and socioeconomic indicators [12,13,14,15]. However, disagreements and misunderstandings may arise among stakeholders regarding which CIS performance indicators to use in decision-making processes related to protection and post-disaster recovery. Therefore, exploring and analyzing various performance indicators, particularly in light of different socioeconomic impacts, can clarify the differences in performance related to CIS failure propagation and recovery.
After CISs suffer extensive damage, optimizing the post-disaster restoration sequence has a significant impact on recovery efficiency [12], with the aim of recovering CIS performance promptly and mitigating the effects of failures. Some studies have suggested prioritizing component repairs based on their importance or criticality [16,17]. Moreover, studies have also employed dynamic simulation methods to optimize the restoration sequence of failed CIS components [18,19,20,21,22]. However, existing studies similarly lack an analysis of the differences between restoration sequence optimizations based on various CIS performance indicators, especially when considering diverse socioeconomic impacts. Consequently, these studies fail to resolve disagreements and misunderstandings among stakeholders regarding restoration sequence decision making.
To address the aforementioned gaps, this study aims to compare and analyze the differences between the post-disaster performance indicators of interdependent CISs, considering different socioeconomic impacts and to identify their effects on the optimized restoration sequences of failed CIS components. Firstly, this study identifies the multifaceted socioeconomic impacts caused by CIS failures and constructs CIS performance indicators that reflect these socioeconomic impacts. Secondly, based on the simulation of the failure propagation and recovery processes of interdependent CISs, this study contrasts the post-disaster changes in the above performance indicators and examines their similarities and differences in optimizing restoration sequences, thereby demonstrating the significance of comprehensively considering socioeconomic impacts from a global perspective. A case study of interdependent CISs, including electric power, gas, water supply, and roads, in Shelby County, TN, USA, is conducted in this study. The methodology and results are detailed in the remainder of the paper.

2. Literature Review

2.1. Modeling Methods of CISs

The modeling methods of CISs can be divided into single CIS modeling and interdependent CISs modeling. Modeling of single CIS focuses more on the characteristics of the system itself, examining its vulnerability assessments and post-disaster recovery strategies. For instance, smart grid modeling focuses on traffic dispatching and redistribution, analyzing the grid’s robustness under uncertain impacts [23]. Similar studies include gas systems, water supply systems [24], and transportation systems [25]. However, there are complex interdependencies among CISs. Ouyang et al. [26] observed repeated failure propagation between different CISs during various disasters, analyzing the occurrence of these phenomena due to interdependencies among CISs. Disaster data were collected and analyzed to identify and quantify interdependencies at the system level of CISs [27,28]. The model proposed by Buldyrev et al. [29] can capture cascading failures leading to first-order percolation phase transitions in mutually dependent networks and can be extended to model interdependent CISs.
Interdependent CISs modeling focuses on the interactions between different CISs, employing various generic system modeling approaches. Common methods for modeling interdependent CISs include agent-based modeling, input–output modeling, and network-based modeling. In agent-based models, CISs are considered complex adaptive systems, comprised of agents interacting with each other and their environment according to predefined rules [30,31]. Agent-based modeling can simulate diverse agent behaviors and capture various types of interdependencies. However, it often requires substantial relevant data, which may not always be available in practice [26]. Linear input–output inoperability modeling (IIM) offers another approach for studying CIS interdependencies [32]. The IIM quantifies the inoperability of CISs based on the reduced capacity to produce or deliver specific commodities. Widely adopted, the IIM analyzes how disturbances propagate among interdependent CISs and suggests effective mitigation strategies [33,34].
As an emerging approach for CISs modeling, network-based modeling has been increasingly adopted in recent studies. CISs can be represented as networks in which nodes denote built facilities, and links signify the relational connections between nodes. According to Ouyang’s comprehensive review [26], network-based models can generally be categorized into topology-based models and flow-based models. These approaches differ primarily in how they define and calculate the state of the CIS components. Topology-based models characterize each component (node or link) of CISs using discrete states, typically binary, such as operational or failed states. Numerous studies have employed topology-based methods to simulate node and network failures [7,35,36]. Flow-based models, on the other hand, represent each CIS component using continuous states, usually expressed as the percentage of current commodity flow through a component relative to its normal flow level. Flow-based models have been utilized extensively to explore interdependencies among different CISs and to simulate their responses to various extreme events [37,38,39]. Furthermore, simulation methods based on High-Level Architecture (HLA) have been proposed to address the heterogeneity and interdependencies of infrastructure systems and have been applied across multiple scenarios [40].

2.2. CIS Performance Indicators

The variation in CIS performance serves as an indicator for evaluating the impact of disasters on CISs [6]. Various CIS performance indicators have been proposed in the literature. Given the extensive networking of CISs, certain topological properties are essential for measuring CIS performance. Typical topology-based indicators include the number of nodes, average node degree, betweenness centrality, and average critical path length [7,8]. These indicators evaluate the network connectivity of CISs, indicating the level of accessibility to commodities provided by them. Additionally, an alternative category of indicators evaluates the properties of commodities delivered by CISs. Examples of such indicators include the amount of electricity supplied by power grids [10], the quantity of water distributed by water supply networks [11], and the available traffic flow on roads [9]. However, compared to accessibility and commodities flow, socioeconomic impacts resulting from CIS failures play a more significant role in the decision-making processes concerning CIS protection and post-disaster recovery [41]. Therefore, socioeconomic indicators, such as loss of regional gross domestic product [13,14] and the number of unserved customers [12,15], were introduced to evaluate post-disaster CIS performance.
To utilize the aforementioned CIS performance indicators, methods should be adopted to describe the state of CISs at different stages of the disaster lifecycle. Real data mining or system simulation of disaster events can provide and summarize descriptions of CIS performance indicators. For example, Cimellaro et al. [42] used official data from the 2011 earthquake in northeastern Japan to assess the real CIS performance. Mao et al. [12] employed system simulation methods to model changes in CIS topology, flow, and societal performance. Post-disaster assessment of CIS performance can optimize CIS protection and recovery. For instance, Liu et al. [18] analyzed pre- and post-disaster solutions to enhance CIS performance by simulating and evaluating CIS performance during the resistance and recovery phases. Sun et al. [43] modeled CIS performance changes during earthquake disasters based on a topology-based network model, thus implementing multiple recovery strategies under different stages of recovery. Li et al. [44] studied the joint optimization and protection problems of CIS networks under deliberate external attacks founded on a flow-based network theory under incomplete information simulations, highlighting the significant dependence of post-disaster CIS performance on external factors such as availability of recovery resources and scheduling of recovery tasks.
However, existing studies rarely compare the differences in evaluating post-disaster CIS status using various CIS performance indicators. Given that different performance indicators represent the interests of various stakeholders, disagreements and misunderstandings may arise among these stakeholders regarding which performance indicator to utilize in the decision-making processes concerning CIS protection and post-disaster recovery. Therefore, exploring and analyzing various performance indicators, especially considering different socioeconomic impacts, can elucidate the differences in performance regarding CIS failure propagation and recovery. Moreover, proposing indicators capable of accommodating diverse impacts can offer crucial theoretical support for resolving the aforementioned disagreements.

2.3. Restoration Sequence of Failed CISs

When CISs suffer extensive damage, it is often impossible to restore all failed components immediately due to resource constraints. Therefore, optimizing the post-disaster restoration sequence has a significant impact on recovery efficiency [12], aiming to recover CIS performance promptly and mitigate the effects of failures. Some studies have suggested prioritizing component repairs based on their importance or criticality [16,17]. While these methods offer a straightforward means of ranking all infrastructure components before a disaster, they overlook the complexity of CIS failure scenarios and the dynamics of the recovery process. Repairing high-priority infrastructure components may not necessarily lead to significant recovery outcomes if they lack support from upstream and downstream components [45]. Consequently, some studies have employed dynamic simulation methods to optimize the restoration sequence of failed CIS components. Maximizing CIS performance is almost universally recognized as the optimization goal, occasionally considering factors such as the time and distance that maintenance teams spend traveling, along with the component repair times [18,19,20,21,22].
When dealing with numerous components requiring restoration, optimization becomes an NP-hard problem. Hence, optimization methods have been devised for the restoration sequence of failed CIS components based on algorithms such as genetic algorithms and simulated annealing [46,47]. For example, Li et al. [47] developed a new algorithm that integrates a genetic algorithm for the parallel machine scheduling problem (PMSP) with the Frank–Wolfe algorithm to optimize recovery strategies for transportation networks. Gharib et al. [48] utilized the non-dominated sorting genetic algorithm II to solve models for achieving optimal recovery scheduling in community buildings. Mao et al. [46] proposed a bi-objective nonlinear programming model and applied an improved simulated annealing algorithm to effectively schedule supply chain maintenance activities under resource constraints.
However, existing studies similarly fail to analyze the differences in restoration sequence optimization based on different CIS performance indicators, particularly considering various socioeconomic impacts, thus failing to address disagreements and misunderstandings among stakeholders regarding restoration sequence decision making.

3. Methodology

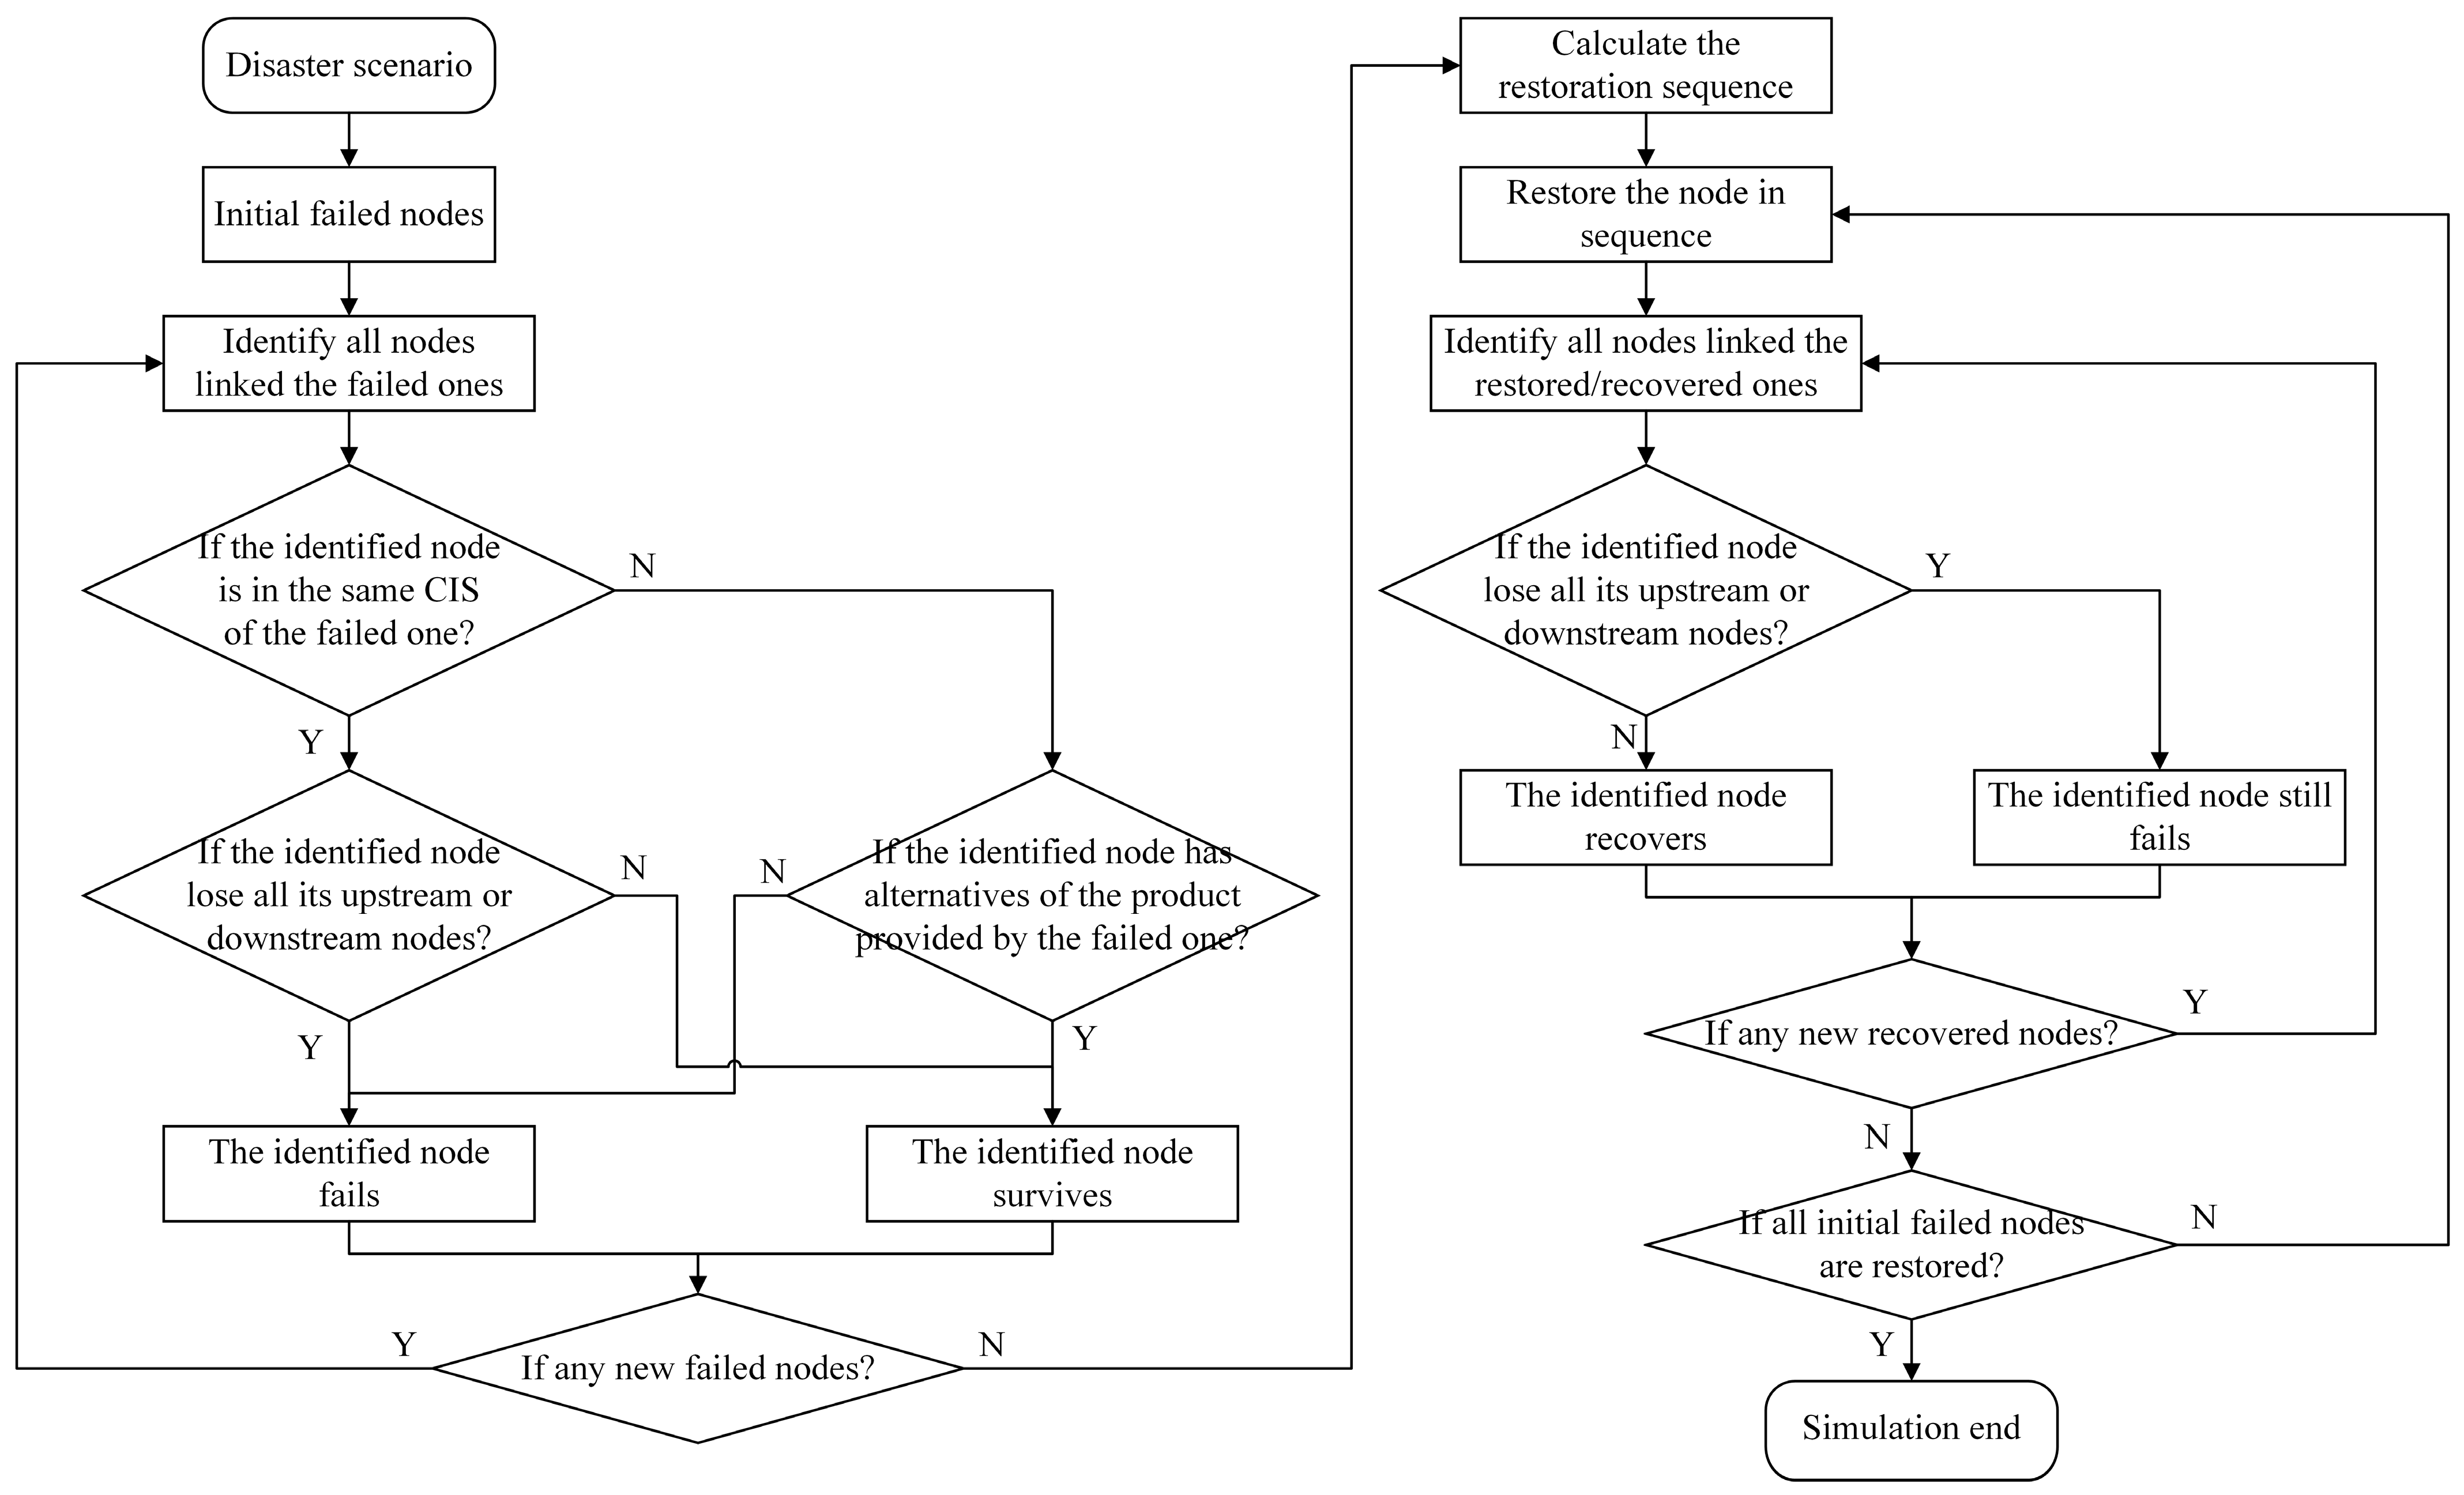
3.1. Simulation of Post-Disaster Failure Propagation and Recovery of Interdependent CISs

This study employs a topology-based network model to simulate the process of post-disaster failure propagation and the recovery of interdependent CISs, as shown in Figure 1. This model, proposed by Johansson and Hassel [35], aimed to capture the geographical and functional interdependencies between railways, traction power, telecommunications, auxiliary power, and power supply systems in a fictional railway network. It can capture the topological characteristics of interdependent CISs, and the constructed structure can effectively reflect the functionality of CISs. Moreover, compared to other modeling methods, this method only requires a small amount of data, including the topological structure. Currently, this network model has been widely applied in CIS modeling and simulation, including its use for power supply systems [49,50], water supply networks [7,12], gas systems [51], and railway systems [52].
This network model uses nodes and links to represent the components of real-world CISs and their interdependencies. It consists of a topological submodel and a functional submodel. The topological submodel delineates the interdependencies among CIS components, utilizing nodes and directed links. Each node is characterized by a binary state, indicating whether it is functioning normally or has failed. Meanwhile, the functional submodel defines specific functionalities, such as the volume of delivered flow, associated with each node. A node in a normal state operates at full capacity, whereas a failed node loses the whole functionality. In the topological submodel, the failure of a node can potentially trigger the failure of all directly connected nodes via links. This cascade effect propagates throughout the entire network, affecting interdependent CIS components. Subsequently, the functional submodel recalculates the function of each node and evaluates the total functionality of the network.
This study differentiates between the interdependencies between nodes in one CIS and those between nodes in different CISs. The flow of products between the same type of nodes in one CIS may be bidirectional, such as between substations or distribution points. Conversely, the flow of products between different types of nodes in one CIS is typically unidirectional, always from upstream to downstream nodes, e.g., electricity flowing from power plants to substations, or water from pumps to distribution points. In one CIS, when one node fails, its linked nodes will also fail if they lose all their upstream or downstream nodes. However, in CISs such as road systems, where there are no hierarchical nodes, the failure of one node only results in the failure of its connected links, without directly affecting the linked nodes. Regarding interdependencies between nodes in different CISs, only certain nodes, such as substations and pumps, exhibit links. The flow of products between nodes in different CISs is generally unidirectional, representing the functional dependencies. For example, the operation of a pump requires electrical power support, so electricity flows from substations to pumps and not vice versa. Therefore, if one node fails, the nodes in another CIS that rely on the product supplied by that node will also fail if they do not have alternative supplies of that product. Additionally, each node has a probability of experiencing initial failure, primarily determined by factors such as disaster scenarios, geographical locations, and physical resistance.
The restoration of failed CIS components is a rather intricate process, typically involving inspection, failure assessment, repair, and reactivation [53]. As the repair process often consumes the most time and contributes significantly to the overall restoration effort, existing studies tend to equate the repair process with the restoration process. The restoration of failed CIS components is influenced by factors such as repair resources, repair teams, maintenance efficiency, and repair duration [54,55,56,57]. To streamline this complexity, this study makes several assumptions regarding the restoration process of failed CIS components. Firstly, only physically failed nodes require restoration. Those nodes that remain physically intact but experience functional failure due to propagated failures do not necessitate restoration efforts. These nodes will automatically restore functionality as soon as all nodes on which they depend for operation are restored. Secondly, the restoration process ensures that only one node is undergoing restoration at any given time, with each node having an equal restoration duration. When the restoration process of one failed node is fully completed, the functionality of that node can immediately return to normal levels. Finally, the restoration sequence of failed nodes can be determined based on various criteria, as elaborated in Section 3.3.

3.2. Socioeconomic Impacts Caused by CIS Failures

The social impacts caused by CIS failures mainly include living costs, social stability, and urban efficiency [58]. The study employed the proportion of unserved customers, unemployment rate, and loss rate of traffic efficiency as evaluation indicators for these impacts, respectively. Additionally, the study evaluates the economic impacts caused by CIS failures from the perspectives of industry, government, and residents, employing the loss rate of industrial outputs, the reduction rate of government tax revenues, and the reduction rate of resident income as evaluation indicators. The specific explanations and calculations of these six indicators are described as follows.

3.2.1. Proportion of Unserved Customers

CISs provide customers with low-cost daily life products such as water and electricity. If these CISs cease to supply these products, customers have to seek alternatives, such as bottled water and self-generated electricity, at higher prices, leading to an increase in related living costs. Although existing studies have identified this phenomenon [2,59], indicators directly reflecting the increase in living costs are still lacking. Instead, the number of unserved customers has been utilized to measure the impact of CIS failures [15,60]. Therefore, this study selects the proportion of unserved customers caused by CIS failures as an indicator to indirectly represent the impact on customers’ living costs.
The proportion of unserved customers caused by CIS failures refers to the proportion of customers who cannot be served by the failed CISs (shown as Equation (1)), where the number of customers served by different types of CIS services can be aggregated.
Q customer = i k S k , i · C k i k   C k
where Q customer denotes the proportion of unserved customers caused by CIS failures, S k , i denotes the state of CIS service i in region k (1 = loss, 0 = normal), and C k denotes the number of customers in region k .

3.2.2. Unemployment Rate

The employment rate is often regarded as an important indicator for evaluating social stability. Previous studies have indicated that CISs have significant effects on local human resources [61], and CIS failures can significantly affect the local job market by influencing industry production [62]. A number of studies use indicators such as the urban registered unemployment rate to assess the social impacts of CIS failures [18,63]. Therefore, this study selects the additional unemployment rate caused by CIS failures as an indicator to represent the impact on social stability. The unemployment rate refers to the ratio of temporarily unemployed people due to the industrial output losses caused by CIS failures to the total employment rate under normal conditions. Moreover, various CIS services exert varying impacts on distinct industries. For instance, agriculture relies heavily on water supply, whereas manufacturing is particularly reliant on electricity supply. Thus, this study introduces the concept of resilience tailored to different industries and their corresponding CIS services.
The value of resilience delineates the proportion of outputs that the industry can sustain in the absence of a specific CIS service. In scenarios where multiple CIS services are missing, the resilience value of the smallest one is taken into account. Thus, the unemployment rate is expressed in Equations (2) and (3).
Q unemployment = k g ε k , g · L k , g k g L k , g
ε k , g = m a x S k , i · 1 R i , g
where Q unemployment denotes the unemployment rate caused by CIS failures, ε k , g denotes the proportion of output losses of industry g in region k , L k , g denotes the number of employees of industry g in region k , and R i , g denotes the resilience value of industry g against the absence of CIS service i .

3.2.3. Loss Rate of Traffic Efficiency

CISs provide convenient support for residents’ daily lives, among which the transportation system greatly influence the efficiency of residents’ travel [64]. Previous studies have often evaluated the impact of road failures on transportation using indicators such as traffic flow loss [65] and traffic efficiency loss [25,66]. Although the daily traffic flow of roads is recorded in some databases, the relationship between the status of the road system and traffic flow cannot yet be scientifically established due to traffic diversion caused by numerous intersections. Conversely, existing studies evaluate the accessibility and efficiency of road networks using indicators such as network connectivity, average shortest travel time, and average shortest travel distance [67,68,69]. Therefore, this study employs the average critical path length (CPL) as an indicator to evaluate the impact of CIS failures on traffic efficiency.
The average critical path length (CPL) and traffic efficiency can be calculated based on Equations (4) and (5):
C P L = n ( n 1 ) i j V 1 d ( i . j )
Q efficiency = C P L 0 C P L C P L 0
where Q efficiency denotes the loss rate of traffic efficiency, C P L and C P L 0 denote the average critical path length at the current time and under the normal condition, n denotes the number of intersections of the road network, and d i . j denotes the real distance from intersection i to intersection j .

3.2.4. Loss Rate of Industrial Outputs

CISs provide fundamental materials and services, including electric power, water supply, and transportation, for industrial economic activities. Thus, CIS failures could lead to profound effects on industrial economic activities, including stagnation, reduced output, and the loss of labor force [5]. Some studies evaluated the overall economic impact of CIS failures using indicators such as the loss of regional gross domestic product [13,14]. Indicators such as the loss of industrial output value or industrial value added could vividly reflect the impact of CIS failures on economic activities of specific industries [70]. Therefore, this study selects the loss rate of industrial outputs as an indicator to evaluate the impact of CIS failures on industrial economic activities.
The loss rate of industrial outputs is defined as the sum of output value losses in various industries caused by CIS failures divided by the total output value under normal conditions, shown as Equation (6).
Q industry = k g ε k , g · P k , g k g P k , g
where Q industry denotes the loss rate of industrial outputs, and P k , g denotes the output value of industry g in region k .

3.2.5. Reduction Rate of Government Tax Revenues

CIS failures could affect government finances through various channels. On the one hand, CIS failures impact industrial economic activities, and economic downturns result in reduced government tax revenue [71]. On the other hand, when CISs are damaged, the government needs to fulfill reimbursement or insurance responsibilities, organize reconstruction plans, and even seek intergovernmental assistance [71], which has a certain impact on government fiscal expenditures. Changes in fiscal revenue and expenditures are usually used to assess the impact of disasters on government economic activities [72,73,74]. However, since government subsidies, insurance, and other fiscal expenditures are highly dependent on governmental discretionary actions, it is challenging to determine their relationship with CIS failures. Therefore, this study only employs the reduction rate of government tax revenues as an indicator to evaluate the impact of CIS failures on government economic activities.
The reduction of government tax revenues is primarily caused by output losses of various industries, considering different tax rates across industries, shown as Equation (7).
Q tax = k g ε k , g · P k , g · T g k g P k , g · T g
where Q tax denotes the reduction rate of government tax revenues, and T g denotes the tax rate of industry g .

3.2.6. Reduction Rate of Resident Income

The development of CISs can increase residents’ income [75] and promote household consumption [76]. Conversely, CIS failures could weaken industrial productivity, leading to unemployment and significantly reducing residents’ income [5]. Therefore, indicators such as household income and the average monthly income of community residents have been used in many studies to evaluate the impact of disasters on residents or communities [77,78,79]. Hence, this study employs the reduction rate of resident income as an indicator to evaluate the impact of CIS failures on residents.
The reduction rate of resident income is defined as the product of the number of unemployed individuals in each industry and the average income of that industry, divided by the total income of residents under normal conditions, shown as Equation (8).
Q income = k g ε k , g · L k , g · I g k g L k , g · I g
where Q income denotes the reduction rate of resident income, and I g denotes the average employee income of industry g .

3.3. Restoration Sequence of Failed CIS Components

Although optimizing the restoration sequence of failed CIS components may not significantly reduce the overall recovery time of CISs, it can expedite the recovery of CIS functionality to a high level as early as possible, within the given resource constraints [12], thus ensuring the smooth operation of the economy and society. Therefore, this study employs socioeconomic impacts to evaluate CIS performance and aims to maximize the integral value of CIS performance during recovery processes, shown as Equations (9) and (10).
S P t = 1 Q t
m a x t 0 t 1 S P t d t
where S P t denotes the CIS performance at time t , Q t denotes the socioeconomic impacts at time t , which could be different weight combinations of the six indicators outlined in Section 3.2, and t 0 and t 1 denote the time of failure occurrence and full recovery, respectively. The CIS performance is assumed to fully recover to the normal or desired level after a certain amount of time, where t 1 is definite.
This study imposes no additional restrictions on the restoration sequence of failed CIS components to better illustrate the differences in restoration sequences under various performance indicators. The optimization process is carried out using an enumeration algorithm. Enumeration involves listing all possible solutions, calculating the corresponding optimization objective values, and selecting the optimal solution. The specific steps in this study include (1) listing all possible restoration sequences, (2) selecting performance indicators and computing their cumulative values during the restoration process for each sequence, and (3) comparing results to identify the output with the maximum cumulative value and its corresponding restoration sequence.

4. Case Study

4.1. Case City

This study takes Shelby County, Tennessee, USA as the case city, since its CISs are representative and have been used in a number of studies. Shelby County is the most populous and largest county in Tennessee, covering a total area of 783 square miles, with a population of over 920,000. The CIS data of Shelby County were collected through previous studies [80,81], Google Maps, and official websites such as those belonging to the Shelby County, Tennessee, Department of Transportation, the U.S. Census Bureau, and the U.S. Bureau of Economic Analysis. Previous studies [80,81] provide the boundaries of 133 census tracts within Shelby County, historical earthquake activity data, and impact zones for the Madrid seismic zone, as well as the locations of electrical, gas, and water infrastructure components. They also included data regarding consumer numbers, consumption volumes, average prices, sales revenues, and daily and total incomes for different customer types across various CIS products in each census tract. Additionally, the studies covered industry employment numbers and the concentration of industries within each census tract, along with the resilience values of industries in in the event of infrastructure failures. Google Maps and the official website of the Tennessee Department of Transportation provide the geographic locations of Shelby County’s road infrastructure and annual average daily traffic volumes for various roads. The official website of Shelby County provides basic information about the county. The official websites of the U.S. Census Bureau and the U.S. Bureau of Economic Analysis provide tax revenue data and historical industry output and income data across different sectors for Shelby County, respectively.
This study identified 45 nodes for the electric power system (E), 16 nodes for the gas system (G), 49 nodes for the water supply system (W), and 14 nodes for the road system (R) in Shelby County. Additionally, the links between nodes were identified based on literature data and official statistics. Due to incomplete real data, this study also appropriately set the links between some nodes based on geographical location and functional dependencies. For example, pressure regulating stations of the gas system require nearby electric power nodes to provide power for normal operation, and facilities at intersections in the road system also depend on nearby electric power nodes. The nodes and links identified for the above four CISs in Shelby County are shown in Table 1 and Figure 2.

4.2. Disaster Scenarios and Simulation

Based on Shelby County’s geographical location and the historical records of disasters, the area is situated in the New Madrid Seismic Zone [80] and has experienced three earthquakes of a magnitude of 8.0 or higher in the past 200 years. According to the study of the recurrence rates and probability estimates of the New Madrid Seismic Zone [82], two potential disaster scenarios were set up for the case study, shown as Table 2. Scenario 1 assumes that an earthquake would result in concentrated damage in high-intensity local areas. Hence, CIS nodes within the MMI 8.5 range were randomly selected for initial failures, with each node having a 13% probability of failure. Scenario 2 assumes that all CIS nodes in Shelby County are at risk of failure. Therefore, nodes were randomly selected from all CIS nodes for initial failures, with each node having a 7% probability of failure. To facilitate a better comparison between the two scenarios and to observe dynamic changes during the failure propagation and recovery processes, the case study set the number of initially failed CIS nodes caused by both scenarios at 10, with these 10 nodes failing simultaneously. Using these 10 failed nodes as the impact on CISs, the case study conducted the simulation of failure propagation and recovery processes through Matlab programming, following the methodology outlined in Section 3. The failure propagation process was decomposed into consecutive steps. At each step, failures propagated from currently failed nodes to their direct connecting nodes. The state of each node was updated and recorded after each step until the states of all nodes stabilized, signaling the end of the failure propagation process. Since the 10 failed nodes need to be repaired one by one, the recovery process was divided into 10 stages (10T).

4.3. CIS Performance Evaluation and Grouping

The case study evaluates CIS performance based on Equations (1)–(10). Firstly, Shelby County is divided into 133 regions, based on census divisions. Each region contains corresponding CIS nodes. When one node fails, it ceases to provide services or products to the respective region. If a region exhibits multiple nodes in one CIS, the case study assumes that these nodes distribute the demand within the region. Additionally, the resilience value ( R i , g ) of industries in the absence of CIS services in the case study is derived from the study by Chang et al. [80]. To compare the recovery processes of CISs under different performance indicators, five groups are designed in this study to consider the socioeconomic impacts with different weights. The specific indicators are formulated as shown in Table 3. Groups 1–2 replicate indicators that have been commonly considered in previous studies, focusing on unilateral socioeconomic impact, including the proportion of unserved customers and the loss rate of industrial outputs. Groups 3–5 introduce comprehensive indicators proposed in this study, which consider various socioeconomic impacts, including comprehensive social impacts with an average of three related indicators for simplicity, comprehensive economic impacts with an average of three related indicators for simplicity, and global socioeconomic impacts with an average of six related indicators for simplicity.

5. Results and Discussion

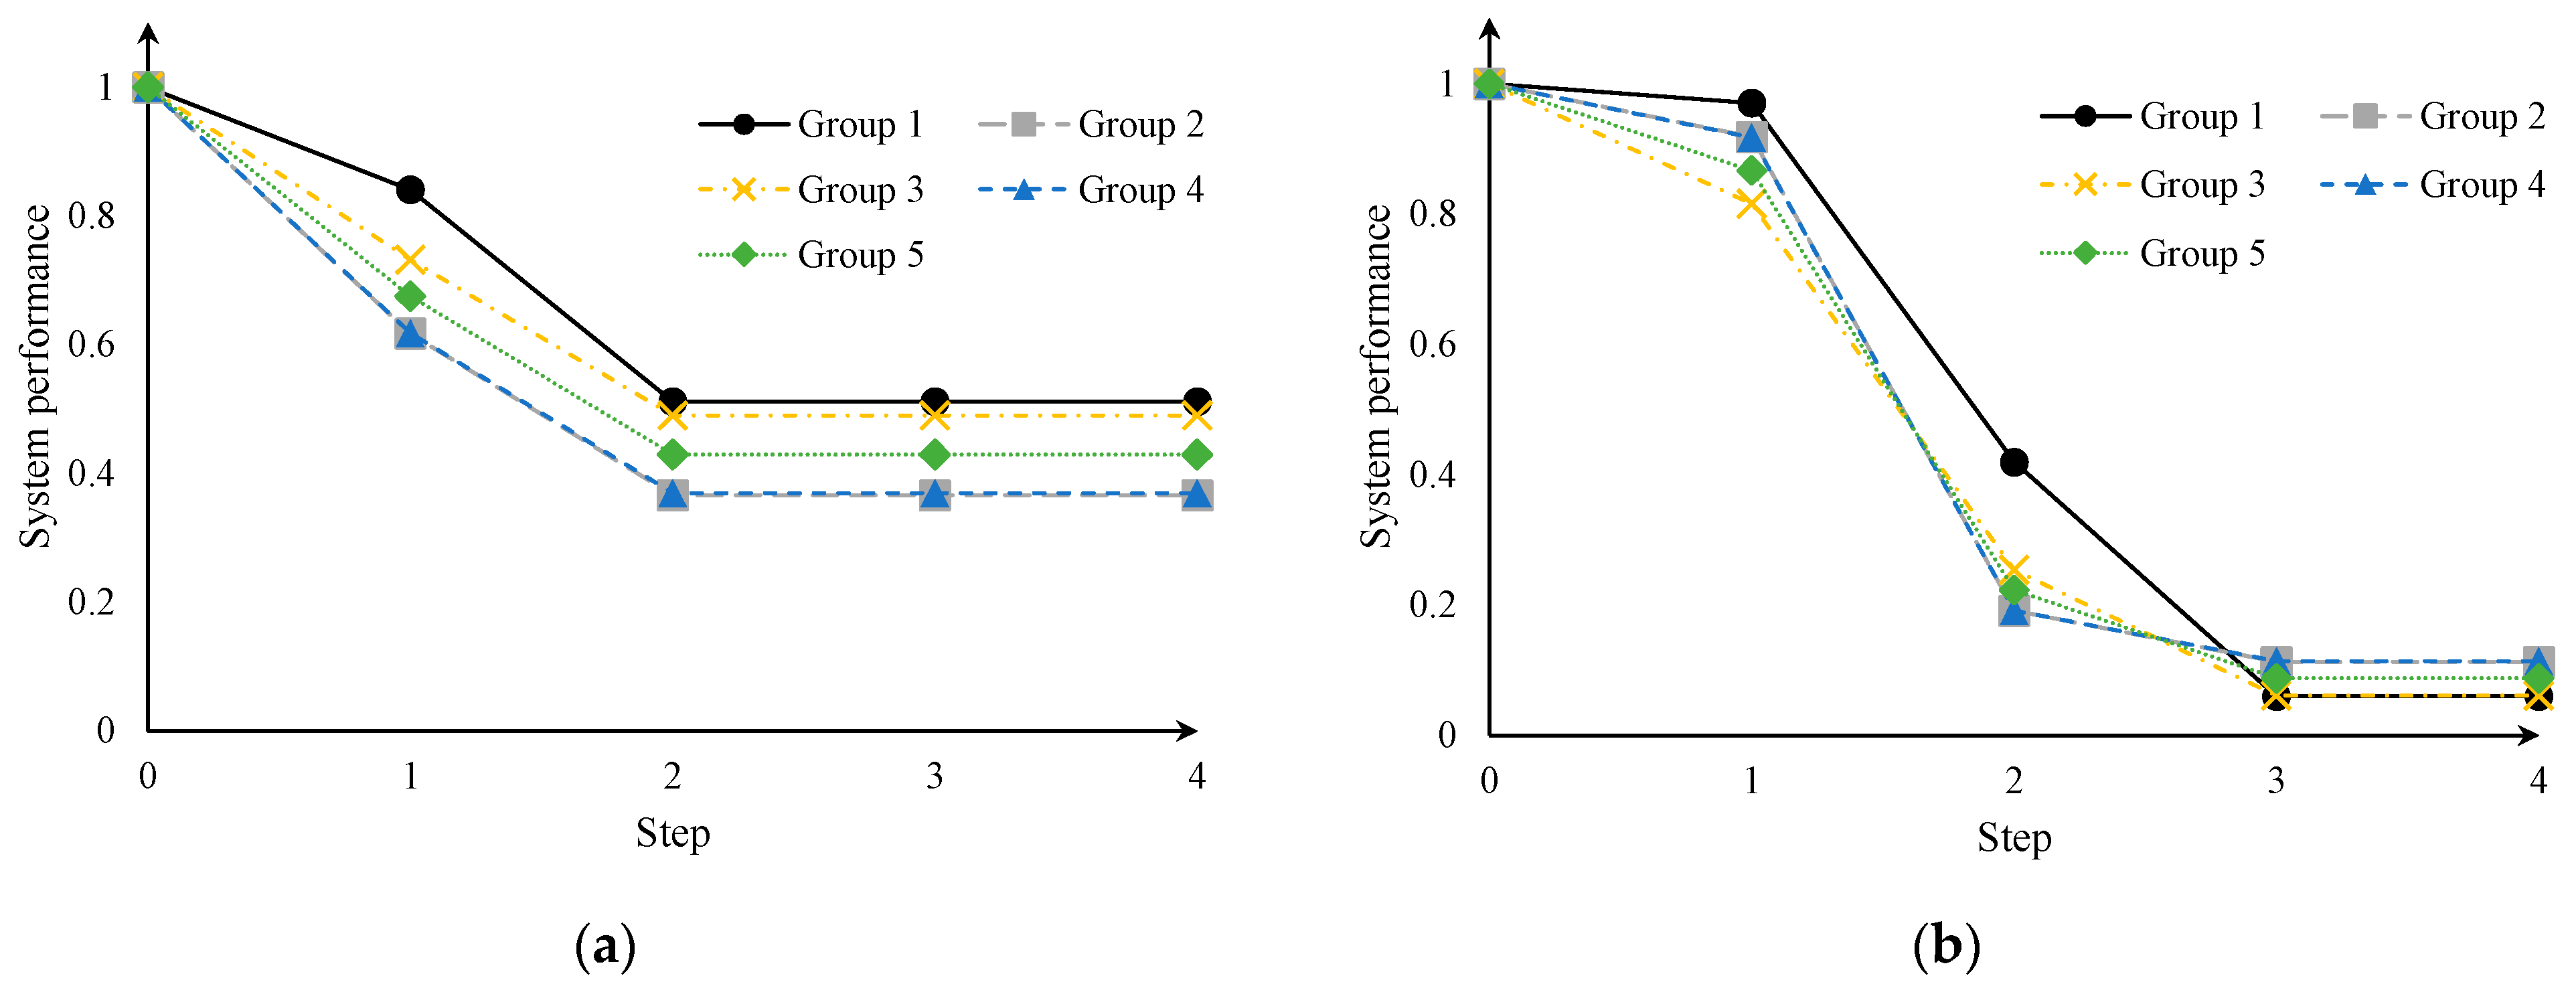
5.1. Failure Propagation and CIS Performance

Since the node failures are randomly generated with a certain probability, the generated disaster scenarios differ, but there is significant consistency in the comparative results of the evaluation groups. To better elucidate the detailed differences in the results of the five evaluation groups, this section selects two scenarios, namely Scenario 1.1 and Scenario 2.1, as the representatives of Scenario 1 and Scenario 2 to demonstrate the simulation results. The initial failed nodes and the number of failed nodes during the failure propagation process are shown in Table 4. In Scenario 1.1, characterized by concentrated damage, close to 50 nodes eventually fail, with most failing after the second step (first propagation step). In Scenario 2.1, characterized by widespread damage, over 100 nodes eventually fail, and the failure propagation continues into the third step (involving two propagation steps). In summary, the failure scale of widespread damage in Scenario 2.1 is almost twice that of concentrated damage in Scenario 1.1, and the propagation time is also longer. This suggests that, although the initial failure scale remains the same, if it can be contained within a certain spatial range, the subsequent scale of failure propagation will also decrease.
Figure 3 illustrates the variations between different CIS performance indicators during the failure propagation stage under two disaster scenarios. The results indicate, firstly, that compared to those under widespread damage, the differences in the values of various indicators are more significant under concentrated damage. This is because in Scenario 2, only 14% of nodes remain functional, resulting in consistently lower levels for all CIS performance indicators. This also implies that when the failure scale of CISs is not large, relying solely on a unilateral performance indicator may lead to misjudgments of the impact of CIS failure, and therefore, a comparative analysis or comprehensive evaluation using indicators that consider various socioeconomic impacts is advisable. Secondly, regardless of the disaster scenario, the values and variations between indicators considering unilateral (Group 2) and comprehensive (Group 4) economic impact are essentially consistent. The reason for this could be that although there are differences in tax rates and average employee income across industries, these differences are not substantial; therefore, the reduction of government tax revenues and resident income is primarily attributed to the loss of industrial outputs. This suggests that unless tax rates and average employee income across industries are significantly different and the impacts on different industries vary significantly, a single indicator is sufficient to consider the economic impact of CIS failures. Furthermore, under concentrated damage, the values of indicators considering economic impact (Groups 2 and 4) are significantly smaller than those considering social impact (Groups 1 and 3), indicating a greater economic than social impact. Conversely, under widespread damage, the values of indicators considering social impact (Groups 1 and 3) are significantly smaller than those considering economic impact (Groups 2 and 4), suggesting a greater social than economic impact. This could be attributed to the clustering effect of the economy and the equilibrium nature of social impacts. This implies that when the failure scale of CISs is substantial, social impacts of CIS failures should be carefully taken into consideration.

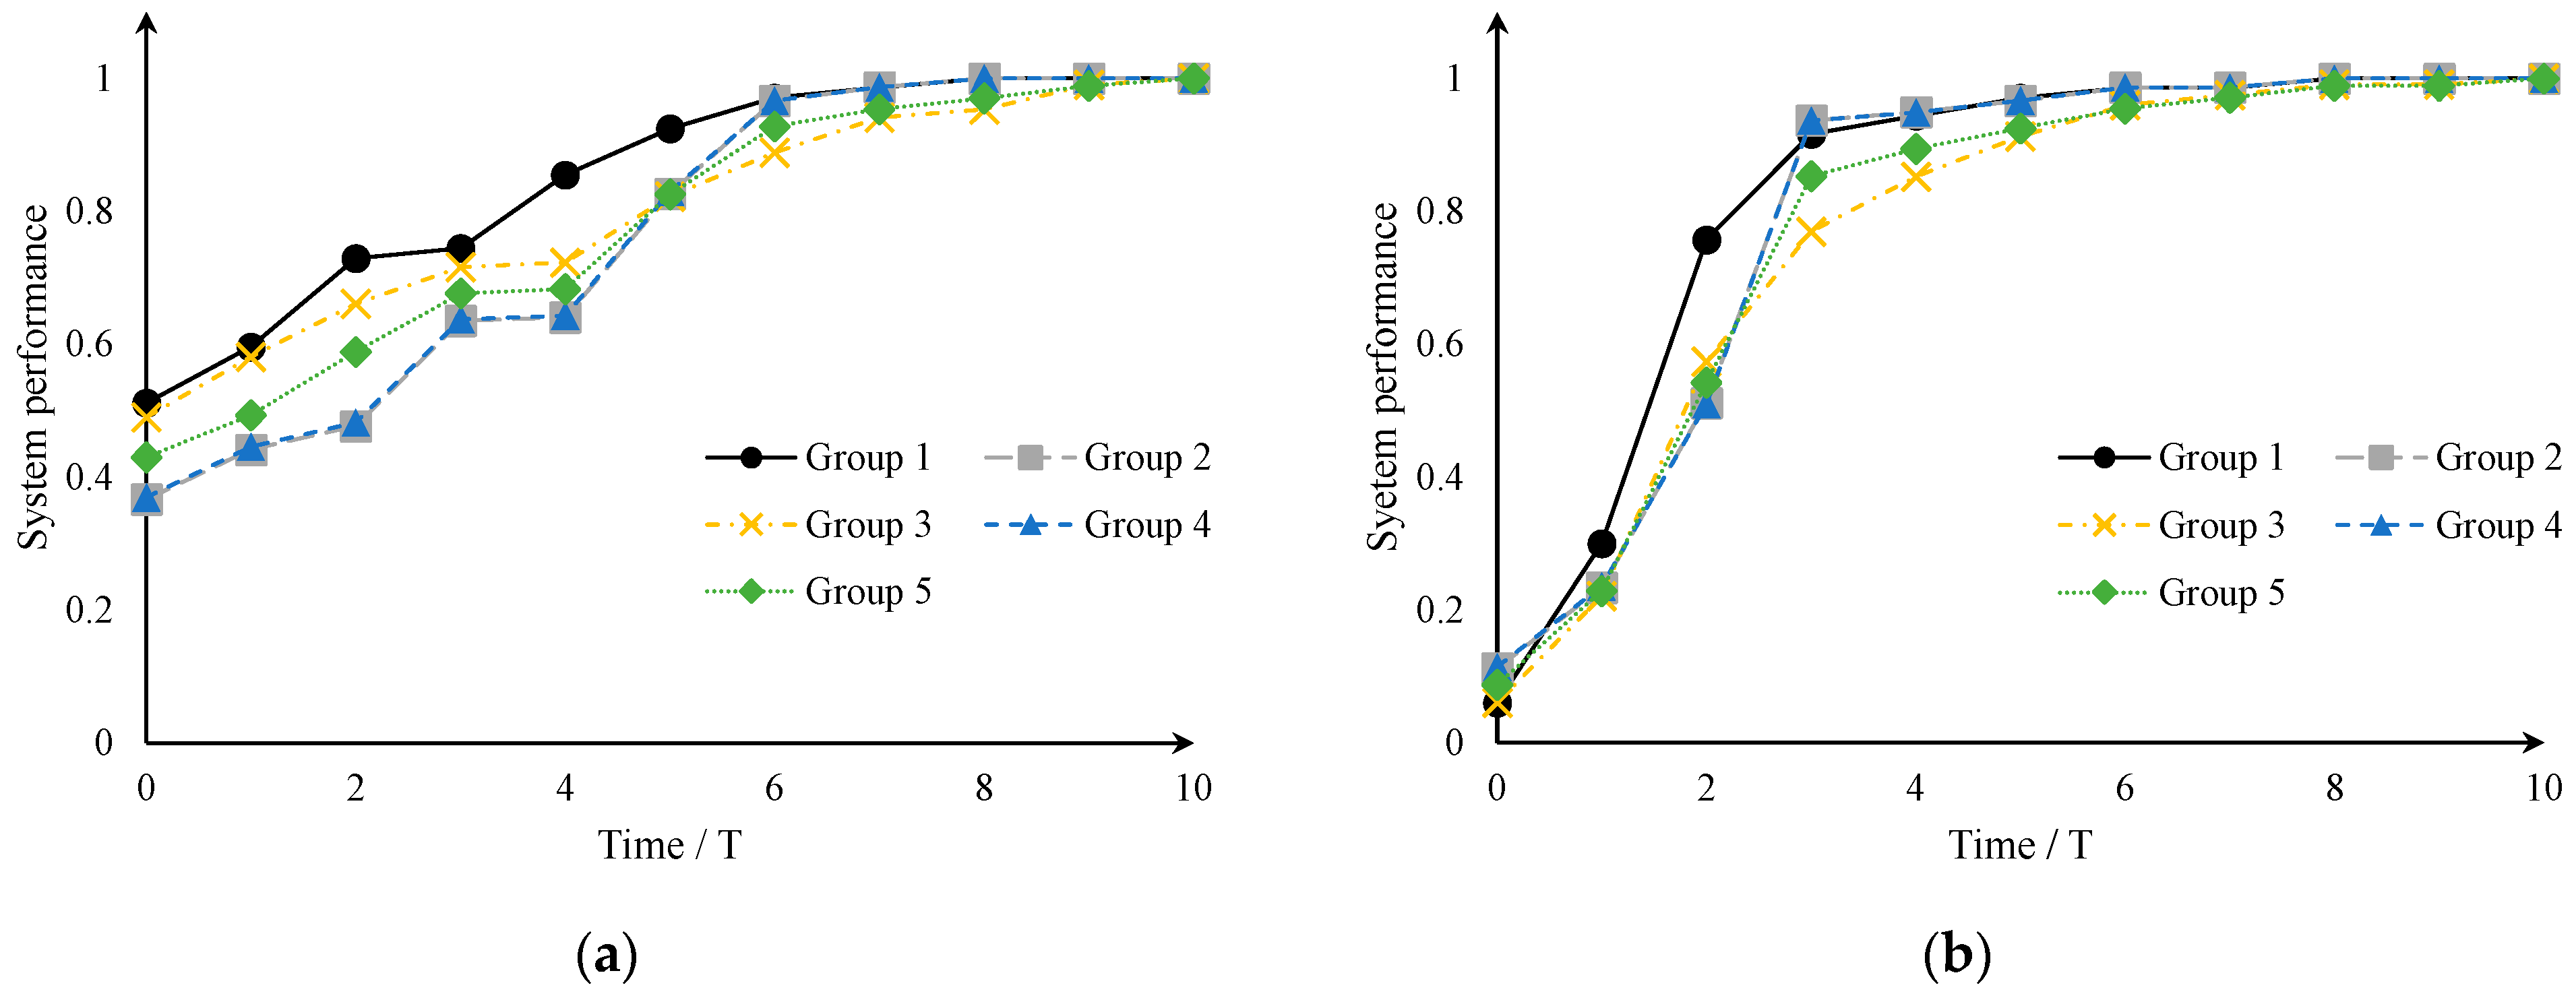
5.2. Restoration Sequence and Recovery Efficiency

Table 5 presents the optimized restoration sequences of initial failed nodes based on different CIS performance indicators as optimization objectives under two disaster scenarios. The results indicate, firstly, that regardless of the disaster scenario, the restoration sequences considering unilateral (Group 2) and comprehensive (Group 4) economic impacts are consistent. This consistency aligns with the behaviors of these two corresponding indicators during failure propagation. Similarly, the restoration sequences considering comprehensive social impact (Group 3) and global socioeconomic impact (Group 5) are also consistent. This suggests that compared to economic impact, social impact plays a greater and dominant role in optimizing restoration sequences, indirectly emphasizing the importance of considering social impact in CIS restoration sequencing. However, the restoration sequence considering unilateral social impact (Group 1) differs from the above two. This indicates that considering only the unilateral social impact in CIS restoration sequencing is insufficient. Additionally, the differences between these three restoration sequences under concentrated damage are more significant than under widespread damage. This implies that when the failure scale of CIS is not large, it is even more crucial to consider various socioeconomic impacts in optimizing CIS restoration sequences. Secondly, comparatively, when minimizing economic impact is the optimization objective, the restoration sequence of failed nodes in the electricity power and gas systems takes precedence. This is because industries rely more heavily on electricity power and gas for production and operations, while exhibiting greater resilience towards the loss of water supply and transportation. However, when minimizing social impact is the optimization objective, the restoration sequence of certain critical water supply and road nodes is prioritized. This aligns with the common understanding that residents rely on water for survival and have daily commuting needs.
Figure 4 illustrates the variation between different CIS performance indicators during the recovery stage under two disaster scenarios. The results indicate that, in both concentrated and widespread damage scenarios, CIS performance indicators considering economic impact and unilateral social impact (Groups 1, 2, and 4) have largely recovered (exceeding 0.95) by 6T and 5T, whereas indicators considering comprehensive social impact and global socioeconomic impact (Groups 3 and 5) do not reach similar levels of recovery until 8T and 7T, respectively. This suggests that the recovery efficiency of social impacts caused by CIS failures is usually lower than that of economic impacts, further emphasizing the significance of considering social impact in optimizing CIS restoration sequences. Additionally, it indicates that, although the failure scale of widespread damage is usually larger than that of concentrated damage, the recovery efficiency under widespread damage is also higher, potentially due to significant variations in the importance of failed nodes under widespread destruction.

5.3. Sensitivity Analysis

In order to ensure the robustness of the above results, this study conducts a sensitivity analysis by varying disaster scenarios. Another four representatives of Disaster Scenario 1 and 2 were selected, namely Scenario 1.2, 1.3, 2.2, and 2.3. Table 6 shows the number of failed nodes, CIS performance, and recovery time for these disaster scenarios and the five evaluation groups. The results of the sensitivity analysis indicate that regardless of the disaster scenario, the recovery of social indicators consistently trails that of economic indicators by approximately 2T. Furthermore, the results also indicate that in widespread disaster scenarios, the social impacts resulting from CIS failures are significantly higher than the economic impacts, by about 5%. Conversely, in concentrated disaster scenarios, the economic impacts resulting from CIS failure are significantly higher than the social impacts, by approximately 20–30%. These findings collectively suggest the essential need to integrate economic and social impacts in the post-disaster CIS performance assessment and optimization of recovery sequences.

6. Conclusions

This study identifies and constructs six socioeconomic impact indicators resulting from CIS failures by associating CISs with urban socioeconomic systems. Through different combinations of weights assigned to these six indicators, five groups for evaluating CIS performance are established. By simulating the failure propagation and recovery process of CISs, this study analyzes the post-disaster variations between different CIS performance indicators, as well as the corresponding restoration sequence and recovery efficiency. The results indicate that regardless of the disaster scenarios, the values and variations between indicators, considering unilateral and comprehensive economic impact, are essentially consistent. However, when the failure scale of CISs is substantial, ignoring social impacts would significantly underestimate the impacts of CIS failures. Moreover, the results indicate that the restoration sequence aimed at minimizing social impact differs from others by elevating the priority of failed nodes in the water supply and road systems, with the recovery efficiency in regards to social impact notably lower than those regarding economic impact.
This study provides management implications for scholars, CIS operators, and governments regarding post-disaster CIS recovery. Firstly, this study highlights the differences among various socioeconomic impact indicators in evaluating post-disaster CIS performance and optimizing repair sequences, offering a theoretical basis for scholars to select appropriate socioeconomic impact indicators in future related studies. Secondly, it suggests that CIS operators should consider social impacts when restoring failed CISs, thereby gaining a comprehensive understanding of the worst-case consequences of CIS failures from a bottom-line perspective. Furthermore, governments should comprehensively assess the diverse socioeconomic impacts caused by CIS failures, aiming to reconcile conflicts and disagreements among different stakeholders in the decision-making processes concerning CIS protection and post-disaster recovery.
There are still certain limitations in this study. Firstly, this study only considers an earthquake as a disaster scenario, with relatively simplistic scenario settings. Future studies could explore the differences and similarities in CIS performance and restoration sequences under a wider range of disaster scenarios, such as human-induced sabotage, random failures, and more types of natural disasters. Secondly, while the network model used in this study is mature and classic, more advanced models have been proposed in current studies. Future research could investigate the impact of employing different models on the results to further validate the credibility and generalizability of the conclusions drawn in this study. Additionally, this study made numerous assumptions regarding recovery processes to exclude other factors and to present the differences in restoration sequences more intuitively. Future studies could refine these assumptions, based on facts and experiences, and consider more factors influencing the recovery process, more closely aligning the optimization of restoration with reality.

Author Contributions

Conceptualization, Q.M. and Y.L.; methodology, Y.L.; software, Y.L.; validation, Q.M. and Y.L.; investigation, Y.L.; writing—original draft preparation, Y.L.; writing—review and editing, Q.M.; funding acquisition, Q.M. All authors have read and agreed to the published version of the manuscript.

Funding

This research was funded by the National Natural Science Foundation of China (NSFC) [Grant No. 72204280] and the Research and Innovation Team Support Program Funding Project of the Central University of Finance and Economics (CUFE) [Grant No. CUFE-2021-GG-1].

Institutional Review Board Statement

Not applicable.

Informed Consent Statement

Not applicable.

Data Availability Statement

The data that support the findings of this study are available from the corresponding author upon reasonable request.

Conflicts of Interest

The authors declare no conflicts of interest.

References

  1. Marasco, S.; Cardoni, A.; Zamani Noori, A.; Kammouh, O.; Domaneschi, M.; Cimellaro, G.P. Integrated platform to assess seismic resilience at the community level. Sustain. Cities Soc. 2021, 64, 102506. [Google Scholar] [CrossRef]
  2. Rinaldi, S.M.; Peerenboom, J.P.; Kelly, T.K. Identifying, understanding and analyzing critical infrastructure interdependencies. IEEE Control Syst. Mag. 2001, 21, 11–25. [Google Scholar]
  3. Mohebbi, S.; Zhang, Q.; Christian Wells, E.; Zhao, T.; Nguyen, H.; Li, M.; Abdel-Mottaleb, N.; Uddin, S.; Lu, Q.; Wakhungu, M.J.; et al. Cyber-physical-social interdependencies and organizational resilience: A review of water, transportation, and cyber infrastructure systems and processes. Sustain. Cities Soc. 2020, 62, 102327. [Google Scholar] [CrossRef]
  4. Pistrika, A.K.; Jonkman, S.N. Damage to residential buildings due to flooding of New Orleans after hurricane Katrina. Nat. Hazards 2010, 54, 413–434. [Google Scholar] [CrossRef]
  5. Yaukey, P.H. Population changes of urban land birds in the three years following the hurricane Katrina flood. Nat. Hazards 2012, 61, 1203–1217. [Google Scholar] [CrossRef]
  6. Ravadanegh, S.N.; Jamali, S.; Mohammadi Vaniar, A. Multi-infrastructure energy systems resiliency assessment in the presence of multi-hazards disasters. Sustain. Cities Soc. 2022, 79, 103687. [Google Scholar] [CrossRef]
  7. Dueñas-Osorio, L.; Craig, J.I.; Goodno, B.J.; Bostrom, A. Interdependent response of networked systems. J. Infrastruct. Syst. 2007, 13, 185–194. [Google Scholar] [CrossRef]
  8. Dueñas-Osorio, L.; Craig, J.I.; Goodno, B.J. Seismic response of critical interdependent networks. Earthq. Eng. Struct. D 2007, 36, 285–306. [Google Scholar] [CrossRef]
  9. Ip, W.H.; Wang, D. Resilience and Friability of Transportation Networks: Evaluation, Analysis and Optimization. IEEE Syst. J. 2011, 5, 189–198. [Google Scholar] [CrossRef]
  10. Ouyang, M.; Dueñas-Osorio, L. Time-dependent resilience assessment and improvement of urban infrastructure systems. Chaos Interdiscip. J. Nonlinear Sci. 2012, 22, 33122. [Google Scholar] [CrossRef]
  11. Christodoulou, S.E.; Fragiadakis, M.; Agathokleous, A.; Xanthos, S. Urban Water Distribution Networks: Assessing Systems Vulnerabilities, Failures, and Risks; Butterworth-Heinemann: Oxford, UK, 2018. [Google Scholar]
  12. Mao, Q.; Li, N. Assessment of the impact of interdependencies on the resilience of networked critical infrastructure systems. Nat. Hazards 2018, 93, 315–337. [Google Scholar] [CrossRef]
  13. Chang, S.E.; Shinozuka, M. Measuring improvements in the disaster resilience of communities. Earthq. Spectra 2004, 20, 739–755. [Google Scholar] [CrossRef]
  14. Ouyang, M.; Dueñas-Osorio, L. Multi-dimensional hurricane resilience assessment of electric power systems. Struct. Saf. 2014, 48, 15–24. [Google Scholar] [CrossRef]
  15. Ji, C.; Wei, Y.; Poor, H.V. Resilience of energy infrastructure and services: Modeling, data analytics and metrics. Proc. IEEE 2017, 105, 1354–1366. [Google Scholar] [CrossRef]
  16. Zhao, C.; Li, N.; Fang, D. Criticality assessment of urban interdependent lifeline systems using a biased PageRank algorithm and a multilayer weighted directed network model. Int. J. Crit. Infrastruct. Prot. 2018, 22, 100–112. [Google Scholar] [CrossRef]
  17. Hou, B.; Huang, J.; Miao, H.; Zhao, X.; Wu, S. Seismic resilience evaluation of water distribution systems considering hydraulic and water quality performance. Int. J. Disaster Risk Reduct. 2023, 93, 103756. [Google Scholar] [CrossRef]
  18. Liu, X.; Fang, Y.P.; Zio, E. A hierarchical resilience enhancement framework for interdependent critical infrastructures. Reliab. Eng. Syst. Safe 2021, 215, 107868. [Google Scholar] [CrossRef]
  19. Cavdaroglu, B.; Hammel, E.; Mitchell, J.E.; Sharkey, T.C.; Wallace, W.A. Integrating restoration and scheduling decisions for disrupted interdependent infrastructure systems. Ann. Oper. Res. 2013, 203, 279–294. [Google Scholar] [CrossRef]
  20. Kong, J.; Zhang, C.; Simonovic, S.P. Optimizing the resilience of interdependent infrastructures to regional natural hazards with combined improvement measures. Reliab. Eng. Syst. Safe 2021, 210, 107538. [Google Scholar] [CrossRef]
  21. Luna, R.; Balakrishnan, N.; Dagli, C.H. Postearthquake recovery of a water distribution system: Discrete event simulation using colored petri nets. J. Infrastruct. Syst. 2011, 17, 25–34. [Google Scholar] [CrossRef]
  22. Zuo, F.; Zio, E.; Yuan, Y. Risk-Response Strategy Optimization Considering Limited Risk-Related Resource Allocation and Scheduling. J. Constr. Eng. Manag. 2022, 148, 4022123. [Google Scholar] [CrossRef]
  23. Cai, Y.; Li, Y.; Cao, Y.; Li, W.; Zeng, X. Modeling and impact analysis of interdependent characteristics on cascading failures in smart grids. Int. J. Electr. Power Energy Syst. 2017, 89, 106–114. [Google Scholar] [CrossRef]
  24. Liu, W.; Song, Z.; Ouyang, M.; Li, J. Recovery-based seismic resilience enhancement strategies of water distribution networks. Reliab. Eng. Syst. Safe 2020, 203, 107088. [Google Scholar] [CrossRef]
  25. El Maissi, A.M.; Argyroudis, S.A.; Kassem, M.M.; Mohamed Nazri, F. Integrated seismic vulnerability assessment of road network in complex built environment toward more resilient cities. Sustain. Cities Soc. 2023, 89, 104363. [Google Scholar] [CrossRef]
  26. Ouyang, M. Review on modeling and simulation of interdependent critical infrastructure systems. Reliab. Eng. Syst. Safe 2014, 121, 43–60. [Google Scholar] [CrossRef]
  27. McDaniels, T.; Chang, S.; Peterson, K.; Mikawoz, J.; Reed, D. Empirical framework for characterizing infrastructure failure interdependencies. J. Infrastruct. Syst. 2007, 13, 175–184. [Google Scholar] [CrossRef]
  28. Mendonça, D.; Wallace, W.A. Impacts of the 2001 World Trade Center Attack on New York City critical infrastructures. J. Infrastruct. Syst. 2006, 12, 260–270. [Google Scholar] [CrossRef]
  29. Buldyrev, S.V.; Parshani, R.; Paul, G.; Stanley, H.E.; Havlin, S. Catastrophic cascade of failures in interdependent networks. Nature 2010, 464, 1025–1028. [Google Scholar] [CrossRef]
  30. Casalicchio, E.; Galli, E.; Tucci, S. Macro and micro agent-based modeling and simulation of critical infrastructures. In Proceedings of the 2010 Complexity in Engineering, Rome, Italy, 22–24 February 2010; pp. 79–81. [Google Scholar]
  31. Zhao, T.; Sun, L. Seismic resilience assessment of critical infrastructure-community systems considering looped interdependences. Int. J. Disaster Risk Reduct. 2021, 59, 102246. [Google Scholar] [CrossRef]
  32. Haimes, Y.Y.; Jiang, P. Leontief-based model of risk in complex interconnected infrastructures. J. Infrastruct. Syst. 2001, 7, 1–12. [Google Scholar] [CrossRef]
  33. Cagno, E.; De Ambroggi, M.; Grande, O.; Trucco, P. Risk analysis of underground infrastructures in urban areas. Reliab. Eng. Syst. Safe 2011, 96, 139–148. [Google Scholar] [CrossRef]
  34. Jiang, P.; Haimes, Y.Y. Risk Management for Leontief-Based Interdependent Systems. Risk Anal. 2004, 24, 1215–1229. [Google Scholar] [CrossRef]
  35. Johansson, J.; Hassel, H. An approach for modelling interdependent infrastructures in the context of vulnerability analysis. Reliab. Eng. Syst. Safe 2010, 95, 1335–1344. [Google Scholar] [CrossRef]
  36. Schotten, R.; Bachmann, D. Critical infrastructure network modelling for flood risk analyses: Approach and proof of concept in Accra, Ghana. J. Flood Risk Manag. 2023, 16, e12913. [Google Scholar] [CrossRef]
  37. Enayaty Ahangar, N.; Sullivan, K.M.; Nurre, S.G. Modeling interdependencies in infrastructure systems using multi-layered network flows. Comput. Oper. Res. 2020, 117, 104883. [Google Scholar] [CrossRef]
  38. Svendsen, N.K.; Wolthusen, S.D. Connectivity models of interdependency in mixed-type critical infrastructure networks. Inf. Secur. Tech. Rep. 2007, 12, 44–55. [Google Scholar] [CrossRef]
  39. Yin, Y.; Val, D.V.; Zou, Q.; Yurchenko, D. Resilience of critical infrastructure systems to floods: A coupled probabilistic network flow and LISFLOOD-FP model. Water 2022, 14, 683. [Google Scholar] [CrossRef]
  40. Li, N.; Wang, F.; Magoua, J.J.; Fang, D. Interdependent effects of critical infrastructure systems under different types of disruptions. Int. J. Disaster Risk Reduct. 2022, 81, 103266. [Google Scholar] [CrossRef]
  41. Huang, X.; Wang, N. Post-disaster restoration planning of interdependent infrastructure Systems: A framework to balance social and economic impacts. Struct. Saf. 2024, 107, 102408. [Google Scholar] [CrossRef]
  42. Cimellaro, G.P.; Solari, D.; Bruneau, M. Physical infrastructure interdependency and regional resilience index after the 2011 Tohoku Earthquake in Japan. Earthq. Eng. Struct. D 2014, 43, 1763–1784. [Google Scholar] [CrossRef]
  43. Sun, W.; Bocchini, P.; Davison, B.D. Model for estimating the impact of interdependencies on system recovery. J. Infrastruct. Syst. 2020, 26, 4020031. [Google Scholar] [CrossRef]
  44. Li, Y.; Lin, J.; Zhang, C.; Zhu, H.; Zeng, S.; Sun, C. Joint optimization of structure and protection of interdependent infrastructure networks. Reliab. Eng. Syst. Safe 2022, 218, 108163. [Google Scholar] [CrossRef]
  45. Sharkey, T.C.; Nurre, S.G.; Nguyen, H.; Chow, J.H.; Mitchell, J.E.; Wallace, W.A. Identification and Classification of Restoration Interdependencies in the Wake of Hurricane Sandy. J. Infrastruct. Syst. 2016, 22, 4015007. [Google Scholar] [CrossRef]
  46. Mao, X.; Lou, X.; Yuan, C.; Zhou, J. Resilience-Based Restoration Model for Supply Chain Networks. Mathematics 2020, 8, 163. [Google Scholar] [CrossRef]
  47. Li, Z.; Jin, C.; Hu, P.; Wang, C. Resilience-based transportation network recovery strategy during emergency recovery phase under uncertainty. Reliab. Eng. Syst. Safe 2019, 188, 503–514. [Google Scholar] [CrossRef]
  48. Gharib, Z.; Yazdani, M.; Bozorgi-Amiri, A.; Tavakkoli-Moghaddam, R.; Taghipourian, M.J. Developing an integrated model for planning the delivery of construction materials to post-disaster reconstruction projects. J. Comput. Des. Eng. 2022, 9, 1135–1156. [Google Scholar] [CrossRef]
  49. Li, B.; Ofori-Boateng, D.; Gel, Y.R.; Zhang, J. A hybrid approach for transmission grid resilience assessment using reliability metrics and power system local network topology. Sustain. Resilient Infrastruct. 2021, 6, 26–41. [Google Scholar] [CrossRef]
  50. Dueñas-Osorio, L.; Vemuru, S.M. Cascading failures in complex infrastructure systems. Struct. Saf. 2009, 31, 157–167. [Google Scholar] [CrossRef]
  51. Portante, E.C.; Kavicky, J.A.; Craig, B.A.; Talaber, L.E.; Folga, S.M. Modeling electric power and natural gas system interdependencies. J. Infrastruct. Syst. 2017, 23, 4017035. [Google Scholar] [CrossRef]
  52. Zhang, J.; Hu, F.; Wang, S.; Dai, Y.; Wang, Y. Structural vulnerability and intervention of high speed railway networks. Phys. A Stat. Mech. Its Appl. 2016, 462, 743–751. [Google Scholar] [CrossRef]
  53. Xu, M.; Ouyang, M.; Mao, Z.; Xu, X. Improving repair sequence scheduling methods for postdisaster critical infrastructure systems. Comput.-Aided Civ. Infrastruct. Eng. 2019, 34, 506–522. [Google Scholar] [CrossRef]
  54. Kong, J.; Zhang, C.; Simonovic, S.P. Resilience and risk-based restoration strategies for critical infrastructure under uncertain disaster scenarios. Sustain. Cities Soc. 2023, 92, 104510. [Google Scholar] [CrossRef]
  55. Nurre, S.G.; Cavdaroglu, B.; Mitchell, J.E.; Sharkey, T.C.; Wallace, W.A. Restoring infrastructure systems: An integrated network design and scheduling (INDS) problem. Eur. J. Oper. Res. 2012, 223, 794–806. [Google Scholar] [CrossRef]
  56. Tan, Y.; Qiu, F.; Das, A.K.; Kirschen, D.S.; Arabshahi, P.; Wang, J. Scheduling Post-Disaster Repairs in Electricity Distribution Networks. IEEE Trans. Power Syst. 2019, 34, 2611–2621. [Google Scholar] [CrossRef]
  57. González, A.D.; Dueñas-Osorio, L.; Sánchez-Silva, M.; Medaglia, A.L. The Interdependent Network Design Problem for Optimal Infrastructure System Restoration. Comput.-Aided Civ. Infrastruct. Eng. 2016, 31, 334–350. [Google Scholar] [CrossRef]
  58. Fereshtehnejad, E.; Gidaris, I.; Rosenheim, N.; Tomiczek, T.; Padgett, J.E.; Cox, D.T.; Van Zandt, S.; Gillis, P.W. Probabilistic risk assessment of coupled natural-physical-social systems: Cascading impact of hurricane-induced damages to civil infrastructure in Galveston, Texas. Nat. Hazards Rev. 2021, 22, 4021013. [Google Scholar] [CrossRef]
  59. Dudenhoeffer, D.D.; Permann, M.R.; Manic, M. CIMS: A framework for infrastructure interdependency modeling and analysis. In Proceedings of the 2006 Winter Simulation Conference, Monterey, CA, USA, 3–6 December 2006; pp. 478–485. [Google Scholar]
  60. Afsharinejad, A.H.; Ji, C.; Wilcox, R. Large-scale data analytics for resilient recovery services from power failures. Joule 2021, 5, 2504–2520. [Google Scholar] [CrossRef]
  61. Bruneau, M.; Chang, S.E.; Eguchi, R.T.; Lee, G.C.; O’Rourke, T.D.; Reinhorn, A.M.; Shinozuka, M.; Tierney, K.; Wallace, W.A.; Von Winterfeldt, D. A framework to quantitatively assess and enhance the seismic resilience of communities. Earthq. Spectra 2003, 19, 733–752. [Google Scholar] [CrossRef]
  62. Cigu, E.; Agheorghiesei, D.T.; Gavriluță Vatamanu, A.F.; Toader, E. Transport Infrastructure Development, Public Performance and Long-Run Economic Growth: A Case Study for the Eu-28 Countries. Sustainability 2019, 11, 67. [Google Scholar] [CrossRef]
  63. Oriangi, G.; Albrecht, F.; Bamutaze, Y.; Mukwaya, P.I.; Bob, N.; Pilesjö, P. Perceptions of resilience to climate-induced disasters in Mbale municipality in Uganda. Environ. Hazards 2021, 20, 116–131. [Google Scholar] [CrossRef]
  64. Zhang, P.; Peeta, S. A generalized modeling framework to analyze interdependencies among infrastructure systems. Transp. Res. Part B Methodol. 2011, 45, 553–579. [Google Scholar] [CrossRef]
  65. Namazi, H.; Taghavipour, A. Traffic flow and emissions improvement via Vehicle-to-vehicle and vehicle-to-infrastructure communication for an intelligent intersection. Asian J. Control 2021, 23, 2328–2342. [Google Scholar] [CrossRef]
  66. Pell, A.; Nyamadzawo, P.; Schauer, O. Intelligent transportation system for traffic and road infrastructure-related data. Int. J. Adv. Logist. 2016, 5, 19–29. [Google Scholar] [CrossRef]
  67. Alabbad, Y.; Mount, J.; Campbell, A.M.; Demir, I. Assessment of transportation system disruption and accessibility to critical amenities during flooding: Iowa case study. Sci. Total Environ. 2021, 793, 148476. [Google Scholar] [CrossRef] [PubMed]
  68. Huang, Y.; Zong, H. Spatiotemporal evolution of land transportation networks and accessibility in inland mountainous areas 1917–2017: A case study of Southwest China. J. Mt. Sci. 2020, 17, 2262–2279. [Google Scholar] [CrossRef]
  69. Zhang, L.; Yuan, S.; Dong, R.; Zheng, J.; Gan, B.; Fang, D.; Liu, Y.; Fu, H. SWCARE: Switchable learning and connectivity-aware refinement method for multi-city and diverse-scenario road mapping using remote sensing images. Int. J. Appl. Earth Obs. 2024, 127, 103665. [Google Scholar] [CrossRef]
  70. Yang, T.; Yu, N.; Yang, T.; Hong, T. How do urban socio-economic characteristics shape a city’s social recovery? An empirical study of COVID-19 shocks in China. Int. J. Disaster Risk Reduct. 2023, 90, 103643. [Google Scholar] [CrossRef] [PubMed]
  71. Liu, B.; Huo, T.; Wang, X.; Shen, Q.; Chen, Y. The decision model of the intuitionistic fuzzy group bid evaluation for urban infrastructure projects considering social costs. Can. J. Civil. Eng. 2013, 40, 263–273. [Google Scholar] [CrossRef]
  72. Wu, X.; Wang, Z.; Gao, G.; Guo, J.; Xue, P. Disaster probability, optimal government expenditure for disaster prevention and mitigation, and expected economic growth. Sci. Total Environ. 2020, 709, 135888. [Google Scholar] [CrossRef]
  73. Benali, N.; Mbarek, M.B.; Feki, R. Natural disaster, government revenues and expenditures: Evidence from high and middle-income countries. J. Knowl. Econ. 2019, 10, 695–710. [Google Scholar] [CrossRef]
  74. Espada, R.; Apan, A.; McDougall, K. Spatial modelling of natural disaster risk reduction policies with Markov decision processes. Appl. Geogr. 2014, 53, 284–298. [Google Scholar] [CrossRef]
  75. Xu, Z.; Das, D.K.; Guo, W.; Wei, W. Does power grid infrastructure stimulate regional economic growth? Energy Policy 2021, 155, 112296. [Google Scholar] [CrossRef]
  76. Liu, Q.; Wang, S.; Zhang, W.; Li, J.; Zhao, Y.; Li, W. China’s municipal public infrastructure: Estimating construction levels and investment efficiency using the entropy method and a DEA model. Habitat. Int. 2017, 64, 59–70. [Google Scholar] [CrossRef]
  77. Xu, J.; Zeng, Z.; Hong, Y.; Xi, Z.; Zhu, X.; Peng, Z. Grassroots mirroring under COVID-19: Does community resilience affect residents’ responses? The case of Shenzhen, China. Sustainability 2022, 14, 10159. [Google Scholar] [CrossRef]
  78. Wang, W.; Zhao, Y. Impact of Natural Disasters on Household Income and Expenditure Inequality in China. Sustainability 2023, 15, 13813. [Google Scholar] [CrossRef]
  79. Bui, A.T.; Dungey, M.; Nguyen, C.V.; Pham, T.P. The impact of natural disasters on household income, expenditure, poverty and inequality: Evidence from Vietnam. Appl. Econ. 2014, 46, 1751–1766. [Google Scholar] [CrossRef]
  80. Chang, S.E.; Seligson, H.A.; Eguchi, R.T. Estimation of the Economic Impact of Multiple Lifeline Disruption: Memphis Light, Gas and Water Division Case Study; NCEER-96-0011; National Center for Earthquake Engineering Research: Buffalo, NY, USA, 1996; p. 204. [Google Scholar]
  81. Karakoc, D.B.; Barker, K.; Zobel, C.W.; Almoghathawi, Y. Social vulnerability and equity perspectives on interdependent infrastructure network component importance. Sustain. Cities Soc. 2020, 57, 102072. [Google Scholar] [CrossRef]
  82. Johnston, A.C.; Nava, S.J. Recurrence rates and probability estimates for the New Madrid Seismic Zone. J. Geophys. Res. Solid Earth 1985, 90, 6737–6753. [Google Scholar] [CrossRef]
Figure 1. Simulation process of post-disaster CIS failure propagation and recovery.
Sustainability 16 06609 g001
Figure 2. CISs and their interdependencies in the case city.
Sustainability 16 06609 g002
Figure 3. Results of failure propagation in CISs for different disaster scenarios and evaluation groups. (a) Scenario 1; (b) Scenario 2.
Sustainability 16 06609 g003
Figure 4. Results of recovery in CISs for different disaster scenarios and evaluation groups. (a) Scenario 1; (b) Scenario 2.
Sustainability 16 06609 g004
Table 1. Nodes and links of CISs in the case city.
CISNumber of NodesNumber of Links
Electric power (E)Gate stations (8), 23-kv substations (17), 12-kv substations (20)59
Gas (G)Gate stations (3), pressure regulating stations (13)18
Water supply (W)Reservoirs (6), pumps (9), distribution points (34)68
Roads (R)Intersections (14)29
Table 2. Disaster scenario settings.
ScenarioFailure RangeFailure ProbabilityFailure Result
1Within the MMI 8.513%10 nodes
2Whole county7%10 nodes
Table 3. CIS performance evaluation grouping.
Group NumberWeights
1 Q 1 = Q customer
2 Q 2 = Q production
3 Q 3 = Q customer + Q unemployment + Q efficiency / 3
4 Q 4 = Q industry + Q tax + Q income / 3
5 Q 5 = Q customer + Q unemployment + Q efficiency + Q industry + Q tax + Q income / 6
Table 4. Initial failed nodes and failure propagation.
ScenarioInitial Failed NodesNumber of Failed Nodes
Step 1Step 2Step 3Step 4
1.1P9, P26, P32, G1, G10, W12, W21, W32, R1, R410454748
2.1P8, P15, P26, G2, G15, W3, W20, W23, R2, R61062105107
Table 5. Restoration sequence of failed nodes for different disaster scenarios and evaluation groups.
Group NumberRestoration Sequence
Scenario 1.1Scenario 2.1
1234567891012345678910
1P9W12P32G10W32G1P26W21R4R1P8P15G2W3G15P26W23W20R6R2
2G1P9W12P32G10W32P26W21R4R1P8P15G2P26G15W3W23W20R6R2
3P9W12G1P32G10W32R4P26R1W21P8P15G2R6R2P26G15W3W23W20
4G1P9W12P32G10W32P26W21R4R1P8P15G2P26G15W3W23W20R6R2
5P9W12G1P32G10W32R4P26R1W21P8P15G2R6R2P26G15W3W23W20
Table 6. CIS failure and recovery for different evaluation groups under varying disaster scenarios.
Scenario1.11.21.32.12.22.3
Number of failed nodes484651107104111
CIS performance after failure propagationGroup 10.5120.5950.4570.0600.0670.050
Group 20.3670.4150.3340.1120.1240.104
Group 30.4900.5630.4240.0610.0680.053
Group 40.3700.4140.3310.1140.1290.107
Group 50.4300.4890.3770.0870.0990.080
Recovery time for achieving a CIS performance of 0.95Group 16T6T6T5T5T5T
Group 26T6T6T5T5T5T
Group 38T8T8T7T7T7T
Group 46T6T6T5T5T5T
Group 58T8T8T7T7T7T
Disclaimer/Publisher’s Note: The statements, opinions and data contained in all publications are solely those of the individual author(s) and contributor(s) and not of MDPI and/or the editor(s). MDPI and/or the editor(s) disclaim responsibility for any injury to people or property resulting from any ideas, methods, instructions or products referred to in the content.

