Article

Sustainable Ecological Non-Sintered Ceramsite (SENC) with Alkali Activators: Performance Regulation and Microstructure

1
School of Water Conservancy, North China University of Water Resources and Electric Power, Zhengzhou 450046, China
2
Henan Key Laboratory of Water Environment Simulation and Treatment, Zhengzhou 450045, China
*
Author to whom correspondence should be addressed.
Sustainability 2024, 16(15), 6634; https://doi.org/10.3390/su16156634 (registering DOI)
Submission received: 10 June 2024 / Revised: 17 July 2024 / Accepted: 1 August 2024 / Published: 2 August 2024
(This article belongs to the Section Sustainable Materials)

Abstract

:
The development of novel materials made from waste is one of the main measures to achieve sustainable materials development. In this study, ash of mushroom and corn straw (MCA) and furnace slag (FS) were used as raw materials to prepare alkali-activated biomass ash-slag material (AABS) and sustainable ecological non-sintered ceramsite (SENC). In this paper, the effects of quicklime powder (QL), NaOH, and sodium silicate solution (SS) on AABS were analyzed using single factor and orthogonal tests, and the preferred ratio of the composite alkali activator configuration was established. SENC was prepared based on the composite alkali activator, and the microstructure and phase composition of SENC were explored using XRD and SEM–EDS. The results showed that 3 wt% QL enhanced the early age compressive strength of AABS. The composite alkali activator was best configured when the additions of QL, NaOH, and SS were 3%, 2%, and 15%, respectively. At this configuration, the 28 d compressive strength of AABS was 47.4 MPa, and most of the internal pores were less than 0.4 μm; the 28 d numerical tube pressure of the SENC reached 12.2 MPa with a softening coefficient of 0.96. According to the results of XRD and SEM–EDS, SENC contained various hydration products such as C-A-S-H, calcium hemicarboaluminate, hydrotalcite, portlandite, and vaterite. The largest proportion of hydration products was C-A-S-H, which contributed to the pore refinement and structural densification. SENC has the potential to be used as coarse aggregate in sustainable lightweight concrete.

1. Introduction

Under the influence of human activities, the era of global warming has ended, and the era of global boiling has arrived. People must face problems such as climate and environmental degradation, and the concept of sustainable development has become the consensus of the whole society [1,2,3]. Concrete, as one of the most important materials in the construction industry, consumes a large amount of cement every year. According to statistics, for 1 t cement product produced, 0.85 t CO2 is released [4,5]. Therefore, the research of green cementitious materials that can replace cement has received attention. The results of current research show that furnace slag (FS) is rich in Si and Al, while it also has excellent mechanical properties and the potential to become a green alternative material for cement after alkali activation, which can provide a solution to current ecological problems [6,7].
Led by policy and carbon emission strategies, the biomass industry is developing rapidly, with biomass combustion for power generation being a relatively mature technology [8]. The waste produced after biomass power generation processes such as combustion, pyrolysis, gasification, and alcoholic fermentation is known as biomass ash [9]. In recent years, biomass ash has gained attention due to its many sources and its sustainability, and research which uses biomass ash in concrete as a supplementary cementitious material has been increasing year by year. It has been shown that biomass ash has the potential to be a sustainable alternative to cement and fly ash and to reduce the carbon footprint of concrete [10,11]. Teixeira et al. [12] found that when biomass fly ash replaces 50% of the mass of cement, cement hydration could be increased and its pozzolanic activity was more complete. Yurt et al. [13] used hazelnut shell ash and metakaolin to prepare high-strength alkali-activated concrete (AAC), finding that the 3d compressive strength of AAC cured in water at 60 °C was 89 MPa and that AAC obtained with hazelnut shell ash substitution had higher abrasion resistance than mixtures containing metakaolin. Certainly, biomass ash is not without disadvantages, as the report claimed that the replacement of cement by biomass ash resulted in a decrease in concrete properties (such as compressive strength, E-modulus, and resistance to chloride ion permeability) [14]. However, if biomass ash is combined with alkali-activated slag, then complementary advantages are achievable.
It is noteworthy that FS and biomass ash contain high levels of SiO2 and Al2O3, which have the prerequisites for the preparation of ceramsites. Additionally, alkali activators are helpful in increasing the integrity and strength of ceramsites. It has been reported that ferronickel slag and municipal solid-waste-incineration fly ash have been sintered to prepare high-strength ceramsite, but high-temperature sintering is controversial due to the complex process, secondary consumption of energy, and pollution problems it involves [15]. Non-sintered ceramsite (NSC) demonstrates another environment-friendly possibility for waste resource conversion. Frankovič et al. [16] and Hu et al. [17] both used fly ash and cement as raw materials to produce NSCs successfully. The former cured it under natural conditions with a numerical tube pressure of 6.8 MPa, while the latter innovatively added quicklime and gypsum and used steam curing to accelerate the hydration reaction, which resulted in NSCs with a numerical tube pressure of 8.2 MPa. Pan et al. [18] found that when the mass ratio of ground granulated blast-furnace slag, steel slag, fly ash, and cement was 3:3:3:1, and 3 wt% water glass and 5 wt% CaSO4•2H2O were used as alkali activators, the numerical tube pressure of NSCs could reach 12.4 MPa. The study of Yu et al. [19] showed that with 2 wt% expanded perlite and 1 wt% grade-A cellulose and a mass ratio of 4:4:1:1 for steel slag, fly ash, clay, and cement, the numerical tube pressure of NSCs was 8.153 MPa, and there were many loose and porous honeycomb vitreous structures in NSCs. Shi et al. [20] used solid wastes (red mud, calcium carbide slag, and fly ash) to prepare NSCs with a numerical tube pressure of 4.6 MPa and a softening coefficient of 0.95. Under 600 °C thermal activations, the apparent density, bulk density, and water absorption of NSCs containing sewage sludge with a numerical tube pressure of 7.43 MPa prepared by Ma et al. were 2603 kg/m3, 852 kg/m3, and 8.37%, respectively [21]. These studies used industrial solid wastes such as fly ash, steel slag, and blast-furnace slag as raw materials, and the results also showed that the NSCs prepared from these wastes also had outstanding properties. However, cement was still used in most of the studies, which certainly increases carbon emissions. In addition, the types of alkali activators used in the above studies include, but are not limited to, wastewater with NaOH, quicklime, sodium silicate solution, and so on. It is evident that alkali activators are also important factors in constituting the strength of NSCs, but the optimal ratio of the composite alkali activator applicable to NSCs has not yet been reported.
In this paper, furnace slag (FS) and ash of mushroom and corn straw (MCA) were used as raw materials, quicklime powder (QL), NaOH, and sodium silicate solution (SS) were used as alkali activators, and an alkali-activated biomass ash-slag material (AABS) was prepared. The influences of different factors of alkali activators on AABS were investigated by single factor test and orthogonal test to select the optimal ratio of the composite alkali activators. Then, sustainable ecological non-sintered ceramsite (SENC) was prepared. The physical and mechanical properties, the phase composition, and the microstructure of SENC were observed and analyzed using various performance tests such as X-ray diffraction (XRD) and scanning electron microscopy (SEM) to explore the possibility of its use as a coarse aggregate for lightweight concrete. Based on the concept of sustainable development, this study is useful to understand the role and suitable range of alkali activators and provides ideas for the resourceful utilization of solid waste.

2. Materials and Methods

2.1. Materials

In this study, MCA was the ash obtained from agricultural waste (mushroom and corn straw) after biomass generation, which was dried and sieved to 0.15 mm. The specific surface area and density of MCA were 593.03 m2/kg and 2.428 g/cm3, respectively. Grade-S95 FS with a particle size of less than 0.15 mm, a specific surface area of 424.16 m2/kg, and a density of 3.1 g/cm3 was used. The main chemical compositions of the FS and MCA are listed in Table 1. The alkali activators in this test included QL, NaOH, and SS. The CaO content in QL was about 95%. The initial modulus and the water content of the SS were 3.3 and 64.16%, respectively.

2.2. Mix Proportion Design

In this study, the percentage of material was taken as a percentage of the sum of the mass of the FS and MCA. After preliminary tests, it was found that the AABS performed better when the water-to-binder ratio (W/B) was 0.35 and the mass ratio of FS to MCA was 1:1. The AABS was prepared by QL (2% to 10% with a gradient of 2%), NaOH (1% to 5% with a gradient of 1%), SS modulus (1 a.u. to 3 a.u. with a gradient of 0.5 a.u. and SS addition of 15%), and SS (2.5% to 15% with a gradient of 2.5% and a SS modulus of 1.5) as single variables. The SS modulus was adjusted by NaOH and SS. Based on the single factor test, an orthogonal test was conducted with QL, NaOH, and SS as the three factors. The orthogonal test design is shown in Table 2 and Table 3. In Table 3, the AABS specimens were categorized into NO. 1 to NO. 9 according to the use of different alkali activators. For instance, A (3 wt%) B (2 wt%) C (15 wt%) is the test group NO. 5 with 3 wt%, 2 wt%, and 15 wt% additions of QL, NaOH, and SS, respectively. The optimal result from the orthogonal test, which is the SENC ratio, will be shown in Section 3.3.1.

2.3. Preparation Process

The flowchart of the preparation of AABS and SENC is shown in Figure 1. The raw materials were weighed and the solid materials (FS, MCA, and QL) were mixed well, then NaOH was dissolved in SS and allowed to stand until it reached room temperature. The powder mixture was poured into a mortar mixer and mixed with water for 1 min, followed by the addition of a liquid alkali activator and mixed for another 1 min. The mixture was poured into cubic moulds of 40 mm × 40 mm × 40 mm and the specimens were demoulded after 24 h, and then the AABS specimens were cured in the standard curing room. The process of SENC preparation was basically the same as that of AABS. For shaping SENC, it was necessary to add additional water to 20% of the sum of the mass of FS and MCA. The mixture was extruded into blocks, cut into strips, and then shaped into ceramsites by the HK-93A granulator. The working speed of the granulator was 50 r/min, and the shaping time was 20 min. After natural curing for 24 h, the ceramsites were cured in the standard curing room.

2.4. Test Methods of AABS

2.4.1. Compressive Strength Test

According to the Chinese national standard GB/T 17671-2021 [22], the YAW-2000 electro-hydraulic servo pressure universal testing machine from Sunstest Co., Ltd. (Shanghai, China) was used to conduct the compressive strength test. In the compressive strength test, the samples were tested at a constant pressurization rate of 2.4 KN/s.

2.4.2. Nuclear Magnetic Resonance (NMR) Test

The specimens were placed in the water-saturated device with a vacuum of −0.1 MPa for 24 h. After that, the specimens were wrapped with polyethylene film and placed in the NMR spectrometer to determine the characteristic parameters of the pore properties. This test was conducted using the MesoMR23-60 NMR spectrometer from Niumag Co., Ltd. (Suzhou, China). Porosity and pore size distribution are the two components of the pore performance test.

2.5. Test Methods of SENC

2.5.1. Physical Properties Test

According to the Chinese national standard GB/T 17431.2-2010 [23], the physical properties of SENC were evaluated from four parts as follows: bulk density ρ b u , apparent density ρ a p , particle size coefficient K e   , and water absorption w. The bulk density and the apparent density were determined by the natural accretion method and the drainage method, respectively. The bulk density ρ b u and apparent density ρ a p were calculated according to Equation (1) and Equation (2), respectively:
ρ b u = m t m v × 1000 V ,
ρ a p = m × 1000 V t 500 ,
where ρ b u is the bulk density of SENC (kg/m3); m t is the total mass of SENC and the volumetric cylinder (kg); m v is the mass of the volumetric cylinder (kg); V is the volume of the volumetric cylinder (L); ρ a p is the apparent density of SENC (kg/m3); m is the mass of dried SENC (g); V t is the total volume of SENC and water (mL); 1000 is the volume of the volumetric cylinder used in the apparent density determination of SENC (mL); and 500 is the volume of water added in the apparent density determination of SENC (mL).
The particle size coefficient K e   characterizes the geometrical properties of the appearance of SENC. Fifty SENCs were randomly selected and measured by a Vernier caliper for longitudinal maximum dimension and the minimum dimension at the middle section, and the mean value was calculated by Equation (3):
K e   = D m a x D m i n ,
where K e   is the particle size coefficient of SENC; D m a x is the longitudinal maximum dimension of SENC (mm); and D m i n is the minimum dimension of SENC at the middle section (mm).
The water absorption w of SENC was calculated by Equation (4):
w = ( m 0 m 1 ) / m 1 100 ,
where w is the water absorption of SENC (%); m 0 is the mass of saturated surface-dried SENC (g); and m 1 is the mass of dried SENC (g).

2.5.2. Mechanical Properties Test

According to the Chinese national standard GB/T 17431.2-2010 [23], the numerical tube pressure f a and the softening coefficient ψ were used to analyze the mechanical properties of SENC. The numerical tube pressure characterized the strength of SENC. The pressurized cylinder filled with SENC was tested by the YAW-2000 electro-hydraulic servo pressure universal testing machine at a uniform speed of 400 N/s, and the pressure value was noted when the press die was pressed into a depth of 20 mm. The numerical tube pressure f a was calculated according to Equation (5). The softening coefficient ψ meant the change in strength of the SENC before and after water absorption and was calculated according to Equation (6).
f a = p 1 + p 2 F ,
ψ = f 1 / f 0 ,
where f a is the numerical tube pressure of SENC (MPa); p 1 is the pressure value when pressed into 20 mm (N); p 2 is the mass of the press die (N); F is the area of the pressure-bearing region (taken as 10,000 mm2); ψ is the softening coefficient of SENC; f 0 is the numerical tube pressure of dried SENC (MPa); and f 1 is the numerical tube pressure of saturated surface-dried SENC after immersion in water for 1 h (MPa).

2.5.3. X-ray Diffraction (XRD) Test

The central parts of 28 d SENC were dried in the electric oven at 60 °C for 12 h, ground to powder in an agate mortar, and sieved to 0.075 mm. The scanning angle was set from 5° to 70° in 2θ, the scanning speed was 0.6 s/step, and the scanning step size was 0.02°/step. An X-ray diffractometer of the D8 series from Bruker-AXS Co., Ltd. (Bremen, Germany) was used to detect the phase composition of SENC.

2.5.4. Scanning Electron Microscopy (SEM) Test

The central parts of 28 d SENC were dried in the electric oven at 60 °C for 12 h, and the sections to be measured were sprayed with gold to increase the electrical conductivity by the high-resolution turbomolecular-pumped sputter coater. The micro-morphological images of the SENC were obtained under the accelerating voltage of 5–20 kV. The scanning electron microscope was an instrument of the QUANTA-650 series from FEI Co., Ltd. (Hillsboro, OR, USA), which was also equipped with an energy dispersive spectrometer (EDS).

3. Results and Discussion

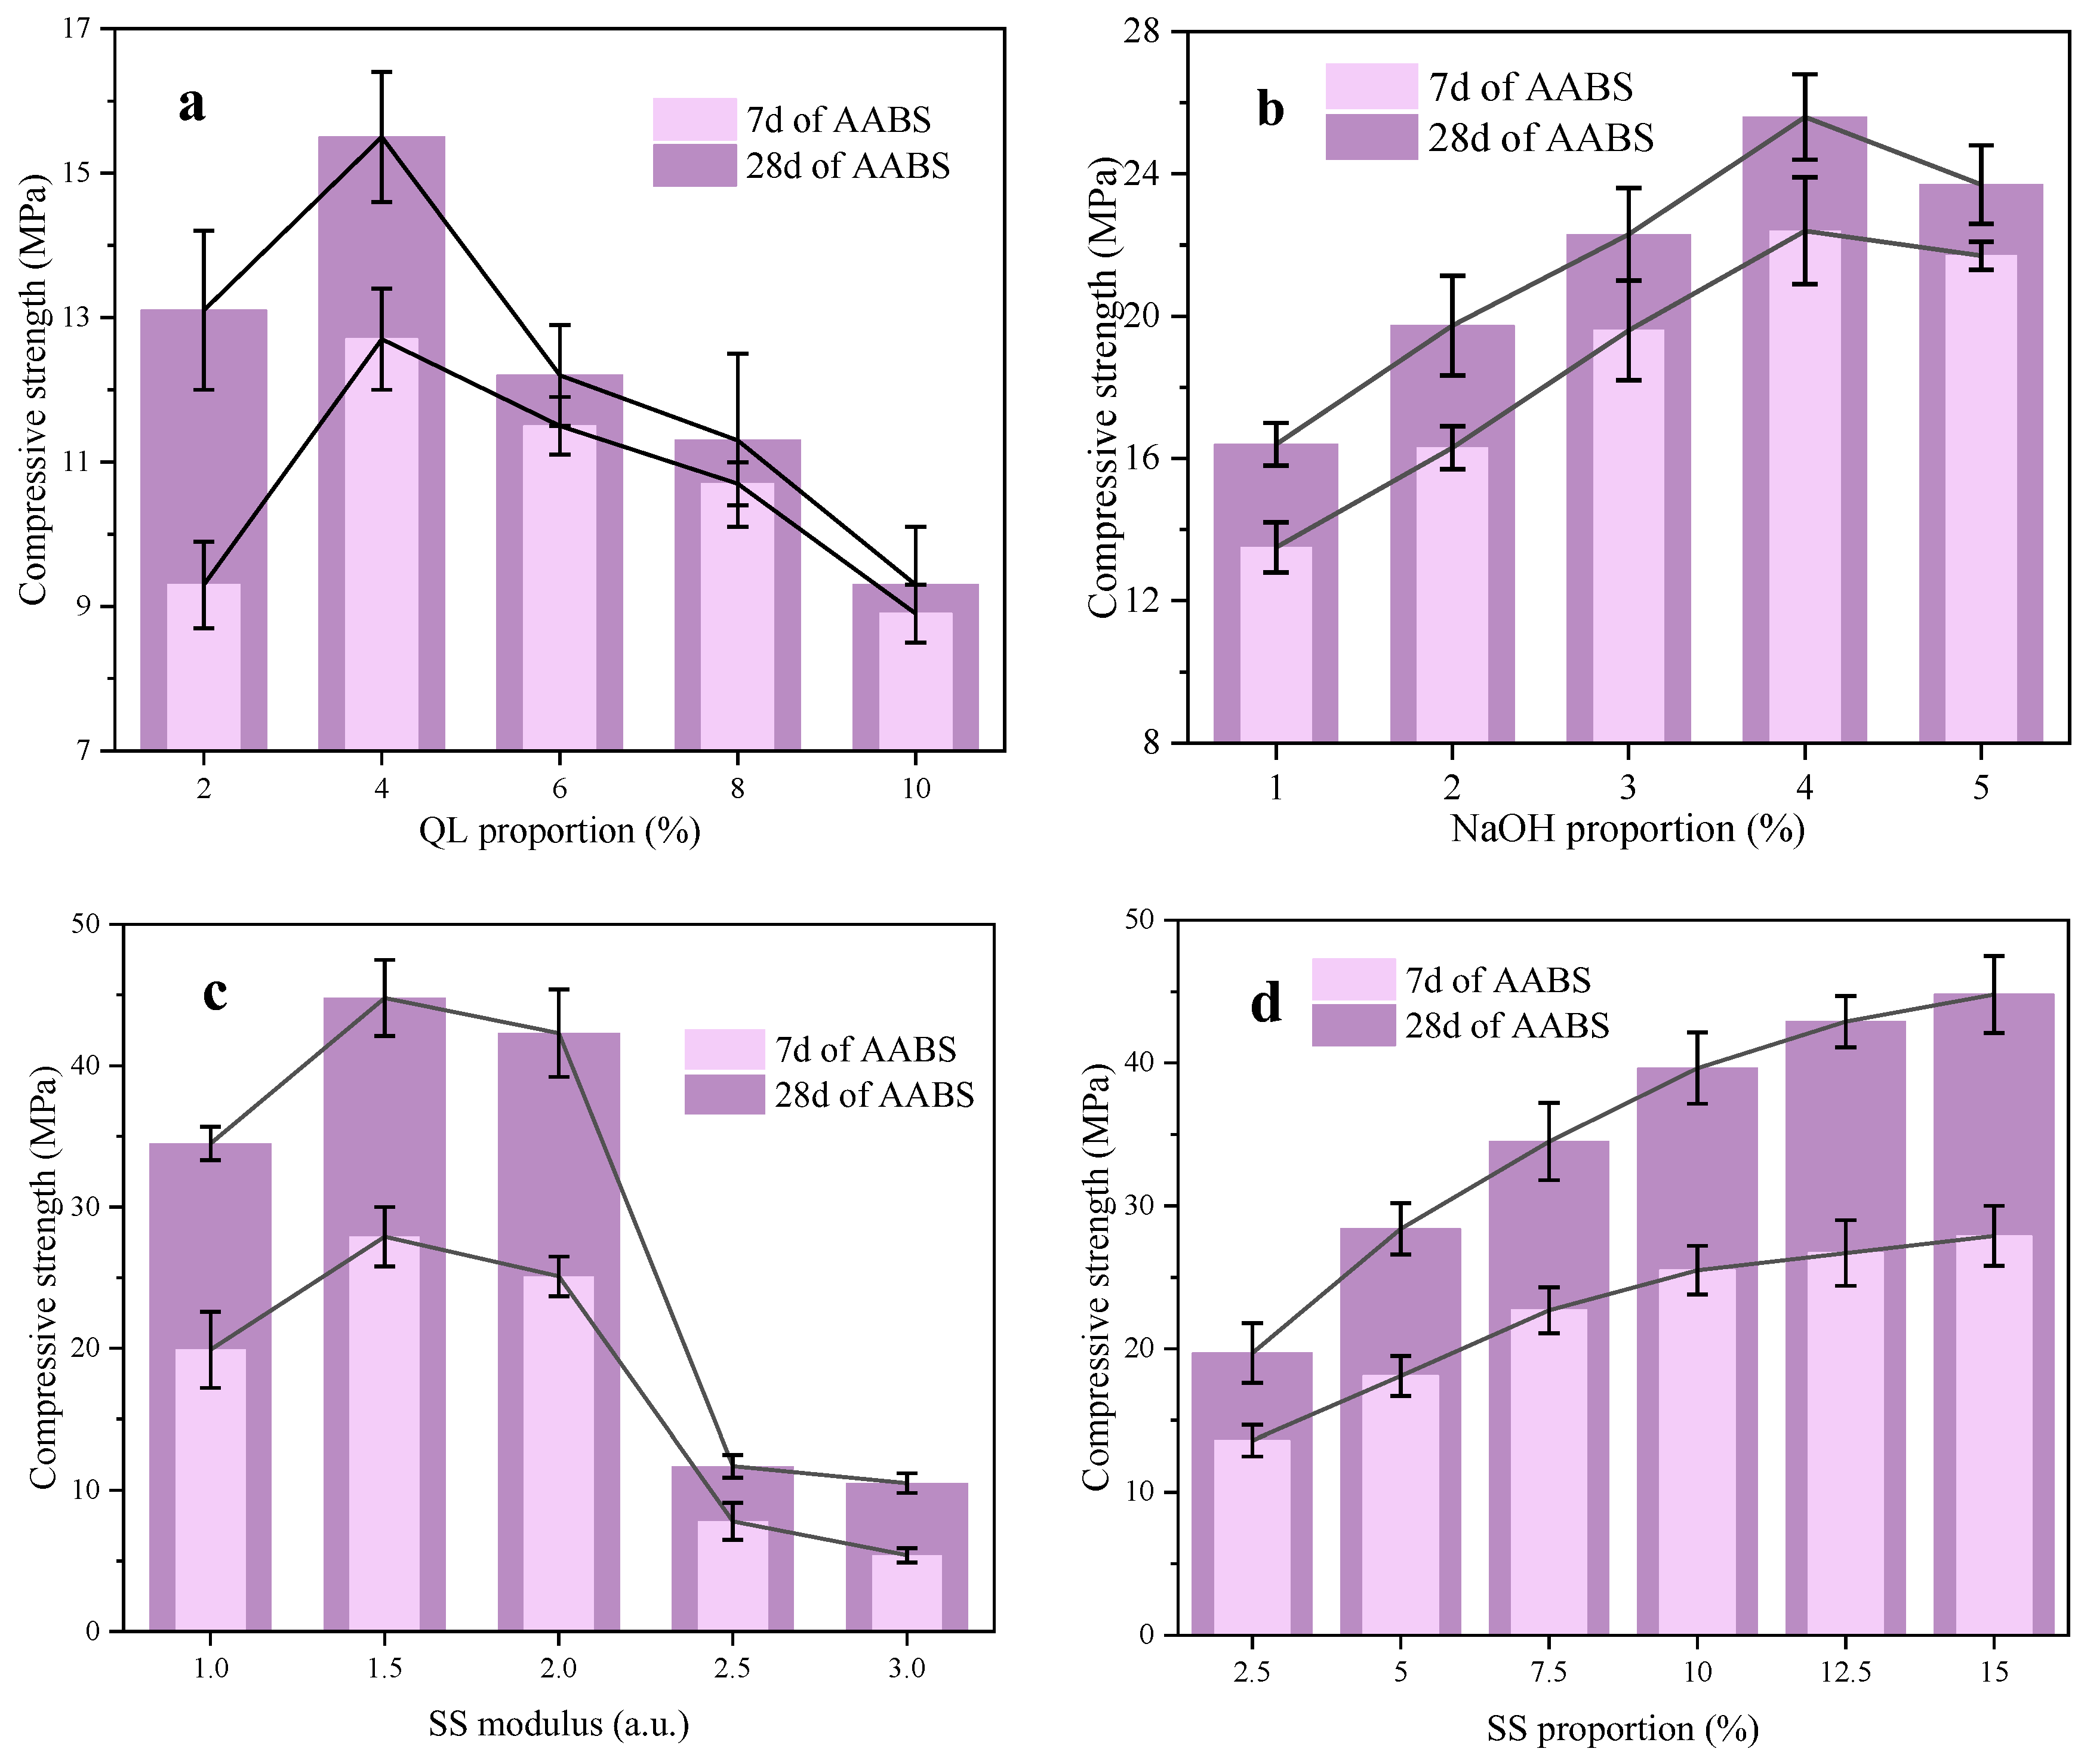
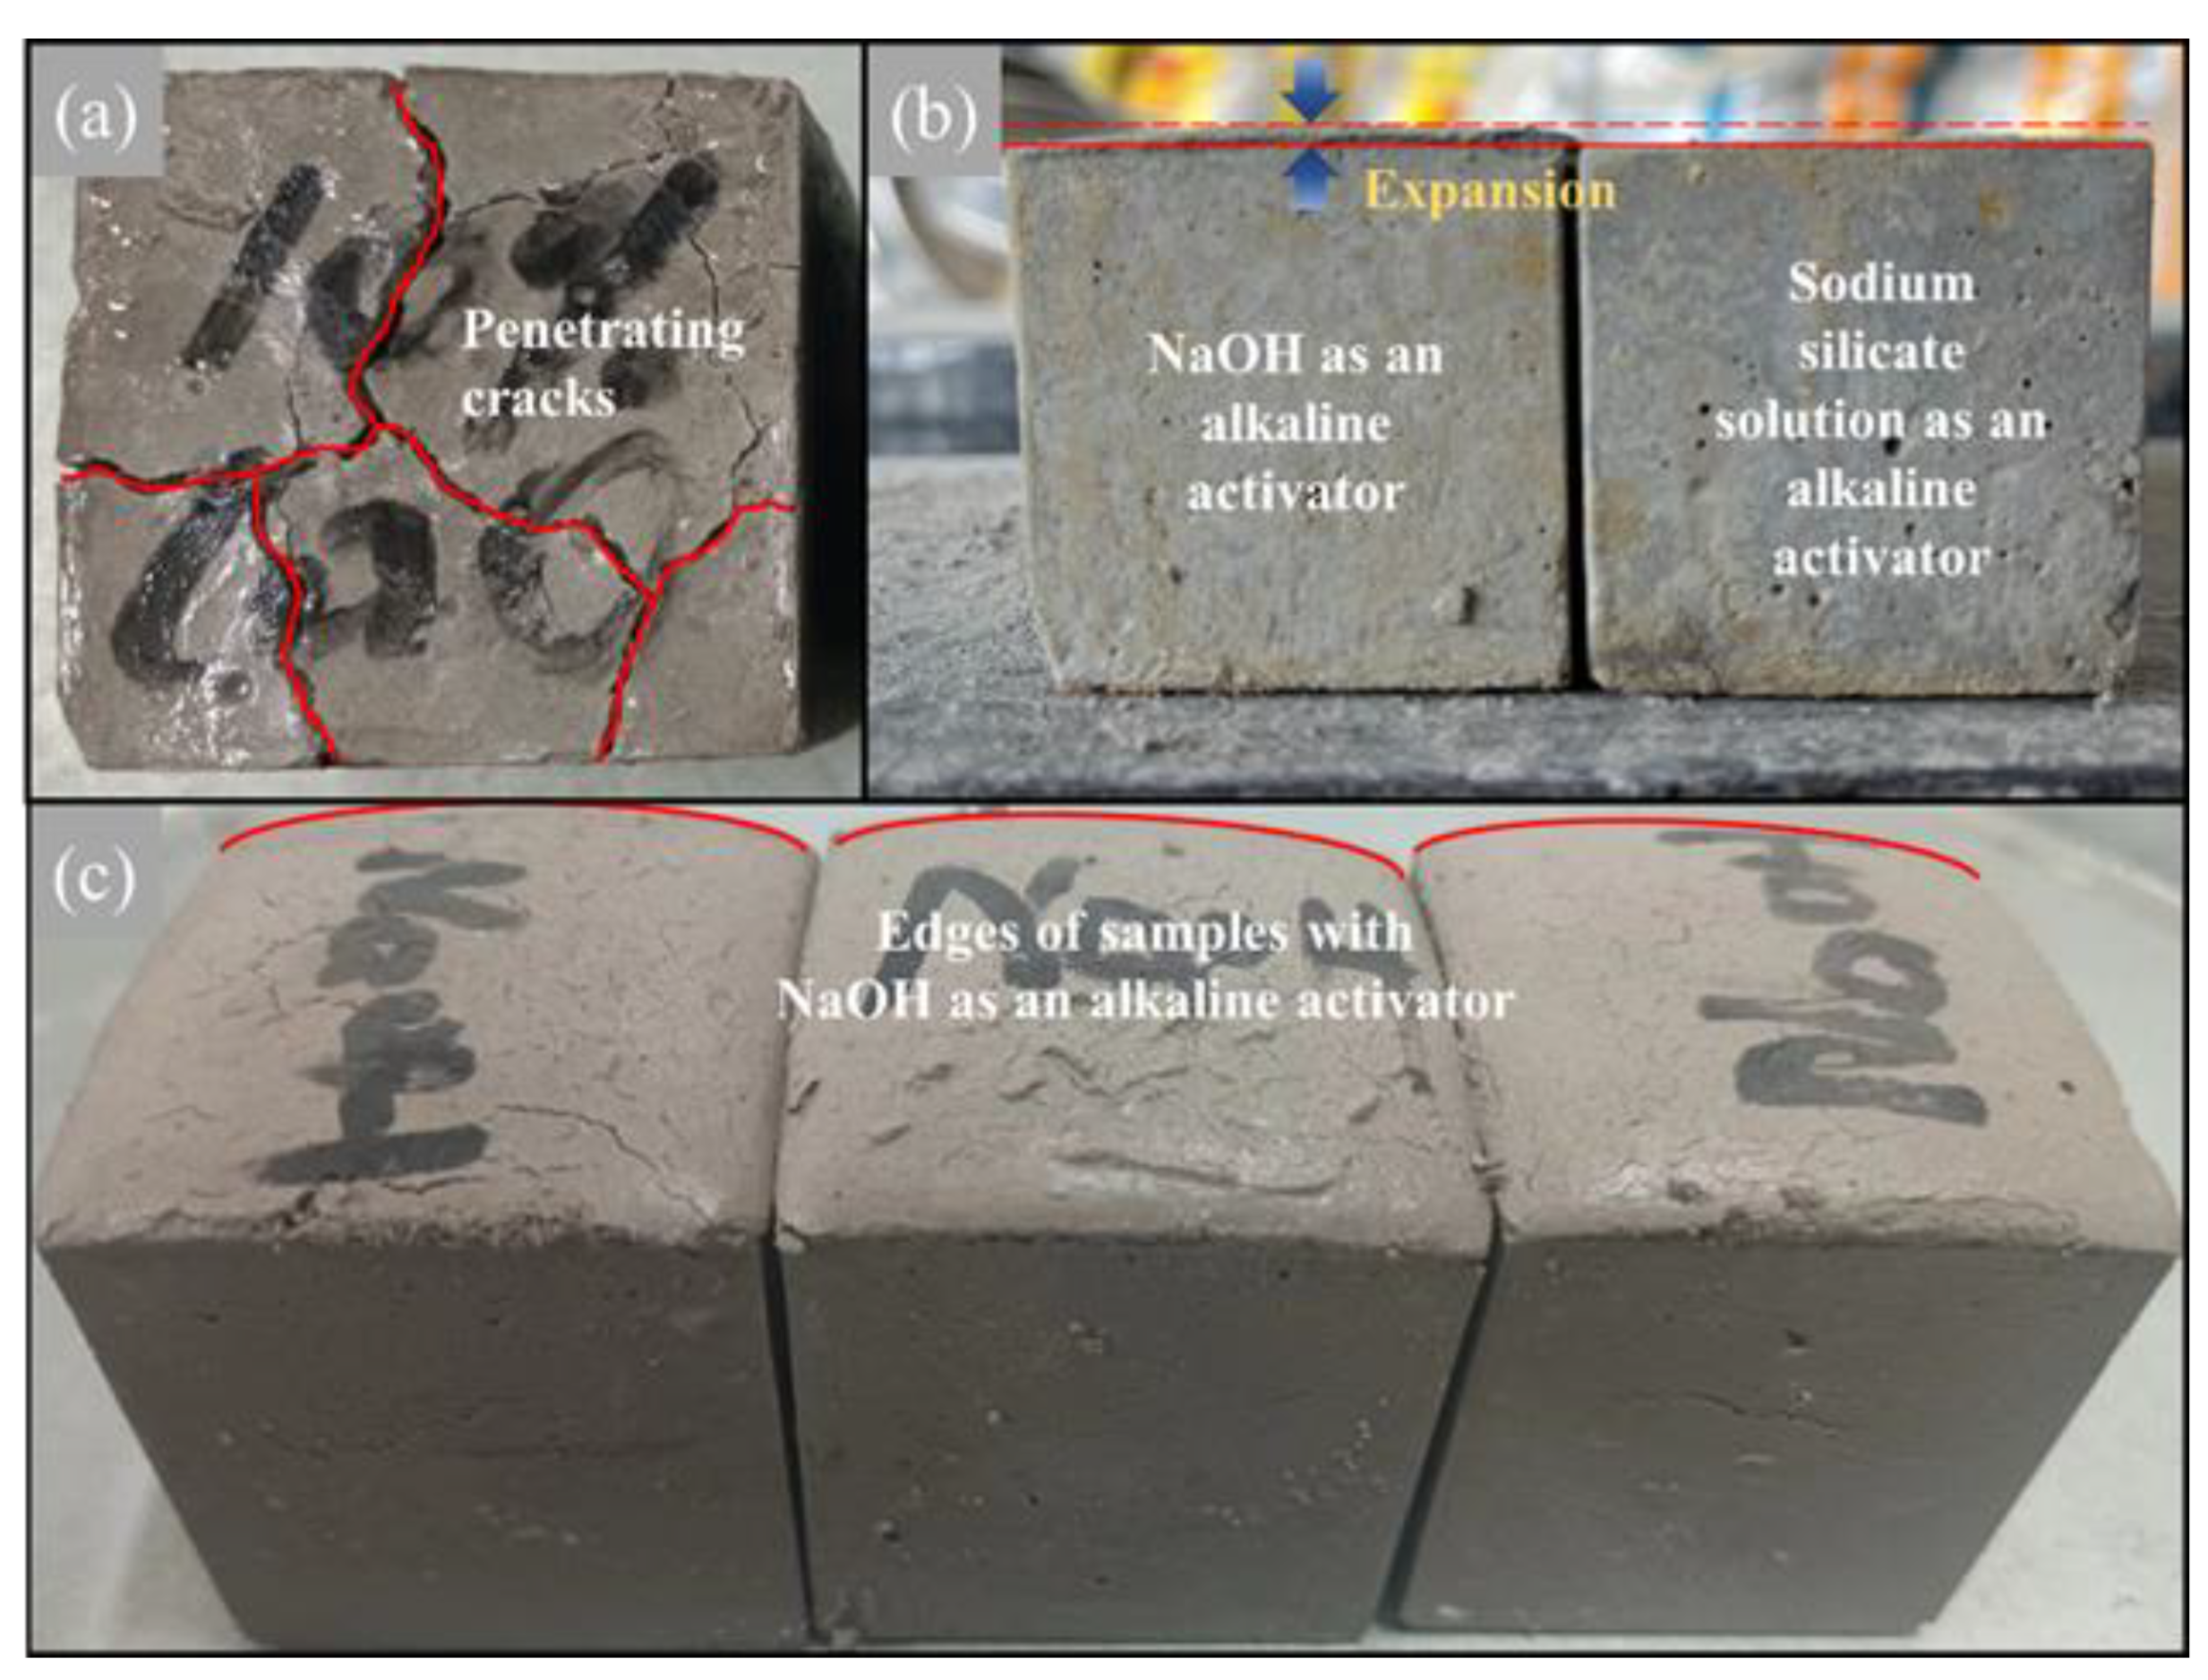
3.1. Single Factor Effects of Alkali Activators

Figure 2a intuitively visualizes that as QL addition increases, the compressive strength of AABS at 7 d and 28 d first increased and then decreased. The pozzolanic activity of MCA was weak, but there were fewer effective oxides in QL with low additions, which could not effectively accelerate the pozzolanic activity [24,25]. The compressive strength of AABS was the highest when the QL addition was 4%, and the compressive strength at 7 d and 28 d were 12.7 MPa and 15.5 MPa, respectively. Nevertheless, when the QL addition was 10%, penetrating cracks on the surface of the specimens were discovered, which directly reduced the compressive strength (as shown in Figure 3a). Moreover, it was not difficult to find that the compressive strengths in the QL group were all much lower than other test groups. There were two reasons for these obvious cracks and low compressive strength. On the one hand, the initial reaction between QL and water released a large amount of hydration heat, which was detrimental to the structural development of the specimens [26]. On the other hand, similar to the study of Yuan et al. [27], the mixture compatibility deteriorated and the setting time was considerably shortened when the QL addition was larger than 8%. However, larger volume hydration products (such as C-A-S-H, calcium hemicarboaluminate and so on) were still being generated, which led to cracks of the AABS.
In Figure 2b, when NaOH addition was increased from 1% to 5%, the 28 d compressive strength of the specimen with 4% NaOH addition was the highest (25.6 MPa). Under the influence of NaOH, colloidal substances were produced around the FS and MCA, and gradually polymerized to form a denser structure [28], which increased the compressive strength. However, the AABS with a 5% NaOH addition were significantly expanded after curing, the appearance of which is shown in Figure 3b,c. The reason might be that the high content of MgO in the MCA and FS reacted with NaOH and caused the expansion in the mixture that had not yet solidified. However, this expansion phenomenon was detrimental to the AABS and had a negative impact on the compressive strength.
When SS is used as an alkali activator, there were two variables, the SS modulus and the SS addition. Figure 2c shows that when the SS modulus was 1.5, the 28 d compressive strength of the specimen was 44.8 MPa, which was the highest value in this group. When the SS modulus exceeded 1.5, the compressive strength gradually decreased. It indicated that a too high SS modulus would have a negative effect on the compressive strength, which was consistent with the findings of Che et al. [29] and Li et al. [30]. The SS modulus was the mass ratio of SiO2 to Na2O in SS. When the SS modulus was low, the alkali activator contained more Na2O, and the viscosity of the alkali activator was lower. The mixture with a low SS modulus had better fluidity [31], which was advantageous to activate the activity of the MCA and FS and to improve the compressive strength of AABS.
Figure 2d shows the compressive strength of the AABS with an SS addition in the range of 2.5% to 15% under the condition of an SS modulus of 1.5. The positive correlation between compressive strength and the SS addition is consistent with the conclusion of Zidan et al. [32]. When the SS additions were 2.5% and 15%, the 7 d compressive strength of the specimens were 13.6 MPa and 27.9 MPa, respectively; and the 28 d compressive strength were 19.7 MPa and 44.8 MPa, respectively. It was evident that not only was the early age (7 d) compressive strength low, but also that the growth of the strength was slow when the SS additions were low. This was due to the fact that the low concentration of SS did not provide sufficient strength [33,34] and there was no further development of the reaction products after consuming most of the silicate in the alkali activator.
All of the alkali activators shortened the setting time of the mixture, but precisely as stated earlier the use of an appropriate addition of QL provided a beneficial effect on early age compressive strength without unduly affecting the setting time. To obtain better compressive strength, the QL addition, NaOH addition, and SS modulus should be around 3%, 2%, and 1.5 respectively, and the SS addition was recommended to be above 5%.

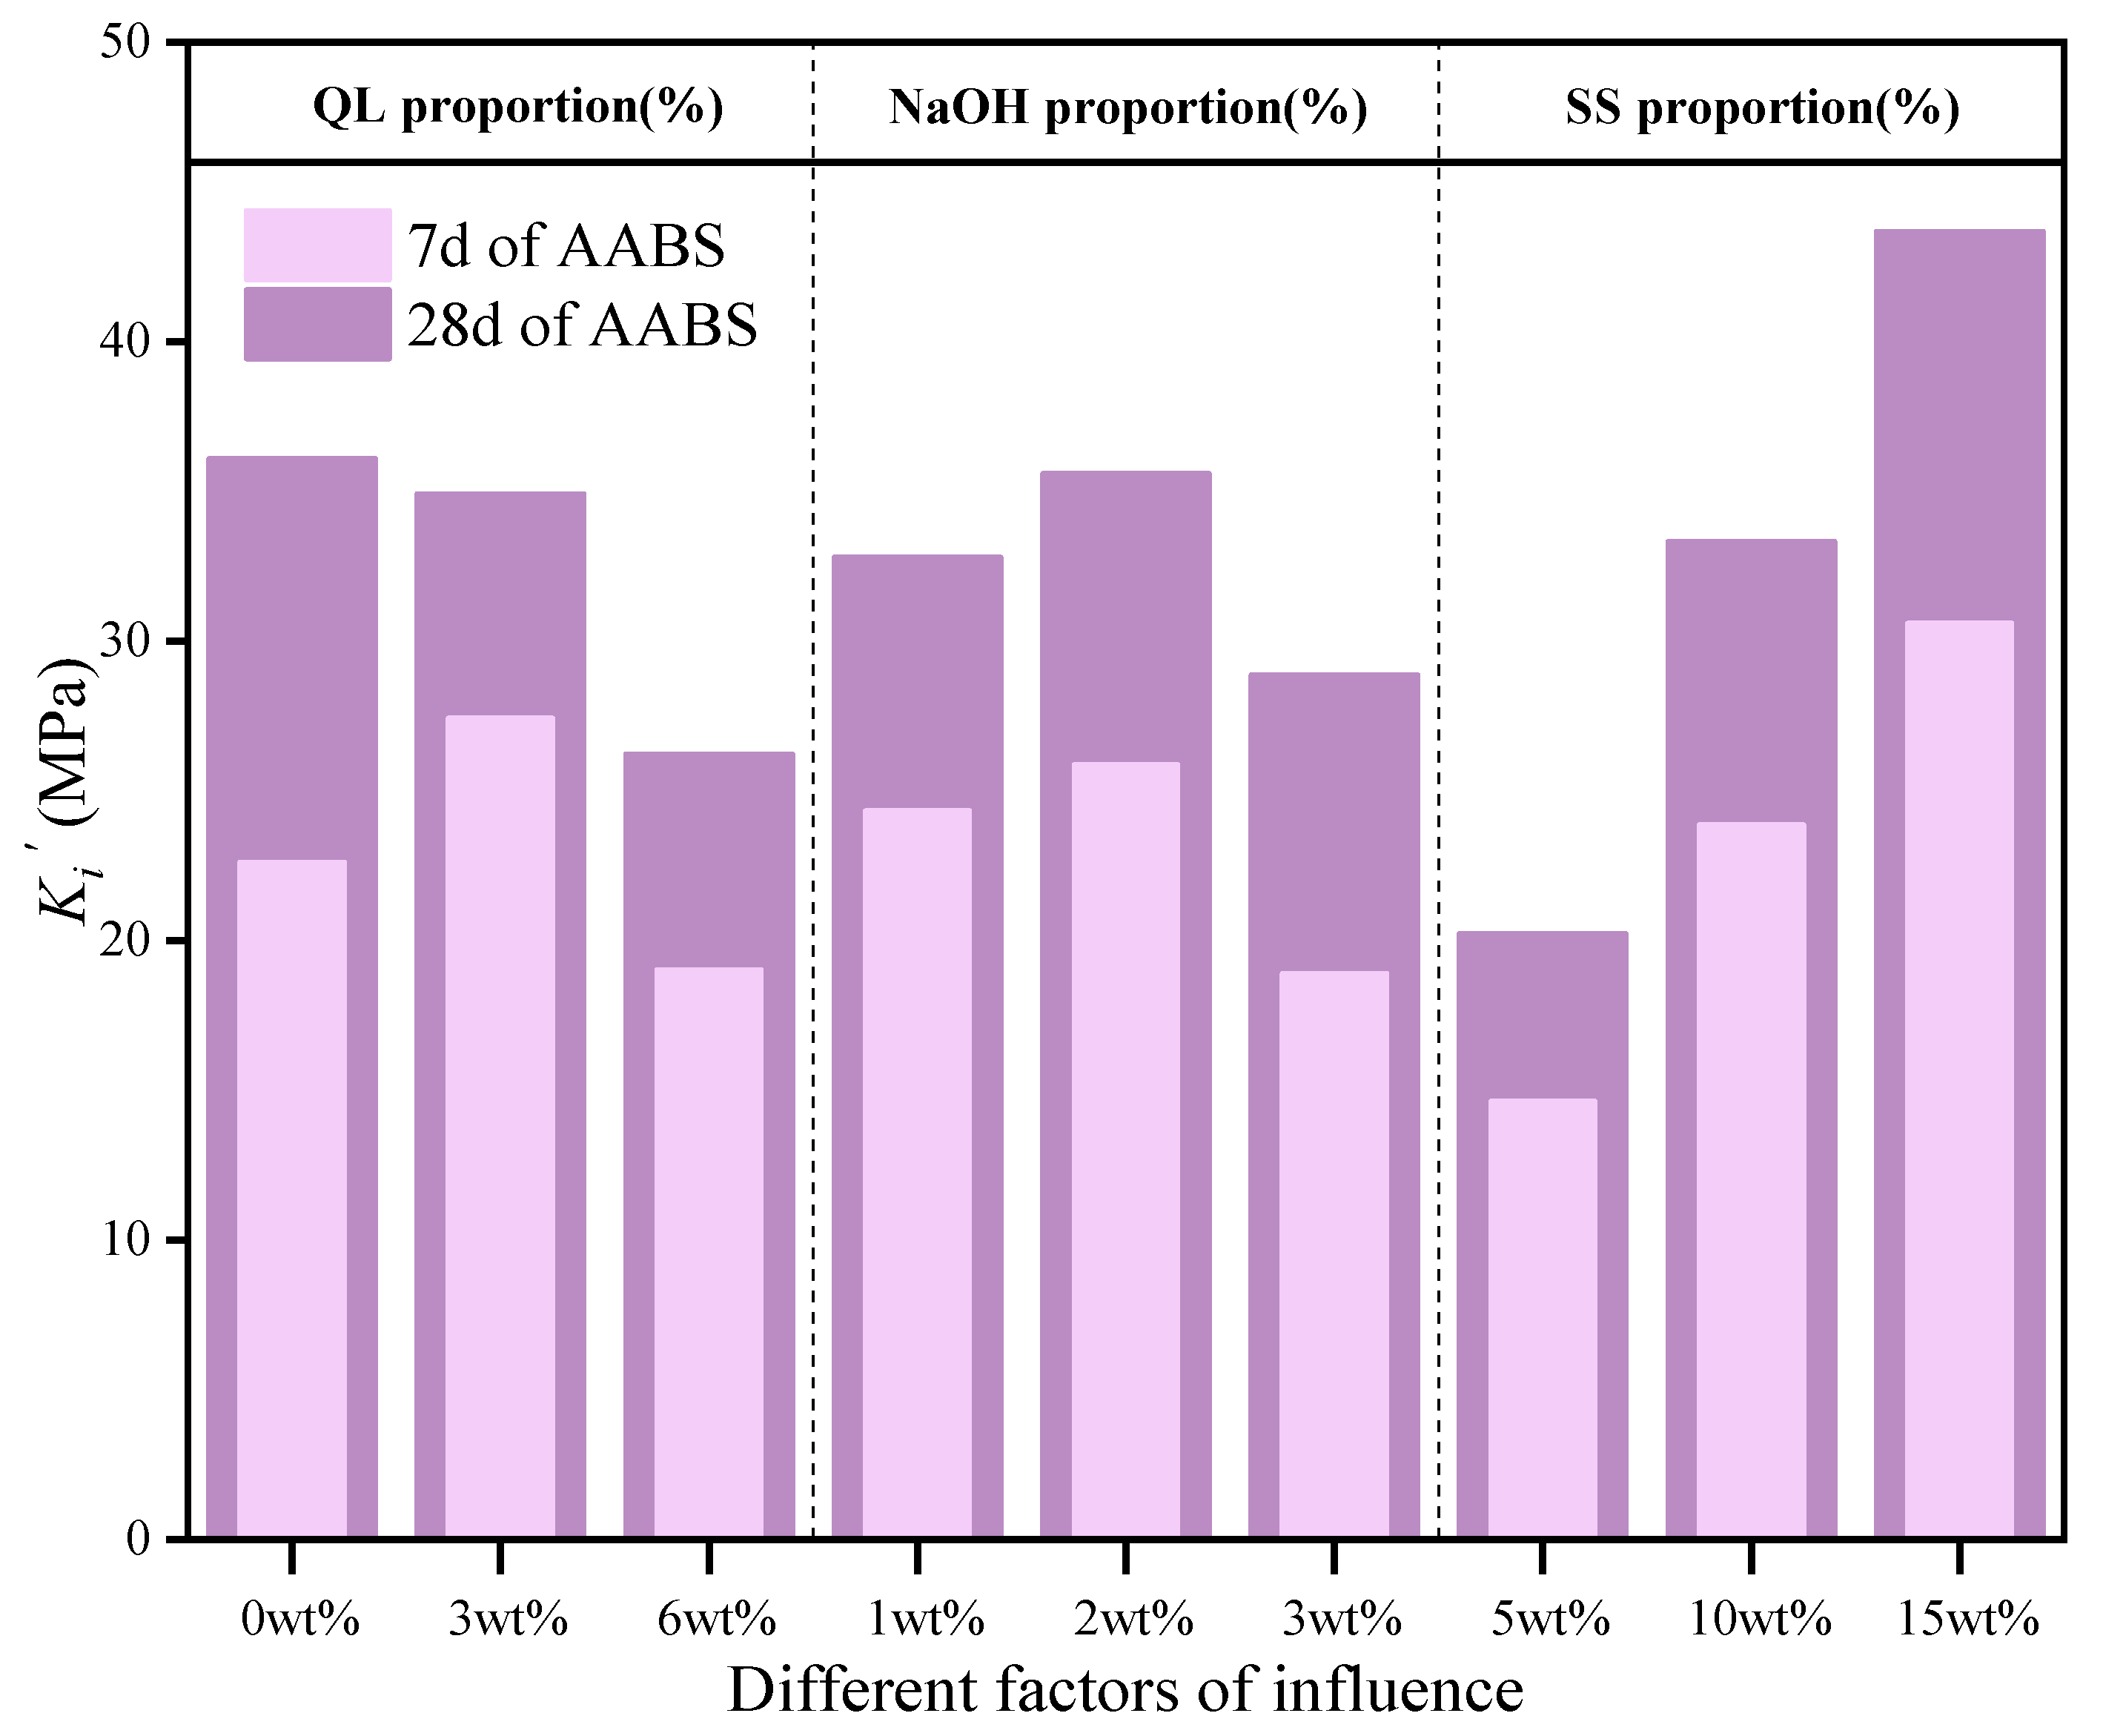
3.2. Multifactorial Effects of Alkali Activators

3.2.1. Mechanical Properties Analysis

As seen in Figure 4, both SS addition and QL addition were positively correlated with compressive strength when the QL addition was stationary and the SS addition was increasing. When the controlling NaOH addition was constant, while the SS addition was increasing, the overall trend of strength was increased. When the NaOH addition was invariant and the QL addition was increased, the strength showed an overall trend of increasing and then decreasing. However, when the NaOH addition was 3, the strength showed a trend of decreasing and then increasing. The compressive strength of specimens at 7 d was 56.6~79.7% of the 28 d compressive strength. The 7 d strength was 76.74~79.75% of the 28 d strength when the QL addition was 3%. When QL was not added and the addition of NaOH and SS were gradually increased, the 28 d compressive strength was increased, but the 7 d compressive strength decreased from 69.51% to 56.59% of the 28 d compressive strength. This again indicated the result that a certain amount of QL was beneficial to the formation of the early age compressive strength of AABS, while NaOH addition and SS addition had an indispensable role in enhancing the long-age compressive strength. For AABS, the use of QL, NaOH, and SS together created complementary advantages.
Combining Figure 2 and Figure 3, it was observed that Ca(OH)2 generated by the reaction of QL with water was the main source of the early age compressive strength of AABS, and NaOH enhanced this effect. Figure 5 showed that NaOH and SS additions were directly related to the formation of 28 d compressive strength and compensated for QL constraining the compressive strength development of AABS. This is due to the fact that in alkali-activated materials, NaOH accelerates the reaction process of SS with MCA and slag to produce more hydration products. The K i   value was used to characterize the mean value of the test results corresponding to the i level of certain factor. The larger the difference in the K i   value within the same group, the more sensitive the compressive strength of the specimen was to that factor. The K i   values were calculated using the compressive strength as shown by the test results in this section, and the results are shown in Figure 5. The highest values at different ages in Figure 5 were the optimal results. Selected results at 7 d and 28 d were A (3 wt%) B (2 wt%) C (15 wt%) and A (0 wt%) B (2 wt%) C (15 wt%), respectively. Among them, the difference between the K i   values of A (0 wt%) and A (3 wt%) at 28 d is very small, only 1.1 MPa, a difference of no more than 2.4%. Considering that QL was effectively beneficial for enhancing the early age compressive strength of AABS, A (3 wt%) B (2 wt%) C (15 wt%) was selected as the optimal result for the requirement of compressive strength.

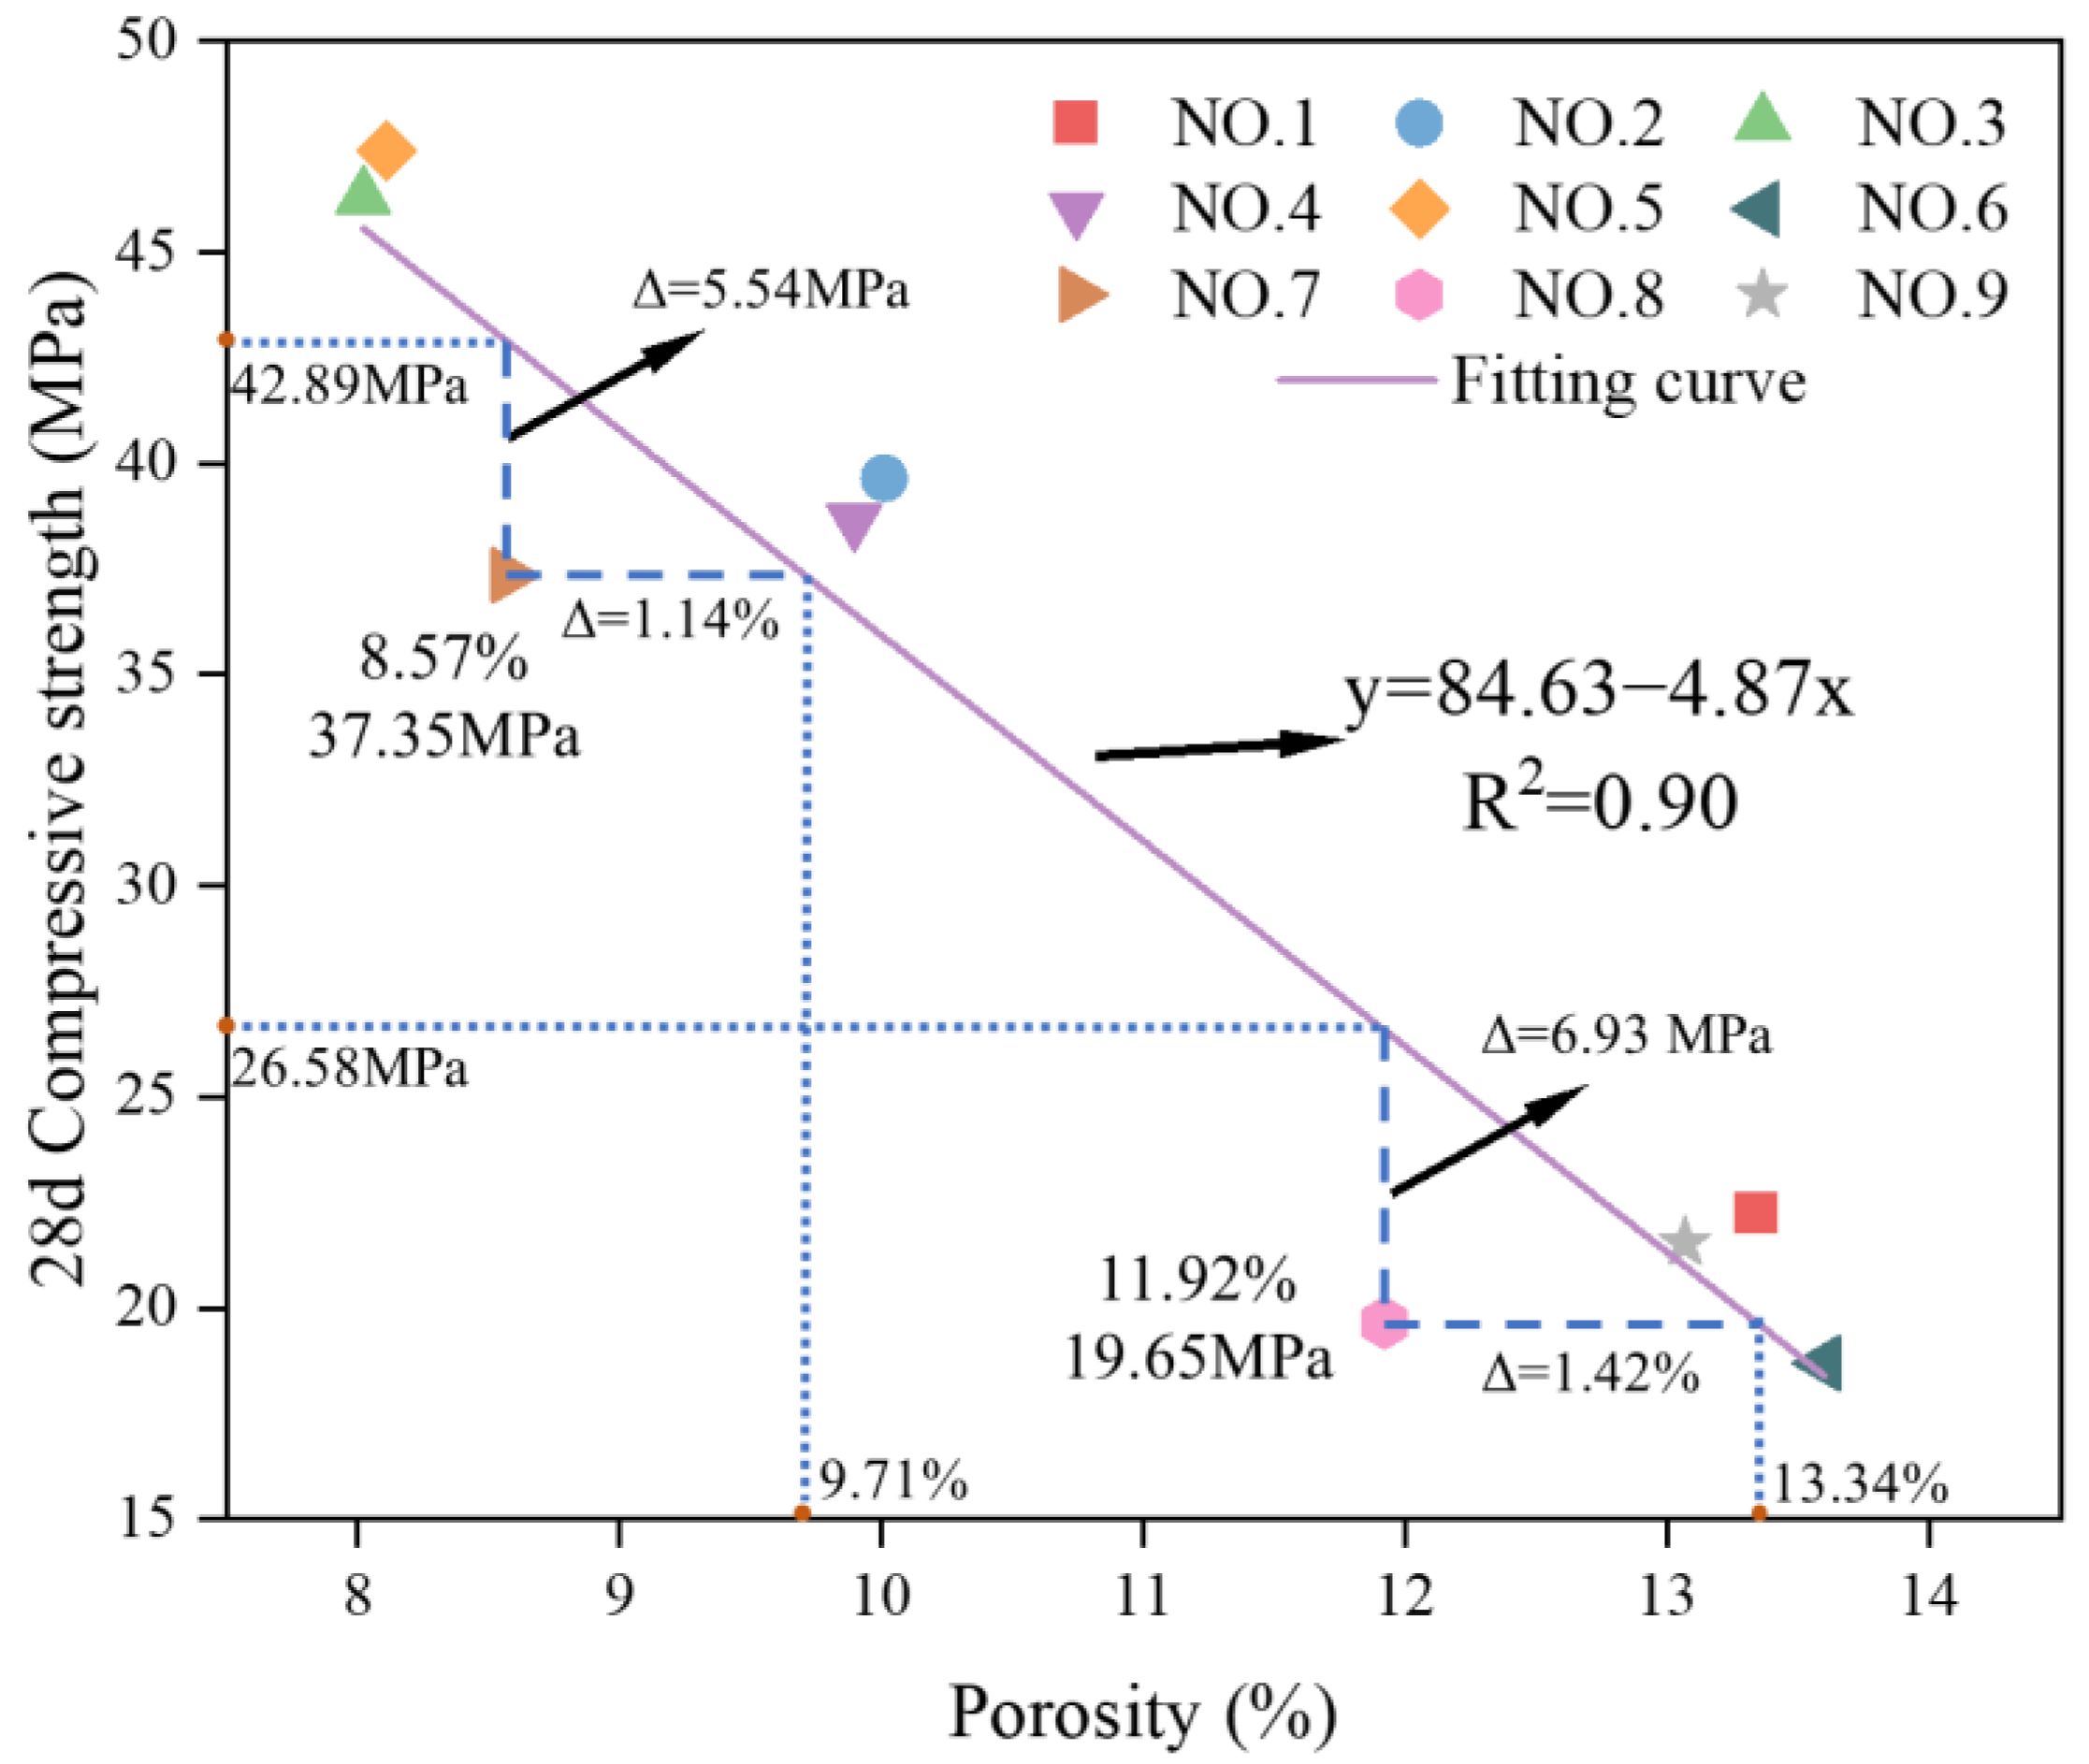
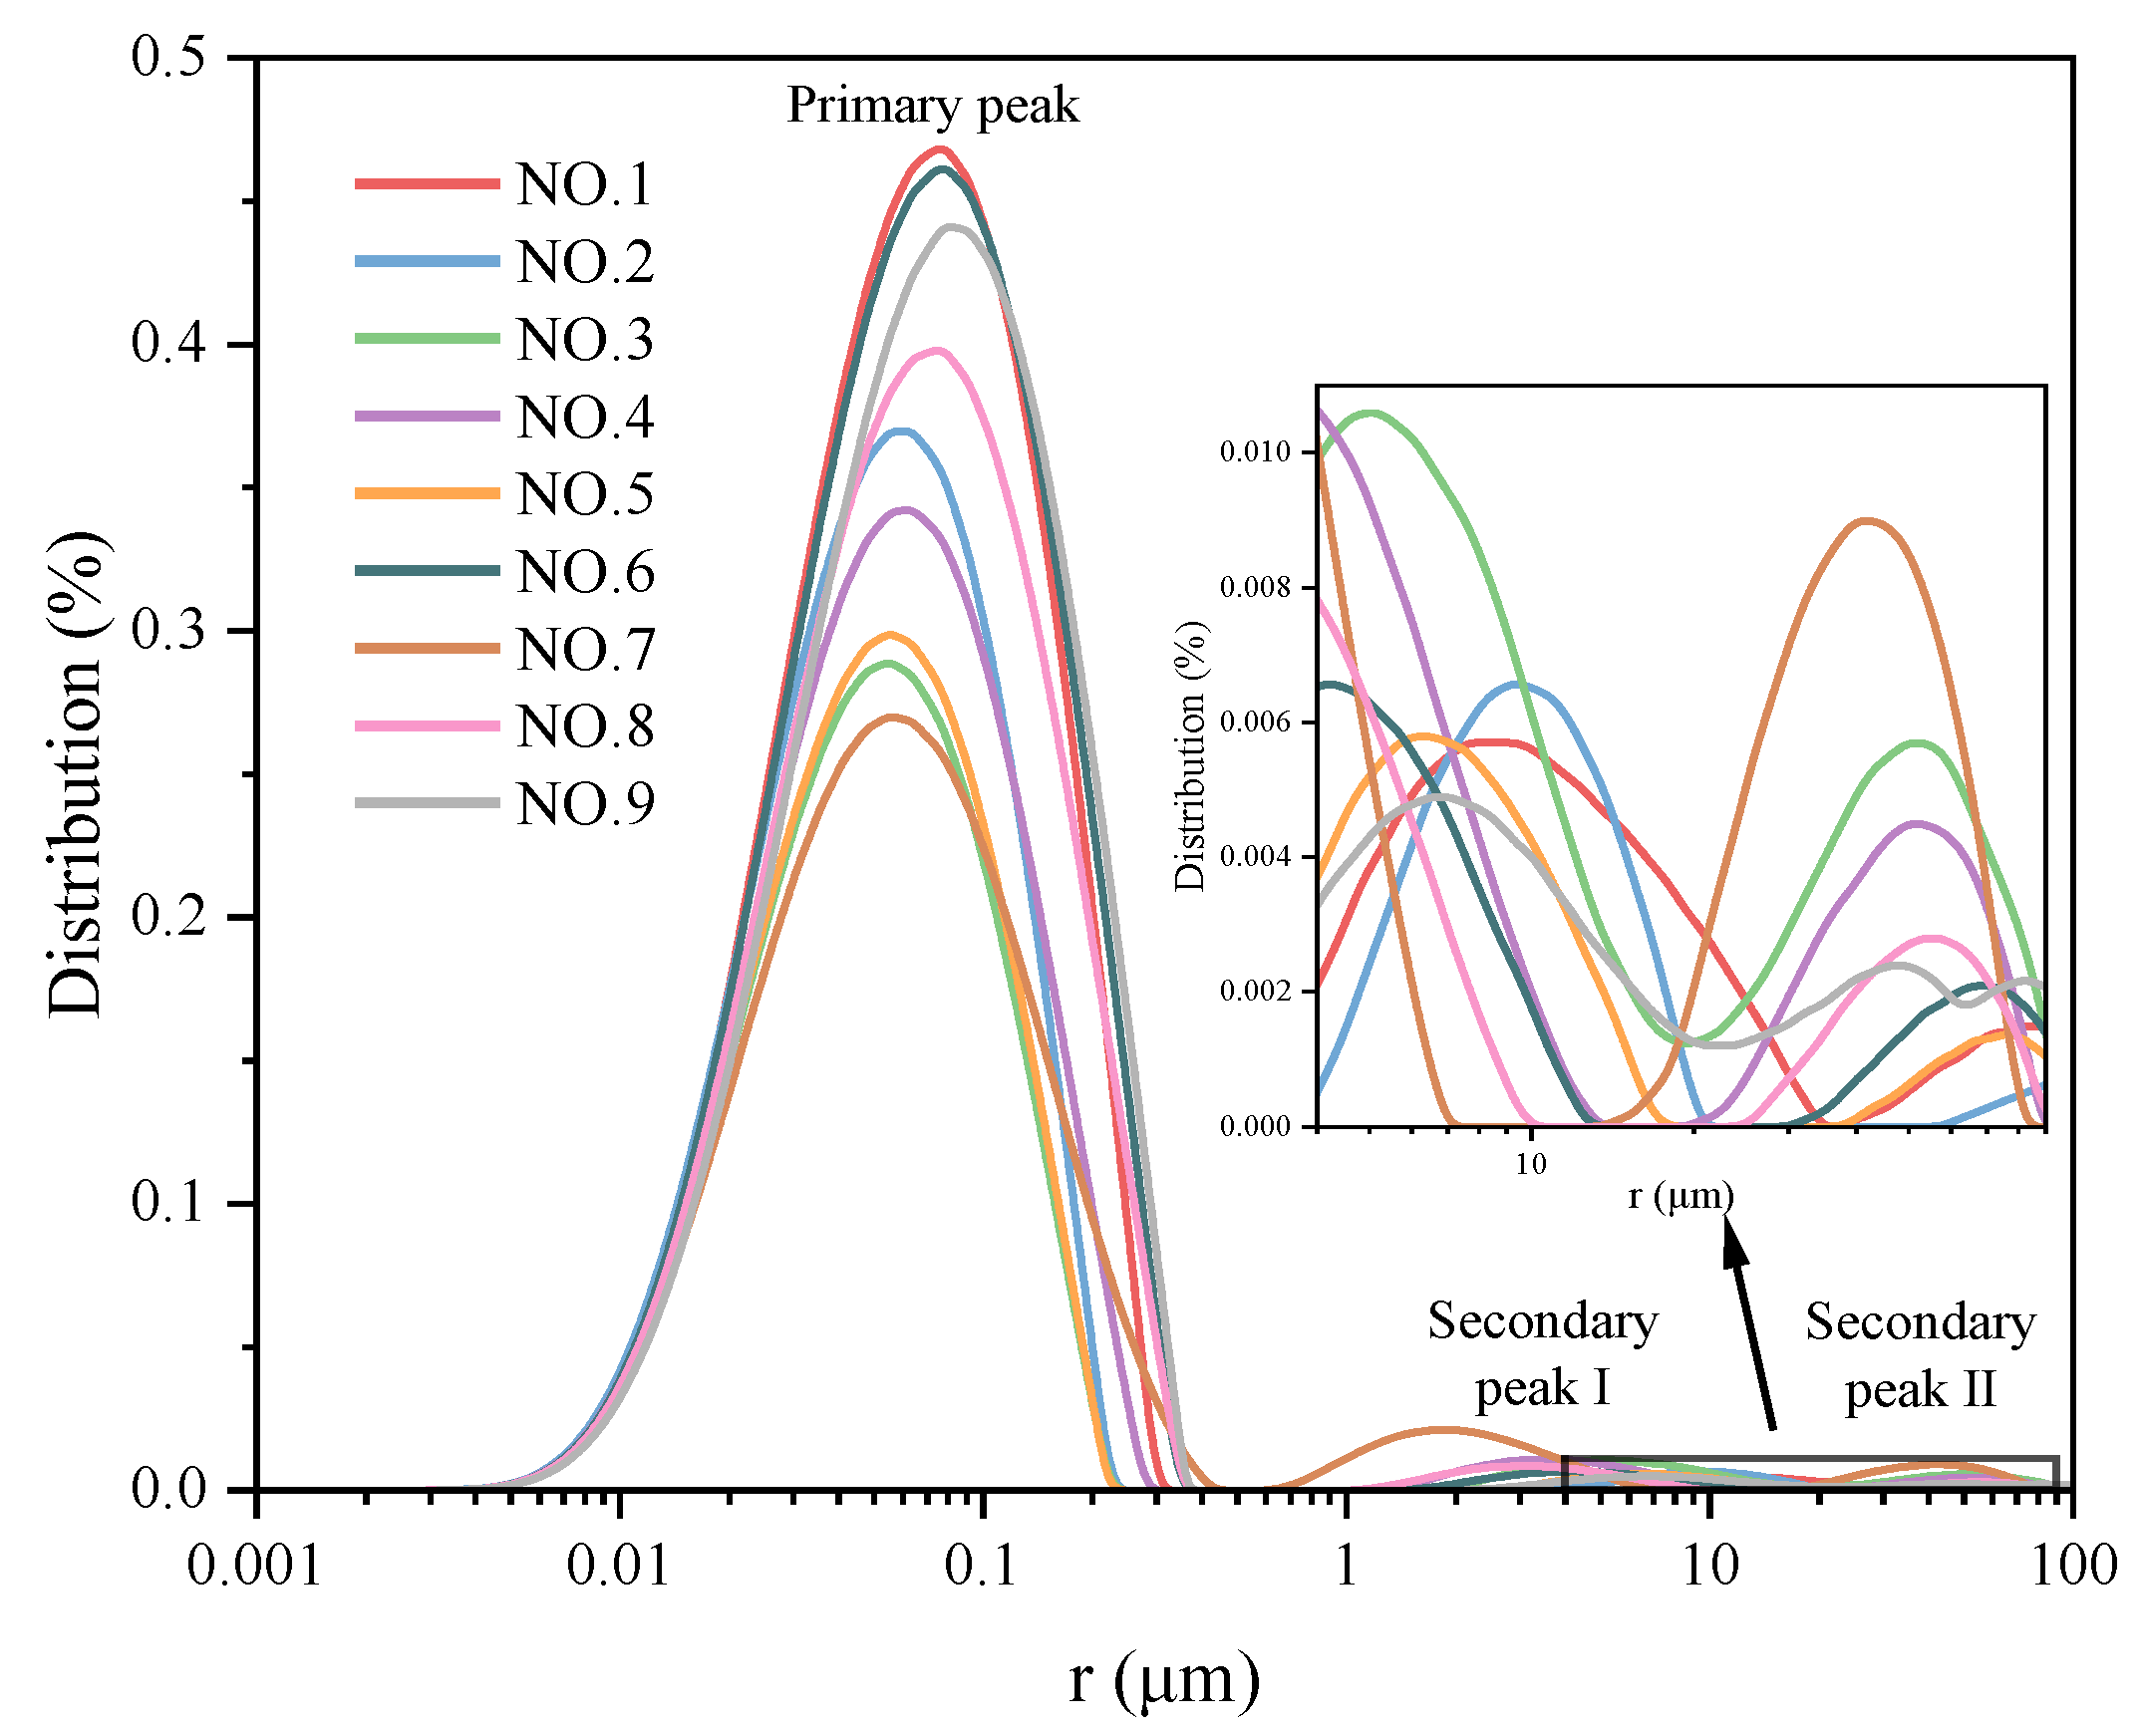
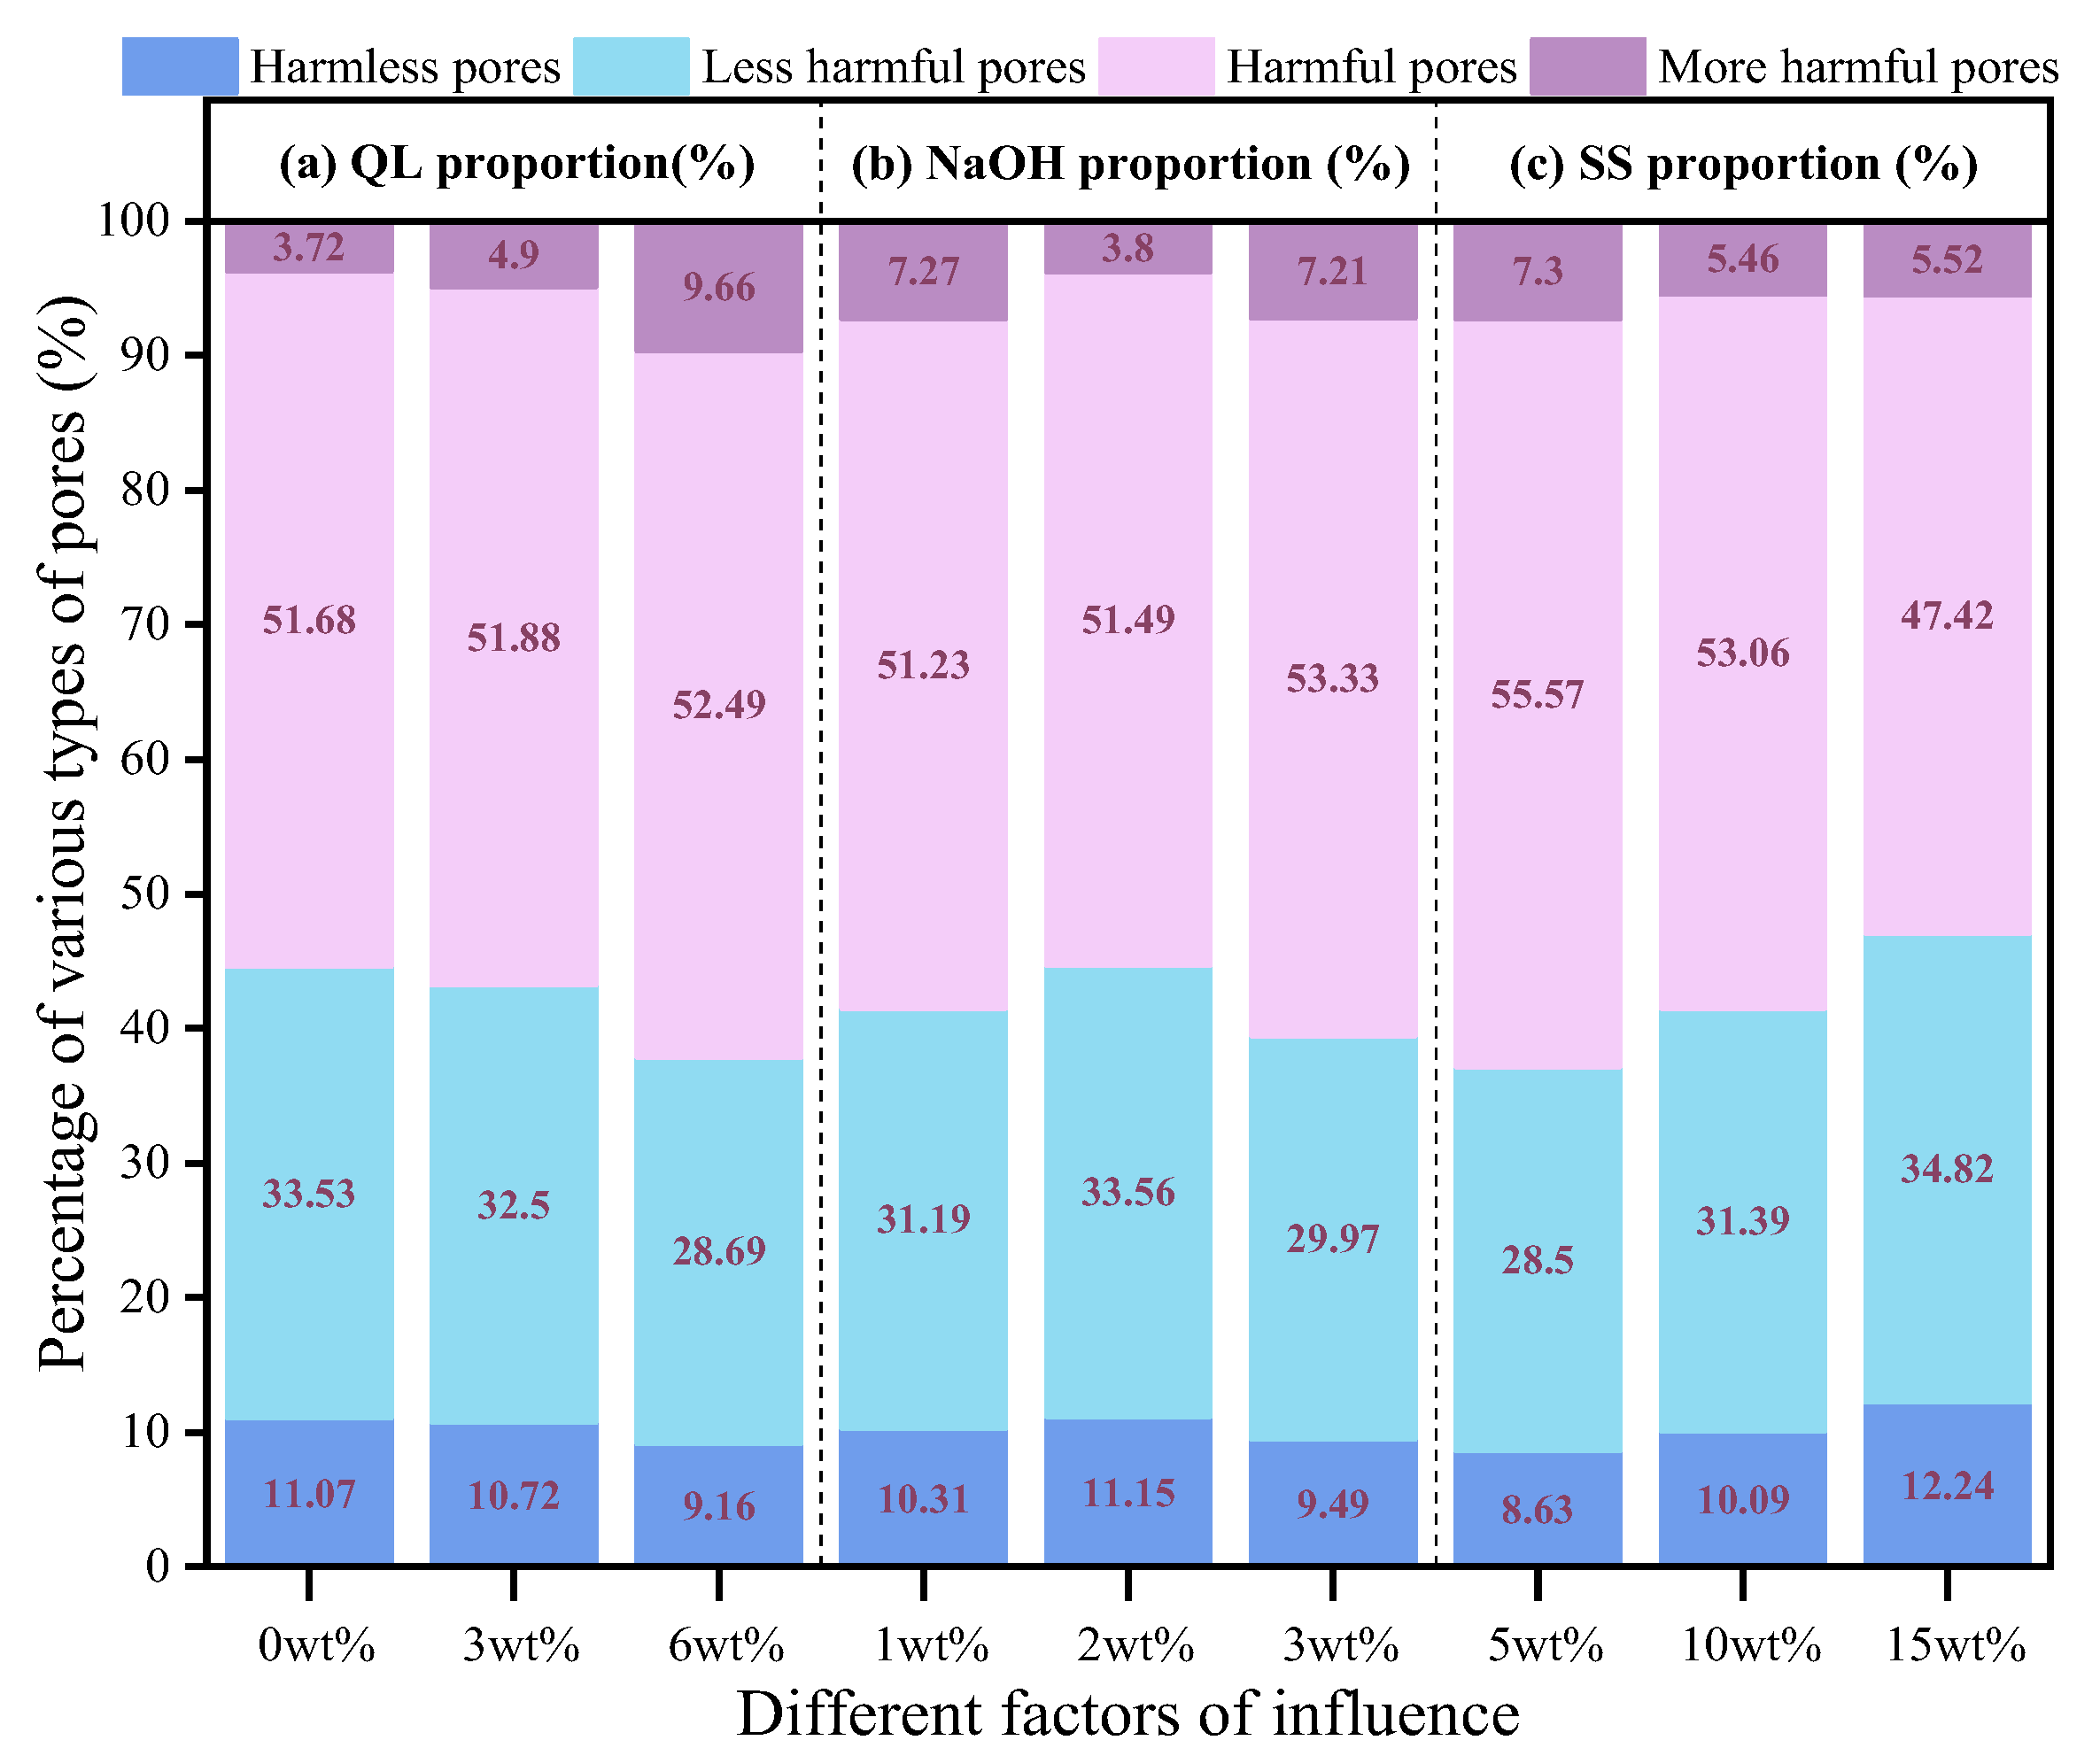
3.2.2. Pore Properties Analysis

As can be seen from Figure 6, the porosity of the specimens ranged from 8.0% to 13.3%, and there was a significant negative correlation between compressive strength and porosity. The specimen with the largest porosity was NO. 6 (A (3 wt%) B (3 wt%) C (5 wt%)) and the smallest was NO. 3 (A (0 wt%) B (3 wt%) C (15 wt%)). It should be noted that NO. 7 (A (6 wt%) B (1 wt%) C (15 wt%)) and NO. 8 (A (6 wt%) B (2 wt%) C (5 wt%)), as two discrete points with large variance, were both specimens with 6% QL addition. It was known that high QL addition reduced the porosity to some extent, and that it did not improve the strength but rather reduced it. Taking the porosity as the test result, the value of K i   was calculated. In Figure 7, it was shown that the increase in SS addition from 5 wt% to 15 wt% decreased the porosity from 12.95% to 8.24%, which was about a 36.37% decrease. This indicated that the porosity was extremely sensitive to the addition of SS. Contrary to the selected demand of Section 3.2.1, the lower value should be the optimal result in this section, and the selected result was A (0 wt%) B (2 wt%) C (15 wt%). However, the difference between the K i   values of A (3 wt%) and A (0 wt%) was only 0.08%, and considering that QL reduced the porosity to some extent, A (3 wt%) B (2 wt%) C (15 wt%) was selected as the optimal result in terms of porosity.
As displayed in Figure 8, the pore size of AABS mainly ranged from 0.003 μm to 100 μm, and the pore size distribution consisted of one primary peak and two secondary peaks, which were located on the right side of the primary peak, and these peaks showed a gradual decreasing trend. The pore size of the primary peak was mainly distributed in the range of 0.003~0.417 μm, the secondary peak Ⅰ in the range of 0.644~32.099 μm, and the secondary peak Ⅱ in the range of 14.478~100 μm. The pore sizes of NO. 7 (A (6 wt%) B (1 wt%) C (15 wt%)) were the lowest among the specimens, and its pore sizes were mainly concentrated in 0.055 μm, 1.775 μm, and 39.883 μm, which could be attributed to the better pore-filling effect of SS [28]. The pore sizes of NO. 1 (A (0 wt%) B (1 wt%) C (5 wt%)) and NO. 2 (A (0 wt%) B (2 wt%) C (10 wt%)) were concentrated in 0.0790 μm, 8.723 μm, 82.247 μm, 0.064 μm, 9.378 μm, and 88.421 μm, which were in a higher level of the test.
In consideration of the large span of pore size range of the specimens, the pores were classified into four categories according to pore size as follows: harmless pores (<20 nm), less harmful pores (20 nm~50 nm), harmful pores (50 nm~200 nm), and more harmful pores (>200 nm) [35]. The classification results are shown in Figure 9. The proportion of harmless and less harmful pores in the specimens decreased with the increase in QL addition, and the sum of the two proportions decreased from 44.6% to 37.85%, of which the proportion decreased significantly when the QL addition was 6%. The primary peak of NO. 7 (A (6 wt%) B (1 wt%) C (15 wt%)) was lower, while the two secondary peaks were higher. This could be caused by the cracks inside the specimen due to the high QL addition. When the NaOH addition was 2%, the percentage of more harmful pores was only 3.8%, and the percentage of less harmful and harmless pores increases. With the increase in SS addition, the percentage of harmless and less harmful pores increased. Therefore, a SS with an appropriate NaOH addition was helpful for increasing the hydration products and refining the internal pore structure of AABS. Combined with Figure 6 and Figure 9, it is known that the more the proportion of harmless and less harmful pores in the specimen, the relatively lower its porosity was, and the higher its compressive strength would be. The volume of the pores was enlarged when there was an increase in the number of harmful and less harmful pores, which made the porosity of the AABS increase, and its instability increased when it was damaged under pressure. As a conclusion, A (3 wt%) B (2 wt%) C (15 wt%) was finally selected as the optimal result for the pore size distribution.

3.3. Performance Analysis of SENC Based on the Optimal Composite Alkali Activators

3.3.1. Physical and Mechanical Properties

Table 4 and Table 5 show the results of the mix proportion and physical and mechanical properties of SENC, respectively. The closer the mean value of the particle shape factor of the NSC is to 1, the closer the shape is to a standard sphere. The mean value of the particle shape factor of the SENC was 1.37, which suggested that the SENCs were mostly slightly flattened ellipsoids (as shown in Figure 10a). The numerical tube pressure and softening coefficient characterized the strength and water resistance of SENC, respectively. For the increase in age from 7 d to 28 d, the hydration process of SENC was gradually completed, and the numerical tube pressure was increased by 40.23%, while the softening coefficient was increased by 3.23%. The bulk density of SENC was 971.41 kg/m3, and the 28 d numerical tube pressure reached 12.2 MPa, with a softening coefficient of 0.96, which was in accordance with the Chinese national standard GB/T 17431.1-2010 [36] for lightweight and high-strength aggregate. The increase in the softening coefficient from 0.93 (7 d) to 0.96 (28 d) is caused by the consumption of free water during the reaction of the SS with the MCA and slag and the production of harder hydration products. Therefore, SENCs had the potential to be used as lightweight concrete aggregates. The morphology of SENC after numerical tube pressure test is shown in Figure 10b, which was seen to be mostly dominated by intermediate fracture and indicated that SENCs were subjected to a uniform force. In Figure 11, it can be observed that the growth in water absorption of SENC was mainly concentrated in the first 10 min. Furthermore, the 10 min water absorption rates of 7 d and 28 d were 85.47% and 79.69% of the 1440 min water absorption rate, respectively. With the increase in age, the water absorption of SENC decreased from 13.7% to 9.82%. It was indicated that the pores were filled by the hydration products, leading to the enhancement of the integrity of SENC. It is believed that the numerical tube pressure of recycled aggregate is 1.6~2.0 MPa, while the 28 d numerical tube pressure of SENC is about 6.1~7.6 times of that of recycled aggregate, and it can be used as high-performance concrete coarse aggregate. Moreover, SENC is a low-cost raw material with a simple preparation process, easy-to-provide maintenance conditions, and it can be used as a pre-fabricated material for engineering or prepared on-site.
Listed in Table 6 is the comparison of the performance of SENC with NSC in other studies. The available NSC curing methods are curing in a standard curing room, steam curing, natural curing, and thermal activation [16,17,18,19,20,21]. The numerical tube pressure of SENC was 1.64 times higher than that of NSC in Ref. [21] when alkali activators were used for all of them. With the same curing method, the bulk and apparent densities of SENC were similar to that of Ref. [16], but the 28 d numerical tube pressure of SENC was 79.41% higher. This finding demonstrated that SENC not only had a simple curing method, but also had better physical and mechanical properties.

3.3.2. Microstructure

Figure 12 shows the XRD result of 28 d SENC. The primary peak was located at 29.3° in 2θ. The hydration products of SENC contained C-A-S-H, calcium hemicarboaluminate, hydrotalcite, portlandite, and vaterite. Part of the water was rapidly absorbed by the QL and reacted violently to produce portlandite. SENC was slowly carbonized by CO2 in the air, leading to CO32−. Under alkaline conditions, the Ca–O bond was broken easily and Ca2+ reacted with CO32− to form vaterite. As the hydration process of the QL became more complete, the alkalinity of the internal environment of SENC increased further, then the Si–O bond and the Al–O bond were broken, resulting in the production of calcium hemicarboaluminate and C-A-S-H. The composite alkali activator contained Na+ and the Ca2+ depletion induced by CO32− led to the saturation of the pore solution with Si and Al saturation, resulting in the formation of zeolite (NaA) [37]. However, NaA did not appear in the main characteristic peaks, instead appearing as hydrotalcite. This might be due to the fact that MCA and FS provided more Mg2+ and Al3+, with which NaA further reacted under highly alkaline conditions (supplied by QL and NaOH) to produce hydrotalcite which was a more stable layered bimetallic hydroxide.
The SEM–EDS results of the central part of the SENC at 28 d are shown in Figure 13. The interior of the SENC had almost no cracks and was uniformly distributed with fine pores, and the inner surfaces of the pores were filled with a variety of hydration products. The white areas labelled on Figure 13 were hydration products, mainly C-A-S-H in reticulated form. The grey areas attached around the pores were portlandite and vaterite, and the white raised areas were calcium hemicarboaluminate and hydrotalcite. Most of the pores did not exceed 0.5 μm in diameter, and only a small number of pores had a diameter of about 5 μm, which suggested that the SS has a better effect on refining the pores. From the selected area of the EDS, the main constituent elements were O, Ca, Si, Al, and Mg. The hydration products had high Si, Al, and Mg content, demonstrating that the hydration process of MCA and FS was complete under the composite alkali activator.

4. Conclusions

In this study, AABS and SENC were prepared by taking MCA and FS as raw materials while QL, NaOH, and SS were taken as alkali activators. The influences of different alkali activators on the performance of AABS were investigated through single factor tests and orthogonal tests, and the optimal ratio of the composite alkali activator was obtained. Based on this optimal result, SENC was prepared and tested for physical and mechanical properties using XRD and SEM–EDS. The conclusions can be drawn as follows:
  • QL could effectively enhance the early age compressive strength of AABS, but lower addition is not enough to fully activate the pozzolanic activity of MCA and FS, and higher addition is harmful to the structure of AABS. NaOH could significantly improve the compressive strength of AABS, but it should be noted that the addition of NaOH should not be too high to avoid expansion. Controlling the SS modulus between 1 a.u. and 1.5 a.u. is beneficial for compressive strength. Although SS was not conducive to the formation of early strength of AABS, it was beneficial to the pore refinement and the improvement of 28 d compressive strength.
  • Based on the single factor test, it was found that there was a complementary effect between the alkali activators. NaOH enhanced the reinforcing effect of QL on compressive strength at early ages. NaOH and SS was directly related to the development of 28 d compressive strength and compensated for the limitation of QL on the compressive strength. Therefore, the use of a composite alkali activator was recommended. Targeted at the compressive strength and porosity, the optimal composite alkali activator incorporated the additions of QL, NaOH, and SS at 3%, 2% and 15%, respectively.
  • The bulk density and the apparent density of SENC were 971.41 kg/m3 and 1852.61 kg/m3, respectively. The 7 d and 28 d numerical tube pressure could reach 8.7 MPa and 12.2 MPa, respectively. The 1440 min water absorption at 28 d was 9.8%. SENC showed excellent physical and mechanical properties, and had the potential to be used as lightweight concrete aggregate, bionic material, and so on.
  • The composite alkali activator was able to effectively activate the pozzolanic activity of MCA and FS to increase the numerical tube pressure of SENC, as well as significantly refine the pores of SENC. The densification of the SENC structure was improved by the hydration products of MCA and FS (C-A-S-H, calcium hemicarboaluminate, hydrotalcite, etc.).

Author Contributions

Conceptualization, S.C.; methodology, P.D.; software, P.D.; validation, J.Z., P.D. and S.C.; formal analysis, J.Z.; investigation, J.Z.; resources, S.C.; data curation, J.Z.; writing—original draft preparation, P.D. and M.Z.; writing—review and editing, J.Z. and Y.B.; visualization, Q.H.; supervision, P.D.; project administration, P.D.; funding acquisition, S.C. All authors have read and agreed to the published version of the manuscript.

Funding

This research was funded by two grants from the National Natural Science Foundation of China, a grant from the Henan Provincial Science and Technology Research Project and a grant from the Engineering Research Service Project of Water Transfer Project from the Yangtze River to Huaihe River (Henan Section), grant numbers 52109154, 51979169, 242102320374, and NHNYJJH/JS/FWKY-2021003.

Institutional Review Board Statement

Not applicable.

Informed Consent Statement

Not applicable.

Data Availability Statement

The original contributions presented in the study are included in the article, further inquiries can be directed to the corresponding authors.

Acknowledgments

This work was supported by the North China University of Water Resources and Electric Power.

Conflicts of Interest

The authors declare that they have no known competing financial interests or personal relationships that could appear to influence the work reported in this paper.

References

  1. Wang, H.; Liu, J.; Klaar, M.; Chen, A.; Gudmundsson, L.; Holden, J. Anthropogenic climate change has influenced global river flow seasonality. Science 2024, 383, 1009–1014. [Google Scholar] [CrossRef]
  2. Sousa, V.; Bogas, J.A. Comparison of energy consumption and carbon emissions from clinker and recycled cement production. J. Clean. Prod. 2021, 306, 127277. [Google Scholar] [CrossRef]
  3. Liu, J.; Bawa, K.S.; Seager, T.P.; Mao, G.; Ding, D.; Lee, J.S.H.; Swim, J.K. On knowledge generation and use for sustainability. Nat. Sustain. 2019, 2, 80–82. [Google Scholar] [CrossRef]
  4. Zheng, X.; Zhang, C.; Ma, H.; Yang, H.; Zhao, Y.; Liu, B. Effect of albite on shrinkage and carbonation resistance of alkali-activated slag. Constr. Build. Mater. 2023, 409, 134141. [Google Scholar] [CrossRef]
  5. Wi, K.; Lee, H.; Lim, S.; Song, H.; Hussin, M.W.; Ismail, M.A. Use of an agricultural by-product, nano sized Palm Oil Fuel Ash as a supplementary cementitious material. Constr. Build. Mater. 2018, 183, 139–149. [Google Scholar] [CrossRef]
  6. Bondar, D.; Ma, Q.; Soutsos, M.; Basheer, M.; Provis, J.L.; Nanukuttan, S. Alkali activated slag concretes designed for a desired slump, strength and chloride diffusivity. Constr. Build. Mater. 2018, 190, 191–199. [Google Scholar] [CrossRef]
  7. Krizan, D.; Zivanovic, B. Effects of dosage and modulus of water glass on early hydration of alkali–slag cements. Cem. Concr. Res. 2002, 32, 1181–1188. [Google Scholar] [CrossRef]
  8. Wu, T.; Liu, K.; Cheng, X.; Zhang, J. Analysis of energy, carbon emissions and economics during the life cycle of biomass power generation: Case comparison from China. Biomass Bioenerg. 2024, 182, 107098. [Google Scholar] [CrossRef]
  9. Šupić, S.; Malešev, M.; Radonjanin, V.; Bulatović, V.; Milović, T. Reactivity and pozzolanic properties of biomass ashes generated by wheat and soybean straw combustion. Materials 2021, 14, 1004. [Google Scholar] [CrossRef] [PubMed]
  10. Olatoyan, O.J.; Kareem, M.A.; Adebanjo, A.U.; Olawale, S.O.A.; Alao, K.T. Potential use of biomass ash as a sustainable alternative for fly ash in concrete production: A review. Hybrid Adv. 2023, 4, 100076. [Google Scholar] [CrossRef]
  11. Sunita, A. Effect of biomass ash, foundry sand and recycled concrete aggregate over the strength aspects of the concrete. Mater. Today Proc. 2021, 50, 2044–2051. [Google Scholar] [CrossRef]
  12. Teixeira, E.R.; Camões, A.; Branco, F.G.; Aguiar, J.B.; Fangueiro, R. Recycling of biomass and coal fly ash as cement replacement material and its effect on hydration and carbonation of concrete. Waste Manag. 2019, 94, 39–48. [Google Scholar] [CrossRef] [PubMed]
  13. Yurt, Ü.; Bekar, F. Comparative study of hazelnut-shell biomass ash and metakaolin to improve the performance of alkali-activated concrete: A sustainable greener alternative. Constr. Build. Mater. 2022, 320, 126230. [Google Scholar] [CrossRef]
  14. Velay-Lizancos, M.; Azenha, M.; Martínez-Lage, I.; Vázquez-Burgo, P. Addition of biomass ash in concrete: Effects on E-Modulus, electrical conductivity at early ages and their correlation. Constr. Build. Mater. 2017, 157, 1126–1132. [Google Scholar] [CrossRef]
  15. Wu, X.; Gu, F.; Su, C.; Wang, W.; Pu, K.; Shen, D.; Long, Y. Preparing high-strength ceramsite from ferronickel slag and municipal solid waste incineration fly ash. Ceram. Int. 2022, 48, 34265–34272. [Google Scholar] [CrossRef]
  16. Frankovič, A.; Bosiljkov, V.B.; Ducman, V. Lightweight aggregates made from fly ash using the cold-bond process and their use in lightweight concrete. Mater. Tehnol. 2017, 51, 267–274. [Google Scholar] [CrossRef]
  17. Hu, G.; Yan, K.; Gao, J.; Cheng, F.; Huo, X.; Guo, M.; Zhang, M. A non-fired ceramsite construction material with enhanced lightweight high strength properties. Constr. Build. Mater. 2023, 371, 130771. [Google Scholar] [CrossRef]
  18. Pan, H.; Si, X.; Wang, S.; Wang, J.; Bao, K.; Zhao, Q. Preparation of low-carbon and environmentally friendly non-sintered ceramsite (NSC) employing steel slag, GGBS and fly ash: Experiment and performance regulation. Constr. Build. Mater. 2024, 411, 134438. [Google Scholar] [CrossRef]
  19. Yu, Q.; Li, C.; Wang, Z.; Deng, A. Study on preparation and properties of unburned ceramsite with steel slag. IOP Conf. Ser. Mater. Sci. Eng. 2019, 677, 022067. [Google Scholar] [CrossRef]
  20. Shi, Y.; Guo, W.; Jia, Y.; Xue, C.; Qiu, Y.; Zhao, Q.; Wang, D. Preparation of non-sintered lightweight aggregate ceramsite based on red mud-carbide slag-fly ash: Strength and curing method optimization. J. Clean. Prod. 2022, 372, 133788. [Google Scholar] [CrossRef]
  21. Ma, C.; Bao, S.; Zhang, Y.; Luo, Y.; Gui, Y.; Ren, Y. Preparation of non-sintered sewage sludge based ceramsite by alkali-thermal activation and hydration mechanism. Ceram. Int. 2022, 48, 31606–31613. [Google Scholar] [CrossRef]
  22. GB/T 17671-2021; Test Method of Cement Mortar Strength (ISO Method). Academy of Building Research: Beijing, China, 2021.
  23. GB/T 17431.2-2010; Lightweight Aggregates and Its Test Methods—Part 2: Test Method for Lightweight Aggregates. Academy of Building Research: Beijing, China, 2010.
  24. Sha, F.; Li, S.; Liu, R.; Li, Z.; Zhang, Q. Experimental study on performance of cement-based grouts admixed with fly ash, bentonite, superplasticizer and water glass. Constr. Build. Mater. 2018, 161, 282–291. [Google Scholar] [CrossRef]
  25. Shi, C.; Day, R.L. Chemical activation of blended cements made with lime and natural Pozzolans. Cem. Concr. Res. 1993, 23, 1389–1396. [Google Scholar] [CrossRef]
  26. Wang, Y.; Hu, Y.; He, X.; Su, Y.; Strnadel, B.; Miao, W. Hydration and compressive strength of supersulfated cement with low-activity high alumina ferronickel slag. Cem. Concr. Compos. 2023, 136, 104892. [Google Scholar] [CrossRef]
  27. Yuan, X.; Chen, W.; Lu, Z.; Chen, H. Shrinkage compensation of alkali-activated slag concrete and microstructural analysis. Constr. Build. Mater. 2014, 66, 422–428. [Google Scholar] [CrossRef]
  28. Li, J.; Yu, Q.; Huang, H.; Yin, S. Difference in the reaction process of slag activated by waterglass solution and NaOH solution. Struct. Concr. 2019, 20, 1528–1540. [Google Scholar] [CrossRef]
  29. Che, J.; Yang, R.; Wang, J.; Liu, H.; Hu, Y.; Doh, S.I. Research on basic mechanical properties of different modulus alkaline excited ECC. Phys. Chem. Earth. Part A/B/C 2022, 128, 103233. [Google Scholar] [CrossRef]
  30. Li, M.; Huang, G.; Cui, Y.; Wang, B.; Chang, B.; Yin, Q.; Zhang, S.; Wang, Q.; Feng, J.; Ge, M. Coagulation mechanism and compressive strength characteristics analysis of high-strength alkali-activated slag grouting material. Polymers 2022, 14, 3980. [Google Scholar] [CrossRef]
  31. Luo, L.; Yao, W.; Liang, G.; Luo, Y. Workability, autogenous shrinkage and microstructure of alkali-activated slag/fly ash slurries: Effect of precursor composition and sodium silicate modulus. J. Build. Eng. 2023, 73, 106712. [Google Scholar] [CrossRef]
  32. Zidan, I.; Khalaf, M.A.; Helmy, A.I.I. Properties of alkali-activated slag mortar and prediction of its compressive strength. Ain. Shams Eng. J. 2023, 14, 102536. [Google Scholar] [CrossRef]
  33. Dai, X.; Ren, Q.; Aydin, S.; Yardimci, M.Y.; Schutter, G.D. Accelerating the reaction process of sodium carbonate-activated slag mixtures with the incorporation of a small addition of sodium hydroxide/sodium silicate. Cem. Concr. Compos. 2023, 141, 105118. [Google Scholar] [CrossRef]
  34. Jiao, Z.; Wang, Y.; Zheng, W.; Huang, W. Effect of dosage of sodium carbonate on the strength and drying shrinkage of sodium hydroxide based alkali-activated slag paste. Constr. Build. Mater. 2018, 179, 11–24. [Google Scholar] [CrossRef]
  35. Chen, S.; Liu, Y.; Bie, Y.; Duan, P.; Wang, L. Multi-scale performance study of concrete with recycled aggregate from tannery sludge. Case Stud. Constr. Mater. 2022, 17, e01698. [Google Scholar] [CrossRef]
  36. GB/T 17431.1-2010; Lightweight Aggregates and Its Test Methods—Part 1: Lightweight Aggregates. China Academy of Building Research: Beijing, China, 2010.
  37. Bernal, S.A.; Provis, J.L.; Myers, R.J.; Nicolas, R.S.; Deventer, J.S.J. Role of carbonates in the chemical evolution of sodium carbonate-activated slag binders. Mater. Struct. 2015, 48, 517–529. [Google Scholar] [CrossRef]
Figure 1. The flowchart of the preparation.
Sustainability 16 06634 g001
Figure 2. The effect of a single alkali activator factor on AABS: (a) QL addition, (b) NaOH addition, (c) SS modulus, (d) SS addition.
Sustainability 16 06634 g002
Figure 3. Appearance of AABS samples: (a) excessive amounts of QL, (b) comparison of specimen containing SS with specimen containing QL, (c) excessive amounts of NaOH.
Sustainability 16 06634 g003
Figure 4. Compressive strength of AABS in orthogonal tests.
Sustainability 16 06634 g004
Figure 5. Relationship between the three levels and the compressive strength.
Sustainability 16 06634 g005
Figure 6. Relationship between compressive strength and porosity.
Sustainability 16 06634 g006
Figure 7. Relationship between the three levels and the porosity.
Sustainability 16 06634 g007
Figure 8. Pore size distribution of each group at 28 d.
Sustainability 16 06634 g008
Figure 9. Relationship between the three levels and the percentage of pore size at 28 d.
Sustainability 16 06634 g009
Figure 10. Appearance of SENC: (a) freshly made, (b) after the numerical tube pressure test.
Sustainability 16 06634 g010
Figure 11. Water absorption curve of SENC.
Sustainability 16 06634 g011
Figure 12. XRD patterns (intensity (a.u.) versus 2 Theta (°)) of SENC at 28 d.
Sustainability 16 06634 g012
Figure 13. SEM–EDS patterns of SENC at 28 d.
Sustainability 16 06634 g013
Table 1. Main chemical composition of the FS and MCA.
MaterialPercentage Composition (wt%)
CaOSiO2Al2O3Fe2O3MgOSO3TiO2Na2OMnOK2OP2O5LOI
FS412813.90.3699.782.851.51.170.5430.519/0.369
MCA32.328.48.245.617.475.780.8361.690.2814.283.71.413
Table 2. Orthogonal experiment design.
LevelsFactors
(A) QL (%)(B) NaOH (%)(C) SS (%)
1015
23210
36315
Table 3. Weight percentage of each constituent in AABS (MCA + FS = 100 g).
NumberGroupsMCA (g)FS (g)FactorWater (g)
(A) QL (g)(B) NaOH (g)(C) SS (g)
NO. 1A (0 wt%) B (1 wt%) C (5 wt%)505001531.79
NO. 2A (0 wt%) B (2 wt%) C (10 wt%)021028.58
NO. 3A (0 wt%) B (3 wt%) C (15 wt%)031525.38
NO. 4A (3 wt%) B (1 wt%) C (10 wt%)311028.58
NO. 5A (3 wt%) B (2 wt%) C (15 wt%)321525.38
NO. 6A (3 wt%) B (3 wt%) C (5 wt%)33531.79
NO. 7A (6 wt%) B (1 wt%) C (15 wt%)611525.38
NO. 8A (6 wt%) B (2 wt%) C (5 wt%)62531.79
NO. 9A (6 wt%) B (3 wt%) C (10 wt%)631028.58
Table 4. Weight percentage of each constituent in SENC (MCA + FS = 100 g).
MCA (g)FS (g)QL Proportion (g)NaOH Proportion (g)SS Proportion (g)Water (g)
5050321532.24
Table 5. Performance test results of SENC.
Ranges of Particle SizesParticle Shape FactorApparent Density
(kg/m3)
Bulk Density
(kg/m3)
Water Absorption Rate (%)Numerical Tube Pressure (MPa)Softening Coefficient
MaxMinAverage7 d28 d7 d28 d
10~16 mm1.581.031.371852.61971.419.808.712.20.930.96
Table 6. Comparison of the performance of SENC with NSC in other studies.
Raw MaterialsOther MaterialsCuring MethodsBulk Density (kg/m3)Apparent Density
(kg/m3)
Numerical tube Pressure (MPa)Reference
90% Fly ash
10% Cement
/Curing in standard curing room919.52248.70.96Frankovič et al. [16]
85% Low-activity circulating fluidized bed fly ash
15% Cement
6% Quicklime
6% Desulfurization gypsum
2% Hydrogen peroxide
Steam curing at 70 °C for 12 h695.341091.885.5Hu et al. [17]
30% Steel slag
30% Ground granulated blast-furnace slag
30% Fly ash
10% Cement
3% Sodium silicate solution
5% CaSO4•2H2O
Steam curing at 60 °C for 12 h960.3/12.4Pan et al. [18]
40% Steel slag
40% Fly ash
10% Clay
10% Cement
2% Expanded perlite
1% grade-A cellulose
Natural curing944/8.15Yu et al. [19]
30% Red mud
30% Carbide slag
40% Fly ash
Wastewater with NaOHSteam curing at 80 °C for 12 h77014004.5Shi et al. [20]
80% Sewage sludge
20% Fly ash
6% CaO
9% NaOH
600 °C thermal activation85226037.43Ma et al. [21]
50% Furnace slag
50% Ash of mushroom and corn straw
3% Quicklime powder
2% NaOH
15% Sodium silicate solution
Curing in standard curing room971.411852.6112.2SENC (this study)
Disclaimer/Publisher’s Note: The statements, opinions and data contained in all publications are solely those of the individual author(s) and contributor(s) and not of MDPI and/or the editor(s). MDPI and/or the editor(s) disclaim responsibility for any injury to people or property resulting from any ideas, methods, instructions or products referred to in the content.

