Article

Performance and Sustainability of Organic and Conventional Cotton Farming Systems in Egypt: An Environmental and Energy Assessment

by
Andi Mehmeti
1,*,
Ahmed Abdelwahab M. Abdelhafez
2,
Pierre Ellssel
3,
Mladen Todorovic
1 and
Generosa Calabrese
1
1
Mediterranean Agronomic Institute of Bari, Via Ceglie, 9, 70010 Valenzano, Italy
2
Faculty of Organic Agriculture, Heliopolis University, 3 Cairo-Belbeis Desert Road, P.O. Box 3020 El Salam, Cairo 11785, Egypt
3
Department of Crop Sciences, Institute of Agronomy, University of Natural Resources and Life Sciences (BOKU), Gregor-Mendel-Strasse 33, 1180 Vienna, Austria
*
Author to whom correspondence should be addressed.
Sustainability 2024, 16(15), 6637; https://doi.org/10.3390/su16156637
Submission received: 29 June 2024 / Revised: 29 July 2024 / Accepted: 30 July 2024 / Published: 2 August 2024
(This article belongs to the Section Sustainable Agriculture)

Abstract

:
Cotton cultivation is resource-intensive, posing significant environmental challenges, especially with conventional farming methods. Growing interest in sustainable agriculture drives the exploration of organic farming as a potential alternative with lower environmental impacts. Despite its benefits, organic farming often faces criticism for lower crop yields, sparking debates on the trade-offs between productivity and environmental impact. This study hypothesizes that organic cotton farming will have a smaller environmental footprint and higher energy efficiency compared to conventional methods. To test this hypothesis, a cradle-to-farm gate energy analysis and life cycle assessment (LCA) were conducted on both organic and conventional seed cotton production systems in the Beheira governorate of Egypt. The ReCiPe 2016 midpoint and endpoint characterization model was used for an environmental impact assessment. The impacts were evaluated using two functional units: one ton of seed cotton and one hectare of cultivated cotton. The findings revealed that organic cotton outperforms conventional cotton in net energy gain, efficiency, and profitability, with higher productivity and lower energy intensity. Regardless of the functional unit used (mass- or land-based), the assessed organic systems generally show a better environmental performance than the conventional systems in the local context, even when accounting for data uncertainty. This is due to lower input intensity and the use of less energy-intensive organic fertilizers and bio-fertilizers. Fertilization and irrigation are key factors influencing environmental impacts, with fertilization affecting midpoint impacts and irrigation affecting endpoint impacts. Therefore, precision fertilization, efficient irrigation practices, and effective nutrient and soil moisture management are recommended to minimize environmental impacts. Subsequent studies could explore whether similar patterns are observed in different geographic regions and evaluate additional social and economic aspects of cotton sustainability beyond environmental impacts. Future agricultural LCAs should use both mass-based and area-based functional units to capture a broader range of environmental effects and evaluate the co-benefits and trade-offs between organic and conventional practices.

1. Introduction

Cotton (Gossypium hirsutum L.) is the most cultivated natural fiber, grown in nearly all climate types across 50 countries worldwide [1]. This important non-food cash crop, referred to as “white gold”, plays a crucial role in the agricultural economies of many nations [2]. Global cotton production is projected to increase by 12% between 2023 and 2032 [3]. Consequently, Egypt has emerged as a significant producer of cotton in the Middle East and Africa, making it a crucial strategic commodity for the economy. In 2021, exports surpassed 81,000 metric tonnes to over 28 countries, generating approximately $206 million in total revenue. With rising global demand, the development of more sustainable production practices is essential.
Cotton is an important economic fibre, however, the processes of growing and processing it can be resource-intensive and may lead to adverse environmental consequences [4]. Specifically, conventional cotton farming is typically associated with the extensive use of fertilizer and pesticides, resulting in reduced efficiency and increased production costs [5]. Additionally, cotton cultivation demands significant freshwater, with unsustainable water use comprising 67% of total consumption, ranking it third among crops for high unsustainable water use [6]. Organic farming is increasingly promoted as a sustainable alternative due to its lower input levels, particularly regarding synthetic inputs [7,8,9]. However, it often faces criticism for yielding lower outputs and potential environmental trade-offs per unit of product [10]. This ongoing debate highlights the need for comprehensive assessments of both farming systems to understand their respective impacts on sustainability and productivity.
Energy analysis has been widely utilized at various levels, from individual farms to national assessments [11], to compare organic and conventional farming methods [11]. With the increasing urgency of global climate change, incorporating greenhouse gas (GHG) emissions into agricultural energy analyses has become more common. A comprehensive review of energy-related studies in cotton production reveals significant research advancements from 1991 to 2023, highlighting the evolving understanding of energy requirements, efficiency, and greenhouse gas emissions across various regions, including Greece [12], Türkiye [13,14,15], Iran [16,17], India [18], Pakistan [19,20], and China [21], providing valuable data on energy performance and GHG emissions associated with cotton cultivation. The minimum reported value is 23,960 MJ ha−1 in India [18], while the maximum reaches 83,869.49 MJ ha−1 in Turkish cotton cultivation across various regions [15].
Cotton’s environmental impact is multifaceted including water use, toxicity, and eutrophication [6]. The increasing application of life cycle assessments (LCAs) has become essential for evaluating and comparing the environmental impacts of organic and conventional crop systems across various categories [22]. This method provides a comprehensive framework for understanding the ecological consequences of agricultural practices, particularly in cotton farming. It is instrumental for achieving a holistic perspective, identifying hotspots, and exploring potential co-benefits and trade-offs of products and organizations [23]. The progression of LCA studies in cotton production has been characterized by important contributions from numerous researchers across different regions, such as Pakistan [24], China [25], Mali [26], India [18,27], and Iran [4], revealing critical insights into the environmental sustainability of cotton production. For instance, Ullah et al. [24], explored the eco-efficiency of cotton-cropping systems in Pakistan using an integrated approach of LCA and data envelopment analysis. Shah et al. [27] presented a comparative study of organic, Better Cotton Initiative (BCI), and conventional cotton cultivation practices in India, highlighting the differences in sustainability. In Mali, Avadí et al. [26], conducted an LCA comparing organic and conventional non-Bt cotton products, providing insights into their environmental impacts. Zhang et al. [25] focused on water footprint analysis in China’s cotton production, emphasizing the importance of environmental sustainability. Additionally, Singh et al. [18] utilized data envelopment analysis to optimize the net ecosystem carbon and energy budget in cotton cultivation in North-Western India. Chen et al. [28] reviewed LCA studies related to cotton textiles, summarizing the findings and implications for sustainable practices. Zhang et al. [6] conducted a review of the environmental impacts of cotton production across its life cycle, identifying key factors influencing these impacts at the cultivation, manufacturing, and use stages, while also suggesting opportunities for improving sustainability and highlighting the need for further research in developing countries. Recently, Gonzalez [29] analyzed the multi-faceted environmental impacts of global conventional and organic cotton using LCA, revealing significant differences in impact categories during agricultural production and highlighting the substantial effects of conventional cotton dyeing on global warming potential and terrestrial ecotoxicity. Numerous studies on LCAs indicate that cotton production has considerable environmental impacts due to high water consumption, land use, and the extensive use of energy, fertilizers, and pesticides, all of which can adversely affect the environment and human health [30].
Despite the extensive research, there remains limited information on the environmental impacts of global cotton production, with only a few LCA categories commonly assessed, such as global warming, eutrophication, and water consumption [28]. The ongoing debate continues regarding the comparative advantages of organic versus conventional cotton production systems, with organic agriculture often showing benefits in some environmental areas while conventional practices may excel in others [22]. Additionally, the use of LCA in Africa is constrained by a lack of expertise and data [31], which limits the ability to assess specific regional impacts and adapt methodologies for local contexts. This gap underscores the need for more comprehensive studies to evaluate the environmental implications of cotton production in the region.
This study aims to provide new evidence through a detailed energy and life cycle impact assessment of both conventional and organic cotton cultivation in Egypt’s Beheira governorate. By hypothesizing that organic cultivation will exhibit a reduced environmental footprint per unit area but higher per unit of product, the study seeks to contribute to the ongoing discourse on sustainability in cotton farming.
This research is particularly important given the growing global demand for cotton and the need for sustainable production practices. In summary, this study provides valuable new evidence and insights to support sustainable decision making in Egyptian and African cotton farming, while also contributing to the broader global discourse on the environmental sustainability of organic and conventional cotton production systems.

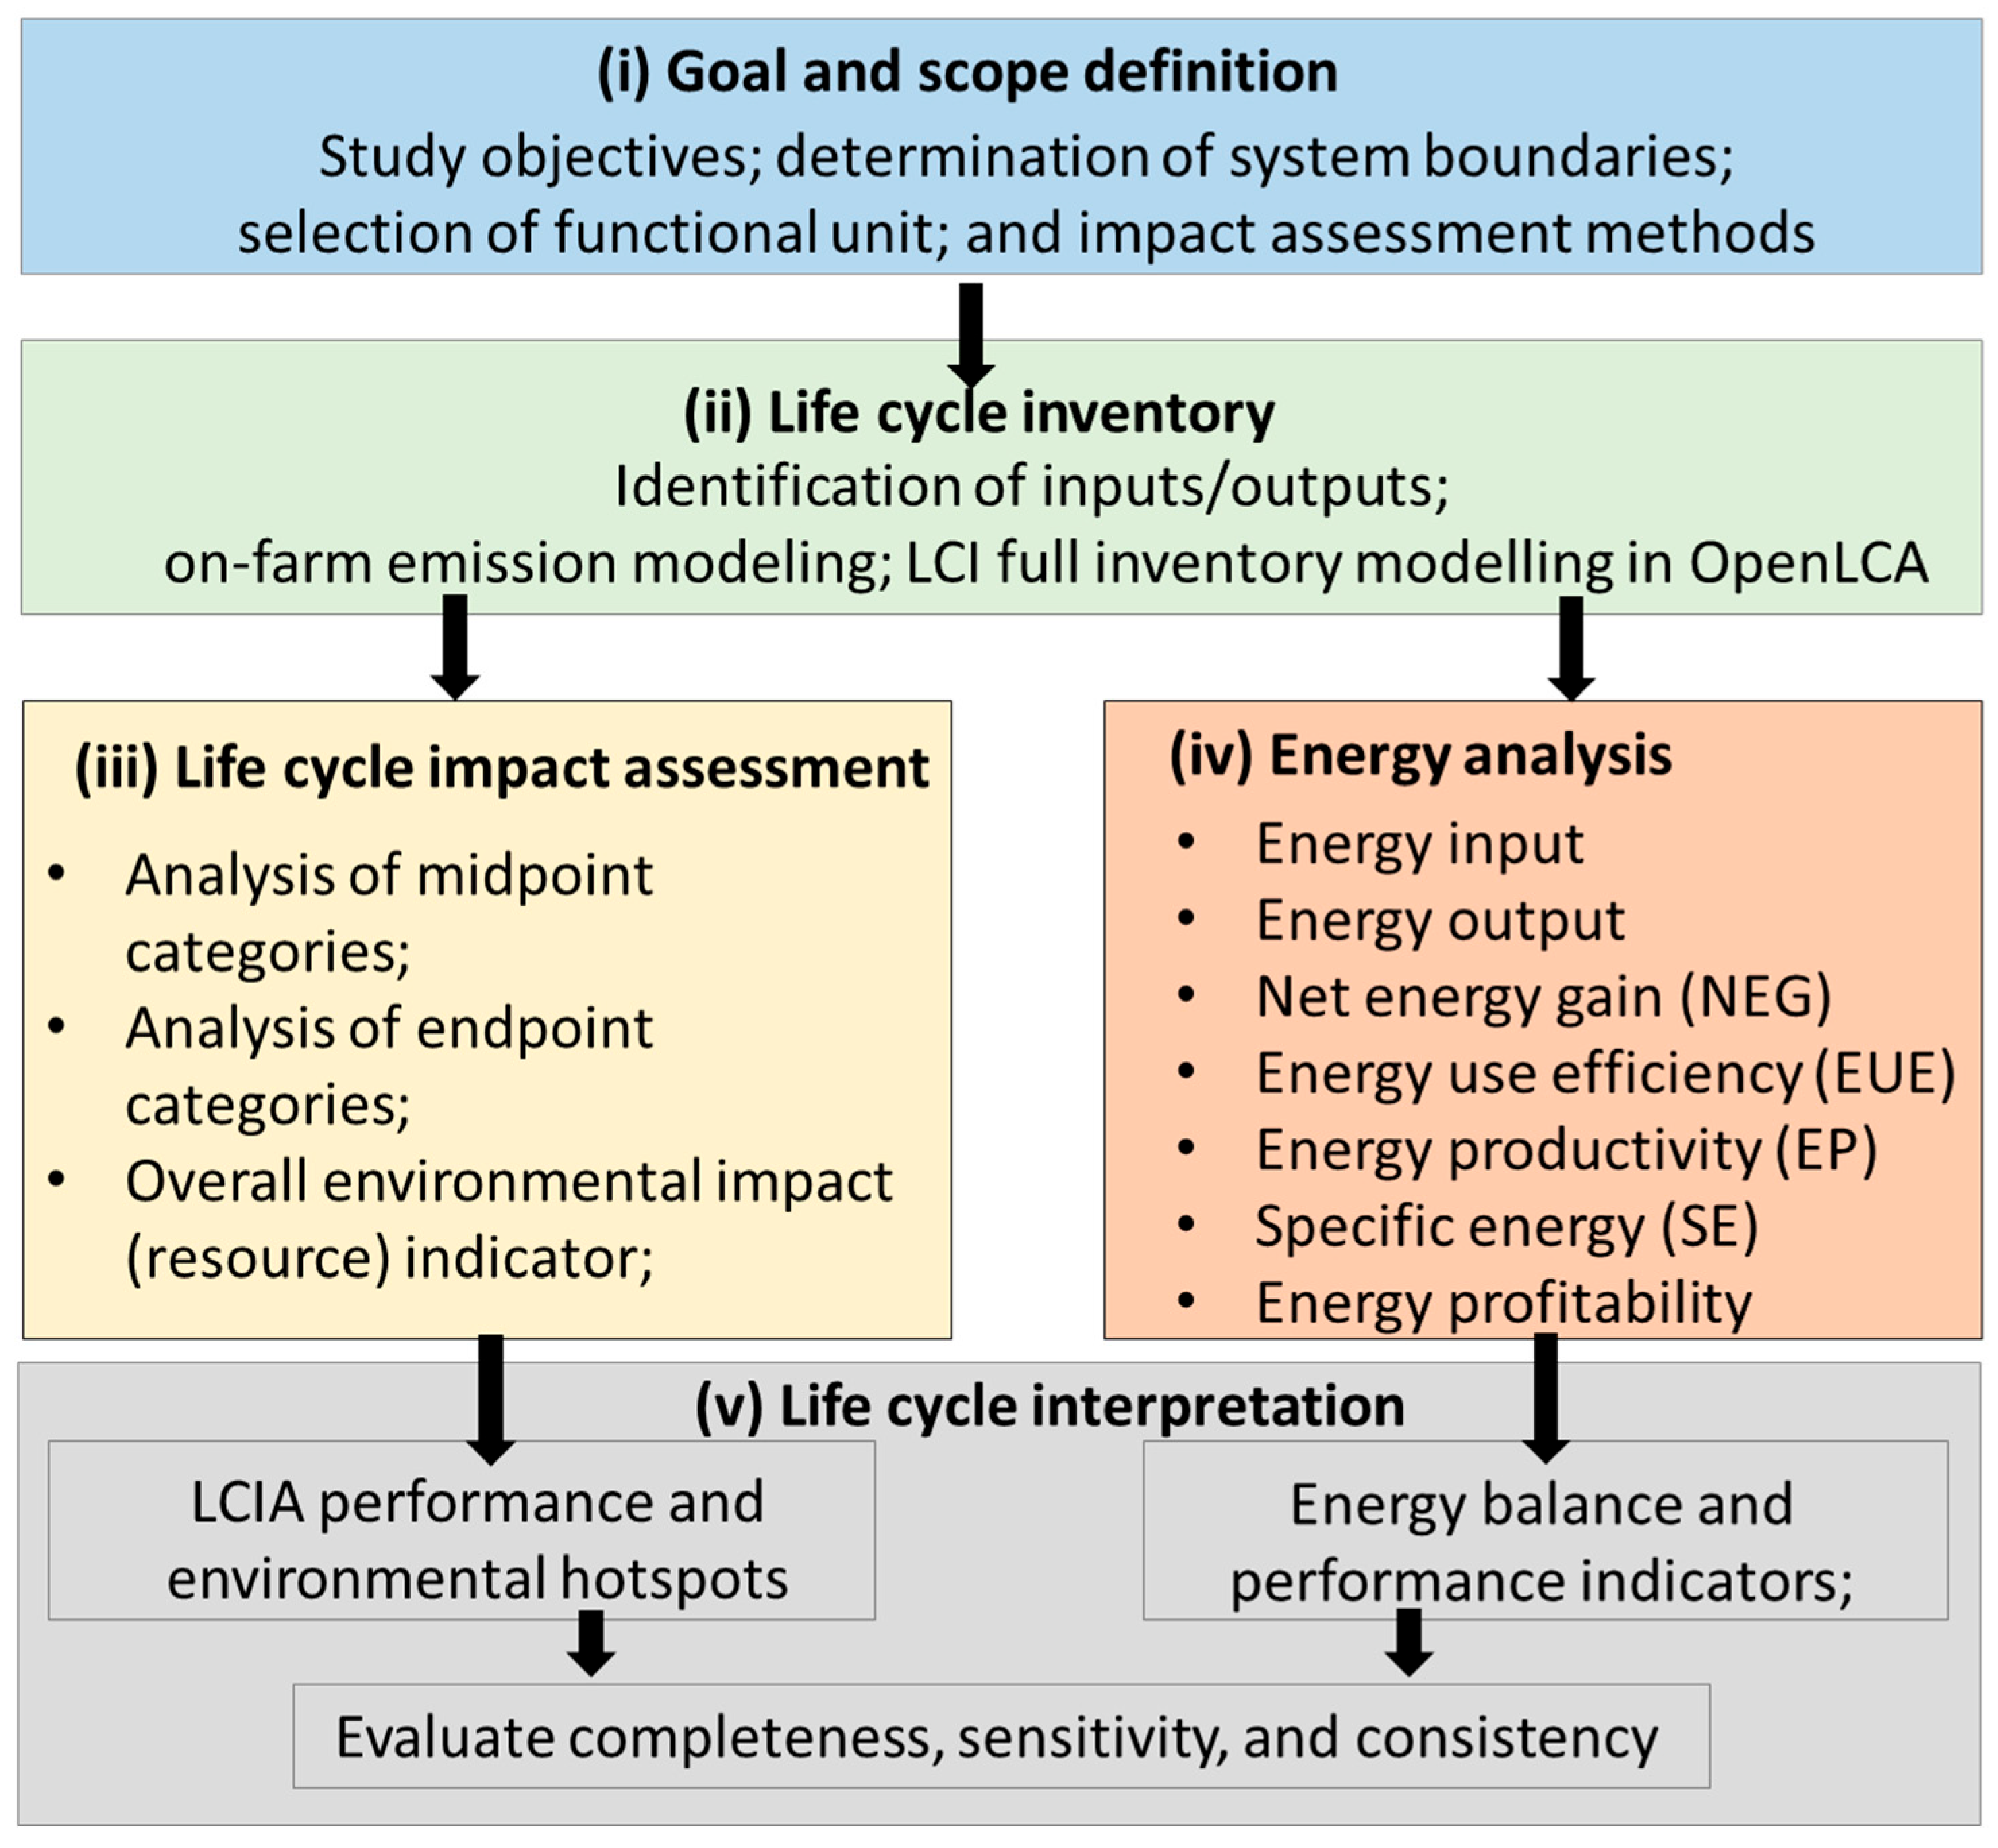
2. Materials and Methods

The methodology employed in this study is based on the approach suggested by Denora et al. [32]. As illustrated in Figure 1, two research methodologies—namely, life cycle energy analysis and environmental life cycle assessment—were utilized in the present investigation. A typical life cycle assessment (LCA) study consists of four phases: (a) the goal and scope definition phase; (b) the inventory analysis phase; (c) the impact assessment phase; and (d) interpretation.
Initially, the goals and boundaries were established, followed by the collection of data related to the inputs of cotton cultivation, including human labor, machinery, fuel, chemical fertilizers, water, and pesticides. Subsequently, an energy analysis was conducted, which accounted for all forms of energy input and output during the crop production process. This study aims to explore various energy indices such as Energy Use Efficiency (EUE), Energy Profitability (EP), Specific Energy (SE), Net Energy Gain (NEG), and overall energy profitability.
Using attributional Life Cycle Assessment (LCA), the environmental impacts arising from all inputs were investigated. Based on the Recipe 2016 methodology [33], midpoint and endpoint indicators (Hierarchist perspective) have been combined to create a comprehensive environmental profile. Midpoint indicators address specific environmental issues such as water usage, climate change, toxicity, acidification, and eutrophication. At the endpoint level, three categories—human health, ecosystem quality, and resource scarcity—were quantified. To simplify impact information, a single score indicator was applied. Frequently, LCA results can be challenging for stakeholders like policymakers and decision-makers to comprehend. Therefore, presenting the results as a single score aims to facilitate their understanding of performance. The interpretation phase involved identifying significant issues based on the results of the life cycle inventory (LCI) and life cycle impact assessment (LCIA) phases. This included assessing the magnitude and the most relevant life cycle stages, processes, elementary flows, and impact categories, as well as deriving conclusions, limitations, and recommendations.

2.1. Goal and Scope

The goal and scope definition phase of an LCA involves making decisions regarding the production system, including the functional unit, system boundary delimitation, exclusion of life cycle stages, input flows, impact indicators, and characterization factors. In the present study, an attributional approach was applied in the Beheira governorate of Egypt to assess the organic and conventional cultivation systems of the cotton cultivar Giza 86. This research identifies the main hotspots associated with the agricultural stage in the two cropping systems. While we acknowledge variations among systems, it is important to note that this study does not strictly follow a comparative approach.
The chosen LCA boundary extends from the cradle to the farm gate. This comprehensive approach considers the production of agricultural inputs, all agricultural processes, the use of machinery, and any on-farm processing, such as drying, leading to the final product at the farm gate, which typically represents the most common sales form. Cotton cultivation activities included field preparation, planting, field operations, and harvesting. Field operations involved irrigation, weed and pest control, and fertilization. These tasks consume energy (electricity and fuel), require inputs (seeds, fertilizers, water, etc.), and produce crop residues and emissions, all integral to the current system (see Figure 2).
LCA results are usually expressed in relation to a functional unit (FU). The functional units (FUs) employed in this study are one kilogram (kg) and/or one metric ton of seed cotton at the farm exit gate, as well as one hectare (ha) of cultivated cotton. Utilizing a dual functional unit for comparing organic and conventional methods offers a valuable basis for comparison, yielding more comprehensive information [26]. The reference flow for both systems of cotton was one metric ton of seed cotton.

2.2. Life Cycle Inventory

The life cycle inventory (LCI) involves data collection and the calculation procedure for the quantification of inputs and outputs of the production system (Table 1). Typically, LCI comprises both foreground and background data. Several data sources have been used to model the inventory of cotton cropping systems.
Primary data, which include detailed information on resource inputs and crop yields, were obtained from three model farms as part of the SustInAfrica H2020 research initiatives. A semi-structured questionnaire was utilized during the “Baseline Analysis & Monitoring System’s Design of West and North African Farming Systems” phase of the SustInAfrica project to collect and organize this information. It is important to note that these datasets do not represent average national data; however, they are indicative of the prevalent agricultural practices typically adopted by local farmers in the Beheira governorate. Agricultural production data reflect average values over the most recent five-year period.
Cotton farms in Beheira are relatively small, with the average farm size being around 1 feddan (1.038 acres or 0.42 hectares). The primary cotton variety grown in Beheira is Giza 86, known for its high quality and long fibers. Farm holdings are often fragmented, with farmers cultivating multiple small plots of land. The generic input data included human labor, seeds, diesel fuel, irrigation water, chemical fertilizers, and plant protection (Table 1). The input data values were normalized based on an average crop yield of 3364 kg ha−1 [SD 86.8 kg ha−1] for organic systems and 3400 kg ha−1 [SD 31.2 kg ha−1] for conventional systems.
A conventional cotton system in the region refers to a method of growing cotton that follows traditional or mainstream agricultural practices, typically characterized by the use of chemical inputs, and respective management (e.g., narrow crop rotations or monocropping). Chemical inputs include the use of synthetic fertilizers, herbicides, and pesticides, including for example seed coating with fungicides to protect against fungal infestations. Ammonium nitrate and single superphosphate are commonly used as nutrient sources, in addition to farmyard manure. Currently, genetically modified cotton varieties that are engineered to resist certain pests or tolerate specific herbicides are not commercially used in Egypt.
An organic cotton system refers to a method of cotton cultivation that adheres to organic farming principles and practices [34]. Organic cotton is typically grown from non-genetically modified seeds without the use of synthetic pesticides, herbicides, or fertilizers. In organic farming, the most commonly used organic fertilizers are compost, animal manure, and bio-fertilizers (bacterial and/or fungal inoculants applied to plants, seeds, or soil to increase nutrient availability and utilization by plants).
In Egypt, irrigation, weed and pest control, and fertilization are commonly applied in both systems. Similar land preparation methods are used, where the land is prepared by plowing and leveling before planting to create a suitable seedbed for cotton. Planting in rows is a common practice to optimize water management procedures. The cotton season is six months long, with seeds sown from mid-April to mid-May, depending on the region, and harvested from September to October. Regardless of the cultivation method, cotton in Egypt is often irrigated due to the arid climate. Irrigation is carried out using surface irrigation systems, and diesel-based pumps are used to supply water from river canals to cotton fields. Cotton is typically harvested manually in Egypt.

2.2.1. On-Farm (Foreground) Emissions

On-farm modeled emissions (Table 1) include the emissions from fuel combustion in tractor engines and irrigation pumps and the application and decomposition of fertilizers in the soil. The fuel emissions were estimated based on coefficients for the combustion of each MJ of diesel fuel [35]. In addition, the emissions from fertilizer use were modeled according to the methodologies outlined by the Intergovernmental Panel on Climate Change (IPCC, 2006), and emission factors retrieved from the CarbonCloud agricultural model [36]. The model includes emissions of nitrate (NO3) in water and nitrous oxide (N2O), nitrogen oxide (NOx), and ammonia (NH3) into the air. The direct N2O emissions were calculated as 1% of all available nitrogen (0.01 kg N2O-N kg N−1), including nitrogen applied with chemical and organic fertilizers. The indirect N2O from atmospheric deposition (0.01 kg N2O-N/kg NH3-N), leaching/runoff (0.011 kg N2O-N/kg NO3-N), nitrate–nitrogen leaching loss (0.24 kg NO3-N/kg N), ammonia volatilization (0.11 kg NH3-N/kgN), and nitrous oxide (0.21 kg NOx/kg N2O). As there was a lack of data regarding biofertilizer on-field emissions, we extrapolated nitrogen-based emission patterns similar to those observed with chemical fertilizers, as detailed earlier. Besides nitrogen-based emissions to water and air, phosphorus emissions are taken into consideration in the model using the guidelines of Nemecek et al. [35].

2.2.2. Off-Farm (Background) Emissions

The Ecoinvent 3.1 database [37] was used to calculate background emissions with process names as presented in Table 1. This database offers average market data for a wide range of existing materials, energy supply processes, and services.

2.3. Life Cycle Impact Assessment (LCIA)

The objective of life cycle impact assessment (LCIA) is to comprehend and quantify the scale and importance of potential environmental impacts. In this phase, the environmental impacts of cotton cropping systems were evaluated using the ReCiPe 2016 method [33]. ReCiPe 2016 includes two sets of impact categories with specific characterization factors. At the midpoint level, we addressed eighteen impact categories: global warming, stratospheric ozone depletion, ionizing radiation, ozone formation (human health), fine particulate matter formation, ozone formation (terrestrial ecosystems), terrestrial acidification, freshwater eutrophication, marine eutrophication, terrestrial ecotoxicity, freshwater ecotoxicity, marine ecotoxicity, human carcinogenic toxicity, human non-carcinogenic toxicity, land use, mineral resource scarcity, fossil resource scarcity, and water consumption. At the endpoint level, these midpoint categories were aggregated into three endpoint categories: damage to human health, damage to ecosystem quality, and damage to resource availability. These endpoint impacts were then combined into a single score to highlight key hotspots and overall environmental sustainability. Panel weighting (human health 400, ecosystem quality 400, and resources 200) was applied to generate a single LCA score. To enhance precision and reliability, we combined country-specific (spatial) and globally aggregated (generic) characterization factors, as recommended for accurate LCA outcomes [38]. LCIA was performed using the LCA software OpenLCA 2.0.4 [39].

2.4. Energy Analysis and Performance Indices

The energy equivalent of inputs and outputs was determined by multiplying the amount of each input by the related energy coefficient (Table 2).
The energy was categorized into direct, indirect, renewable, and non-renewable sources. Direct energies included human labor, diesel fuel, oil, and water for irrigation. Indirect energy consisted of seed, chemical and organic fertilizers, plant protection products, and agricultural machinery. The energy from human labor, seeds, organic fertilizers, and irrigation water was considered renewable energy. Diesel fuel energy, plant protection products, chemical fertilizers, and machinery were considered non-renewable energies. In both cultivation systems, the energy equivalent of cotton seed yield stood at 11.8 MJ kg−1, a widely employed value in energy-related investigations of cotton farming [14,15,16,17,18,20,43,44], irrespective of the cultivation method. This allows for valuable comparisons among diverse research findings, contributing to a more comprehensive understanding of how Egyptian cotton cultivation is positioned in terms of energy performance. A series of energy parameters was evaluated by the energy ratio between output and input. The energy use efficiency (EUE), energy productivity (EP), specific energy (SE), net energy gain (NEG), and energy profitability were calculated using the following formulas [40]:
The ratio of input–output energy (Equation (1)), or energy use efficiency, is an indicator that determines the agricultural system’s energy. An increase in the ratio indicates an improvement in energy efficiency.
E n e r g y   u s e   e f f i c i e n c y = T o t a l   e n e r g y   o u t p u t   ( M J   h a 1 ) T o t a l   e n e r g y   i n p u t   ( M J   h a 1 )
Energy productivity (Equation (2)) is an indicator of the amount of physical output that is derived from each unit of energy consumed. In other words, how much product is produced per unit of input energy. An increase in the indicator denotes high EP and vice versa.
E n e r g y   p r o d u c t i v i t y   ( k g   M J 1 ) = C r o p   o u t p u t   ( k g   h a 1 ) T o t a l   e n e r g y   i n p u t   ( M J   h a 1 )
Specific energy (Equation (3)) is the inverse of energy productivity and defines the amount of energy used to produce a product unit. An increase in the indicator denotes lower energy efficiency and vice versa.
S p e c i f i c   e n e r g y   ( M J   k g 1 ) = E n e r g y   i n p u t   ( M J   h a 1 ) C r o p   o u t p u t   ( k g   h a 1 )
Net Energy Gain (Equation (4)) is a concept used in energy economics that refers to the difference between the energy expended to harvest an energy source and the amount of energy gained from that harvest. It is the difference between the energy value of the output and the total energy in producing that output. A higher net indicates more energy gain (more profitable), and vice versa.
N e t   e n e r g y   g a i n   M J   h a 1 = T o t a l   e n e r g y   o u t p u t   M J   h a 1 T o t a l   e n e r g y   i n p u t   M J   h a 1
The energy profitability of cotton cultivation can be calculated as the ratio of net energy gain to total energy input, expressed as:
E n e r g y   p r o f i t a b i l i t y = N e t   e n e r g y   g a i n   ( M J   h a 1 ) T o t a l   e n e r g y   i n p u t   ( M J   h a 1 )
The energy profitability indicates the efficiency of energy utilization in cotton cultivation. A higher value suggests better energy management practices and more efficient use of resources.

3. Results

The results of the modeling were analyzed using energy balance and performance indices, as well as environmental impacts at the midpoint, endpoint, and single score levels. A thorough examination of hotspots was conducted based on the outcomes of the energy analysis and LCIA.

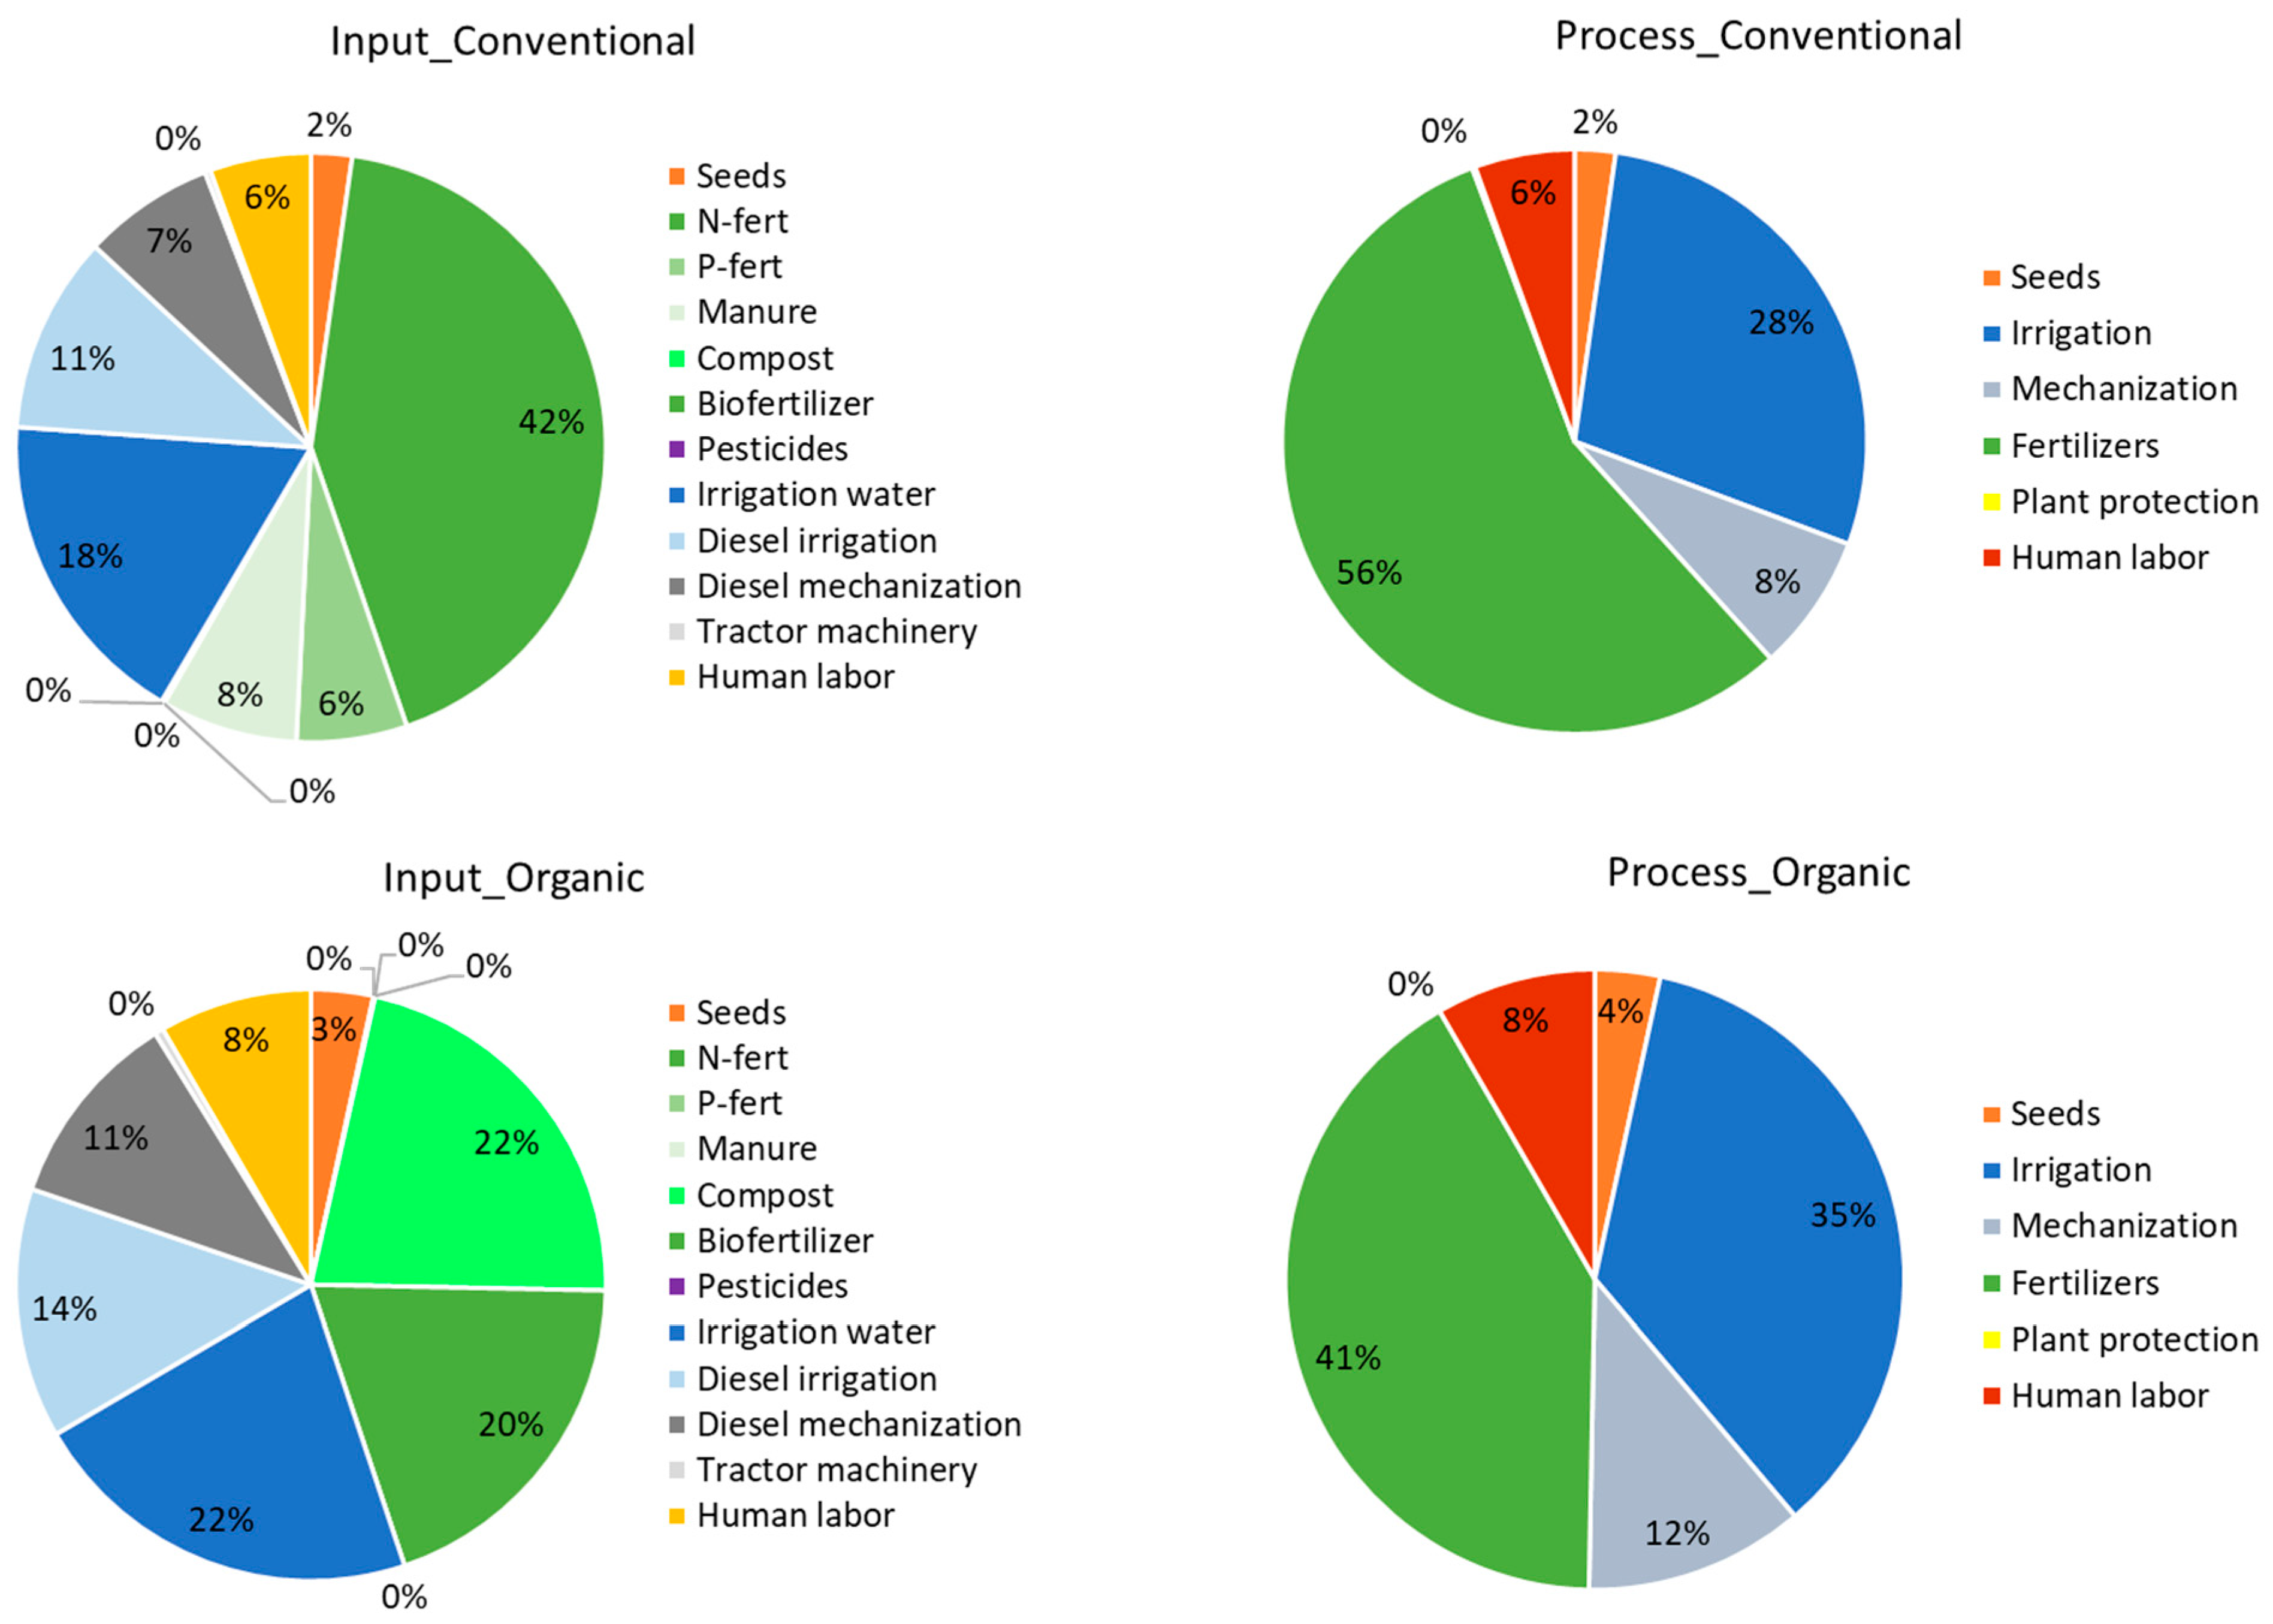
3.1. Energy Balance Performance Indicators

The energy balance and performance indices of both conventional and organic cotton are presented in Table 3. For the conventional system, total input and output energies were 37,472 MJ ha−1 and 40,120 MJ ha−1, respectively, resulting in a net energy gain of 2648 MJ ha−1. Energy efficiency, productivity, intensity, and profitability were calculated at 1.07, 0.091 kg MJ ha−1, 11.02 MJ kg−1, and 0.071, respectively.
In comparison, the organic system exhibited total input and output energies of 24,763 MJ ha−1 and 39,699 MJ ha−1, yielding a net energy gain of 14,936 MJ ha−1. Energy efficiency, productivity, intensity, and profitability were estimated at 1.6, 0.136 kg MJ−1, 7.36 MJ kg−1, and 0.603, respectively.
The categorized energy inputs into direct and indirect sources, as well as renewable and non-renewable categories, are shown in Figure 3. In the conventional system, 41% of energy came from direct sources, with 59% from indirect sources. In contrast, the organic system relied on 56% direct and 46% indirect energy sources. Additionally, the conventional system was more dependent on non-renewable energy sources (67%), whereas the organic system favored renewable sources (74%).
Figure 4 presents the contribution analysis of inputs and processes to the energy footprint of organic and conventional seed cotton production. The main factors contributing to the total energy consumption in conventional seed cotton production were fertilizers (56%), irrigation (28%), mechanization (8%), and human labor (6%). Synthetic nitrogen fertilizers, specifically ammonium nitrate, constituted 42% of the total energy input, with farm manure contributing 8% and phosphorus fertilizers 6%. Irrigation water accounted for 18% of the total energy input, whereas irrigation diesel energy accounted for 11%.
In organic seed cotton production, a similar trend is observed (see Figure 4). The primary contributors to the energy footprint are fertilizers (41%), irrigation (35%), mechanization (12%), and human labor (8%). Compost and bio-fertilizers contribute 22% and 20%, respectively, to the total energy input. Additionally, energy from irrigation water constitutes 22% of the total energy input, while energy from irrigation diesel accounts for 14%.
We compared our energy balance results with international literature (Table 4), which highlights the variability in energy inputs across different geographic locations and farming practices. In our study, the total energy input of cotton cultivation ranged from 24,763 to 37,472 MJ ha−1. Comparing these values with those reported in the literature, we find that our results are in line with the lower values of 23,960 MJ ha−1 in India [18], 31,860.6 to 36,189.03 MJ ha−1 in Iran [17], and 34,424.19 MJ ha−1 in Iran [16]. However, they are lower compared to the energy inputs of 49,736.9 MJ ha−1 in Türkiye [13], 54,617.62 MJ ha−1 in Türkiye [14], and 58,374.07 MJ ha−1 in Pakistan [19]. Significantly higher energy inputs were observed in central Greece [12], reaching 82,600 MJ ha−1, and in Turkish cotton cultivation (mix of different regions) [15], totaling 83,869.49 MJ ha−1. The results show that the energy input in Egypt is 24.6% to 70.6% lower than the energy inputs reported in other regions, including Türkiye, Pakistan, and central Greece cotton cultivation across different regions.
In this study, the energy use efficiency (EUE) varied between 1.07 and 1.6. This range is consistent with findings from earlier research, where EUE values were reported to range from 0.7 in Pakistan [18] to 3.1 in India [18]. Notably, in central Greece [12], the efficiency was determined to be 0.19 while in India values reached up to 7.79 [45].
The specific energy for cotton cultivation was assessed in the range of 7.36 to 11.02 MJ kg−1, aligning with the range of values reported in the literature, which spans from 4.77 MJ kg−1 in China [46] to 20.28 MJ kg−1 [18].
The energy productivity of Egyptian cotton was assessed to be in the range of 0.091 to 0.136, consistent with reported values that vary from 0.04 [18] to 0.21 kg MJ−1 [14,46]. These differences in energy balance indicators in cotton cultivation could be ascribed to region-specific cotton productivity levels and resource use efficiency.
Table 4. Comparative analysis of energy balance and performance indicators for cotton production across countries.
AuthorYearCountryEnergy Input
(MJ ha−1)
EUEEP (kg MJ−1)SE (MJ kg−1)Direct/IndirectRenewable/Non-RenewablePrimary Hotspot *Secondary Hotspot *
Tsatsarelis [12]1991Greece82,6000.190.01280.64--EFI
(44%)
F
(23.5%)
Yilmaz et al. [13]2005Türkiye49,736.90.740.0615.9742.5%/57.5%)12.6%/87.4%DF
(31.1%)
F
(28.8%)
Dagistan et al. [43]2009Türkiye19,5582.360.24.9928.87%/71.13%12.3%/87.7%CF
(45.31%)
IW
(22.37%)
Khan et al. [46]2009China34,322.401.510.214.7811%/89%12.3%/87.7%CF
(75.6%)
HL
(11%)
Zahedi et al. [44]2014Iran52,507.80.70.119.268.3%/31.7%22.3%/77.7%DF
(47.4%)
F
(19.8%)
Sami and Reyhani [16]2018Iran34,4241.210.19.829.8%/70.2%10.8%/89.2%CF
(44.7%)
DF
(18.4%)
Kazemi et al. [17]2018Iran31,860.6–36,189.030.942–1.1060.079–0.093710.67–12.5368.08%/31.92%6.89%/93.11%DF
(39%)
IW
(20.41%)
Imran et al. [19]2020Pakistan58,374.070.700.0420.2861.23%/38.77%34.7%/65.3%CF
(22.43%)
IW
(20.85%)
Baran et al. [14]2021Türkiye54, 617.621.210.219.7767.43%/32.57%7.62%/92.38%EFI
(34.06%)
CF (27.93%)
Singh et al. [18]2022India23,9603.10.08313.049.6%/50.4%25%/75%CF
(44.3%)
IW
(17.8%)
Abbas [20]2022Pakistan30,744.991.530.137.6955.66%/44.34%21.05%/78.95%CF
(37%)
DF
(36%)
Aytop [15]2023Türkiye83,869.490.870.0717.3148.01%/51.99%89.96%/10.04%MCH (28.69%)EFI (22.79%)
Ranguwal et al. [45]2023India23,022.717.79n.a.10.2368%/32%4%/96%DF
(>60%)
CF (<25%)
* EFI—electricity for irrigation; F—fertilizers; CF—chemical fertilizers; IW—Irrigation water; DF—Diesel fuel; MCH—Machinery.
The literature on energy forms yields varying results. Some studies [14,17,18,20] found that the ratio of direct energy was higher than the ratio of indirect energy. All the studies examining the energy footprint of cotton production included in this paper indicate that the proportion of non-renewable energy exceeds that of renewable energy. The dominant share of indirect and non-renewable energies highlights a significant reliance on finite resources, prompting considerations for sustainable resource management.
In the literature, the predominant contributors to energy consumption in cotton production are fertilizers, diesel fuel, irrigation water, and pumping energy. Synthetic fertilizers were identified as the primary energy input by Dagistan [43], Khan et al. [2], Sami and Reyhani [16], Imran et al. [18], and Abbas et al. [20]. Diesel fuel was reported as the main contributor in studies by Yilmaz et al. [13], Zahedi et al. [44], and Kazemi et al. [17]. In contrast, the primary energy source in the studies conducted by Tsatsarelis [12] in Greece and Baran et al. [14] in Türkiye was electricity used for pumping irrigation water. Differences in energy patterns observed in cotton cultivation across various agroecological regions are linked to distinct climatic conditions, cultivar types, and management practices that affect resource inputs. In summary, the energy analysis indicates that the energy performance of Egyptian cotton cultivation is consistent with global trends.

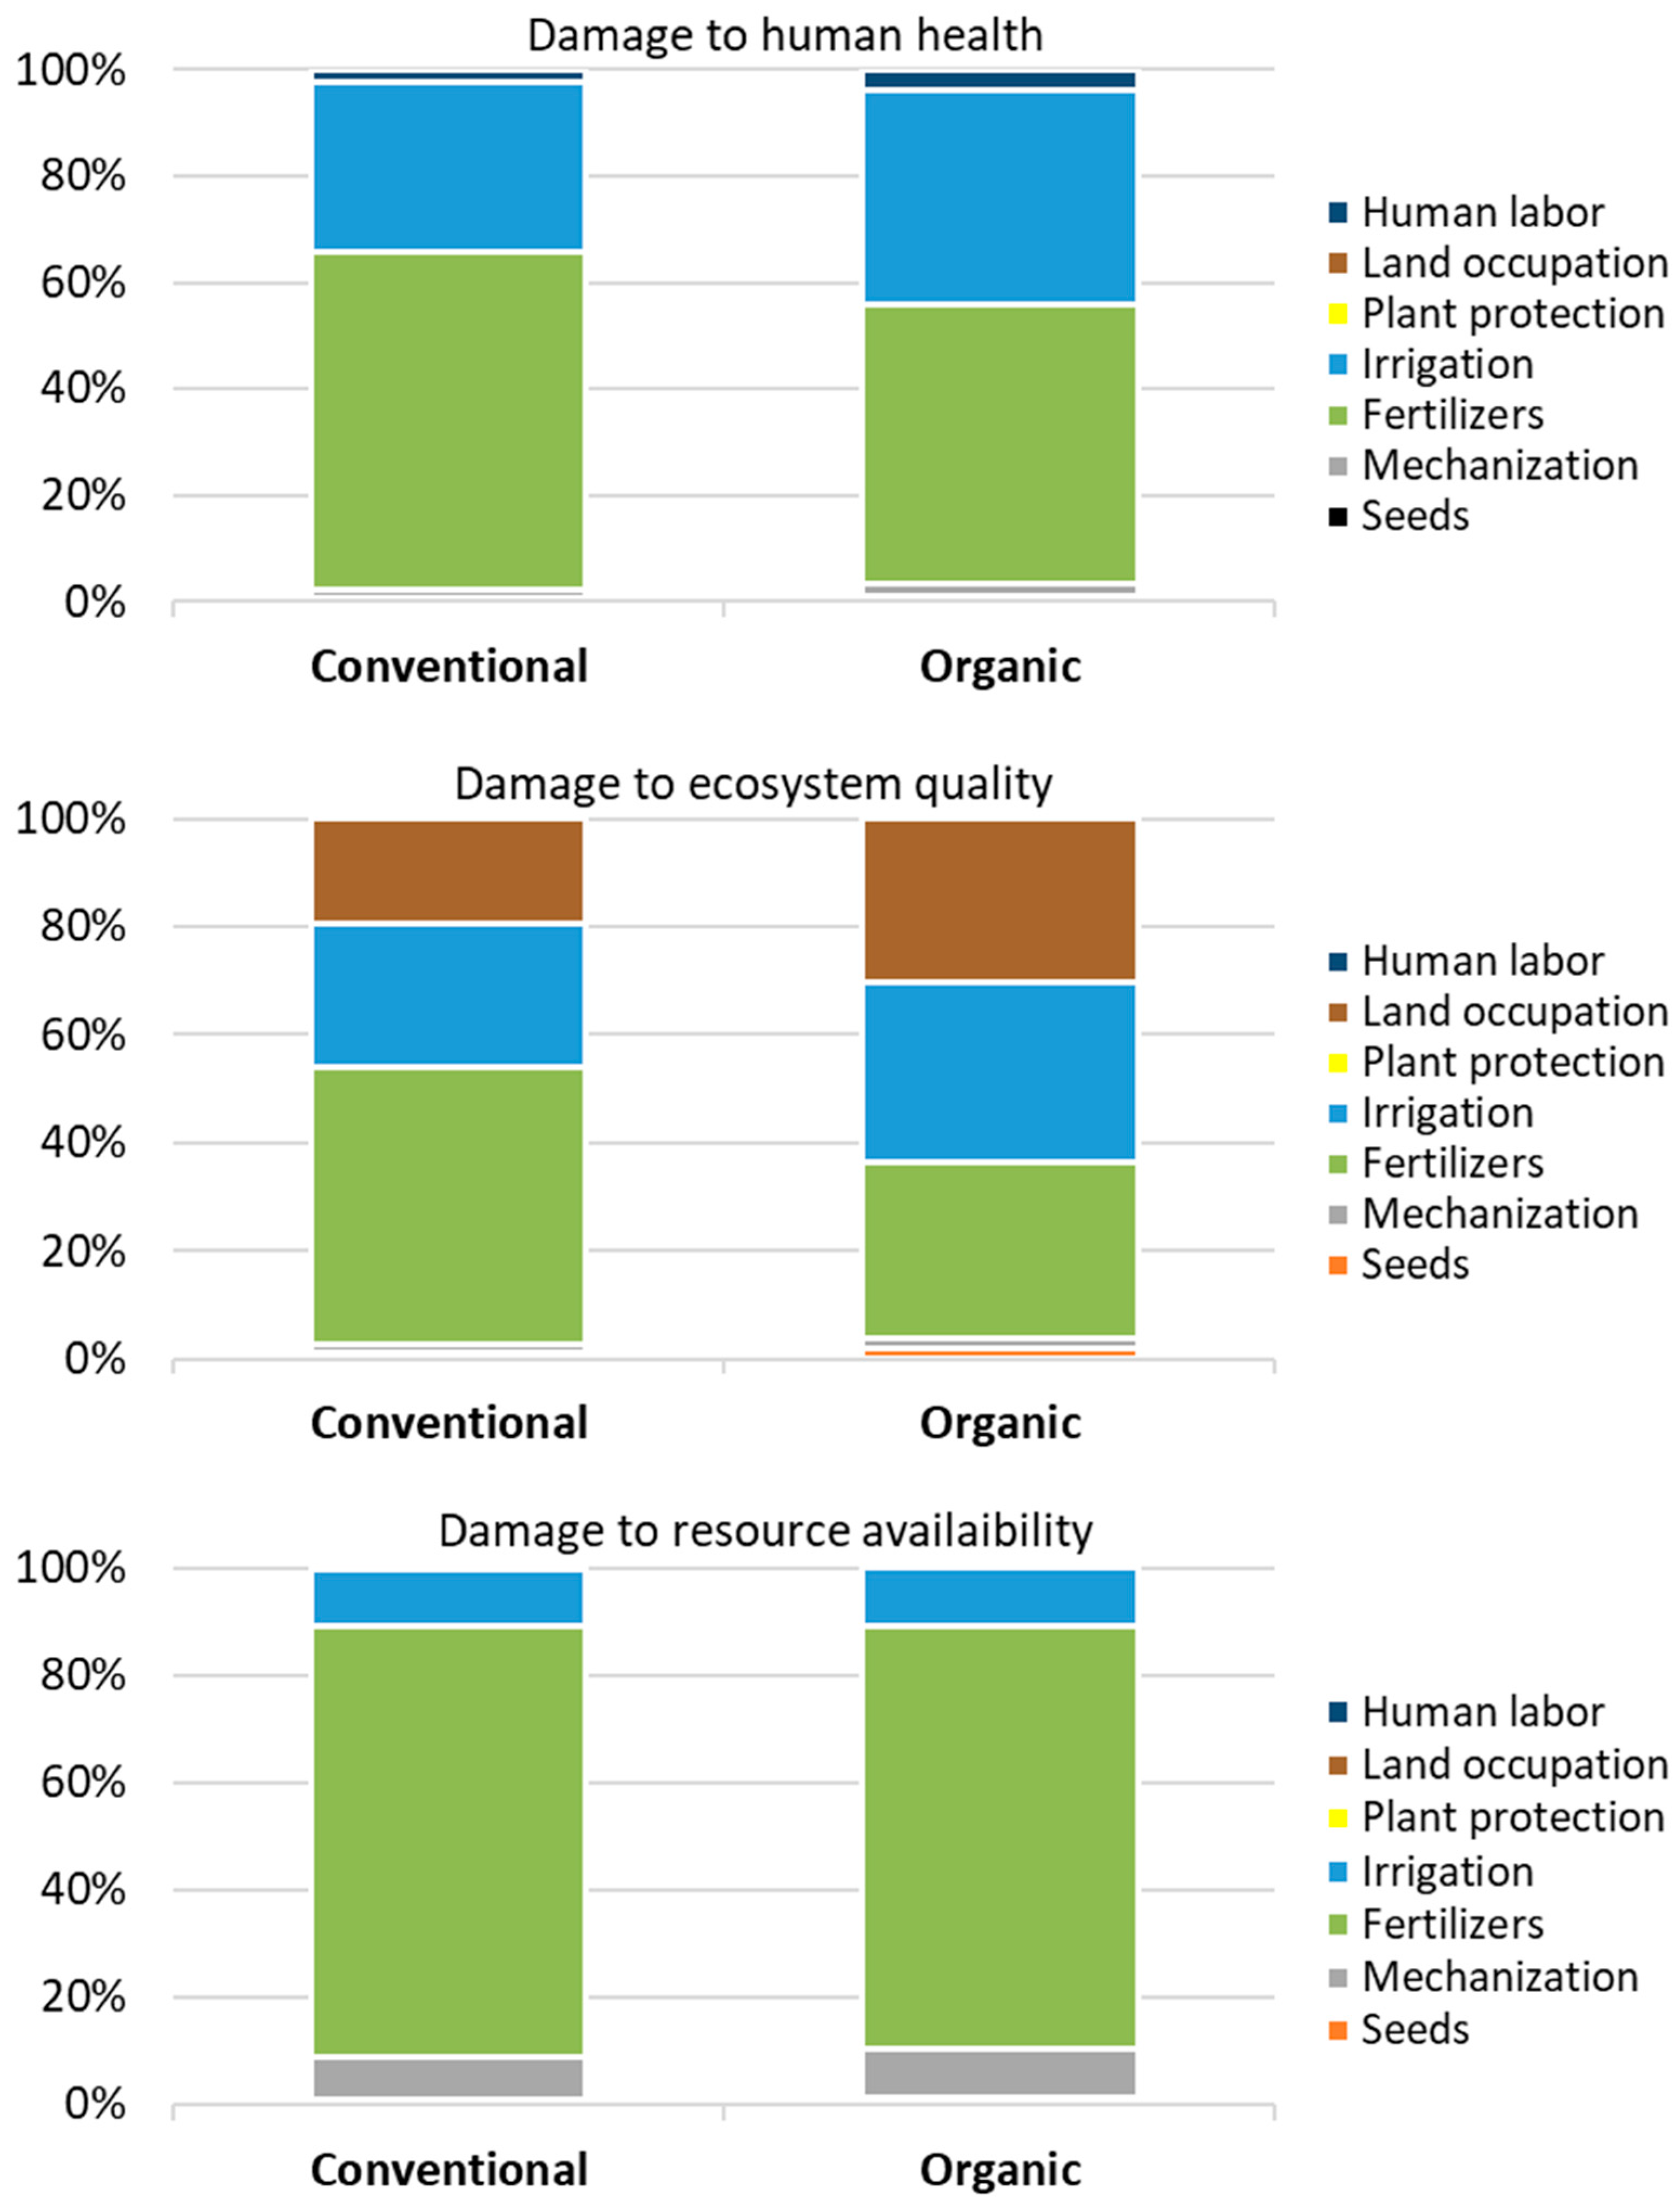
3.2. Midpoint and Endpoint Environmental Impacts

Table 5 illustrates the cradle-to-farm gate impacts of cotton cultivation in Egypt, as assessed through a Life Cycle Assessment (LCA), for both 1 ton of seed cotton and 1 hectare of land. When considering area-based functional units (FUs), organic systems consistently outperform conventional ones in all assessed impacts.
The production of 1 ton of conventional seed cotton, delivered at the farm gate, contributes to a global warming potential (GWP) of 2622.6 kg CO2-eq and requires 2171.8 m3 of water. On a per-hectare basis, this equates to 8916.6 kg CO2-eq and 7384.2 m3 of water. In contrast, the production of 1 ton of organic seed cotton results in a GWP of 2273.9 kg CO2-eq and a water requirement of 1786.4 m3. Per hectare, this is equal to 4486.1 kg CO2-eq and 6010.1 m3 of water, reflecting a 14% reduction in greenhouse gas emissions and a 19% decrease in water usage compared with conventional farming. Other studies [26,27,47] report similar findings, suggesting that organic cotton farming is more climate-friendly than conventional approaches. In Madhya Pradesh, India [47], Maharashtra, India [27], and Mali [26], organic cotton reduced GHG emissions by 55.2% (594.1 vs. 1328 kg CO2-eq ha−1), 68.8% (456 vs. 1462 kg CO2-eq ha−1), and 16% (1844 to 2194 kg CO2-eq ha−1), respectively. Gonzalez et al. [29] estimated a 190% reduction in global warming potential (GWP) when comparing organic seed cotton to conventional cotton (0.46 vs. 1.35 kg CO2-eq kg−1). These reductions highlight the significant potential of organic farming practices for reduced farm greenhouse gas emission intensity. The comparative analysis of conventional and organic seed cotton production reveals significant differences in environmental impacts, particularly concerning greenhouse gas emissions and water usage. The production of conventional cotton results in a higher global warming potential (GWP) and greater water consumption compared to organic cotton. In other studies, the range of published GWP is 1928 kg CO2-eq ha−1 for conventional cotton in South Punjab of Pakistan [19], 6168 to 6836 kg CO2-eq ha−1 for conventional cotton in Southern Punjab of Pakistan [24], 6432.86 kg CO2-eq ha−1 for conventional cotton in Türkiye [14], and 2958.56 to 6220.13 kg CO2-eq ha−1 for conventional cotton in different regions of China [21].
When comparing the LCA results of conventional cotton with those of Gonzalez et al. [29], our study generally reports higher impacts for fine particulate matter formation, global warming, human carcinogenic toxicity, water consumption, fossil resource scarcity, terrestrial ecotoxicity, terrestrial acidification, and ozone formation (human health). Conversely, Gonzalez’s study reports higher impacts for freshwater ecotoxicity, human non-carcinogenic toxicity, land use, marine eutrophication, freshwater eutrophication, and ionizing radiation.
While organic cultivation is often argued to produce positive environmental impacts per unit of area compared with conventional methods, evidence from other LCA studies suggests that this advantage may not always extend to a per-product unit basis. Specifically, organic cotton cultivation has been shown to have lower impacts in categories such as global warming potential, fossil resource scarcity, human and terrestrial ecotoxicity, and water consumption when assessed on a per-product basis. Organic cultivation often requires more land to produce an equivalent quantity of products [29,48]. It can have also higher marine and freshwater eutrophication as well as mineral resource scarcity and ozone formation [29]. Despite slightly lower yields, our findings suggest that – in the local context—organic seed cotton systems demonstrate superior environmental performance per ton of product compared to conventional systems, with comparable yields (3364 vs. 3400 kg ha−1). These findings align with other studies on cotton production [22,27,47], reflecting a trend where organic cotton farming tends to have a lower environmental impact per unit of product. However, this suggests that while land-use efficiency is an important consideration, the overall environmental performance of cotton production systems should be evaluated holistically across multiple impact categories to determine the most sustainable approach. It is crucial to consider the trade-offs between different environmental impacts and resource requirements to make informed decisions about the sustainability of cotton production methods
Figure 5 illustrates the percentages of various contributions to each impact category. Fertilization emerges as the primary contributor in most impact categories at the midpoint level. This finding aligns with the results of the review by Boschiero et al. [22], who found that fertilization is a major contributor to impacts in conventional systems and also plays a significant role in organic systems, alongside machinery and field operations. Irrigation water consumption accounts for more than 40% of the total water consumption potential (WCP). Additionally, because field operations are largely motorized, diesel combustion contributes to ozone formation, a pattern also observed in organic farming. These findings highlight the importance of these factors in shaping the environmental footprint of different cultivation systems.
The endpoint analysis corroborates the results observed in the midpoint analysis, showing that organic cotton outperforms conventional cotton on both a per-hectare and per-ton-of-product basis (Table 6). Specifically, in the human health damage category, the values were 0.0122 DALY per ton for conventional cotton and 0.0088 DALY per ton for organic cotton. Ecosystem damage was recorded as 4.98 × 10⁻⁵ species.yr per ton for conventional cotton and 3.66 × 10⁻⁵ species.yr per ton for organic cotton. Damage to resource scarcity was calculated as 104.6 USD2013 per ton for conventional cotton and 88.33 USD2013 per ton for organic cotton. Compared to organic cultivation, conventional cultivation exhibited 28% higher damage to human health, 26% higher damage to ecosystem quality, and 18% higher damage to resource scarcity.
In contrast to the midpoint analysis, the contribution analysis of endpoint environmental impacts underscores the substantial influence of irrigation on endpoint impacts (Figure 6). This suggests that, particularly in Egypt, integrating both midpoint and endpoint LCA indicators is essential for a comprehensive interpretation of results. In conventional cotton cultivation, irrigation, primarily through the use of irrigation water, accounts for 32% of the impact on human health, 26% on ecosystem quality, and 11% on resource availability. The role of irrigation is even more significant in organic cotton cultivation, primarily due to the reliance on organic fertilizers and biofertilizers. In organic cotton, irrigation results in a 41% impact on human health, a 33% impact on ecosystem quality, and an 11% impact on resource availability. Additionally, land occupation impacts ecosystem quality by 24%, with a similar contribution pattern observed in conventional farming. Egypt, with its high water stress index (the ratio of freshwater withdrawals to hydrological availability in the watershed), faces challenges related to irrigation. The use of water for irrigation reduces freshwater availability, making it less accessible for human or ecosystem use. This reduction in freshwater availability triggers competition among various water uses, leading to decreased vegetation, reduced biodiversity, and ultimately, diminished ecosystem quality.

3.3. Total Environmental Impact—Single Score Analysis

Figure 7 illustrates the outcomes of the analysis based on a single score at various levels of detail.
The cumulative environmental impact for each ton of conventionally cultivated cotton was determined to be 233.3 points. Considering an average productivity of 3.4 tons per hectare, the assessed impact per hectare of land is 793.22 points. In comparison, the comprehensive environmental impact for organically cultivated cotton was calculated at 168.3 points per ton or 567.33 points per hectare. The weighted environmental footprint analysis consistently shows that organic systems outperform conventional ones, regardless of the chosen functional unit (mass- or land-based). Fertilization and irrigation emerge as the key contributors to environmental impacts in both cotton cropping systems (Figure 7A). Both systems are affected by fertilizer emissions occurring in the field and by diesel fuel consumed for irrigation. The environmental sustainability of the conventional system primarily relies on synthetic nitrogen-based fertilizers, whereas the sustainability of organic cultivation is significantly associated with the use of organic fertilizers (compost) and bio-fertilizers. The importance of irrigation becomes more pronounced in organic farming, especially considering the reliance on these fertilizers within the system.
The analysis at the sub-system level (Figure 7B) shows that 52% of the total environmental impacts in conventional cotton are due to on-farm activities. In contrast, 58% of the total environmental impacts in organic cotton cultivation are attributed to on-farm activities, with the remainder resulting from off-farm (background) activities. The impact at the sub-system level is primarily due to the consumption of diesel fuel and its associated emissions. At the indicator level, water consumption, global warming, and fine particulate matter formation were identified as the most significant footprint indicators (Figure 7C).

4. Discussion

Agriculture’s impacts on the environment are substantial [49]. Organic and conventional farming represent two distinct approaches to agricultural production, each with its own set of practices, principles, and impacts. Conventional agricultural systems typically produce high yields but incur considerable environmental costs, whereas organic agriculture faces criticism for its lower yields, raising doubts about its benefits for sustainable farming [22]. Before promoting one production system over another or finding an optimal combination of conventional and organic farming practices, it is essential to thoroughly examine the energy and environmental benefits and potential trade-offs associated with each, in addition to other sustainability dimensions. Emphasizing the incorporation of life cycle thinking into the decision-making process is vital for making informed choices.
The hypothesis of this study posited that organic cotton farming would demonstrate a smaller environmental footprint and higher energy efficiency compared to conventional methods. This was evaluated through a cradle-to-farm gate analysis comparing both systems in Egypt. The results confirm the hypothesis: organic seed cotton production shows greater energy efficiency and productivity, with a higher net energy gain and reliance on renewable energy sources. Environmentally, organic systems outperform conventional ones across various impacts when assessed using area-based functional units. Even when considering per-product unit impacts, organic farming exhibits lower input intensity and comparable yields (3364 vs. 3400 kg ha−1), reinforcing the notion that organic practices generally present a more sustainable option with reduced environmental impacts per unit area and product. This supports the hypothesis that organic cotton cultivation is more sustainable in terms of environmental performance compared to conventional farming in the local context.
In addition, the existing literature presents a strong case for the environmental and energy efficiency benefits of organic cotton farming compared to conventional methods, both in Egypt and globally. Research by PE International [50] found that organically cultivated cotton can lead to reductions in environmental impacts ranging from 46% to 91%. Fidan et al. [51] demonstrated that all environmental impacts associated with denim fabric decrease when using organic cotton. A comparative LCA conducted in India by Shah et al. [27] highlighted the significant advantages of organic cotton farming across various environmental impact categories. Similarly, a study by Avadí et al. [26] in Mali, found that conventional cotton farming generally resulted in greater environmental impacts than organic practices. In Egypt, research indicated that while organic agriculture may have slightly higher direct production costs, it contributes to a reduction in environmental damage costs [10]. A systematic review of pairwise comparative LCA of organic and conventional crops by Boschiero et.al. [22] confirmed that, as a general trend, organic systems tend to exhibit lower environmental impacts. However, studies [22,29,52] have also identified potential environmental trade-offs per unit of product associated with organic farming practices, although there is ongoing discussion about LCA methodology insufficiently representing agroecological systems [10].
The assessment in this study normalized data based on average crop yields for both organic and conventional farming systems, revealing that these yields were relatively similar. However, it is crucial to acknowledge that yield variations between these systems can be significant, influenced by factors such as soil health, climate, and management practices. Various studies have examined these yield differences. For example, Bilasis et al. [53] found no significant differences in cotton growth, yield, and fiber quality between organic and conventional systems. Singh et al. [27] collected data from 100 farms each of conventional, organic, and an intermediate system in Madhya Pradesh, India, reporting average yields of 1938 kg ha−1 for conventional, 1888 kg ha−1 for organic, and 1755 kg ha−1 for the intermediate system (“better cotton”). Bachmann [54] reported approximately 10% lower yields in organic smallholder farming in Central Asia compared to conventional methods. Nevertheless, organic farmers reported greater overall profitability and satisfaction despite this yield disparity. A long-term trial by the Research Institute of Organic Agriculture (FiBL) indicated about a 20% yield difference between organic and conventional cotton, although this difference was less pronounced in some years [27]. In west Nimar, India, Riar et al. [55] found that conventional cotton yields were 23% higher than organic (mean: 1770 kg ha−1 vs. 1370 kg ha−1). Additionally, a 6-year comparison in California’s northern San Joaquin Valley showed that organic cotton yielded 34% less than conventional cotton (6.7 t ha−1 vs. 4.4 t ha−1). Overall, while some studies report comparable yields between organic and conventional systems, others indicate that conventional farming often yields higher under certain conditions.
The uncertainty in data linked to yields and other crucial metrics underwent propagation through a sensitivity analysis (refer to Table 7), utilizing a one-at-a-time approach (OAT). This method aimed to evaluate the influence of yield variations on the outcomes and to compare conventional and organic products. Even when yields were increased by up to 50%, the environmental impacts generally remained larger for conventional cotton compared to organic cotton. This validates that the advantages of organic cotton in our study are associated with reduced input intensity concerning fertilization, irrigation water, and related energy. Conversely, it underscores that the critical aspect pertains to data input and background emissions considered. In LCA, uncertainty stems from data variability, methodological choices, and impact assessment methodologies, alongside subjective decisions and assumptions about system boundaries, functional units, emission time horizons, stakeholder interpretation, and human behavior, all directly affecting results [56]. While organic fertilizers are typically assumed to have no burden on the system, our assessment considered background emissions from their production and transportation using common generic processes in EcoInvent. Moreover, we considered on-field emissions to have similar nitrogen-based emission flows. The fraction of added N emitted as N2O from bio-fertilizers is found to be significantly less than the IPCC default value of 2% [57] Organic farming relies on organic fertilization, which is generally less energy-intensive than synthetic nitrogen fertilizers. The production of liquid fertilizers from organic waste materials seems reasonable and is an alternative to mineral–solid fertilizers, whose production process is energy-intensive and produces air emissions [58]. Similarly, the use of biofertilizers has currently emerged as a cost-effective and eco-friendly alternative to chemical-based fertilizers [59]. A comparative LCA by Alengebawy et al. [60] of four biofertilizer production scenarios (pellets, biocompost, liquid biofertilizers, and powder biofertilizer) demonstrated environmental gains compared to synthetic fertilizers, and the top three emission reduction categories were marine aquatic ecotoxicity, global warming, and human toxicity.
While our findings align with prior research and reflect the realities of Egyptian agriculture, caution is needed when extrapolating the results to other regions. Egypt’s diverse agroecological conditions lead to significant variations in farming methods, highlighting the need for similar analyses in different areas to fully understand the implications of differing farming practices. Advocating for a nuanced, context-specific approach is important, but further large-scale research is necessary to validate these results and provide a comprehensive view of the environmental impacts of organic and conventional farming practices in cotton cultivation. From a global standpoint, the implications of this study extend beyond Egypt to the broader discourse on sustainable agriculture. The evidence highlights organic cultivation as a promising method for sustainable cotton production, offering benefits such as reduced energy intensity, higher efficiency, and a lower environmental burden. These findings contribute to the ongoing discourse on agricultural sustainability and underscore the importance of optimizing fertilization and irrigation methods. Future research should focus on validating these findings across diverse geographical regions and agricultural contexts. Comparative studies could offer a more comprehensive understanding of the environmental impacts of organic and conventional farming on a larger scale. Additionally, exploring the socio-economic benefits (e.g., price premiums, improved market access, financial stability) or trade-offs of innovative farming practices and technologies could provide insights into balancing sustainability with economic viability. Furthermore, when aiming for a holistic and systemic approach, it is vital to investigate social (e.g., community well-being, empowerment, fair trade, gender equality) as well as human health impacts (e.g., exposure to chemicals, food safety, improved nutrition) in the local context.

5. Conclusions

The study evaluated the energy and environmental impact of irrigated cotton cropping systems on selected farms in the Beheira governorate in Egypt using energy analysis and LCA methodology, identifying key inputs, processes, and co-benefits and drawbacks. The energy analysis suggests that organic cotton farming can lead to higher energy profitability due to lower energy intensity and better net energy gain, which could translate into increased income for local farmers, especially as global demand for sustainable products rises. The LCA analysis corroborates these findings, revealing that organic cotton production systems exhibit lower environmental impacts across various functional units, including mass- or area-based metrics. These benefits encompass reduced greenhouse gas emissions, ecotoxicity, water usage, and improvements in human health, ecosystem integrity, and overall environmental sustainability. Contrary to common beliefs, our study, along with other literature, demonstrates that the environmental advantages of organic cotton cultivation extend not only per unit of area but also per unit of product. This emphasizes the overall sustainability of organic cotton farming, even when accounting for data uncertainty and potential yield differences. The benefits of organic farming are attributed to the use of organic fertilizers, bio-fertilizers, and lower input intensity. The findings indicate that organic cotton farming requires less synthetic input, which can lower costs for farmers by reducing their dependence on expensive synthetic fertilizers and pesticides. Over the long term, organic farming practices can enhance soil health, leading to better crop yields and resilience against pests and diseases while contributing to a reduced environmental footprint of cotton production, which can positively impact local ecosystems and community health. As consumers become more environmentally conscious, organic cotton may command higher prices in both local and international markets, allowing farmers to benefit from marketing their products as sustainable and potentially accessing premium markets.
Research limitations of this study include reliance on data from specific farms, which may not be representative, and constraints in the methodologies used, which might overlook some environmental and social aspects. The choice of functional units and potential temporal variations in impacts were not fully addressed. Additionally, the economic implications of transitioning to organic farming, including conversion costs and market access, were not explored. Data uncertainty also affects the robustness of the conclusions. These limitations highlight the need for further research to better understand sustainable cotton farming practices.
Achieving sustainability in Egypt’s cotton production requires implementing resource-saving strategies to optimize fertilizer and water use while maintaining productivity, regardless of the cultivation method employed. By leveraging technological advancements, research insights, and best practices from diverse agricultural contexts, Egypt can further enhance the sustainability and efficiency of its cotton farming sector. This involves adopting precision fertilization and efficient irrigation practices, alongside promoting the use of less energy-intensive organic fertilizers and bio-fertilizers. Furthermore, integrating these practices with broader agricultural policies and technological innovations will help address key environmental and energy challenges, ultimately advancing the sustainability of cotton production in Egypt.
The study emphasizes the need for further research to understand the dynamics of organic and conventional farming methods, validate LCA results across different regions, and explore the environmental benefits and economic trade-offs of innovative farming practices in cotton cultivation, to guide sustainable decision-making. For future LCA studies in Egypt, it is advisable to utilize both mass- and area-based functional units (FUs) and midpoint and endpoint approaches to capture a broader range of environmental effects and provide more nuanced insights into the sustainability of agricultural practices.

Author Contributions

Conceptualization, A.M.; methodology, A.M.; software, A.M.; validation, P.E., G.C. and M.T.; formal analysis, A.M.; investigation, A.A.M.A.; resources, A.A.M.A.; data curation, A.M.; writing—original draft preparation, A.M. and G.C.; writing—review and editing, A.A.M.A., P.E., G.C. and M.T.; visualization, A.M., A.A.M.A. and P.E.; supervision, G.C.; project administration, A.M. All authors have read and agreed to the published version of the manuscript.

Funding

This research was funded by the European Union’s Horizon 2020 research and innovation programme under grant agreement No 861924, project SustInAfrica (Sustainable Intensification of Food Production through Resilient Farming Systems in West & North Africa).

Institutional Review Board Statement

Not applicable.

Informed Consent Statement

Not applicable.

Data Availability Statement

Data is contained within the article.

Acknowledgments

We thank the farmers who participated in the SustInAfrica project for providing their time and data. The authors are also grateful to the anonymous reviewers and editor for their insightful comments and feedback, which helped to improve the manuscript. Additionally, we thank all project partners and colleagues for their valuable contributions and support throughout the study. We also extend our thanks to all project partners and colleagues for their valuable contributions and support throughout the study.

Conflicts of Interest

The authors declare no conflicts of interest.

Abbreviations

DALYDisability-Adjusted Life Year
EOFPEcosystem ozone formation
EUEEnergy use efficiency
EPEnergy productivity
FEPFreshwater eutrophication
FFPFossil fuel scarcity
GWPGlobal Warming
HOFPHuman health ozone formation
HTPcHuman carcinogenic toxicity
HTPncHuman non-carcinogenic toxicity
IRPIonizing radiation
ISOInternational Organization for Standardization
LCALife Cycle Assessment
LCCLife Cycle Costing
LCILife Cycle Inventory
LCIALife Cycle Impact Assessment
LULand use
MEPMarine eutrophication
METPMarine ecotoxicity
ODPStratospheric ozone depletion
PMPFParticulate matter formation
SESpecific energy
SOPMineral resource scarcity
TAPTerrestrial acidification
TETPTerrestrial ecotoxicity
WCPWater consumption
1.4-DB Eq.14 Dichlorobenzene equivalent

References

  1. Long, L.; Zhao, X.-T.; Feng, Y.-M.; Fan, Z.-H.; Zhao, J.-R.; Wu, J.-F.; Xu, F.-C.; Yuan, M.; Gao, W. Profile of Cotton Flavonoids: Their Composition and Important Roles in Development and Adaptation to Adverse Environments. Plant Physiol. Biochem. 2023, 201, 107866. [Google Scholar] [CrossRef] [PubMed]
  2. Khan, M.A.; Wahid, A.; Ahmad, M.; Tahir, M.T.; Ahmed, M.; Ahmad, S.; Hasanuzzaman, M. World Cotton Production and Consumption: An Overview. In Cotton Production and Uses; Springer: Singapore, 2020; pp. 1–7. [Google Scholar]
  3. OECD/FAO. OECD-FAO Agricultural Outlook 2023–2032; OECD-FAO Agricultural Outlook; OECD: Paris, France, 2023; ISBN 9789264619333. [Google Scholar]
  4. Naderi Mahdei, K.; Esfahani, S.M.J.; Lebailly, P.; Dogot, T.; Van Passel, S.; Azadi, H. Environmental Impact Assessment and Efficiency of Cotton: The Case of Northeast Iran. Environ. Dev. Sustain. 2022, 25, 10301–10321. [Google Scholar] [CrossRef]
  5. Delate, K.; Heller, B.; Shade, J. Organic Cotton Production May Alleviate the Environmental Impacts of Intensive Conventional Cotton Production. Renew. Agric. Food Syst. 2021, 36, 405–412. [Google Scholar] [CrossRef]
  6. Zhang, Z.; Huang, J.; Yao, Y.; Peters, G.; Macdonald, B.; La Rosa, A.D.; Wang, Z.; Scherer, L. Environmental Impacts of Cotton and Opportunities for Improvement. Nat. Rev. Earth Environ. 2023, 4, 703–715. [Google Scholar] [CrossRef]
  7. Tuomisto, H.L.; Hodge, I.D.; Riordan, P.; Macdonald, D.W. Does Organic Farming Reduce Environmental Impacts?—A Meta-Analysis of European Research. J. Environ. Manag. 2012, 112, 309–320. [Google Scholar] [CrossRef] [PubMed]
  8. Eyhorn, F.; Muller, A.; Reganold, J.P.; Frison, E.; Herren, H.R.; Luttikholt, L.; Mueller, A.; Sanders, J.; Scialabba, N.E.-H.; Seufert, V.; et al. Sustainability in Global Agriculture Driven by Organic Farming. Nat. Sustain. 2019, 2, 253–255. [Google Scholar] [CrossRef]
  9. Muneret, L.; Mitchell, M.; Seufert, V.; Aviron, S.; Djoudi, E.A.; Pétillon, J.; Plantegenest, M.; Thiéry, D.; Rusch, A. Evidence That Organic Farming Promotes Pest Control. Nat. Sustain. 2018, 1, 361–368. [Google Scholar] [CrossRef]
  10. van der Werf, H.M.G.; Knudsen, M.T.; Cederberg, C. Towards Better Representation of Organic Agriculture in Life Cycle Assessment. Nat. Sustain. 2020, 3, 419–425. [Google Scholar] [CrossRef]
  11. Hercher-Pasteur, J.; Loiseau, E.; Sinfort, C.; Hélias, A. Energetic Assessment of the Agricultural Production System. A Review. Agron. Sustain. Dev. 2020, 40, 29. [Google Scholar] [CrossRef]
  12. Tsatsarelis, C.A. Energy Requirements for Cotton Production in Central Greece. J. Agric. Eng. Res. 1991, 50, 239–246. [Google Scholar] [CrossRef]
  13. Yilmaz, I.; Akcaoz, H.; Ozkan, B. An Analysis of Energy Use and Input Costs for Cotton Production in Turkey. Renew. Energy 2005, 30, 145–155. [Google Scholar] [CrossRef]
  14. Baran, M.F.; Gökdoğan, O.; Bayhan, Y. Determination of Energy Balance and Greenhouse Gas Emissions (GHG) of Cotton Cultivation in Turkey: A Case Study from Bismil District of Diyarbakır Province. J. Tekirdag Agric. Fac. 2021, 18, 322–332. [Google Scholar] [CrossRef]
  15. Aytop, Y. Determination of Energy Consumption and Technical Efficiency of Cotton Farms in Türkiye. Sustainability 2023, 15, 11194. [Google Scholar] [CrossRef]
  16. Sami, M.; Reyhani, H. Energy and Greenhouse Gases Balances of Cotton Farming in Iran: A Case Study. Acta Univ. Agric. Silvic. Mendel. Brun. 2018, 66, 101–109. [Google Scholar] [CrossRef]
  17. Kazemi, H.; Shokrgozar, M.; Kamkar, B.; Soltani, A. Analysis of Cotton Production by Energy Indicators in Two Different Climatic Regions. J. Clean. Prod. 2018, 190, 729–736. [Google Scholar] [CrossRef]
  18. Singh, P.; Singh, G.; Sodhi, G.P.S. Data Envelopment Analysis Based Optimization for Improving Net Ecosystem Carbon and Energy Budget in Cotton (Gossypium hirsutum L.) Cultivation: Methods and a Case Study of North-Western India. Environ. Dev. Sustain. 2022, 24, 2079–2119. [Google Scholar] [CrossRef]
  19. Imran, M.; Özçatalbaş, O.; Bashir, M.K. Estimation of Energy Efficiency and Greenhouse Gas Emission of Cotton Crop in South Punjab, Pakistan. J. Saudi Soc. Agric. Sci. 2020, 19, 216–224. [Google Scholar] [CrossRef]
  20. Abbas, A.; Zhao, C.; Waseem, M.; Ahmed khan, K.; Ahmad, R. Analysis of Energy Input–Output of Farms and Assessment of Greenhouse Gas Emissions: A Case Study of Cotton Growers. Front. Environ. Sci. 2022, 9, 826838. [Google Scholar] [CrossRef]
  21. Huang, W.; Wu, F.; Han, W.; Li, Q.; Han, Y.; Wang, G.; Feng, L.; Li, X.; Yang, B.; Lei, Y.; et al. Carbon Footprint of Cotton Production in China: Composition, Spatiotemporal Changes and Driving Factors. Sci. Total Environ. 2022, 821, 153407. [Google Scholar] [CrossRef]
  22. Boschiero, M.; De Laurentiis, V.; Caldeira, C.; Sala, S. Comparison of Organic and Conventional Cropping Systems: A Systematic Review of Life Cycle Assessment Studies. Environ. Impact Assess. Rev. 2023, 102, 107187. [Google Scholar] [CrossRef]
  23. Sala, S.; Amadei, A.M.; Beylot, A.; Ardente, F. The Evolution of Life Cycle Assessment in European Policies over Three Decades. Int. J. Life Cycle Assess. 2021, 26, 2295–2314. [Google Scholar] [CrossRef]
  24. Ullah, A.; Perret, S.R.; Gheewala, S.H.; Soni, P. Eco-Efficiency of Cotton-Cropping Systems in Pakistan: An Integrated Approach of Life Cycle Assessment and Data Envelopment Analysis. J. Clean. Prod. 2016, 134, 623–632. [Google Scholar] [CrossRef]
  25. Zhang, T.; Zhai, Y.; Ma, X.; Shen, X.; Bai, Y.; Zhang, R.; Ji, C.; Hong, J. Towards Environmental Sustainability: Life Cycle Assessment-Based Water Footprint Analysis on China’s Cotton Production. J. Clean. Prod. 2021, 313, 127925. [Google Scholar] [CrossRef]
  26. Avadí, A.; Marcin, M.; Biard, Y.; Renou, A.; Gourlot, J.-P.; Basset-Mens, C. Life Cycle Assessment of Organic and Conventional Non-Bt Cotton Products from Mali. Int. J. Life Cycle Assess. 2020, 25, 678–697. [Google Scholar] [CrossRef]
  27. Shah, P.; Bansal, A.; Singh, R.K. Life Cycle Assessment of Organic, BCI and Conventional Cotton: A Comparative Study of Cotton Cultivation Practices in India. In Designing Sustainable Technologies, Products and Policies; Springer International Publishing: Cham, Switzerland, 2018; pp. 67–77. [Google Scholar]
  28. Chen, F.; Ji, X.; Chu, J.; Xu, P.; Wang, L. A Review: Life Cycle Assessment of Cotton Textiles. Ind. Textila 2021, 72, 19–29. [Google Scholar] [CrossRef]
  29. Gonzalez, V.; Lou, X.; Chi, T. Evaluating Environmental Impact of Natural and Synthetic Fibers: A Life Cycle Assessment Approach. Sustainability 2023, 15, 7670. [Google Scholar] [CrossRef]
  30. Fidan, F.Ş.; Aydoğan, E.K.; Uzal, N. Recent Progress on Life Cycle Sustainability Assessment in Textile Industry: Applications for Environmental, Economic, and Social Impacts of Cotton and Its Derivatives. In Progress on Life Cycle Assessment in Textiles and Clothing; Springer: Singapore, 2023. [Google Scholar]
  31. Karkour, S.; Rachid, S.; Maaoui, M.; Lin, C.-C.; Itsubo, N. Status of Life Cycle Assessment (LCA) in Africa. Environments 2021, 8, 10. [Google Scholar] [CrossRef]
  32. Denora, M.; Candido, V.; D’Antonio, P.; Perniola, M.; Mehmeti, A. Precision Nitrogen Management in Rainfed Durum Wheat Cultivation: Exploring Synergies and Trade-Offs via Energy Analysis, Life Cycle Assessment, and Monetization. Precis. Agric. 2023, 24, 2566–2591. [Google Scholar] [CrossRef]
  33. Huijbregts, M.A.J.; Steinmann, Z.J.N.; Elshout, P.M.F.; Stam, G.; Verones, F.; Vieira, M.; Zijp, M.; Hollander, A.; van Zelm, R. ReCiPe2016: A Harmonised Life Cycle Impact Assessment Method at Midpoint and Endpoint Level. Int. J. Life Cycle Assess. 2017, 22, 138–147. [Google Scholar] [CrossRef]
  34. Eyhorn, F.; Ratter, S.G.; Ramakrishnan, M. Organic Cotton Crop Guide Organic Cotton Crop Guide—A Manual for Practitioners in the Tropics; Research Institute of Organic Agriculture (FibL): Frick, Switzerland, 2005. [Google Scholar]
  35. Nemecek, T.; Kägi, T.; Dübendorf, Z. Life Cycle Inventories of Agricultural Production Systems Data v2.0 (2007); Ecoinvent Report No. 15; Agroscope: Reckenholz-Tänikon, Switzerland, 2007. [Google Scholar]
  36. CarbonCloud Calculating GHG Emissions at Farm-Gate. Available online: https://carboncloud.com/agricultural-model/ (accessed on 15 September 2023).
  37. Ecoinvent Database 3.1; Ecoinvent Centre: Zurich, Switzerland, 2014.
  38. Canaj, K.; Mehmeti, A.; Cantore, V.; Todorović, M. LCA of Tomato Greenhouse Production Using Spatially Differentiated Life Cycle Impact Assessment Indicators: An Albanian Case Study. Environ. Sci. Pollut. Res. 2020, 27, 6960–6970. [Google Scholar] [CrossRef]
  39. GreenDelta OpenLCA 1.11. Available online: https://www.openlca.org/download/ (accessed on 18 March 2024).
  40. Canaj, K.; Mehmeti, A. Analyzing the Water-Energy-Environment Nexus of Irrigated Wheat and Maize Production in Albania. Energy Nexus 2022, 7, 100100. [Google Scholar] [CrossRef]
  41. Alam, M.J.; Al Mahmud, A.; Gaber, A.; Hossain, A. Energy Efficiency and Water Use Indices for Sweet Potato (Ipomoea Batatas L.) Production under Subtropical Climatic Conditions of Bangladesh. J. Water Clim. Change 2023, 14, 576–589. [Google Scholar] [CrossRef]
  42. Amiryousefi, M.; Tadayon, M.R.; Ebrahimi, R. Energy and Exergy Efficiencies Assessment for Two Quinoa Cultivars Productions. Energy Rep. 2021, 7, 2324–2331. [Google Scholar] [CrossRef]
  43. Dagistan, E.; Akcaoz, H.; Demirtas, B.; Yilmaz, Y. Energy Usage and Benefit-Cost Analysis of Cotton Production in Turkey. Afr. J. Agric. Res. 2009, 4, 599–604. [Google Scholar]
  44. Zahedi, M.; Eshghizadeh, H.R.; Mondani, F. Energy Use Efficiency and Economical Analysis in Cotton Production System in an Arid Region: A Case Study for Isfahan Province, Iran. Int. J. Energy Econ. Policy 2014, 4, 43–52. [Google Scholar]
  45. Ranguwal, S.; Sidana, B.K.; Singh, J.; Sachdeva, J.; Kumar, S.; Sharma, R.K.; Dhillon, J. Quantifying the Energy Use Efficiency and Greenhouse Gas Emissions in Punjab (India) Agriculture. Energy Nexus 2023, 11, 100238. [Google Scholar] [CrossRef]
  46. Khan, M.; Khan, S.; Mushtag, S. Energy and Economic Efficiency Analysis of Rice and Cotton Production in China. Sahad J. Agric. 2009, 25, 291–300. [Google Scholar]
  47. Singh, R.; Agarwal, R.; Bos, U.; Kanekar, H. Life Cycle Assessment of Cotton Cultivation Systems—Better Cotton, Conventioal Cotton and Organic Cotton; Thinkstep Sustainability Solutions Pvt. Ltd., Study commissioned by C&A Foundation. 2018. Available online: https://www.laudesfoundation.org/media/43anrffi/4332-environmentall-care-port-june19.pdf (accessed on 18 March 2024).
  48. De la Cruz, V.Y.V.; Tantriani; Cheng, W.; Tawaraya, K. Yield Gap between Organic and Conventional Farming Systems across Climate Types and Sub-Types: A Meta-Analysis. Agric. Syst. 2023, 211, 103732. [Google Scholar] [CrossRef]
  49. Meier, M.S.; Stoessel, F.; Jungbluth, N.; Juraske, R.; Schader, C.; Stolze, M. Environmental Impacts of Organic and Conventional Agricultural Products—Are the Differences Captured by Life Cycle Assessment? J. Environ. Manag. 2015, 149, 193–208. [Google Scholar] [CrossRef]
  50. PE International. The Life Cycle Assessment of Organic Cotton Fiber Summary of Findings—A Global Average. 2014. Available online: https://www.ajsosteniblebcn.cat/the-life-cycle-assessment-of-organic-cotton-fiber_38172.pdf (accessed on 18 March 2024).
  51. Fidan, F.Ş. A Comparative Life Cycle Assessment of Conventional and Organic Cotton in Denim Fabric. Pharmacoecon. Theory Pract. 2017, 5, 1–8. [Google Scholar]
  52. Meemken, E.M.; Qaim, M. Organic Agriculture, Food Security, and the Environment. Annu. Rev. Resour. Econ. 2018, 10, 39–63. [Google Scholar] [CrossRef]
  53. Bilalis, D.; Patsiali, S.; Karkanis, A.; Konstantas, A.; Makris, M.; Efthimiadou, A. Effects of Cultural System (Organic and Conventional) on Growth and Fiber Quality of Two Cotton (Gossypium hirsutum L.) Varieties. Renew. Agric. Food Syst. 2010, 25, 228–235. [Google Scholar] [CrossRef]
  54. Bachmann, F. Potential and Limitations of Organic and Fair Trade Cotton for Improving Livelihoods of Smallholders: Evidence from Central Asia. Renew. Agric. Food Syst. 2012, 27, 138–147. [Google Scholar] [CrossRef]
  55. Riar, A.; Mandloi, L.S.; Sendhil, R.; Poswal, R.S.; Messmer, M.M.; Bhullar, G.S. Technical Efficiencies and Yield Variability Are Comparable across Organic and Conventional Farms. Sustainability 2020, 12, 4271. [Google Scholar] [CrossRef]
  56. Barahmand, Z.; Eikeland, M.S. Life Cycle Assessment under Uncertainty: A Scoping Review. World 2022, 3, 39. [Google Scholar] [CrossRef]
  57. da Silva Cardoso, A.; Junqueira, J.B.; Reis, R.A.; Ruggieri, A.C. How Do Greenhouse Gas Emissions Vary with Biofertilizer Type and Soil Temperature and Moisture in a Tropical Grassland? Pedosphere 2020, 30, 607–617. [Google Scholar] [CrossRef]
  58. Pajura, R.; Masłoń, A.; Czarnota, J. The Use of Waste to Produce Liquid Fertilizers in Terms of Sustainable Development and Energy Consumption in the Fertilizer Industry—A Case Study from Poland. Energies 2023, 16, 1747. [Google Scholar] [CrossRef]
  59. Kumar, S.; Diksha; Sindhu, S.S.; Kumar, R. Biofertilizers: An Ecofriendly Technology for Nutrient Recycling and Environmental Sustainability. Curr. Res. Microb. Sci. 2022, 3, 100094. [Google Scholar] [CrossRef]
  60. Alengebawy, A.; Mohamed, B.A.; Jin, K.; Liu, T.; Ghimire, N.; Samer, M.; Ai, P. A Comparative Life Cycle Assessment of Biofertilizer Production towards Sustainable Utilization of Anaerobic Digestate. Sustain. Prod. Consum. 2022, 33, 875–889. [Google Scholar] [CrossRef]
Figure 1. Framework for evaluating the energy and environmental footprint of cotton cultivation.
Sustainability 16 06637 g001
Figure 2. System boundaries for conducting an LCA-based sustainability analysis of cotton cultivation.
Sustainability 16 06637 g002
Figure 3. Distribution of energy inputs categorized into direct and indirect sources, as well as renewable and non-renewable categories.
Sustainability 16 06637 g003
Figure 4. Contribution analysis of inputs and processes to the total energy input in conventional and organic seed cotton production.
Sustainability 16 06637 g004
Figure 5. Process contribution analysis to the environmental impact categories for conventional (a) and organic (b) cotton cultivation in Egypt.
Sustainability 16 06637 g005
Figure 6. Contribution analysis of endpoint environmental impacts per ton of seed cotton.
Sustainability 16 06637 g006
Figure 7. Cradle-to-gate environmental footprint contribution analysis for 1 ton of conventional and organic seed cotton production in Egypt: (A) process level; (B) sub-system level; (C) midpoint indicator level.
Sustainability 16 06637 g007
Table 1. Yield and resource input for 1 metric ton of conventional and organic seed cotton cultivation in Beheira governorate, Egypt.
ParametersProcess Modeled/
Compartment
UnitConventional
Cotton
Organic
Cotton
Resource and yield data 1
Crop yieldCotton, EGkg ha−134003364
Seeds, for sowingMarket for cotton seed, for sowingkg t−12121.2
Diesel FuelDiesel, burned in building machinel t−114.114.2
Lubricating oilMarket for lubricating oilkg t−10.220.225
Tractor workmarket for tractor, 4-wheel, agriculturalhour t−11.111.112
Ammonium nitrate, as NMarket for ammonium nitrate, as Nkg N t−170.7-
Superphosphate, as P2O5Single superphosphate productionkg P2O5 t−153.6-
Farmyard manureAverage digestatekg t−12753-
Plant/Animal compostAverage compost, from green waste, biowaste, sludge, manure, slurrykg t−1-4815.3
Biofertilizers kg t−1-71.3
PesticidesMarket for pesticide, unspecifiedkg t−10.097-
Irrigation waterWater, river, EGm3 t−119061565
Diesel fuel for irrigationDiesel, burned in building machineMJ t−1819687.8
Human laborCarbon dioxide, to airh t−1310.5314
Emission to Environment 2
AmmoniaEmission to air, low population densitykg t−g18.1317.39
Benzo(a)pyreneEmission to air, low population densitykg t−g3.52 × 10−73.87 × 10⁻⁷
CadmiumEmission to air, low population densitykg t−g1.17 × 10−71.29 × 10⁻⁷
Carbon dioxide, fossilEmission to air, low population densitykg t−g36.619040.2809
Carbon monoxide, fossilEmission to air, low population densitykg t−g0.1340.146
ChromiumEmission to air, low population densitykg t−g5.9 × 10−76.5 × 10⁻⁷
CopperEmission to air, low population densitykg t−g2 × 10−52.2 × 10⁻⁵
Dinitrogen monoxideEmission to air, low population densitykg t−g2.862.85
Tetrachlorodibenzo-p-dioxinEmission to air, low population densitykg t−g1.181.23
Methane, fossilEmission to air, low population densitykg t−g125.37120.19
NickelEmission to air, low population densitykg t−g125.11119.97
Nitrogen oxidesEmission to air, low population densitykg t−g5.616.11
NMVOCEmission to air, low population densitykg t−g124.98119.82
Polycyclic aromatic hydrocarbonsEmission to air, low population densitykg t−g0.190.21
Particulates, <2.5 μm Emission to air, low population densitykg t−g0.130.15
Particulates, >10 μmEmission to air, low population densitykg t−g0.290.17
Particulates, >2.5 μm, and <10 μmEmission to air, low population densitykg t−g0.00210.0023
SeleniumEmission to air, low population densitykg t−g1.17 × 10−51.29 × 10⁻⁵
Sulfur dioxideEmission to air, low population densitykg t−g0.010.01
ZincEmission to air, low population densitykg t−g1.17 × 10−51.29 × 10⁻⁵
NitratesEmission to water, groundwaterkg t−g137.454.1
PhosphateEmission to water, groundwaterkg t−g0.0950.095
PhosphorusEmission to water, surface waterkg t−g0.530.38
1 Collected from the SustInAfrica research project. 2 Generated from emission-based models.
Table 2. The energy equivalent of inputs by type and source and output in cotton production.
ParameterEnergy
Equivalents
(MJ Unit−1)
UnitReferences
Human labor1.96h[40]
Seeds cotton11.8kg[14,15]
Pesticide, unspecified 193kg[40]
Diesel fuel 56.31Liter[41]
Nitrogen (N)66.14MJ/kg[41]
Phosphorus (P)12.44MJ/kg[41]
Bio-fertilizers19.64MJ/kg[42]
Farm manure/Compost0.3MJ/kg[40]
Tractor machinery 62.7kg[40]
Water, irrigation 1.03m3[40]
Cotton, yield11.8kg[14,15,16,17,18,20,43,44]
Table 3. Energy balance and performance indicators of cotton seed production in Beheira governorate, Egypt.
ItemUnitConventional Cotton Organic
Cotton
Energy inputMJ ha−137,47224,763
Energy outputMJ ha−140,12039,699
Net energy gain (NEG)MJ ha−1264814,936
Energy use efficiency (EUE)-1.071.60
Energy productivity (EP)kg MJ−10.0910.136
Specific energy (SE)MJ kg−111.027.36
Energy profitability-0.0710.603
Table 5. Environmental impacts of cotton cultivation in Egypt at midpoint level.
IndicatorUnitConventionalOrganic
1 ton1 ha1 ton1 ha
Midpoint
Fine particulate matter formation kg PM2.5-eq5.5618.894.4114.82
Fossil resource scarcity kg oil-eq275.83937.81230.70776.15
Freshwater ecotoxicity kg 1,4-DCB-eq45.44154.4930.41102.31
Freshwater eutrophication kg P-eq0.591.990.451.50
Global warming kg CO2-eq2622.68916.82273.947650.22
Human carcinogenic toxicity kg 1,4-DCB-eq33.00112.2022.7476.50
Human non-carcinogenic toxicity kg 1,4-DCB-eq1132.853851.69722.242429.82
Ionizing radiation kBq Co-60-eq84.93288.7540.06134.78
Land use m2a crop-eq1570.345339.161585.485334.02
Marine ecotoxicity kg 1,4-DCB-eq63.01214.2341.63140.06
Marine eutrophication kg N-eq21.0971.7117.9760.46
Mineral resource scarcity kg Cu-eq13.3745.446.4421.66
Ozone formation, Human health kg NOx-eq5.9820.354.9516.65
Ozone formation, Terrestrial ecosystems kg NOx-eq15.2451.8112.7042.71
Stratospheric ozone depletion kg CFC11-eq0.060.210.060.19
Terrestrial acidification kg SO2-eq30.28102.9625.2584.95
Terrestrial ecotoxicity kg 1,4-DCB-eq5339.1018,152.934038.5613,586.94
Water consumption m3 consumed2171.837384.211786.416010.01
Table 6. Environmental impacts of cotton cultivation in Egypt at the endpoint level.
IndicatorUnitConventionalOrganic
1 ton1 ha1 ton1 ha
Endpoint
Damage to human healthDALY0.01220.041440.00880.02957
Damage to ecosystem qualityspecies.yr4.98 × 10−50.000173.66 × 10−50.00012
Damage to resource availabilityUSD2013104.64355.7688.33297.16
Table 7. Sensitivity analysis of energy performance indicators and total environmental impact of organic vs. conventional cotton in Egypt.
StrategyEnergy Use
Efficiency (EUE)
Energy
Productivity (EP)
Specific Energy (SE)Total
Environmental
Impact (TEI)
Organic baseline1.600.1367.36150.7
Conventional +10% yield1.170.09910.13214.3
Conventional +20% yield1.270.1089.28196.5
Conventional +30% yield1.380.1178.57181.4
Conventional +40% yield1.480.1267.96168.4
Conventional +50% yield1.590.1357.43157.2
Conventional −20% fertilizer use1.190.1019.92206.4
Disclaimer/Publisher’s Note: The statements, opinions and data contained in all publications are solely those of the individual author(s) and contributor(s) and not of MDPI and/or the editor(s). MDPI and/or the editor(s) disclaim responsibility for any injury to people or property resulting from any ideas, methods, instructions or products referred to in the content.

