Article

AI-Driven Prediction of Compressive Strength in Self-Compacting Concrete: Enhancing Sustainability through Ultrasonic Measurements

by
Mouhcine Benaicha
Structure and Materials Laboratory, National School of Architecture, Rabat 10000, Morocco
Sustainability 2024, 16(15), 6644; https://doi.org/10.3390/su16156644 (registering DOI)
Submission received: 13 July 2024 / Revised: 26 July 2024 / Accepted: 1 August 2024 / Published: 3 August 2024

Abstract

:
This study investigates the application of artificial intelligence (AI) to predict the compressive strength of self-compacting concrete (SCC) through ultrasonic measurements, thereby contributing to sustainable construction practices. By leveraging advancements in computational techniques, specifically artificial neural networks (ANNs), we developed highly accurate predictive models to forecast the compressive strength of SCC based on ultrasonic pulse velocity (UPV) measurements. Our findings demonstrate a clear correlation between higher UPV readings and improved concrete quality, despite the general trend of decreased compressive strength with increased air-entraining admixture (AEA) concentrations. The ANN models show exceptional effectiveness in predicting compressive strength, with a correlation coefficient (R2) of 0.99 between predicted and actual values, providing a robust tool for optimizing SCC mix designs and ensuring quality control. This AI-driven approach enhances sustainability by improving material efficiency and significantly reducing the need for traditional destructive testing methods, thus offering a rapid, reliable, and non-destructive alternative for assessing concrete properties.

1. Introduction

The construction industry constantly seeks innovative materials and techniques to improve efficiency, durability, and sustainability. Self-compacting concrete (SCC) is a prime example, offering superior flowability and compaction without the need for mechanical vibration [1,2]. This unique property makes SCC highly desirable for complex structures and heavily reinforced sections where traditional concrete would struggle to fill all voids adequately [3,4,5].
Predicting the compressive strength of concrete is a critical aspect of structural design and quality control. Traditionally, this involves destructive testing methods, such as crushing concrete specimens, which, although accurate, are time-consuming and resource-intensive [6,7]. There is a growing need for non-destructive techniques that can provide rapid, reliable estimates of concrete properties in situ [8,9,10,11,12,13].
Ultrasonic testing is a promising non-destructive evaluation method that uses high-frequency sound waves to probe the internal characteristics of concrete. Ultrasonic velocity (UPV) measurements can provide insights into the density, homogeneity, and elastic properties of the material. However, translating UPV data into accurate predictions of compressive strength remains a challenging task due to the complex and heterogeneous nature of concrete [14,15,16].
Despite the advancements in AI and its application in various fields, there is still a significant gap in the integration of AI for predicting the compressive strength of SCC using non-destructive methods. Most existing studies have focused on traditional destructive testing methods or limited AI applications that do not fully exploit the potential of AI techniques for enhancing predictive accuracy and efficiency.
Artificial intelligence (AI) has emerged as a powerful tool for pattern recognition and predictive modeling in various engineering domains. Techniques such as neural networks, support vector machines, and fuzzy logic have demonstrated significant potential forhandling complex datasets and providing accurate predictions. More recent studies highlight the effectiveness of AI models fcorrelating ultrasonic measurements with compressive strength, thereby offering a rapid and non-destructive alternative to traditional testing methods [17,18,19,20]. These advancements underscore the importance of AI in optimizing concrete mix designs and improving quality control.
Furthermore, the frequency of keyword mentions in research articles relating to the application of artificial neural networks (ANNs) in the field of concrete is depicted in Figure 1. This figure uses nodes to represent each keyword, with the size of each node indicating the frequency of its occurrence in the literature. Among the most frequently cited keywords, “prediction” stands out prominently, underscoring the relevance and importance of predictive modeling in concrete technology, which is the central theme of this study.
The objective of this study is to develop an AI-based model to predict the compressive strength of SCC using ultrasonic measurements. This involves collecting extensive data on SCC specimens, preprocessing the ultrasonic data, selecting relevant features, and training a neural network model to predict compressive strength. The proposed approach aims to provide a robust and efficient tool for engineers and practitioners, facilitating better quality control and optimization of SCC in construction projects. This study not only seeks to address the limitations of previous research but also aims to advance the field by demonstrating the practical applicability and benefits of AI-driven predictive modeling in concrete technology.

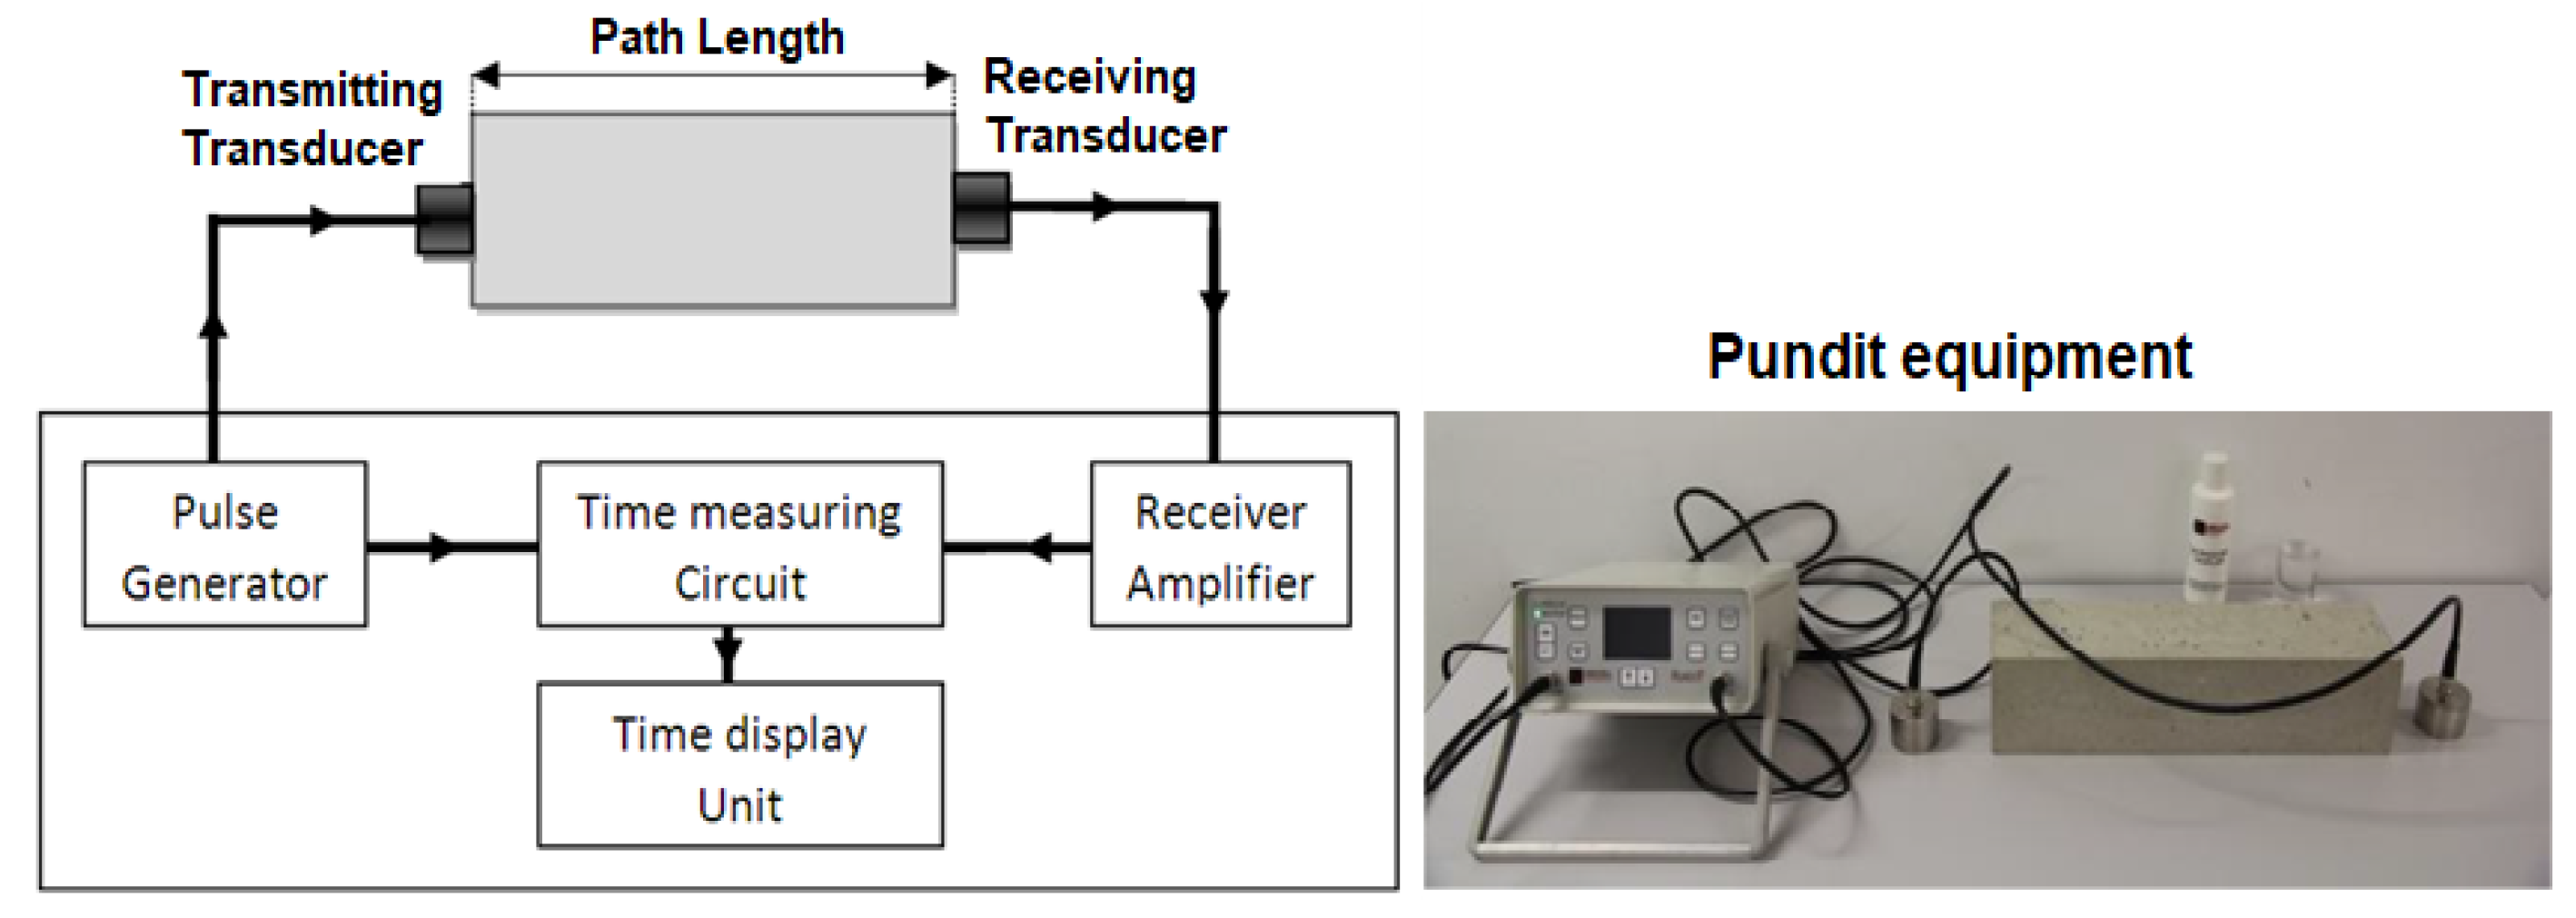
2. Application of Ultrasonic Testing

Ultrasonic testing is a non-destructive evaluation (NDE) method widely used in the assessment of concrete properties. This technique involves transmitting high-frequency sound waves through the material and measuring the time it takes for these waves to travel from a transmitter to a receiver. The speed at which these waves propagate provides valuable information about the internal structure such as its homogeneity, and the presence of any internal flaws (Figure 2).
The basic principle of UPV testing is that sound waves travel faster through denser and more homogeneous materials. In concrete, the velocity of ultrasonic pulses is affected by factors such as the material’s density andelasticity and the presence of internal flaws, such as cracks or voids. The UPV test involves placing transducers on the surface of the concrete, either directly opposite each other (direct transmission), on adjacent surfaces (semi-direct transmission), or on the same surface (indirect or surface transmission). The time taken for the pulse to travel between the transducers is recorded, and the pulse velocity is calculated using the following equation: V = L/t, where V is the pulse velocity, L is the path length, and T is the transit time.
Developing a reliable correlation between UPV and compressive strength is a key objective in concrete research. Various empirical models have been proposed to relate UPV measurements to compressive strength [21,22,23,24,25,26,27,28]. These models typically involve regression analysis based on experimental data, where UPV readings are correlated with compressive strength values obtained from standard destructive tests. However, due to the inherent variability in concrete properties, these empirical models often have limited generalizability.
To overcome the limitations of traditional empirical models, researchers are increasingly turning to AI techniques. AI, particularly neural networks, can handle the non-linear relationships and complex interactions within the data, providing more accurate and robust predictions. By training AI models on extensive datasets that include UPV measurements and corresponding compressive strength values, it is possible to develop predictive models that can generalize across different concrete mixes and conditions.
In this study, we aim to harness the power of AI to enhance the predictive capability of UPV testing for SCC. By integrating ultrasonic measurements with advanced neural network algorithms, we seek to provide a practical, non-destructive tool for predicting the compressive strength of SCC, ultimately improving quality control and optimization in concrete engineering.

3. Analysis of ANNs Modeling

ANNs have emerged as powerful computational tools capable of modeling complex relationships and patterns in diverse datasets, making them well-suited for predictive modeling in concrete technology. ANNs consist of interconnected nodes (neurons) organized into layers, each performing specific computations on input data to generate output predictions. In the context of this study, ANNs modeling offers a data-driven approach to predict the compressive strength of SCC based on ultrasonic velocity measurements at different curing ages.
The network architecture employed in this study is a back-propagation neural network (BPNN), a type of feed-forward, multilayer network commonly used for predictive modeling tasks. The BPNN consists of interconnected layers of artificial neurons, each layer serving a specific function in the information processing pipeline. In this architecture, data flows sequentially from the input layer through one or more hidden layers to the output layer without the presence of feedback loops, facilitating efficient computation and prediction.
The architecture of the BPNN utilized in this study is illustrated in Figure 3, denoted as a 3–4–6–1 architecture. The input layer consists of three neurons, representing the ultrasonic pulse velocities measured at 1, 7, and 28 days. Two hidden layers follow, containing four and six neurons, which perform complex computations and feature extraction to capture nonlinear relationships within the data. Finally, the output layer comprises one neuron responsible for generating predictions of compressive strength at 28 days based on the input features.
This architecture design is chosen for its ability to effectively model the intricate relationships between input parameters (ultrasonic velocities at different ages, and compressive strength at 1 and 7 days) and output variable (compressive strength at 28 days). By leveraging the flexibility and scalability of BPNNs, researchers can capture complex patterns and dependencies in the data, leading to more accurate predictions of SCC properties. Overall, the network architecture serves as a crucial component in the ANNs modeling framework, enabling the development of robust and reliable predictive models for the compressive strength of SCC.
In the process of developing predictive models for the compressive strength of SCC, several crucial steps are undertaken to ensure the accuracy and reliability of the models. Firstly, normalization is applied to the input parameters, including ultrasonic velocities at 1, 7, and 28 days, using methods such as standard scaler normalization (z-score normalization). This preprocessing step standardizes the scale of input features, preventing any single parameter from dominating the learning process and facilitating effective training of the neural network.
Subsequently, the neural network undergoes training, wherein its parameters are iteratively optimized using optimization algorithms. These algorithms adjust the network’s weights and biases based on the gradient of the loss function, gradually minimizing prediction errors and enhancing the model’s performance. Following training, the model’s generalization performance is assessed through validation techniques such as k-fold cross-validation, where the model is evaluated on a separate validation dataset. Performance metrics like R-square or Pearson’s linear coefficient of determination (R) are then used to quantify the accuracy and reliability of the model’s predictions.

4. Results and Discussion

4.1. Materials and Mix Design

The materials used in this study were carefully selected to produce SCC with optimal workability, flowability, and mechanical performance. The specific properties and proportions of each material were determined according to relevant EN standards, ensuring consistency and reliability in the mix design. The chemical composition of each mineral admixture is given in [29,30]. The mixing process for the SCC began with the integration of gravel, sand, cement, and limestone fillers, which were mixed for 1 min. Subsequently, water was added to the dry ingredients, and the mixture was further mixed for 1 min. Next, the superplasticizer was introduced, and the concrete was mixed for an additional 3 min to achieve optimal workability. If an air-entraining admixture (AEA) was required, it was added at this stage, followed by a final 2-min mixing period to ensure thorough incorporation. Detailed information about the concrete samples tested, including variations in additives, is summarized in Table 1.
A total of 21 SCC mixes were meticulously formulated for this study. The mix design process involved the systematic variation of AEA concentration in the SCC mixes while keeping other mix parameters constant. The reference mix (SCC0) served as the baseline for comparison, representing a typical SCC mixture without AEA. Each successive mix from SCC1 to SCC20 incorporated an additional 0.05% AEA compared to the previous mix, resulting in a gradual increase in AEA dosage up to 1% in SCC20.

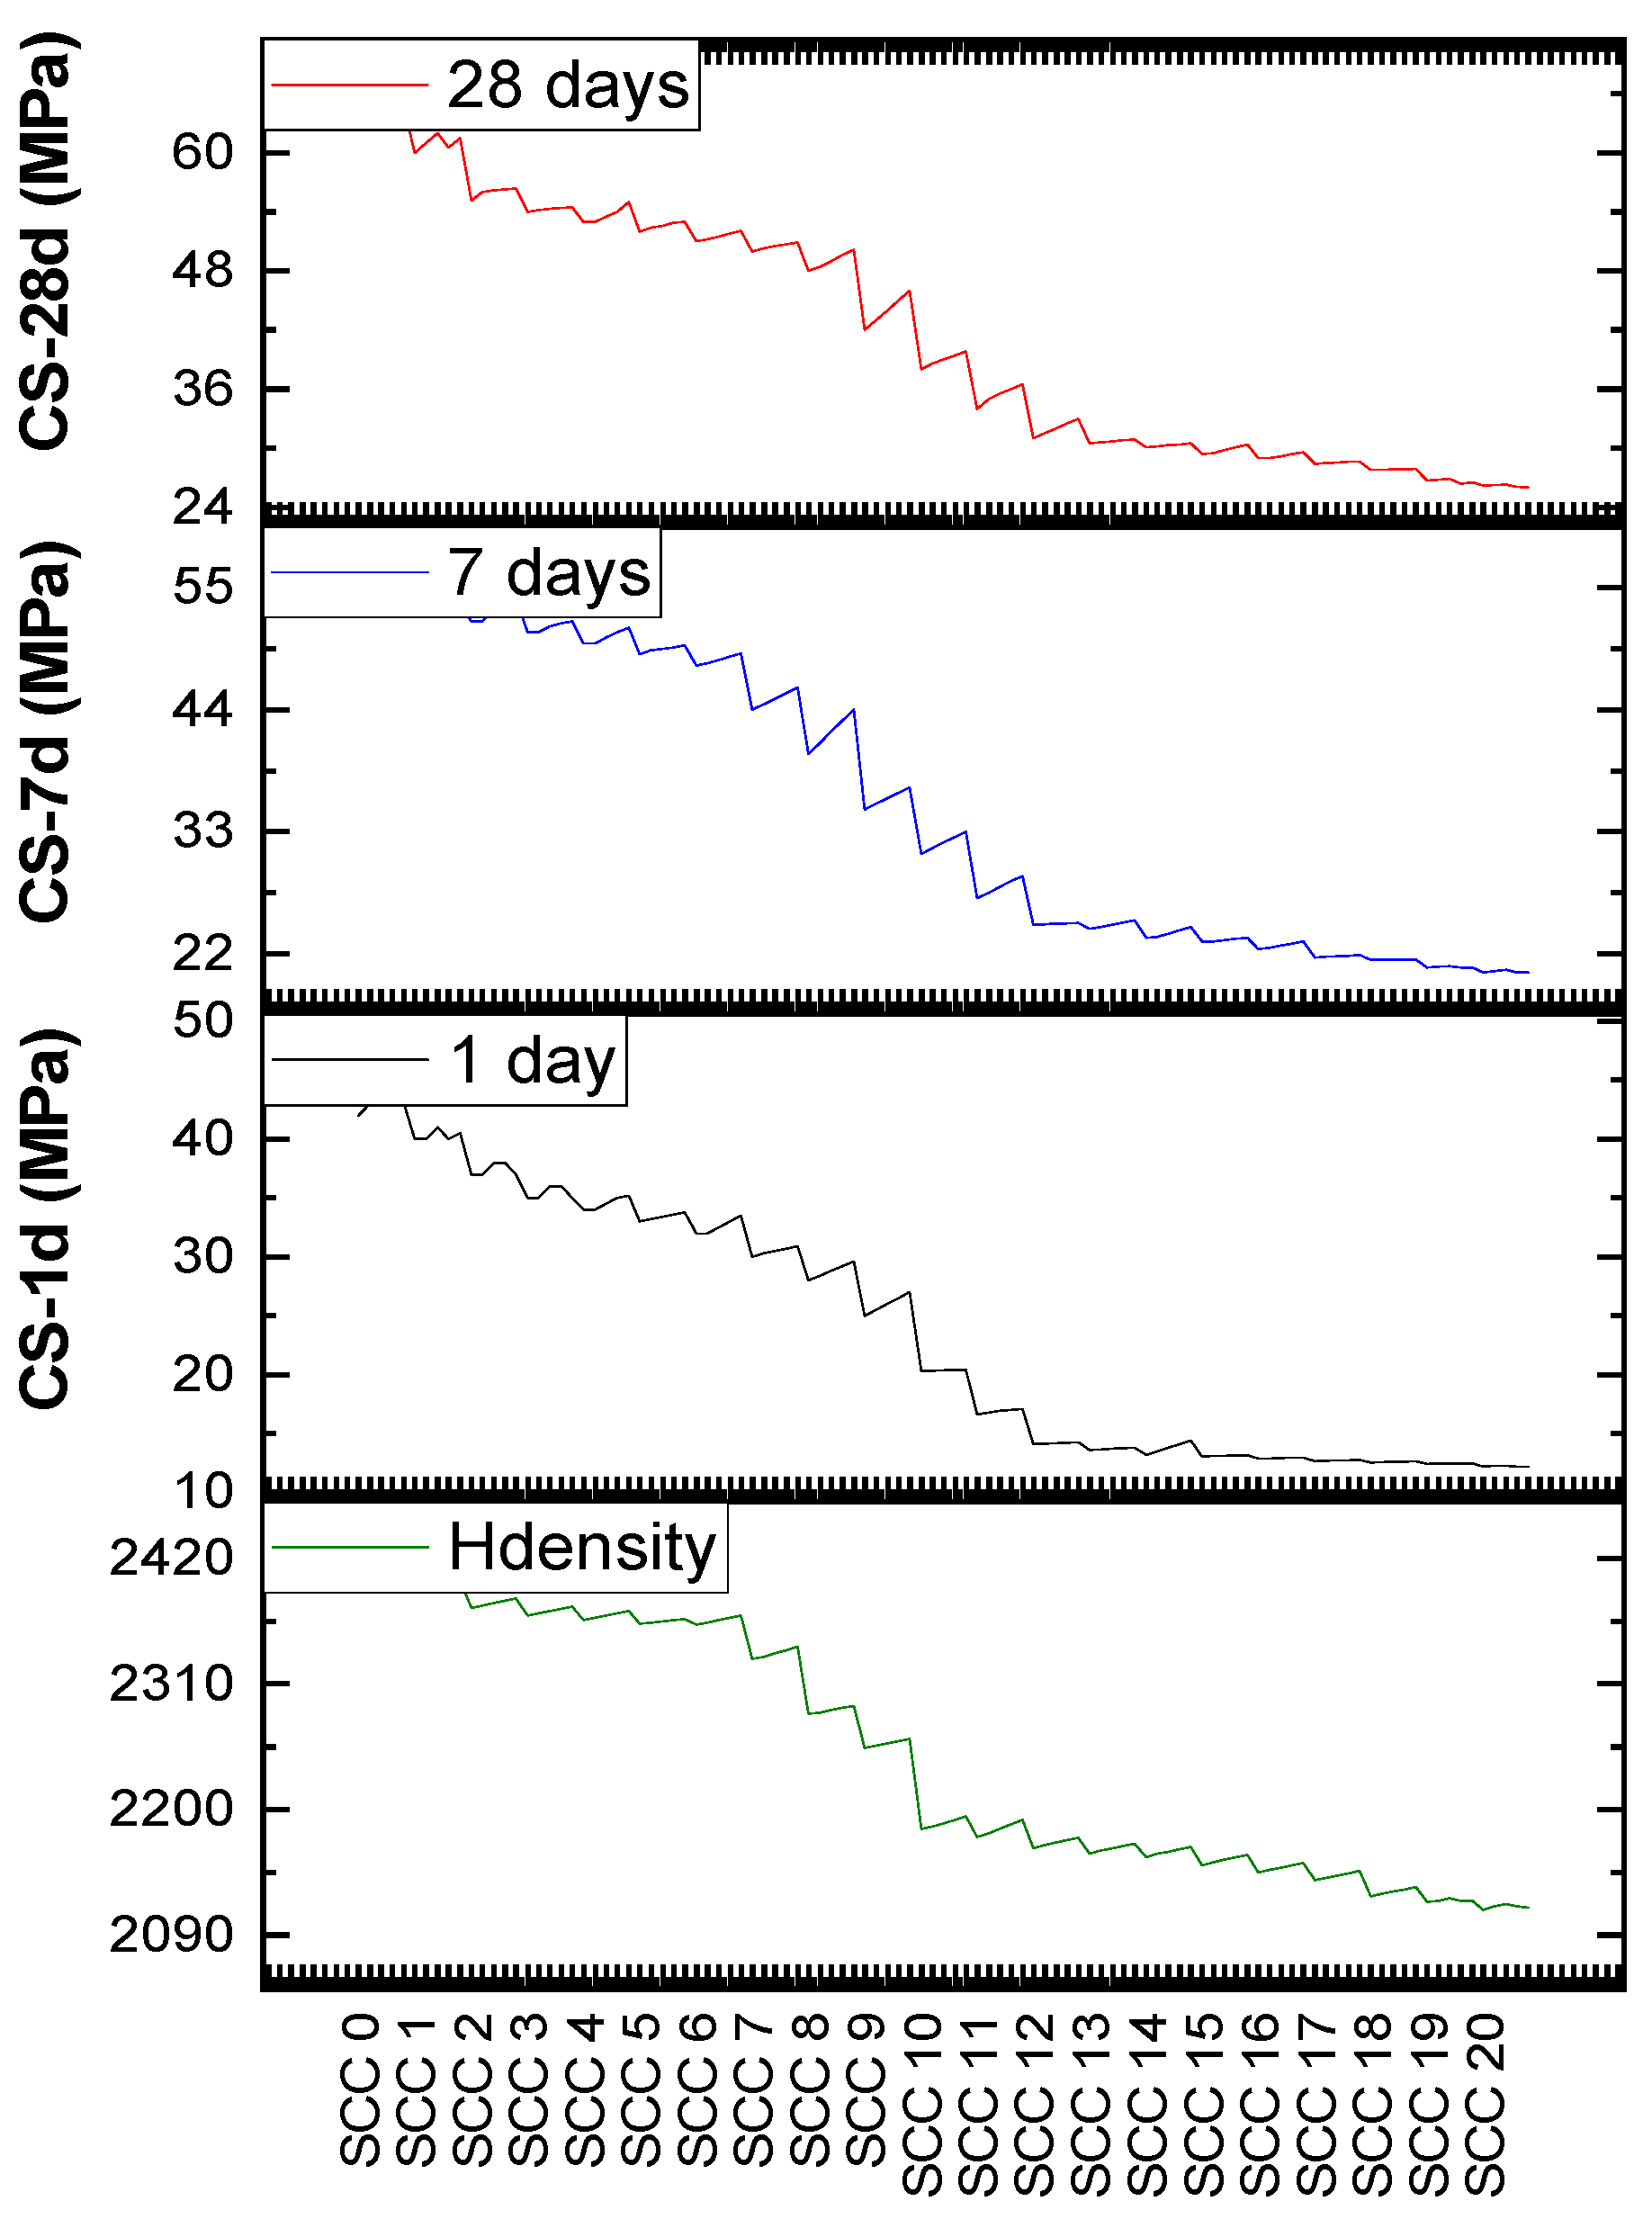
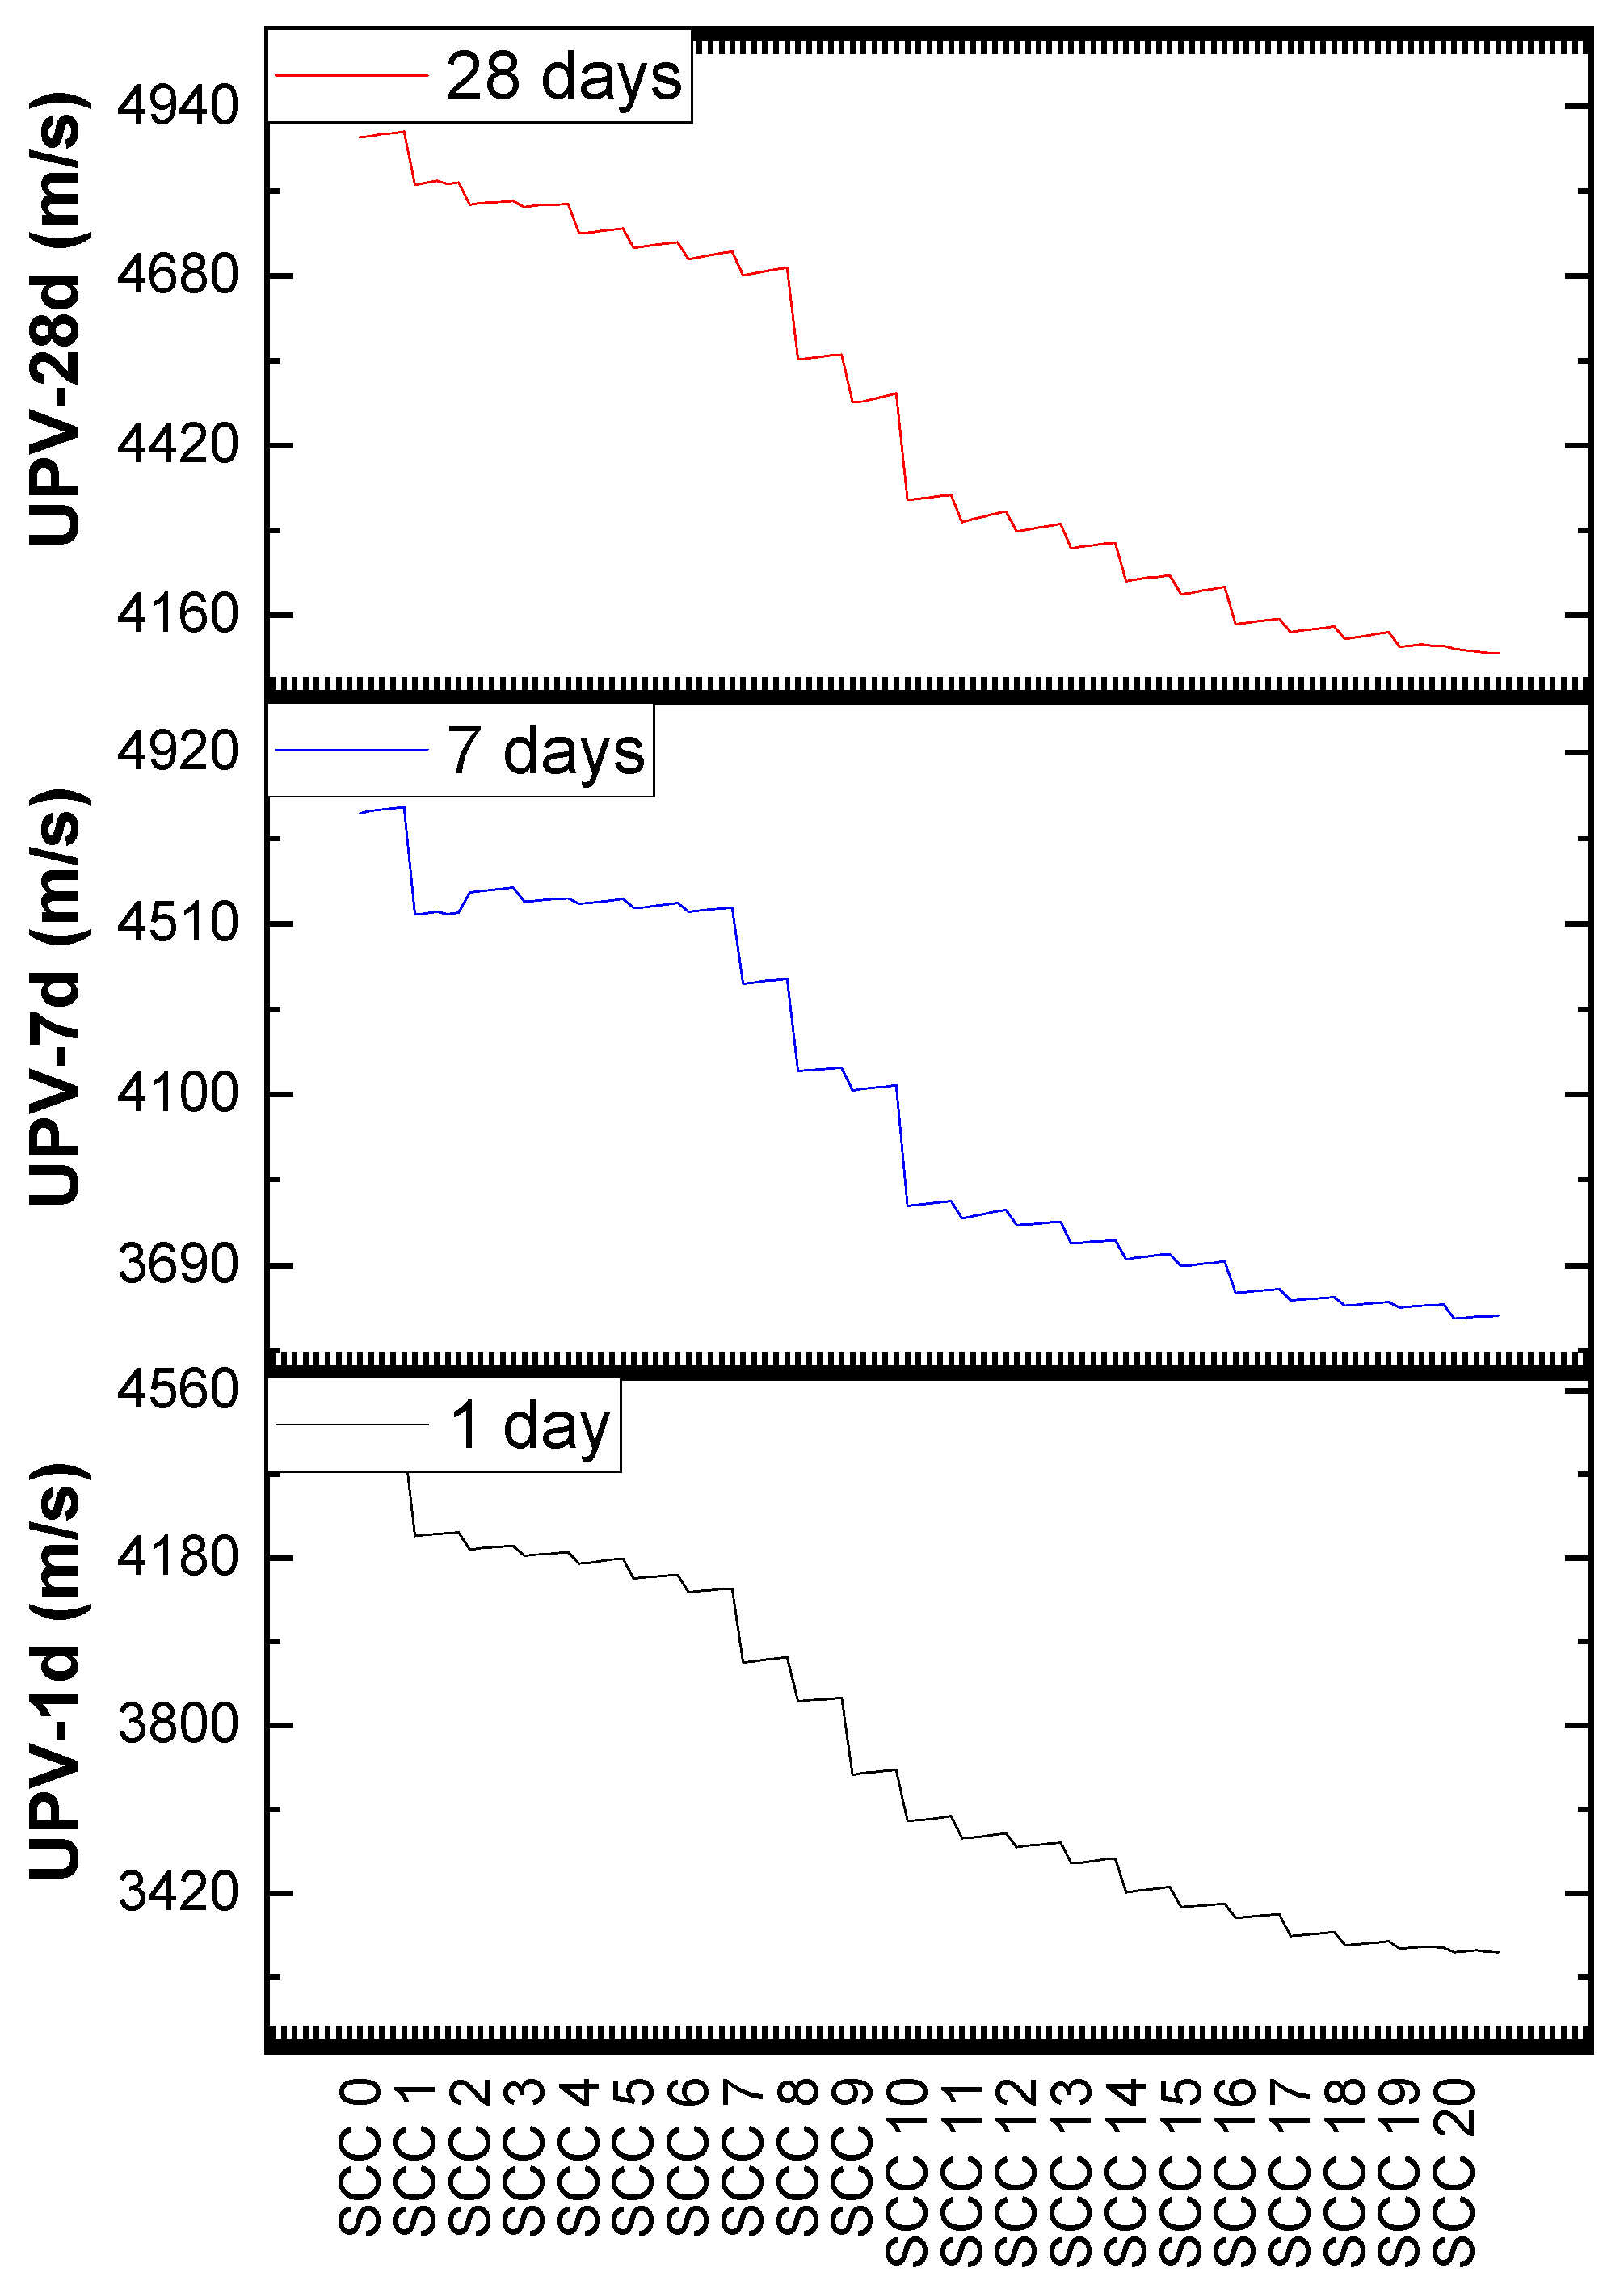
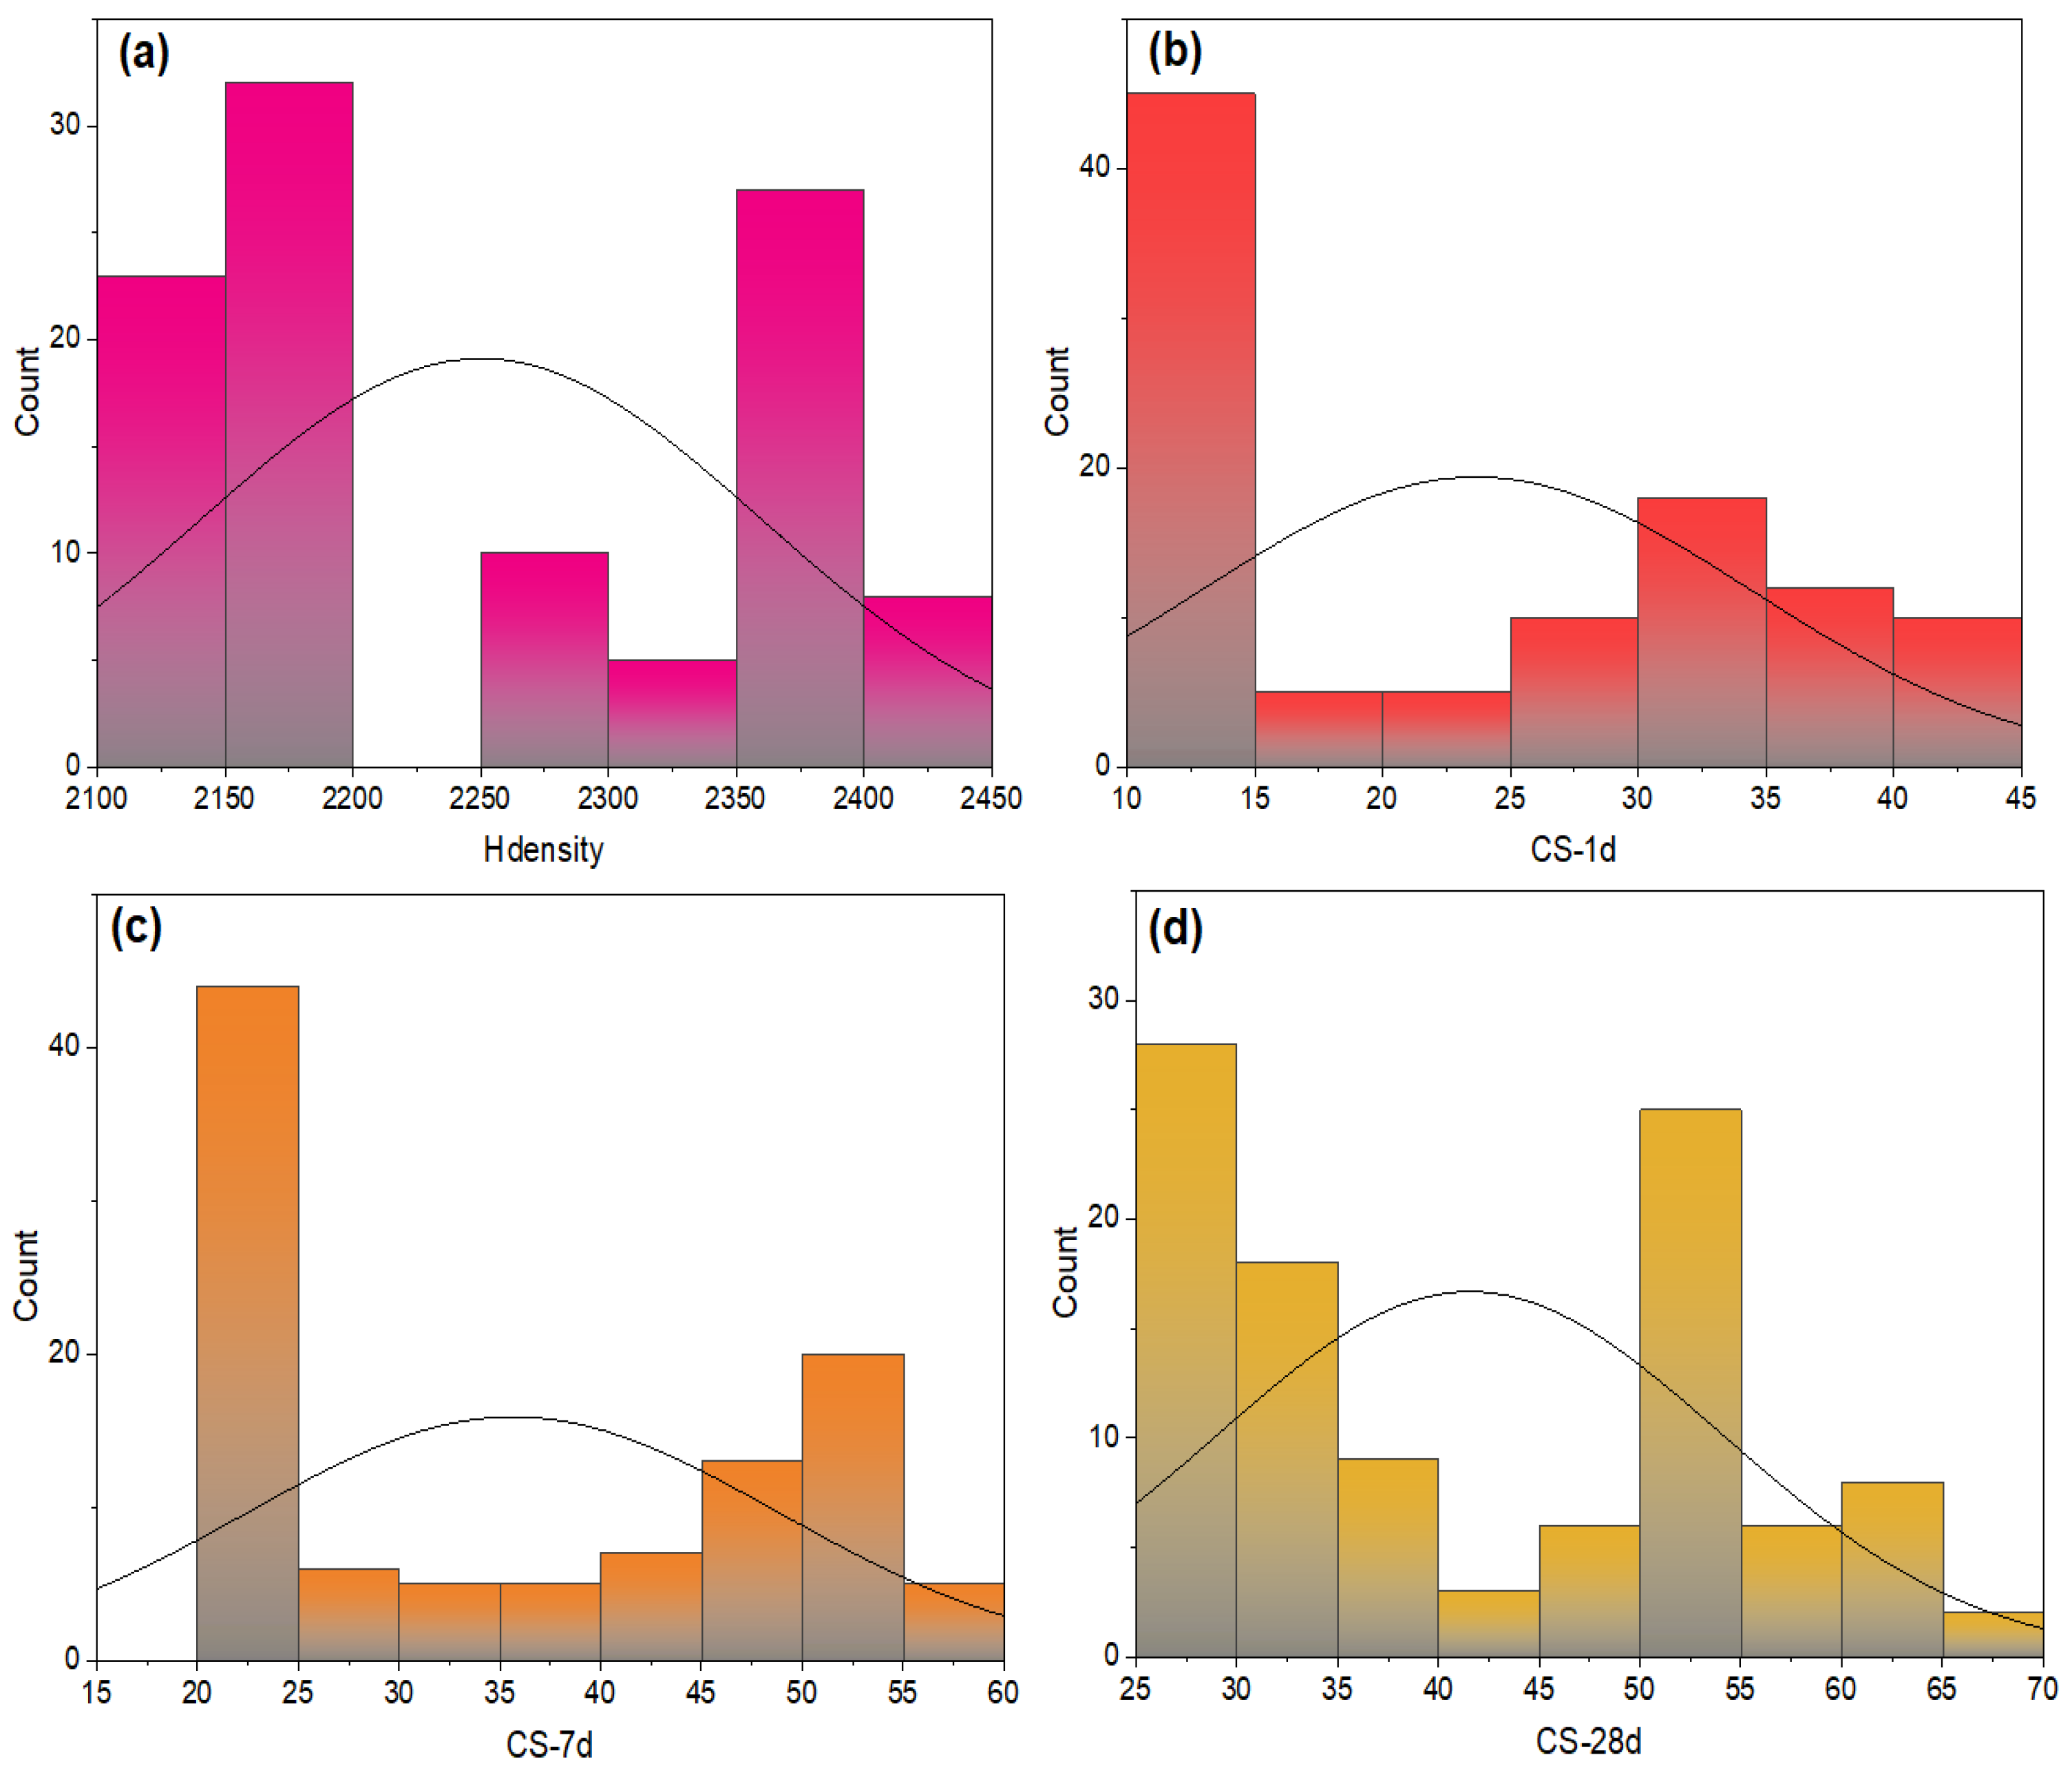
4.2. Experimental Data

The experimental data collected included measurements for each combination of air content and substitution rate. For each mixture, the compressive strength, ultrasonic velocity, and density were recorded [31]. Each mixture was tested five times, resulting in a total of 105 experimental data points to analyze. The hydraulic press utilized for testing the compressive strength of the concrete specimens is shown in Figure 4.
Table 2 offers a detailed view of the properties of SCC in its hardened state, providing essential data on its mechanical strength after the curing process. Each row represents a specific mix of SCC, labeled from SCC 0 to SCC 20, with corresponding values for hardened density; compressive strength (CS) at 1 day, 7 days, and 28 days;and ultrasonic velocity (UPV) in the hardened state at the corresponding ages.
Analysis of Table 2 reveals that the compressive strength (CS) and ultrasonic velocity (UPV) of SCC both increase with curing age, showing the typical hydration behavior of concrete. As the concentration of air-entraining admixtures (AEAs) increases from SCC 0 to SCC 20, there is a general trend for compressive strength to decrease, indicating that AEAs may adversely affect the cohesion and durability of concrete (Figure 5). Likewise, higher ultrasonic velocities, which correlate with higher compressive strengths, indicate improved concrete quality (Figure 6). The data highlights the importance of optimizing AEA concentration in SCC blends to achieve the desired balance between mechanical strength and durability, underscoring the need for additional research to fully understand the interplay between AEA dosage, concrete properties, and performance.
The values in Table 3 summarize the central tendency and variability of compressive strength and ultrasonic velocity measurements for SCC across all tested combinations of AEA concentrations. The mean compressive strengths at 1, 7, and 28 days indicate typical strength development over time, while the standard deviation and range (minimum to maximum) highlight the variability influenced by different AEA concentrations. Similarly, the mean ultrasonic velocities at 1, 7, and 28 days reflect changes in concrete quality as it hardens, with variability suggesting inconsistencies in mix or curing conditions. This statistical summary emphasizes the need to optimize AEA concentrations in SCC mixes to achieve desired mechanical properties and uniform quality, providing a benchmark for expected performance and highlighting the importance of controlling mix parameters for consistent and reliable SCC properties.
The input parameters for the model included hardened density (Hdensity), ultrasonic pulse velocity measurements at 1 day (UPV-1d), 7 days (UPV-7d), and 28 days (UPV-28d), and compressive strengths at 1 day (CS-1d) and 7 days (CS-7d). The output is the compressive strength at 28 days (CS-28d).
The distributions of the numeric values of the input and output parameters provide a clear understanding of the variability and range within the dataset (Figure 7 and Figure 8). These distributions are crucial for identifying potential issues such as skewness, outliers, or the need for further data preprocessing. Analyzing the distributions helps to ensure that the data is appropriately balanced and representative of the range of conditions being studied. For instance, skewed distributions may indicate that certain values are over- or under-represented, necessitating normalization or transformation of the data. Outliers, on the other hand, can significantly impact the performance of predictive models, highlighting the need for their detection and potential exclusion or treatment. Understanding these distributions allows for more accurate and reliable modeling by addressing these issues proactively, ensuring the robustness of the predictive analysis.

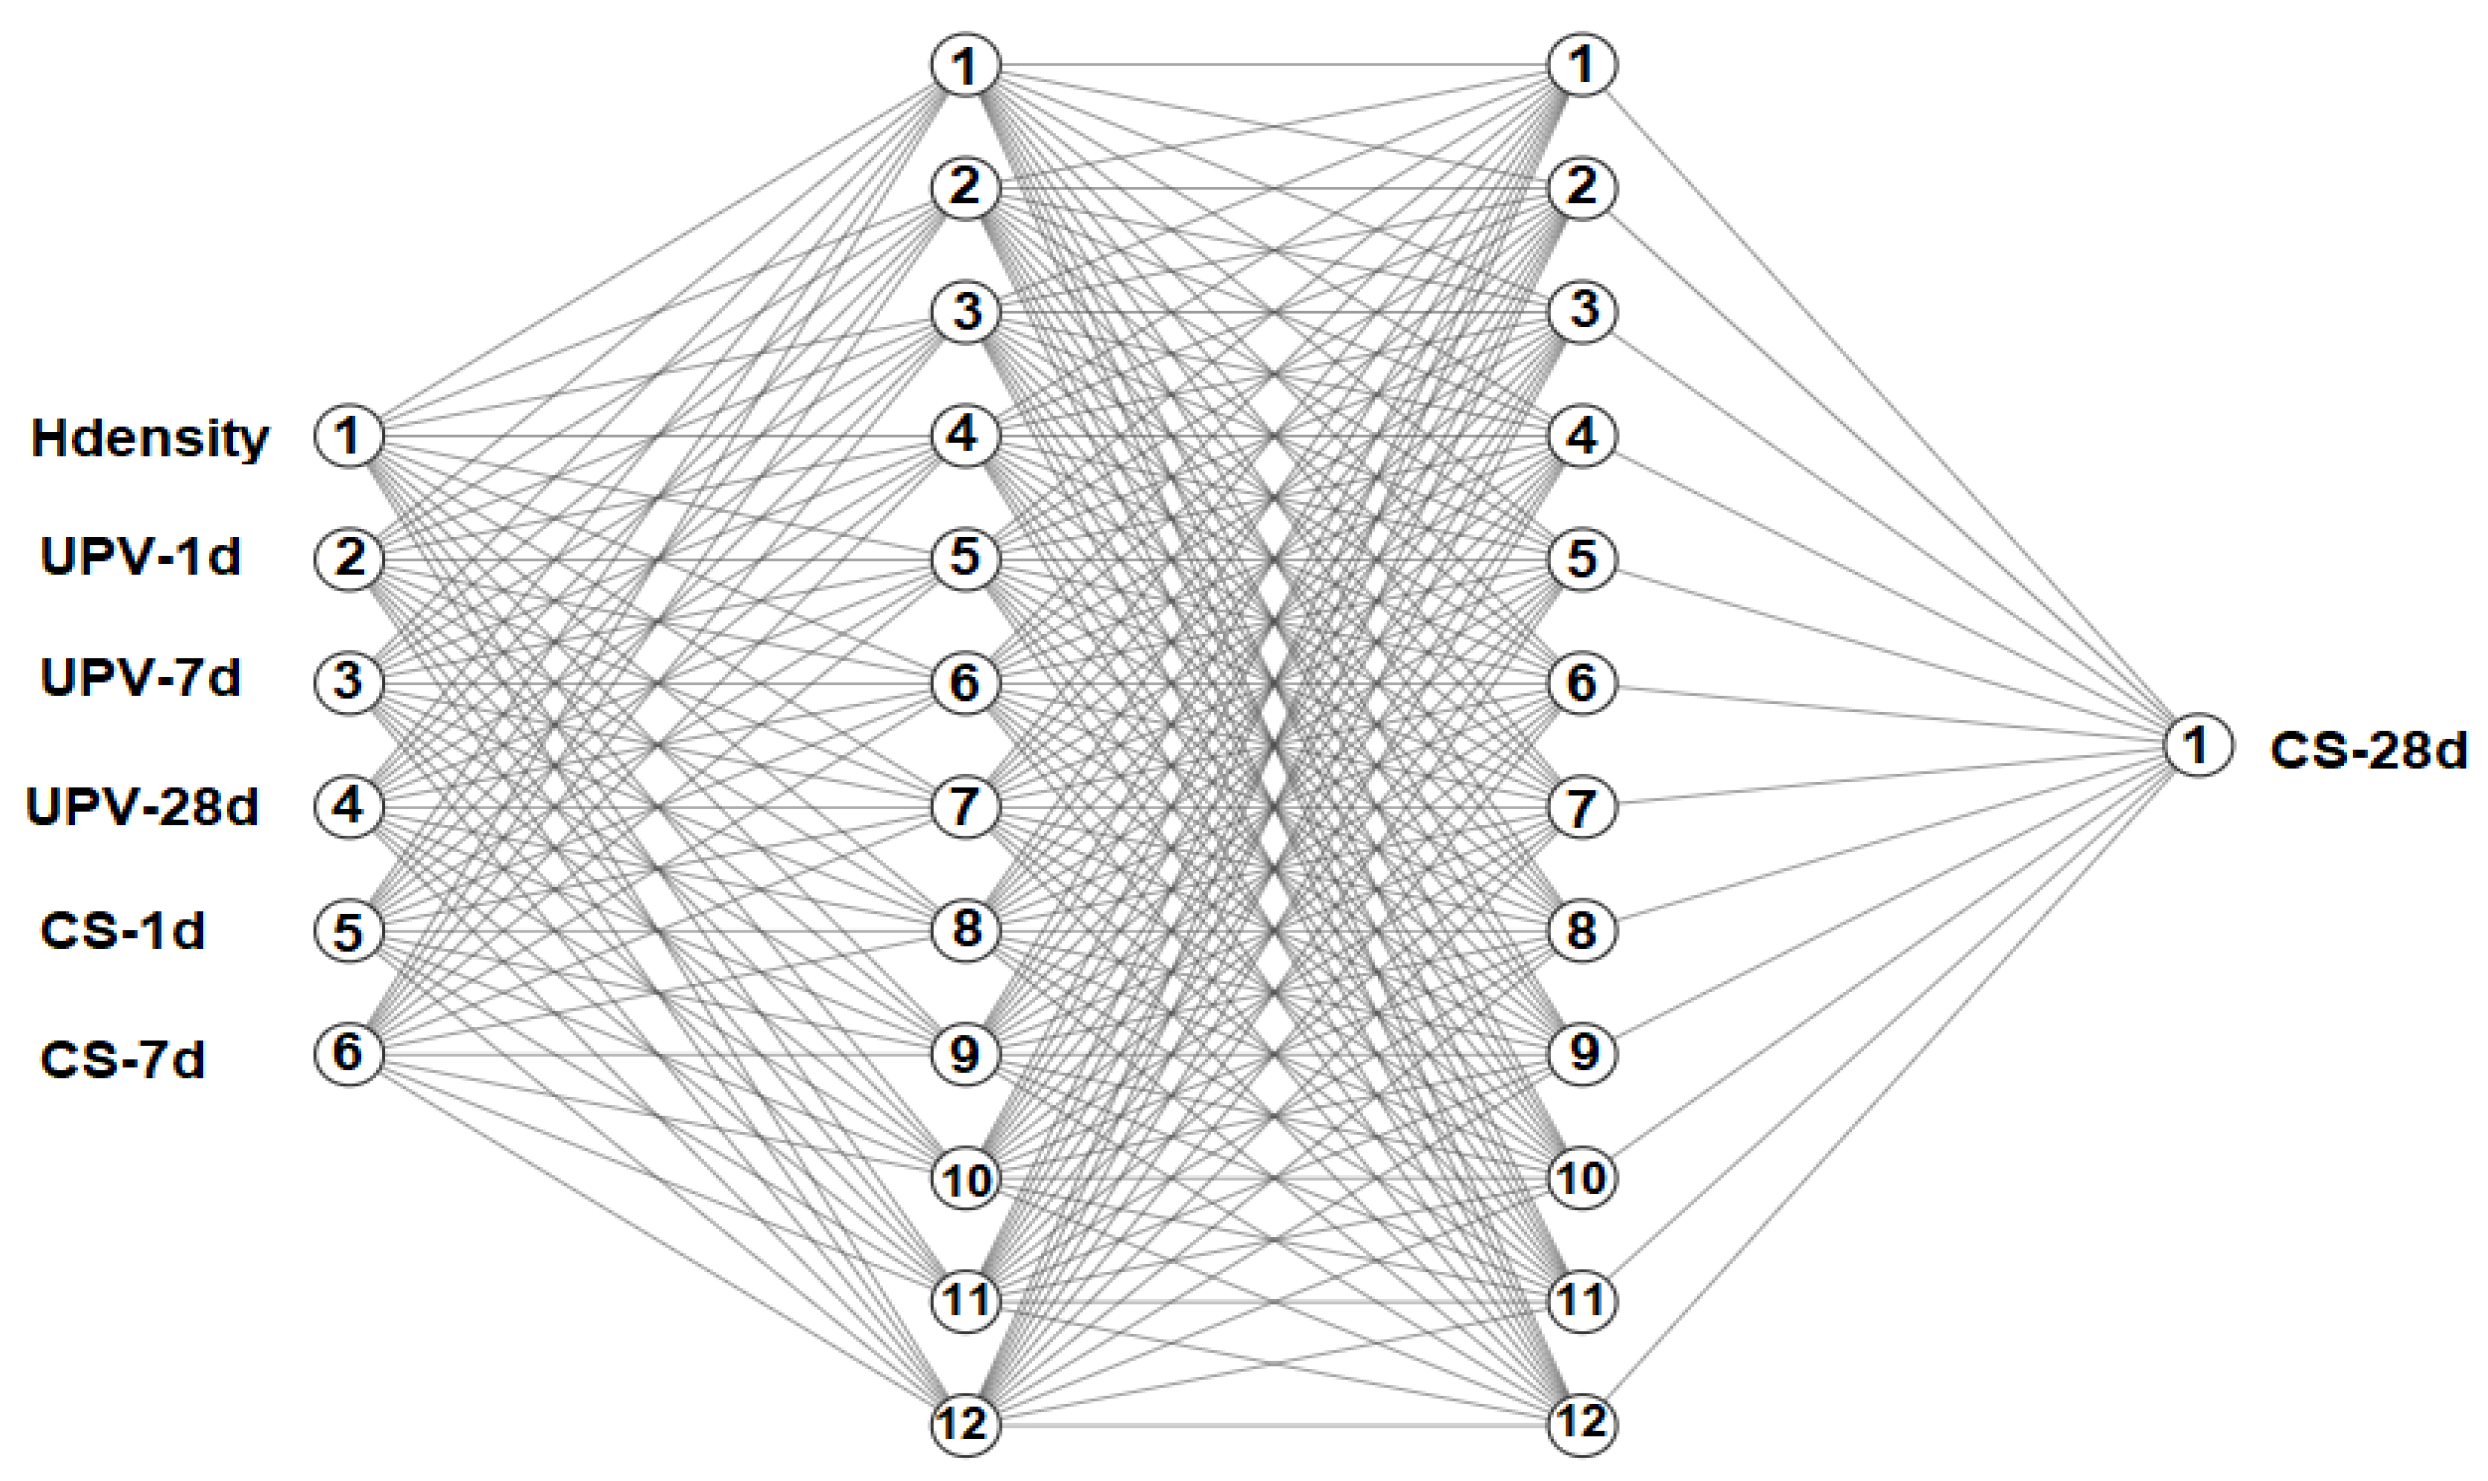
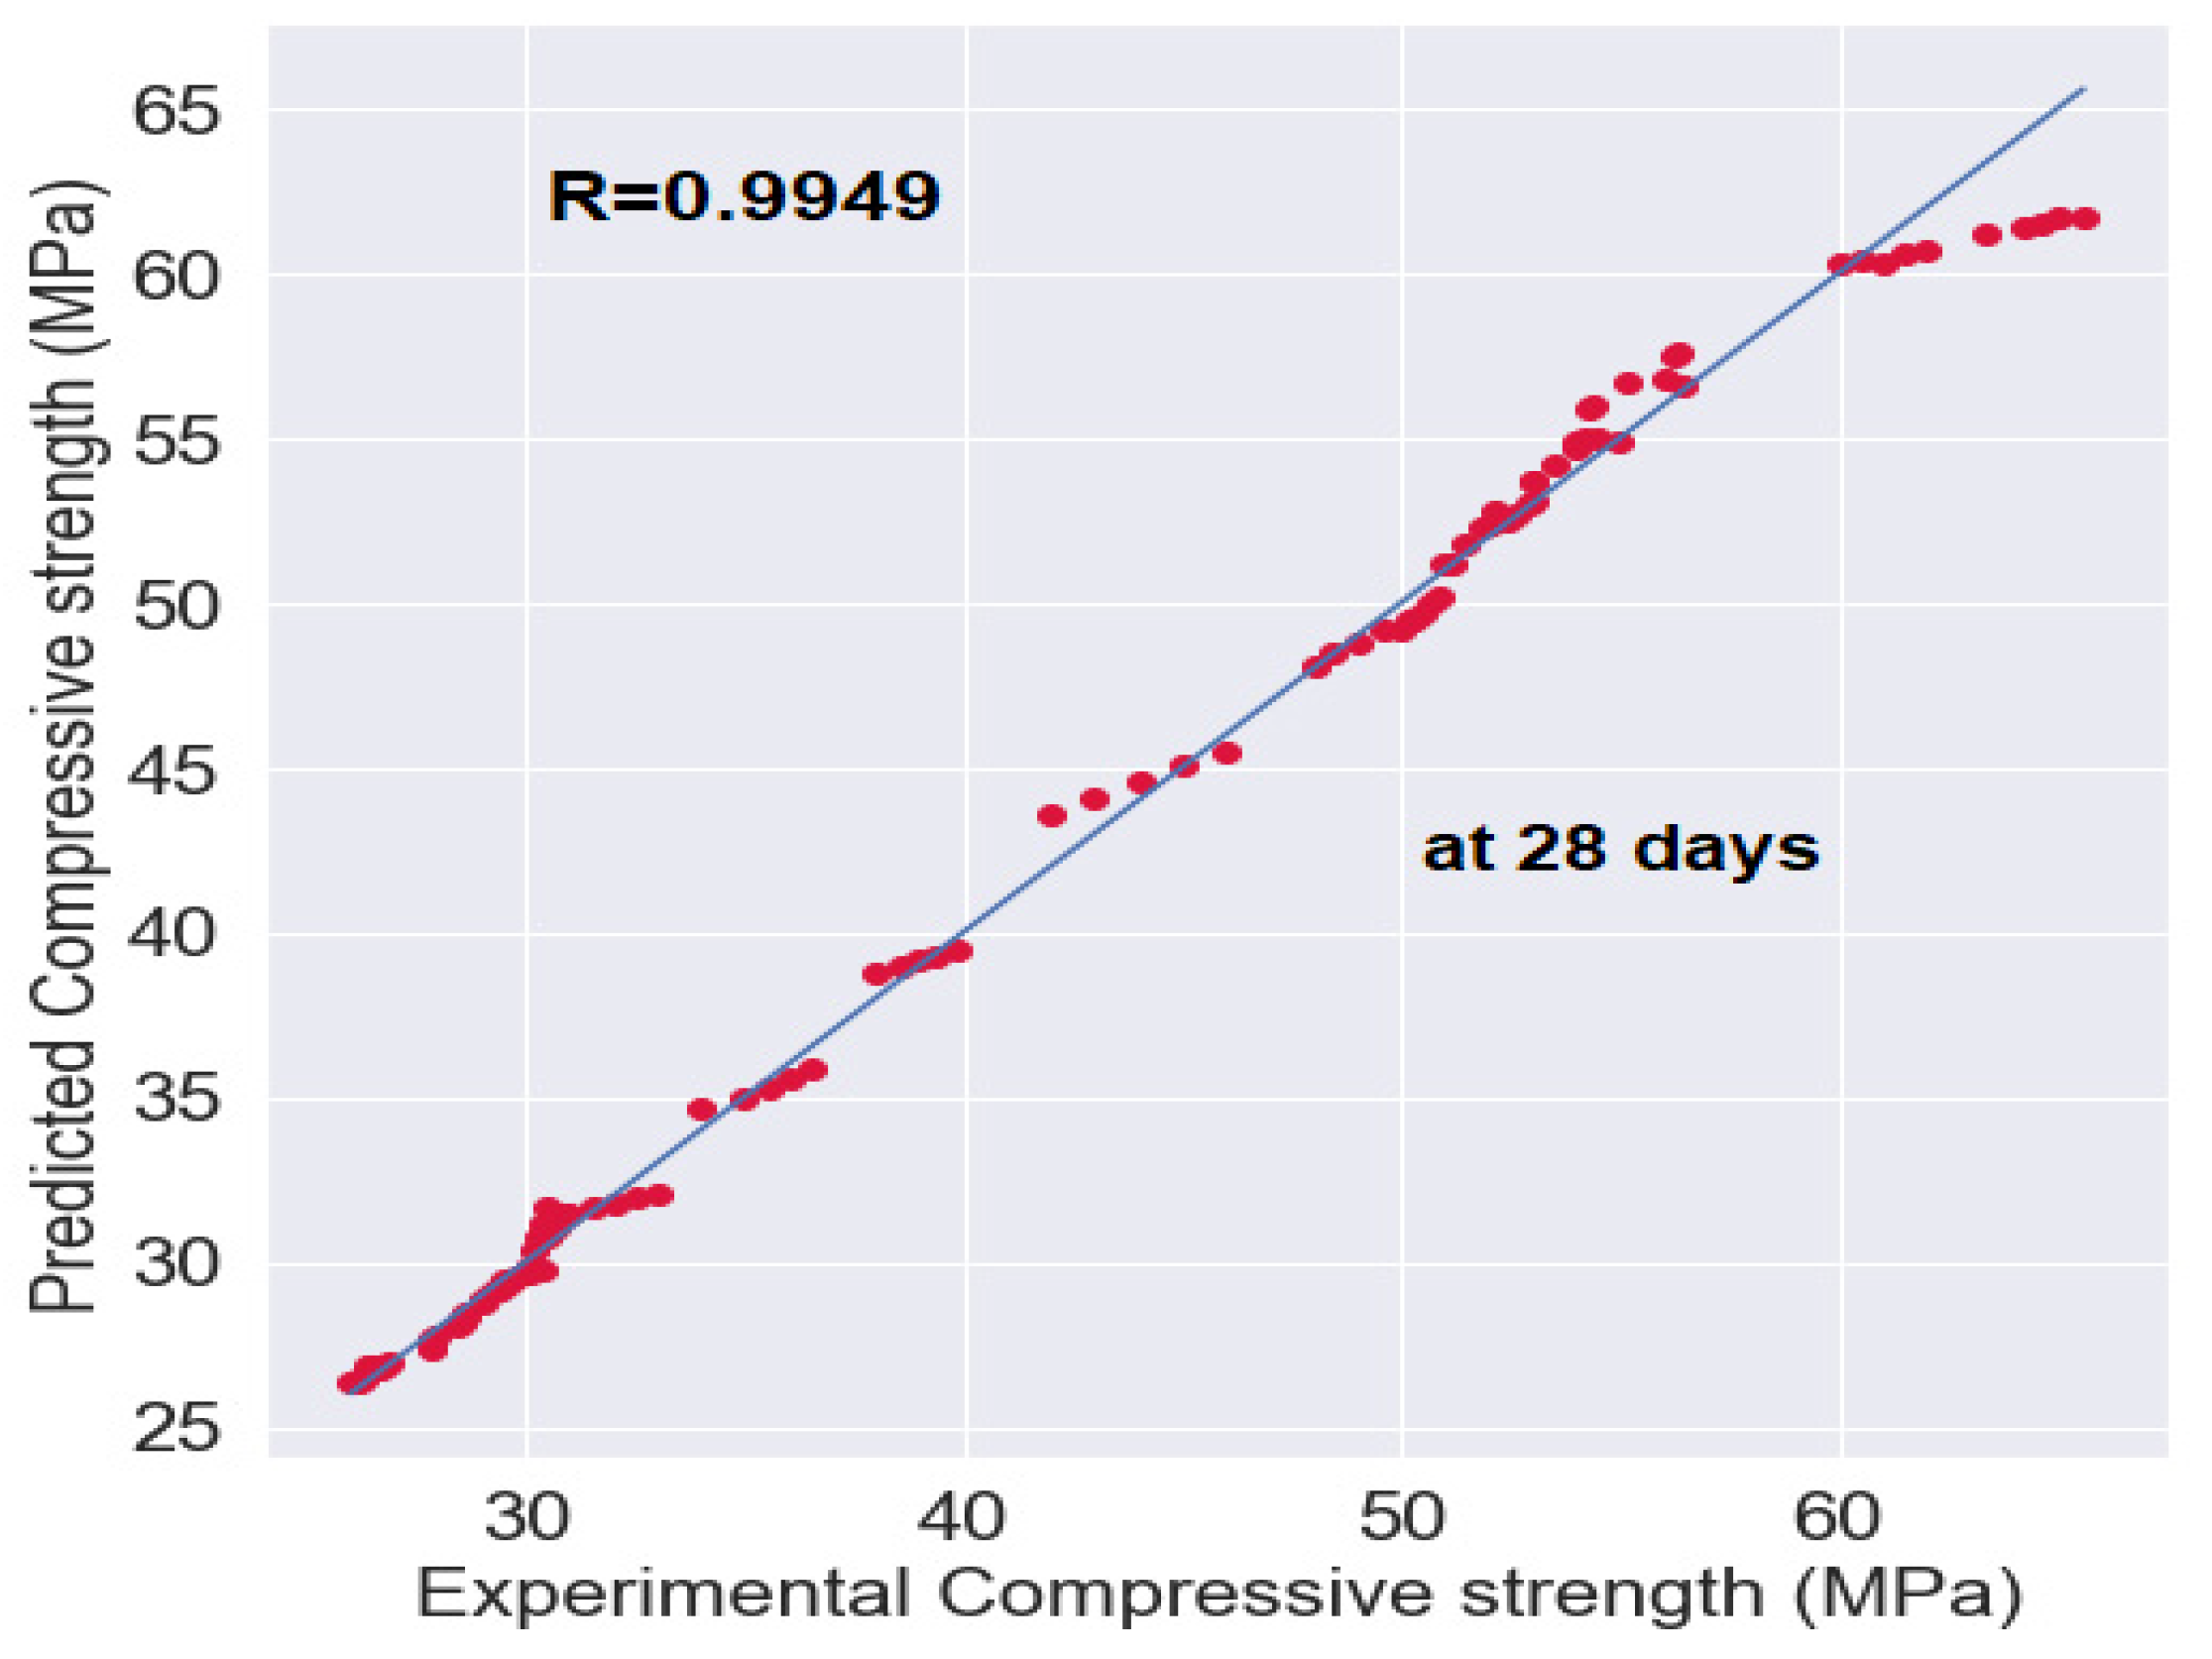
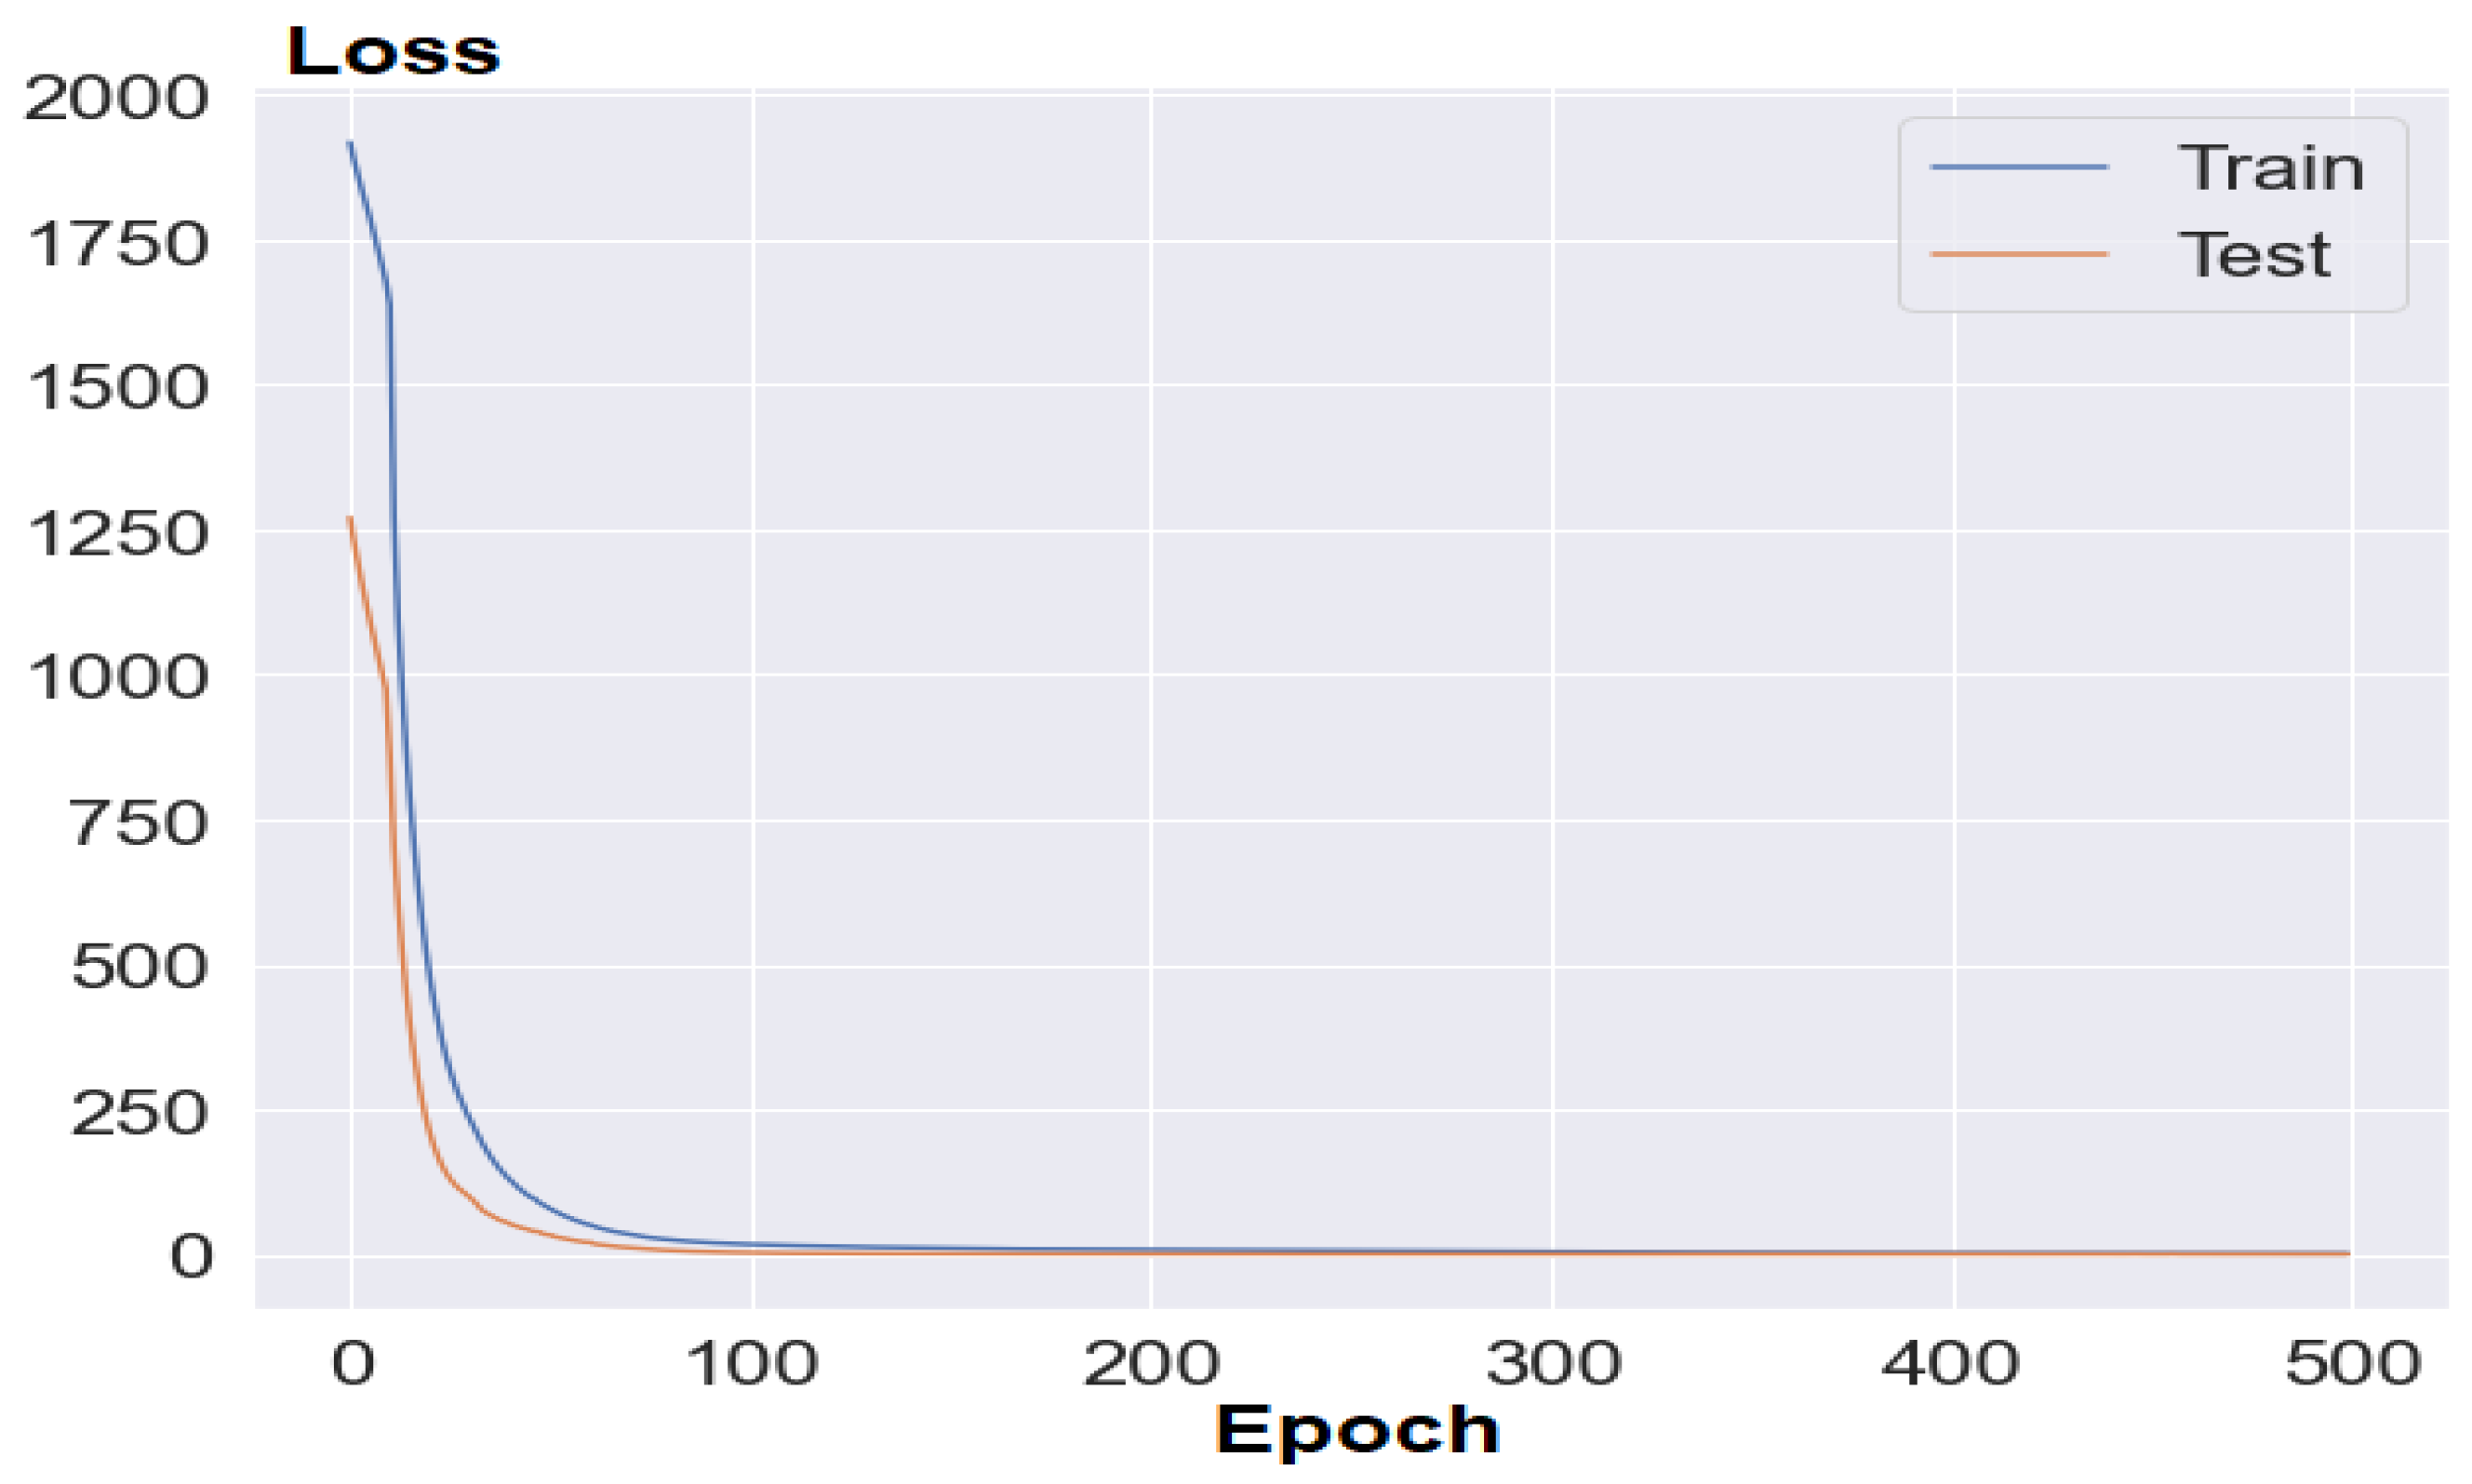
4.3. BPNN Model Analysis

The analysis of the BPNN model in this research employed a k-fold cross-validation technique to rigorously evaluate the effectiveness of our predictive models, incorporating both multi-variable regression and ANN approaches. We used a 10-fold cross-validation strategy to ensure robust and reliable validation. In this method, one fold was used for testing the model, while the remaining nine folds were used for training. The analysis of the BPNN model’s effectiveness was evaluated using a 10-fold cross-validation strategy, as depicted in Figure 9. This process was repeated iteratively, with each fold serving as the testing set once and the others for training, until all ten folds had been utilized as the testing set. This comprehensive approach ensures that each data point is used for both training and testing, thereby reducing bias and providing a more accurate assessment of the model’s performance. By rotating the testing set through all folds, we achieve a balanced evaluation, ensuring our models are generalizable and reliable across different data subsets.
Multiple configurations were tested to achieve a regression coefficient (R2) closer to 1, indicating better predictive accuracy. Through this process, the selected architecture was found to provide an optimal balance between model complexity and performance, ensuring effective learning from the data and reliable predictions for new samples.
The study’s outcomes were generated using two prominent open-source Python libraries, Scikit-learn and Keras, which are specifically designed for developing and evaluating machine learning and deep learning models. A 10-fold cross-validation (K-fold) approach was used to ensure the robustness and reliability of the model. The network architecture comprised two hidden layers, with each hidden layer containing 10 neurons. The model was trained over 500 epochs, using various transfer functions, such as linear, tanh, and relu. The mean squared error (MSE) was selected as the cost function to evaluate model performance. Standard scaler normalization was applied to the input data to standardize the feature values. Initial weights and biases were set to zero, and the learning rate was fixed at 0.001. These carefully chosen parameters and methodological approaches facilitated the effective training and assessment of the ANN models, ensuring accurate and reliable predictions [32].
The developed ANN models were ranked based on the mean Pearson’s linear coefficient of determination (R) value. The optimal back-propagation neural network (BPNN) model for predicting compressive strength at 28 days was identified as the 6-12-12-1 architecture (Figure 10). This model achieved a mean R value of 0.9949 with 500 epochs, utilizing tanh activation functions for the first and second hidden layers and a reluactivation function for the output layer (Figure 11). This high R value indicates an excellent correlation between the predicted and actual values, showcasing the model’s robustness and accuracy in predicting the compressive strength at 28 days of SCC based on the six input parameters.
Figure 12 compares the true experimental values with the predicted values from the optimal BPNN model for compressive strength. These results demonstrate that the predicted compressive strength values of SCC, obtained from the multilayer feed-forward back-propagation neural network with 500 epochs, are very close to the experimental results, highlighting the effectiveness and accuracy of the ANN models in predicting the compressive strength of SCC.
Thus, the graph illustrating loss versus epochs reveals significant insights into the training process and performance of the ANNs model (Figure 13). During the initial stages of training, there is a rapid decline in the loss values, indicating that the model is effectively learning and improving its performance by adjusting the weights to minimize the error. This steep reduction in loss signifies that the model quickly captures the underlying patterns in the data. As training progresses, the rate of loss reduction slows down, suggesting that the model is approaching its optimal performance. The eventual plateau of the loss curve indicates that the model has learned the dataset’s intricacies, and further training may not significantly enhance its performance. This behavior confirms the model’s ability to generalize well, provided there is no significant divergence between training and validation losses, which would indicate overfitting.

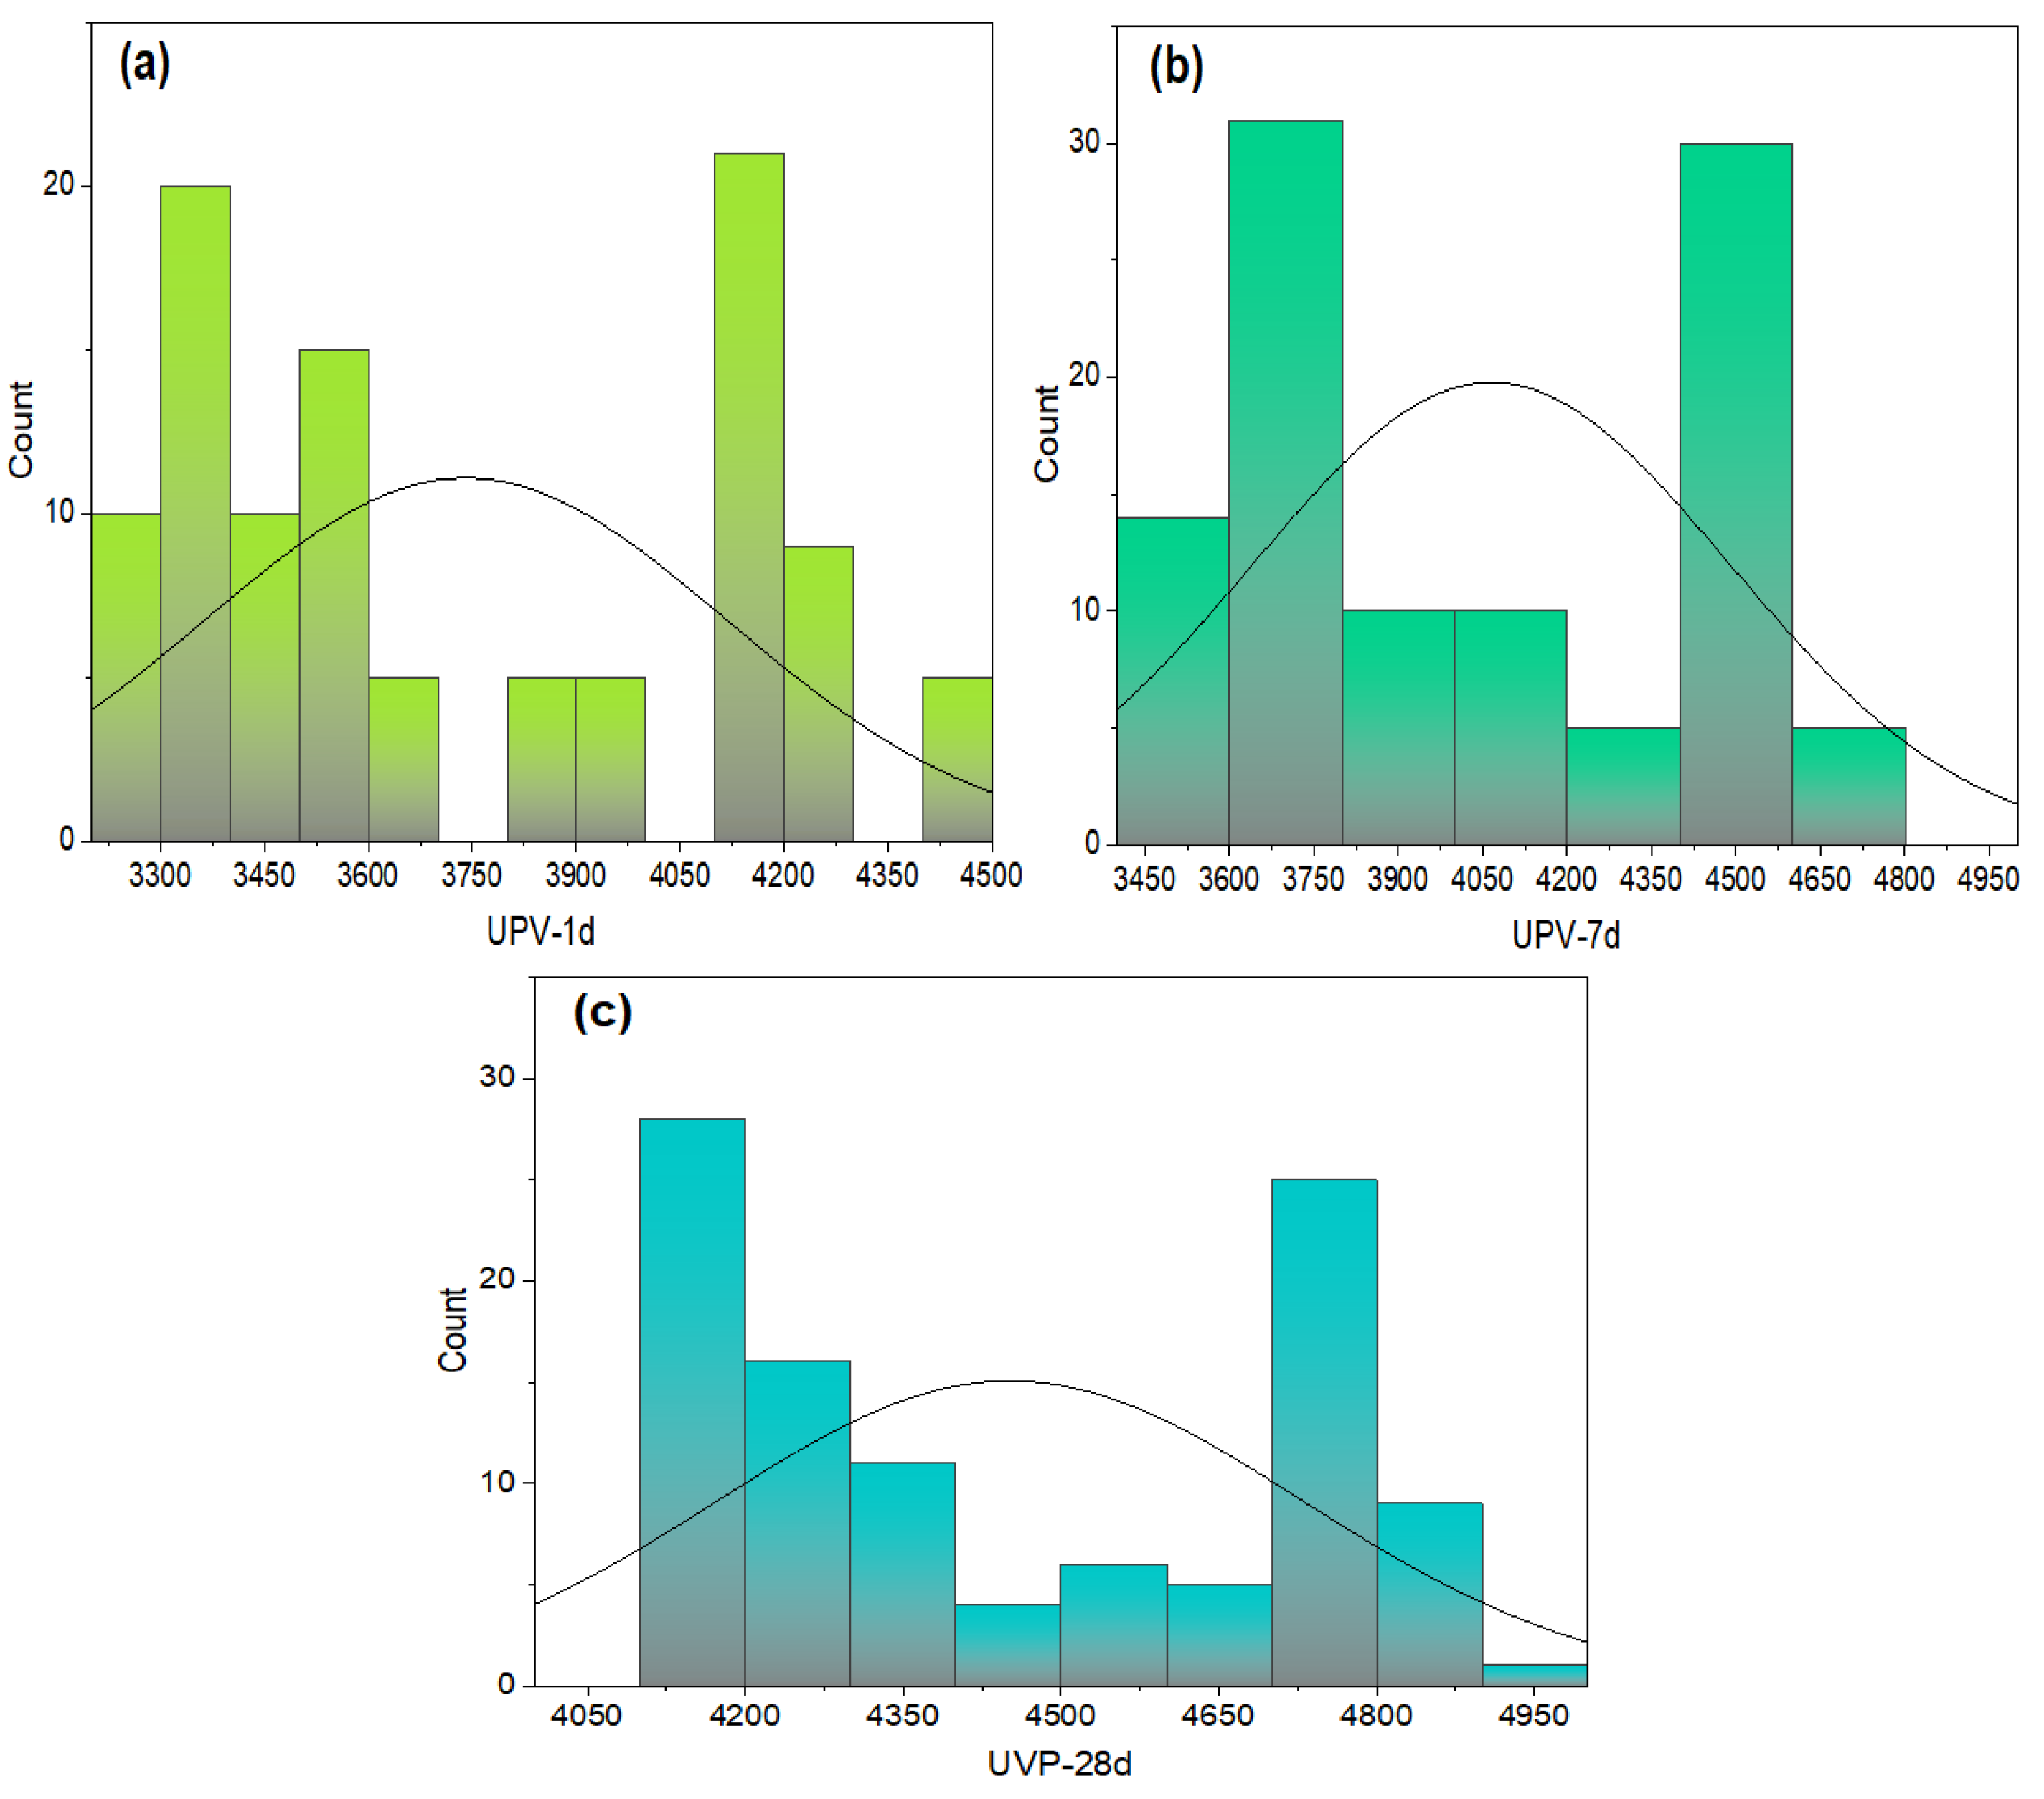
4.4. Analysis and Prediction of Ultrasonic Velocity and Compressive Strength

The analysis and prediction of ultrasonic velocity and compressive strength of self-compacting concrete (SCC) are critical for optimizing concrete mix designs for various construction applications. This section delves into the intricate relationships between the input parameters (Hdensity, UPV-1d, UPV-7d, UPV-28d, CS-1d, and CS-7d) and the output parameter (CS-28d). By employing statistical methods and machine learning techniques, we aim to develop predictive models that accurately forecast the 28-day compressive strength of SCC based on other measured parameters.
The heatmap (Figure 14) illustrates the Pearson correlation coefficients between all input and output parameters, providing a comprehensive view of the relationships and the direction of these correlations. The correlation coefficients highlight robust associations, with strong positive or negative R values indicating significant relationships.
Additionally, scatter plots (Figure 15) depict the connections between the input parameters and the output parameter, offering visual insights into how variations in the input parameters impact the compressive strength of SCC. These graphical representations help in understanding the dependencies and interactions within the dataset, guiding the development of more accurate and reliable predictive models.
The application of AI for predicting compressive strength in SCC represents a significant advancement in construction technology. By leveraging ANNs to analyze UPV measurements, this study provides a robust tool for real-time quality control during concrete production. The ability to predict compressive strength non-destructively allows engineers to make immediate adjustments to the concrete mix, enhancing consistency and reliability in structural performance. This AI-driven approach not only streamlines the quality control process but also reduces the need for extensive trial mixes and destructive testing, leading to cost savings and more sustainable construction practices.

5. Conclusions

Our study demonstrates the efficacy of artificial intelligence techniques, specifically ANN models, in predicting compressive strength in SCC based on ultrasonic measurements. By analyzing the relationships between input parameters such as hardened density, ultrasonic pulse velocity, and compressive strength, we revealed valuable insights into the behavior of SCC mixes. The observed decrease in compressive strength with higher AEA concentrations emphasizes the need for careful optimization of AEA dosages to maintain desired mechanical properties while ensuring durability. Additionally, the positive correlation between ultrasonic velocity and compressive strength highlights the potential for ultrasonic measurements as a reliable indicator of concrete quality.
The ANN models developed in this study showed high accuracy in predicting compressive strength, with R2 values consistently above 0.99, indicating strong predictive performance. The Pearson correlation coefficients between UPV at 1 day, 7 days, and 28 days and the corresponding compressive strength values were exceptionally high, at 0.98 and 0.99. These results underscore the robustness of UPV as a predictor of compressive strength and validate the use of ANNs for this purpose.
The integration of ANN models with ultrasonic testing presents a significant step forward in non-destructive evaluation methods, providing a rapid, accurate, and cost-effective means of assessing concrete properties in situ. The findings from this study underscore the importance of leveraging AI and advanced computational methods to address challenges in concrete technology. By providing a robust framework for predicting compressive strength, this research facilitates better decision-making and optimization in the construction industry, ultimately contributing to more sustainable and efficient building practices.

Funding

This research received no external funding.

Institutional Review Board Statement

Not applicable.

Informed Consent Statement

Not applicable.

Data Availability Statement

The raw data supporting the conclusions of this article will be made available by the authors on request.

Conflicts of Interest

The author declares no conflicts of interest.

References

  1. Rasekh, H.; Joshaghani, A.; Jahandari, S.; Aslani, F.; Ghodrat, M. Rheology and Workability of SCC. In Self-Compacting Concrete: Materials, Properties and Applications; Elsevier: Amsterdam, The Netherlands, 2020; pp. 31–63. [Google Scholar]
  2. Ramkumar, K.B.; Kannan Rajkumar, P.R.; Noor Ahmmad, S.; Jegan, M. A Review on Performance of Self-Compacting Concrete—Use of Mineral Admixtures and Steel Fibres with Artificial Neural Network Application. Constr. Build. Mater. 2020, 261, 120215. [Google Scholar] [CrossRef]
  3. Ashish, D.K.; Verma, S.K. An Overview on Mixture Design of Self-compacting Concrete. Struct. Concr. 2019, 20, 371–395. [Google Scholar] [CrossRef]
  4. Benaicha, M.; Jalbaud, O.; Hafidi Alaoui, A.; Burtschell, Y. Porosity Effects on Rheological and Mechanical Behavior of Self-Compacting Concrete. J. Build. Eng. 2022, 48, 103964. [Google Scholar] [CrossRef]
  5. Mandal, R.; Panda, S.K.; Nayak, S. Rheology of Concrete: Critical Review, Recent Advancements, and Future Prospectives. Constr. Build. Mater. 2023, 392, 132007. [Google Scholar] [CrossRef]
  6. Wang, Y.; Iqtidar, A.; Amin, M.N.; Nazar, S.; Hassan, A.M.; Ali, M. Predictive Modelling of Compressive Strength of Fly Ash and Ground Granulated Blast Furnace Slag Based Geopolymer Concrete Using Machine Learning Techniques. Case Stud. Constr. Mater. 2024, 20, e03130. [Google Scholar] [CrossRef]
  7. Aslam, F.; Shahab, M.Z. Supplementary Cementitious Materials in Blended Cement Concrete: Advancements in Predicting Compressive Strength through Machine Learning. Mater. Today Commun. 2024, 38, 107725. [Google Scholar] [CrossRef]
  8. Boccacci, G.; Frasca, F.; Bertolin, C.; Siani, A.M. Diagnosis of Historic Reinforced Concrete Buildings: A Literature Review of Non-Destructive Testing (NDT) Techniques. Procedia Struct. Integr. 2024, 55, 160–167. [Google Scholar] [CrossRef]
  9. Sathiparan, N.; Jeyananthan, P.; Subramaniam, D.N. Surface Response Regression and Machine Learning Techniques to Predict the Characteristics of Pervious Concrete Using Non-Destructive Measurement: Ultrasonic Pulse Velocity and Electrical Resistivity. Measurement 2024, 225, 114006. [Google Scholar] [CrossRef]
  10. Kouddane, B.; Sbartaï, Z.M.; Elachachi, S.M.; Lamdouar, N. New Multi-Objective Optimization to Evaluate the Compressive Strength and Variability of Concrete by Combining Non-Destructive Techniques. J. Build. Eng. 2023, 77, 107526. [Google Scholar] [CrossRef]
  11. Abbass, W.; Aslam, F.; Ahmed, M.; Ahmed, A.; Alyousef, R.; Mohamed, A. Predicting the Performance of Existing Pre-Cast Concrete Pipes Using Destructive and Non-Destructive Testing Techniques. Heliyon 2023, 9, e15471. [Google Scholar] [CrossRef]
  12. Wang, Y.; Mukherjee, A.; Castel, A. Non-Destructive Monitoring of Incipient Corrosion in Reinforced Concrete with Top-Bar Defect Using a Combination of Electrochemical and Ultrasonic Techniques. Constr. Build. Mater. 2022, 360, 129346. [Google Scholar] [CrossRef]
  13. Asteris, P.G.; Skentou, A.D.; Bardhan, A.; Samui, P.; Lourenço, P.B. Soft Computing Techniques for the Prediction of Concrete Compressive Strength Using Non-Destructive Tests. Constr. Build. Mater. 2021, 303, 124450. [Google Scholar] [CrossRef]
  14. Wang, L.; Zhang, Q.; Yi, J.; Zhang, J. Effects of Coral Aggregate Properties on the Ultrasonic Pulse Velocity of Concrete. J. Build. Eng. 2023, 80, 107935. [Google Scholar] [CrossRef]
  15. Moura, M.A.d.N.; Moreno, A.L.; Ferreira, G.C.d.S. Ultrasonic Testing on Evaluation of Concrete Residual Compressive Strength: A Review. Constr. Build. Mater. 2023, 373, 130887. [Google Scholar] [CrossRef]
  16. Trtnik, G.; Kavčič, F.; Turk, G. Prediction of Concrete Strength Using Ultrasonic Pulse Velocity and Artificial Neural Networks. Ultrasonics 2009, 49, 53–60. [Google Scholar] [CrossRef]
  17. Ansari, M.A.; Ansari, S.S.; Ghazi, M.S.; Saqib, M.; Ibrahim, S.M.; Saquib, M. Incorporating Non-Destructive UPV into Machine Learning Models for Predicting Compressive Strength in SCM Concrete. Mater. Today Proc. 2024, 4, 59–67. [Google Scholar] [CrossRef]
  18. Pazouki, G.; Tao, Z.; Saeed, N.; Kang, W.-H. Using Artificial Intelligence Methods to Predict the Compressive Strength of Concrete Containing Sugarcane Bagasse Ash. Constr. Build. Mater. 2023, 409, 134047. [Google Scholar] [CrossRef]
  19. Pal, A.; Ahmed, K.S.; Hossain, F.Z.; Alam, M.S. Machine Learning Models for Predicting Compressive Strength of Fiber-Reinforced Concrete Containing Waste Rubber and Recycled Aggregate. J. Clean. Prod. 2023, 423, 138673. [Google Scholar] [CrossRef]
  20. Mehta, V. Machine Learning Approach for Predicting Concrete Compressive, Splitting Tensile, and Flexural Strength with Waste Foundry Sand. J. Build. Eng. 2023, 70, 106363. [Google Scholar] [CrossRef]
  21. Mohammed, B.S.; Azmi, N.J.; Abdullahi, M. Evaluation of Rubbercrete Based on Ultrasonic Pulse Velocity and Rebound Hammer Tests. Constr. Build. Mater. 2011, 25, 1388–1397. [Google Scholar] [CrossRef]
  22. Marie, I. Zones of Weakness of Rubberized Concrete Behavior Using the UPV. J. Clean. Prod. 2016, 116, 217–222. [Google Scholar] [CrossRef]
  23. Shi, M.; Jeong, D.H.; Lee, S.W.; Choi, Y. Relationship between UPV and Strength of Rubber-Concrete. Defect Diffus. Forum; Trans Tech Publications Ltd: Zurich, Switzerland, 2018; pp. 225–229. [Google Scholar] [CrossRef]
  24. Ramlan, M.R.; Shahidan, S.; Zuki, S.S.M.; Abdullah, S.R.; Ibrahim, M.H.W.; Rahim, M.A. Strength and Quality Assessment of Recycled Aggregate and Crumb Rubber Concrete Using the Ultra Pulse Velocity Method. In Proceedings of AICCE’19; Springer International Publishing: Berlin/Heidelberg, Germany, 2020; pp. 799–806. [Google Scholar]
  25. Boudjedra, F.; Benouis, A.; Boudaoud, Z. Estimation of Rubber Waste Concrete Properties by Ultrasonic Velocities: Effect of Transducers’ Diameters and Frequencies. Civ. Environ. Eng. Rep. 2020, 30, 200–220. [Google Scholar] [CrossRef]
  26. Girskas, G.; Nagrockienė, D. Crushed Rubber Waste Impact of Concrete Basic Properties. Constr. Build. Mater. 2017, 140, 36–42. [Google Scholar] [CrossRef]
  27. Meddah, M.S.; Zitouni, S.; Belâabes, S. Effect of Content and Particle Size Distribution of Coarse Aggregate on the Compressive Strength of Concrete. Constr. Build. Mater. 2010, 24, 505–512. [Google Scholar] [CrossRef]
  28. Hunag, L.-J.; Wang, H.-Y.; Wu, Y.-W. Properties of the Mechanical in Controlled Low-Strength Rubber Lightweight Aggregate Concrete (CLSRLC). Constr. Build. Mater. 2016, 112, 1054–1058. [Google Scholar] [CrossRef]
  29. Benaicha, M.; Jalbaud, O.; Roguiez, X.; Hafidi Alaoui, A.; Burtschell, Y. Prediction of Self-Compacting Concrete Homogeneity by Ultrasonic Velocity. Alex. Eng. J. 2015, 54, 1181–1191. [Google Scholar] [CrossRef]
  30. Ben aicha, M.; Burtschell, Y.; Alaoui, A.H.; El Harrouni, K.; Jalbaud, O. Correlation between Bleeding and Rheological Characteristics of Self-Compacting Concrete. J. Mater. Civ. Eng. 2017, 29, 05017001. [Google Scholar] [CrossRef]
  31. Benaicha, M.; Jalbaud, O.; Hafidi Alaoui, A.; Burtschell, Y. Correlation between the Mechanical Behavior and the Ultrasonic Velocity of Fiber-Reinforced Concrete. Constr. Build. Mater. 2015, 101, 702–709. [Google Scholar] [CrossRef]
  32. Asri, Y.; Benaicha, M.; Zaher, M.; Hafidi Alaoui, A. Prediction of the Compressive Strength of Self-compacting Concrete Using Artificial Neural Networks Based on Rheological Parameters. Struct. Concr. 2022, 23, 3864–3876. [Google Scholar] [CrossRef]
Figure 1. Frequency of keyword mentions in research articles on the application of ANNs in concrete technology.
Sustainability 16 06644 g001
Figure 2. Equipment and principle of ultrasonic velocity.
Sustainability 16 06644 g002
Figure 3. BPNN Architecture: Example of 3–4–6–1.
Sustainability 16 06644 g003
Figure 4. Hydraulic press used for compressive strength testing of concrete samples.
Sustainability 16 06644 g004
Figure 5. Evolution of hardened density and compressive strength at 1, 7, and 28 days.
Sustainability 16 06644 g005
Figure 6. Evolution of ultrasonic velocity at 1, 7, and 28 days.
Sustainability 16 06644 g006
Figure 7. Distributions of numeric values for(a) hardened density; (b) compressive strength at 1 day; (c) compressive strength at 7 days; and(d) compressive strength at 28 days.
Sustainability 16 06644 g007
Figure 8. Distributions of numeric values for(a) ultrasonic velocity at 1 day; (b) ultrasonic velocity at 7 days; and(c) ultrasonic velocity at 28 days.
Sustainability 16 06644 g008
Figure 9. Illustration of 10-fold cross validation.
Sustainability 16 06644 g009
Figure 10. Architecture of the optimal BPNN model for predicting CS at 28 days.
Sustainability 16 06644 g010
Figure 11. Pearson’s R coefficient between experimental and predicted compressive strength.
Sustainability 16 06644 g011
Figure 12. Analysis comparing experimental and predicted values of compressive strength.
Sustainability 16 06644 g012
Figure 13. Loss vs. epochs: insights into ANNsmodel training efficiency and performance.
Sustainability 16 06644 g013
Figure 14. Correlation of inputs and output parameters by matrix heatmap.
Sustainability 16 06644 g014
Figure 15. Scatter plot of inputs and output parameters.
Sustainability 16 06644 g015
Table 1. Mix proportions of SCC with mineral admixtures.
MaterialTypeDosage (kg/m3)Standard Compliance
CementCEM I 52.5 R350EN 197-1
Water 175
SuperplasticizerKrono 20 HE0.4% of cementEN 480-8
Sand0/2 mm890EN 13139
Gravel0/10 mm900EN 13139
Limestone fillerCarmeuse170EN 206-1
Air-entraining admixtureSIKA AER 50.05–1% of cementNF EN 934-2
Table 2. Properties of SCC in the hardened state.
SCC CodeHardened Density
(Kg/m3)
Ultrasonic Velocity
(m/s)
Compressive Strength (MPa)
1 Day7 Days28 Days1 Day7 Days28 Days
SCC 02432443247764893425563.4
2434443847814895435664.2
2438444047844898445765.6
2438444247874899445765
2436444447904902435664.6
SCC 12398423045324820405360
2400423245354823405361
2403423445384826415462
2399423645334821405360.5
240142384536482440.553.561.5
SCC 22377419945854790375255.2
2379420245884792375256
2381420445914793385356.2
2383420645944794385356.3
2385420845974795375456.4
SCC 32370418545634786355154
2372418745654788355154.2
23744189456747893651.554.3
23764191456947903651.854.4
2378419345714791355254.5
SCC 42366416745584746345053
2368417045604747345053
237041734563474934.550.553.5
2372417645664751355154
237441794569475335.251.455
SCC 52363413445484723334952
236441364550472633.249.452.4
236541384553472833.449.552.6
236641404556473033.649.652.9
236741424559473233.849.853
SCC 62362410345394706324851
23644105454247093248.251.2
236641074544471232.548.551.5
23684109454647153348.851.8
237041114548471833.549.152.1
SCC 72332394343664681304450
233439464369468430.344.550.3
233739494372468730.54550.5
234039524375469030.745.550.7
234339554378469330.94650.9
SCC 82284385541564552284048
228538574158455428.44148.4
228738594160455628.84249
228938614162455829.24349.6
229138634164456029.64450.2
SCC 92254368841104486253542
225636934113448825.535.543
2258369541164492263644
226036974119449626.536.545
2262369941224500273746
SCC 10218335833832433620.33138
218535853835433820.3331.538.6
218835883838434020.363239
219135913841434220.3932.539.4
219435943844434420.423339.8
SCC 11217635443802430216.62734
217935463808430716.827.535
218335493813431116.92835.5
21873552381843151728.536
219135553823431917.12936.5
SCC 12216635243786428814.124.631
216935283788429114.1424.6431.5
217135303790429414.1824.6832
217335323792429714.2224.7232.5
217535343794430014.2624.7633
SCC 13216134883742426213.624.230.5
216434903744426513.6524.430.6
216634933746426713.724.630.7
216834963748426913.7524.830.8
217034993750427113.82530.9
SCC 14215834223704421213.223.430.1
216134253708421513.523.530.2
216334283711421713.823.830.3
216534313714421914.124.130.4
216734343717422114.424.430.5
SCC 1521513388368841921323.129.4
215433903690419413.123.129.5
215633923693419713.123.229.8
215833943696420013.1223.330.1
216033963699420313.1423.430.4
SCC 16214533643624414612.8822.429
214733663626414812.922.529
214933683628415012.9222.729.2
215133703630415212.9422.929.4
215333723632415412.9623.129.6
SCC 17213833233605413412.6521.628.4
214033253607413612.6821.728.5
214233273609413812.721.7528.55
214433293611414012.7221.828.6
214633313613414212.7421.8528.65
SCC 18212433023592412312.5321.427.8
212633043595412512.5521.4327.83
212833063597412812.5821.4527.85
213033083599413112.6121.4727.87
213233103601413412.6421.4927.89
SCC 19211932943588411112.420.726.7
212032963590411312.4220.826.8
212232983593411512.4520.8526.9
212032983594411212.4420.7526.4
212032963596411212.4420.726.5
SCC 20211232863562410812.220.326.2
211532883564410612.2420.426.25
211732903566410412.2620.526.3
211532873566410212.220.326.1
211432863568410212.220.326
Table 3. Summary statistics of experimental results.
ParameterCountMeanstdSumMinMax
Hdensity1052250.21905109.61287236,27321122438
UPV-1d1053740.54286378.02414392,75732864444
UPV-7d1054065.07619423.7774426,83335624790
UPV-28d1054451.66667278.04353467,42541024902
CS-1d10523.6658110.808552484.9112.244
CS-7d10535.6518113.187743743.4420.357
CS-28d10541.5632412.557854364.142665.6
Disclaimer/Publisher’s Note: The statements, opinions and data contained in all publications are solely those of the individual author(s) and contributor(s) and not of MDPI and/or the editor(s). MDPI and/or the editor(s) disclaim responsibility for any injury to people or property resulting from any ideas, methods, instructions or products referred to in the content.

