Article

Sustainable Maintenance of Conductors in Transmission/Distribution Networks Using Complex Magnetic Field Analysis

1
National Institute for Research-Development and Testing in Electrical Engineering, 200746 Craiova, Romania
2
Faculty of Electrical Engineering, University of Craiova, 200440 Craiova, Romania
3
Department of Computer Science and Information Technology, University of Craiova, 200440 Craiova, Romania
*
Author to whom correspondence should be addressed.
Sustainability 2024, 16(15), 6659; https://doi.org/10.3390/su16156659
Submission received: 20 May 2024 / Revised: 9 July 2024 / Accepted: 28 July 2024 / Published: 3 August 2024
(This article belongs to the Special Issue The Electric Power Technologies: Today and Tomorrow)

Abstract

:
This study presents issues related to electromagnetic pollution and the level of magnetic field radiation occurring around conductors used for electricity transmission and distribution. The fact that modeling and simulation are the most efficient methods of optimization, considering the cost–benefit ratio, was the premise of this work. This paper proposes the performance of a complex analysis, carried out in a comparative manner, which includes physical tests and simulations in the existing field around transmission and distribution cables used in transformer substations. In the first stage, the level of the magnetic field existing near the conductor carried by an electric current was tested (measured), and a virtual model was then designed to simulate the field in conditions similar to those of the test. The results obtained from the simulation were analyzed in comparison with those obtained by testing. The maximum permissible limits of exposure to an electromagnetic field, which are regulated by Government Decision HG 520/2016 of 20 July 2016 and Directive 2013/35/EU of the European Parliament and of the Council of 26 June 2013, were used as the reference to formulate conclusions for both situations considered. These comparisons were intended to determine the level of exposure to electromagnetic fields existing in places where electricity transmission/distribution conductors are located. Energy sustainability exists due to the versatile properties of the conductors, with the energy transmission and distribution network being functional regardless of the source of energy production.

1. Introduction

The presence of electromagnetic fields is a current topic in the everyday context. The level of electromagnetic radiation from multiple and diverse sources is legislated at the level of the European Community by Directive 2013/35/EU.
At the national level, requirements imposed to ensure the protection of workers against health and safety risks to which workers are susceptible as a result of exposure to electromagnetic fields at work are regulated by Directive HG 520/2016.
The electromagnetic fields referred to in HG 520/2016 include static electric fields; static magnetic fields; and time-varying electric, magnetic, and electromagnetic fields reaching frequencies up to 300 GHz. Although this directive regulates exposure limit values (ELVs) and all effects caused by known electromagnetic fields, the established limits refer exclusively to the direct biophysical effects of short-term exposure and do not cover the long-term effects of exposure to the fields [1,2].
The maximum levels to which workers can be exposed, under safe conditions, are established in accordance with national standards in the field, adapted to the harmonized European standards of The European Committee for Electrotechnical Standardization—CENELEC—which cover the entire series of evaluations, measurements, and calculations.
Depending on the frequency, the following physical quantities are used to define the exposure limit values for electromagnetic fields:
  • Up to 1 Hz, exposure limit values are provided for current density for time-varying fields to prevent effects on the cardiovascular system and the central nervous system;
  • Between 1 Hz and 10 MHz, exposure limit values are provided for the current density, with the aim of preventing effects on central nervous system functions;
  • Between 100 kHz and 10 GHz, Specific Absorption Rate (SAR) exposure limit values are provided to prevent whole-body thermal stress and localized tissue overheating.
In the frequency range between 100 kHz and 10 MHz, exposure limit values are provided for both current density and SAR. In this sense, various research studies on SAR values for power transmission systems and power transmission dosimetry are frequently published to establish the worst-case exposure scenarios.
A study discussed the allowable input power for wireless power transmission in the 10 MHz band that satisfies the limit of a peak SAR of 2.0 W kg−1 averaged over 10 g of tissue, which was 830 W in the worst-case exposure scenario with a coil positioned 30 mm from the chest [3].
According to IEEE C95.1-2019, the upper limit frequency was reduced from 6 to 3 GHz because the radio wave energy absorbed from outside the body is directly dependent on the frequency value [4].
The dependence between the elevation of the core temperature and the SAR, as an average value for the whole body, is almost independent of the frequency at low frequencies [5].
At frequencies higher than a few GHz, the increase in core temperature for the same average whole-body SAR becomes smaller due to the convection of heat from the skin to the air. This lower rise in core temperature is attributed to the increase in skin temperature caused by power absorption around the body surface. Then, the increase in core temperature, even for a whole-body average SAR of 4 W kg−1 lasting 1 h, is at most 0.8 °C, which is less than the threshold considered in the safety guidelines/standards for lines. These findings were confirmed by seven models, including models of a child and a pregnant woman [6].
Another study investigated the relationship between the peak temperature rise and SAR averaged over 10 g of tissue in human head models in the 1–30 GHz frequency range. Computational results show that SAR-averaging algorithms, excluding the pinna, are essential when correlating the peak temperature elevation in the head, excluding the pinna.
For frequencies higher than 3–4 GHz, the correlation for the peak temperature rise in the head, excluding the fin, is modest for the different algorithms. The 95th percentile value of the heating factor, as well as the mean and median values derived here, would be useful for estimating possible head temperature increases [7].
The performance criterion established according to the specifications of HG 520/2016 falls within the limits of the action trigger values [2]. This is presented in Table 1.
These limits have to be observed by all low-frequency appliances like high-voltage overhead transmission lines. The Ministry of Health, through “ORDER no. 1193 of 29 September 2006 for the approval of the Norms regarding the limitation of the exposure of the general population to electromagnetic fields from 0 Hz to 300 GHz”, imposes for the magnetic field specified limit values regarding the triggering of the action and the exposure limit values. These values are presented in Table 2 and Table 3 [8].
Exposure limit values refer to exposure limits to electromagnetic fields that are directly based on both known health effects and biological considerations; compliance with these limits ensures protection from electromagnetic fields against any known harmful effect on health. Action trigger values refer to the level of directly measurable parameters, expressed in terms of magnetic field strength (H), magnetic induction (B), and power density (S), starting from which one or several measures provided; compliance with the action trigger values ensures compliance with the relevant exposure limit values.
Radiation exposure is a complex issue that can have both aspects: benefits and risks to human health. A compilation of existing research articles in the most prestigious journals, and reviews from leading experts in the field, prove this by the impressive number of research papers on this topic. Thus, the analysis of the electromagnetic field, and in particular its distribution and effects, makes a work on this subject essential reading for anyone interested in the impact of radiation on human health [9,10,11,12].
Energy sustainability exists due to the versatile properties of the conductors, the energy transmission and distribution network being functional regardless of the source of energy production. Modern trends toward decarbonization and limiting the global carbon footprint are moving toward the adoption of green energy sources, which implies considerable changes in power quality parameters.
The present research paper is structured in five parts. The aim was to expose the importance of the issue that we proposed to address and the current concerns in this field of study by analyzing the values of the magnetic field produced by common cables used in energy transmission/distribution systems. Section 2 presents real results obtained in laboratory measurements. These represent the concerns of the authors who address, in the research carried out, the implementation of directive number 213/35/EU transposed into national legislation by government decision number 520 of 2016 [13]. Previously, the collective studied the problem of shielding effectiveness through complex modeling–simulation–measurement hybrid analysis for different types of composite materials and structures used in the profile market [14,15,16,17].
Section 3 contains information on the modeling of the magnetic field produced around the measured conductor. A geometrical model of the conductor is created and simulated in order to determine the value of the simulated electromagnetic field at the same load as in the measurement from Section 2. The paper concludes with the balancing of the results for a comparison of the values. This also shows whether the model is a viable one. It is intended to estimate the degree and the possibilities for optimization.

2. Experimental Determination

Measurements of magnetic field levels were carried out to compare the measured levels with the action trigger levels (ALs) set by Directive 2013/35/EU (HG 520/2016).
The measured magnetic field had as its source an ACSR 300/69 cable supplied with a current of 50 A and a 50 Hz frequency. The standard test setup that was used to record the magnetic field is shown in Figure 1, where a and b represent the positions of the measuring instrument—facing the ground.
The performance criterion established for the measurement was represented by falling within the limits of the action trigger values allowed according to the specifications of HG 520/2016.
The experimental determinations gave the results of the measurements shown in Table 4 and Table 5, which were the subject of previously published research [10]. The obtained experimental values were compared with the simulation results, which are presented below in Section 3.
According to the induction values recorded by the measuring instrument at a height of 1 m, it can be noticed that even in this situation, the limit allowed according to the regulations is approximately 50 times higher, a fact that also certifies the lack of dangers regarding the degree of human exposure.

3. Field Modeling

The fundamental problems related to the modeling of the electromagnetic field, in fixed or mobile environments, are represented by the analysis problems, which in principle aim at the calculation or determination of the electromagnetic field.
To determine the domain, the characteristics of the domain materials, as well as the spatial distribution of the field sources, in order to obtain a unique solution, it is desired to determine the local and instantaneous state quantities of the magnetic field (B, H) in the space–time domain under analysis.
The tangential components of the electric field establish identical variation trigonometrically out of phase by 90 degrees compared to those of the magnetic field. The time-varying electric and magnetic fields are interdependent fields, which condition simultaneously (Figure 2), their variation over time generating electromagnetic waves, which propagate according to the same propagation law—Maxwell’s equations [18].
In immobile media and in domains of continuity of local physical properties, Maxwell’s equations for calculating the electromagnetic field are written:
d i v D ¯ = ρ   ;   d i v B ¯ = 0   ; r o t E ¯ = B ¯ t   ;   r o t H ¯ = J ¯ + D ¯ t   .
The principle of the calculation algorithm is as follows: the current induced in a body of arbitrary shape, irradiated with a plane electromagnetic wave, will have the effect of propagating a field that can be equated with an equivalent current density. This equivalence can help to obtain the components of the propagated field by means of the Maxwell equations.
The total electric field inside the body can be calculated as the sum of the incident and reflected waves, and thus, it can be stated that the application of the method of moments involves the transformation of the field equation into the matrix form [19,20].
As is known,
B i x , y , z = B x i x , y , z 2 + B y i x , y , z 2 + B z i x , y , z 2
Later, starting from the generic form, it can be developed into components, as depicted in Figure 3.
The total magnetic field of the helical conductor with complex geometry can be obtained via superposition of the contributions produced by each segment. The main goal in this section was to develop a high-fidelity numerical modeling methodology for a precise analysis of the radiated field that appears around the conductors within the OHL
The existence of the data of this newly created model and its results allows the development of test conditions impossible to create in the laboratory, in order to obtain eloquent results. The created model tries to consider all possible effects to describe the detailed behavior of each component element in a conductor (Figure 4).
At the same time, a series of elements with a decisive factor in the results obtained was chosen for optimal operation. For example, a very fine grid of points is required in the encompassing contact regions of all the wires to obtain gradients and convergent solutions.
Other such components of the simulation process were building a complete and faithful model but adequate to the calculation possibilities, finding methods of applying the load, correlating the data obtained experimentally with those of the numerical model, and choosing the types of elements for the areas with and without contact.
It should also be stated that for this modeling analysis, only the magnetic component of the electromagnetic field was considered.
Since during the testing, the magnetic field was produced by an ACSR 300/69-type cable carried by an electric current of 50 A, the same situation was also considered in the modeling.
A geometric model was designed for aluminum conductor steel-reinforced cable. The ACSR structure includes 19 central conductors arranged concentrically in 1, 6, and 12 steel strands and 30 conductors arranged on the last two outer layers with 12 and 18 strands.
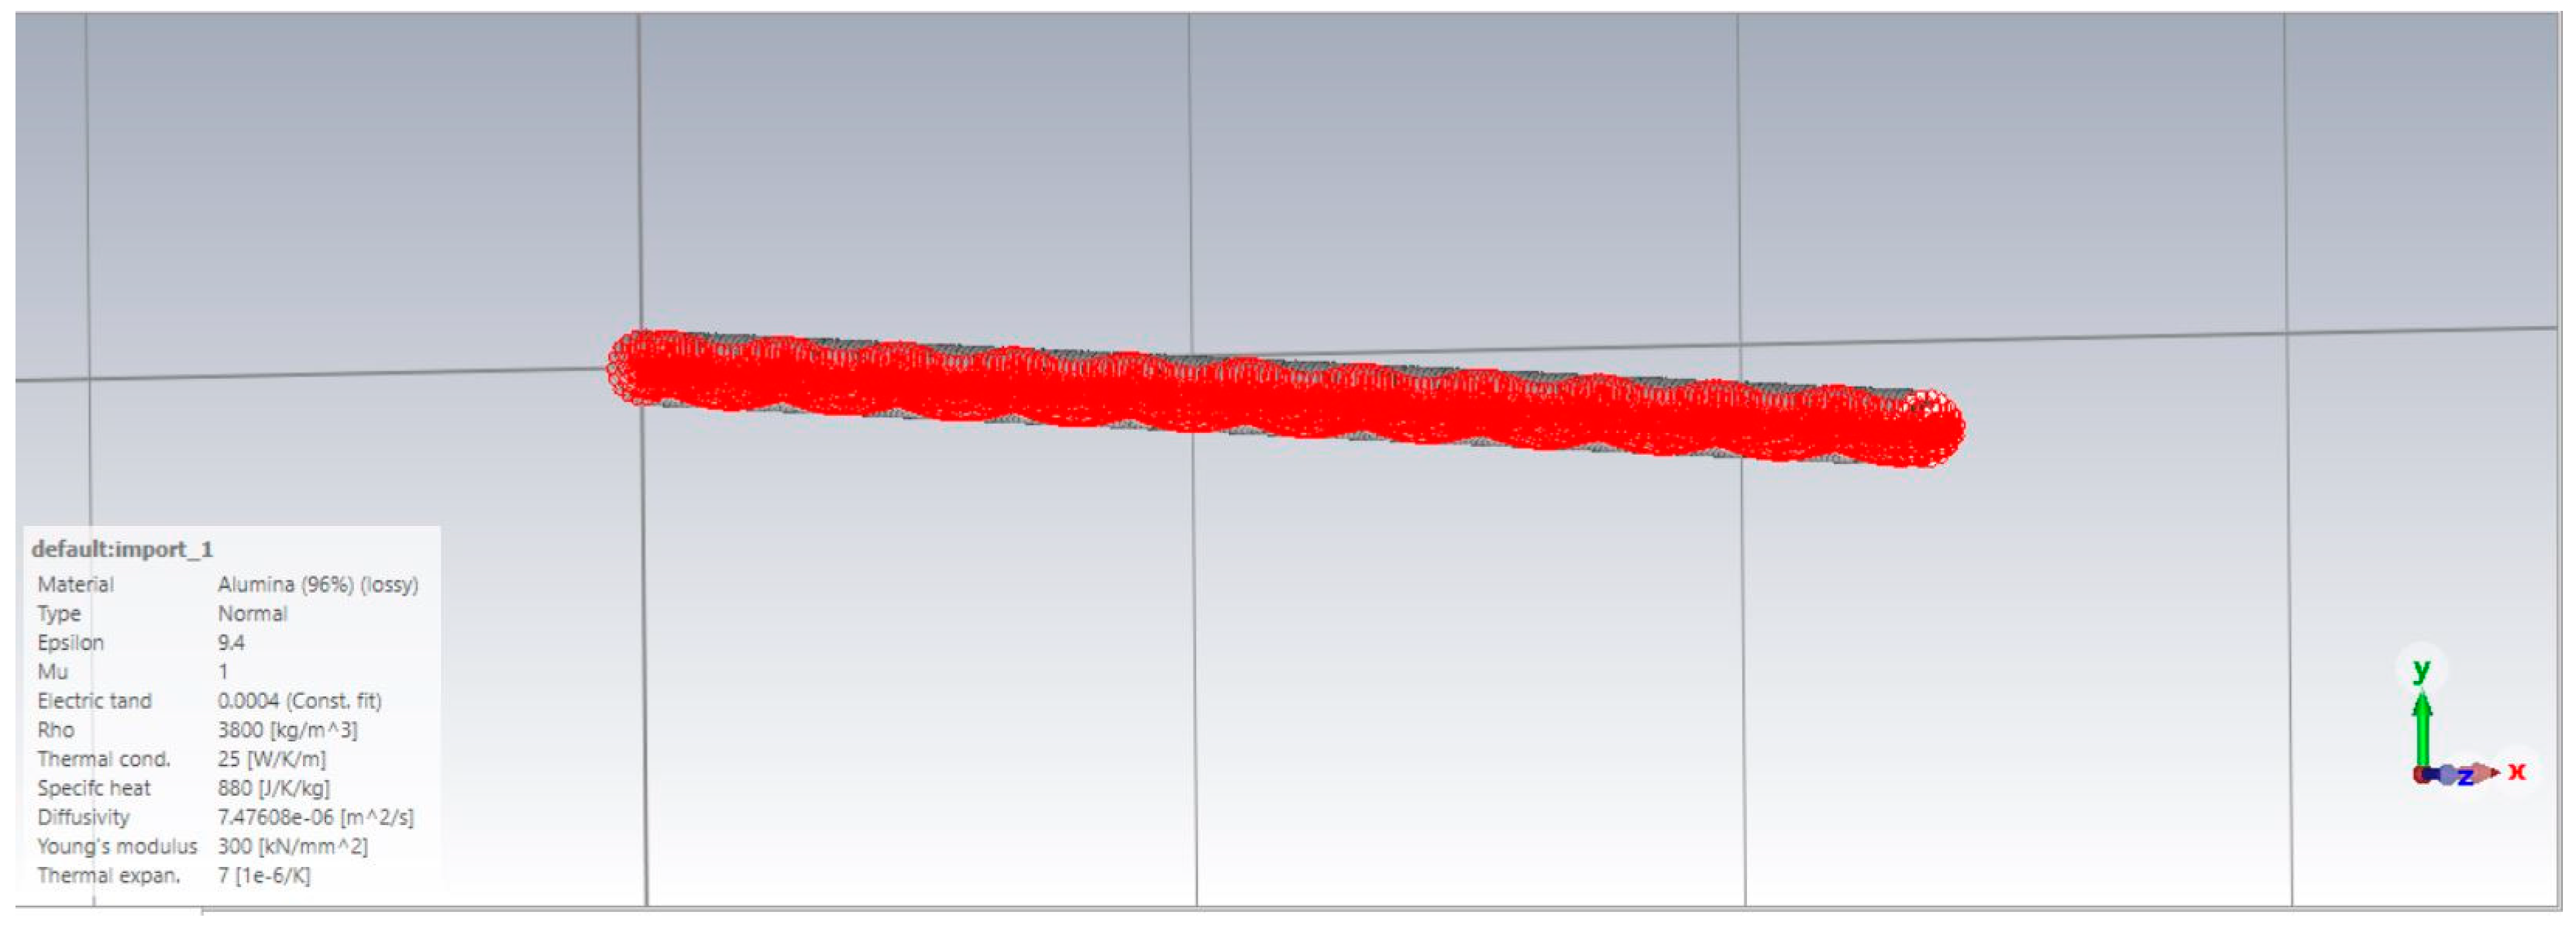
To simulate the field around the ACSR 300/69 conductor, it was initially necessary to create a geometric model of the cable. The geometric scale model of the tested conductor is shown in Figure 5.
The geometry construction was carried out using the AUTODESK INVENTOR PROFESSIONAL CAD environment for computer-aided design and drafting. This CAD tool was chosen due to the limitations encountered in the CAD module related to the CST STUDIO Suite program, with which the simulation was performed.
In CST STUDIO Suite, there is a specialized component dedicated to cable analysis, suggestively named “Cable”, included in the EMC/EMI Module.
This dedicated cable-analysis component allows the definition of multiwire cable geometries of a maximum of 19 component wires—this limitation does not satisfy our analysis need. The analyzed ACSR conductor has 49 individual components and was modeled according to the technical specifications of the manufacturers on a 1:1 scale with the real one.
The presented geometry was designed in AUTODESK INVENTOR PROFESSIONAL for that, afterward, to be imported into CST Studio Suite for simulation.
The simulation software used to calculate the field and determine the magnetic field uses multiple analysis methods. It combines several methods for high accuracy of the results, based on the finite integration technique, a very general approach, which first describes Maxwell’s equations in a discretized space, maintaining properties such as conservation of energy, after which it forms specific differential equations such as Poisson or wave equations.
A mathematical model of the magnetic field radiating around a transmission line involves the solution of a second-order partial differential equation, where the magnetic field is described by the Helmholtz Equation derived from Ampere’s law.
In the microwave domain, the use of the finite integration technique in the frequency domain is very flexible in choosing the discretization network (Cartesian or tetrahedral networks). It requires solving a considerable linear system for each frequency step [22].
A section of cable reinforced with aluminum conductor steel—type ACSR 300/69 and the general specifications about it—can be noticed in Figure 6.
The materials (steel and aluminum) were defined from the material library held by the CST Studio Suite 2023 software, as depicted in Figure 7. The level of twisting of the conductor is considered to be 11 rotations (360 degrees) per linear meter of conductor.
The geometric model of the conductor was simulated to verify the electromagnetic field produced around it. The source for producing the electromagnetic field was a 50 A, with a 50 Hz electric current injected into the cable.
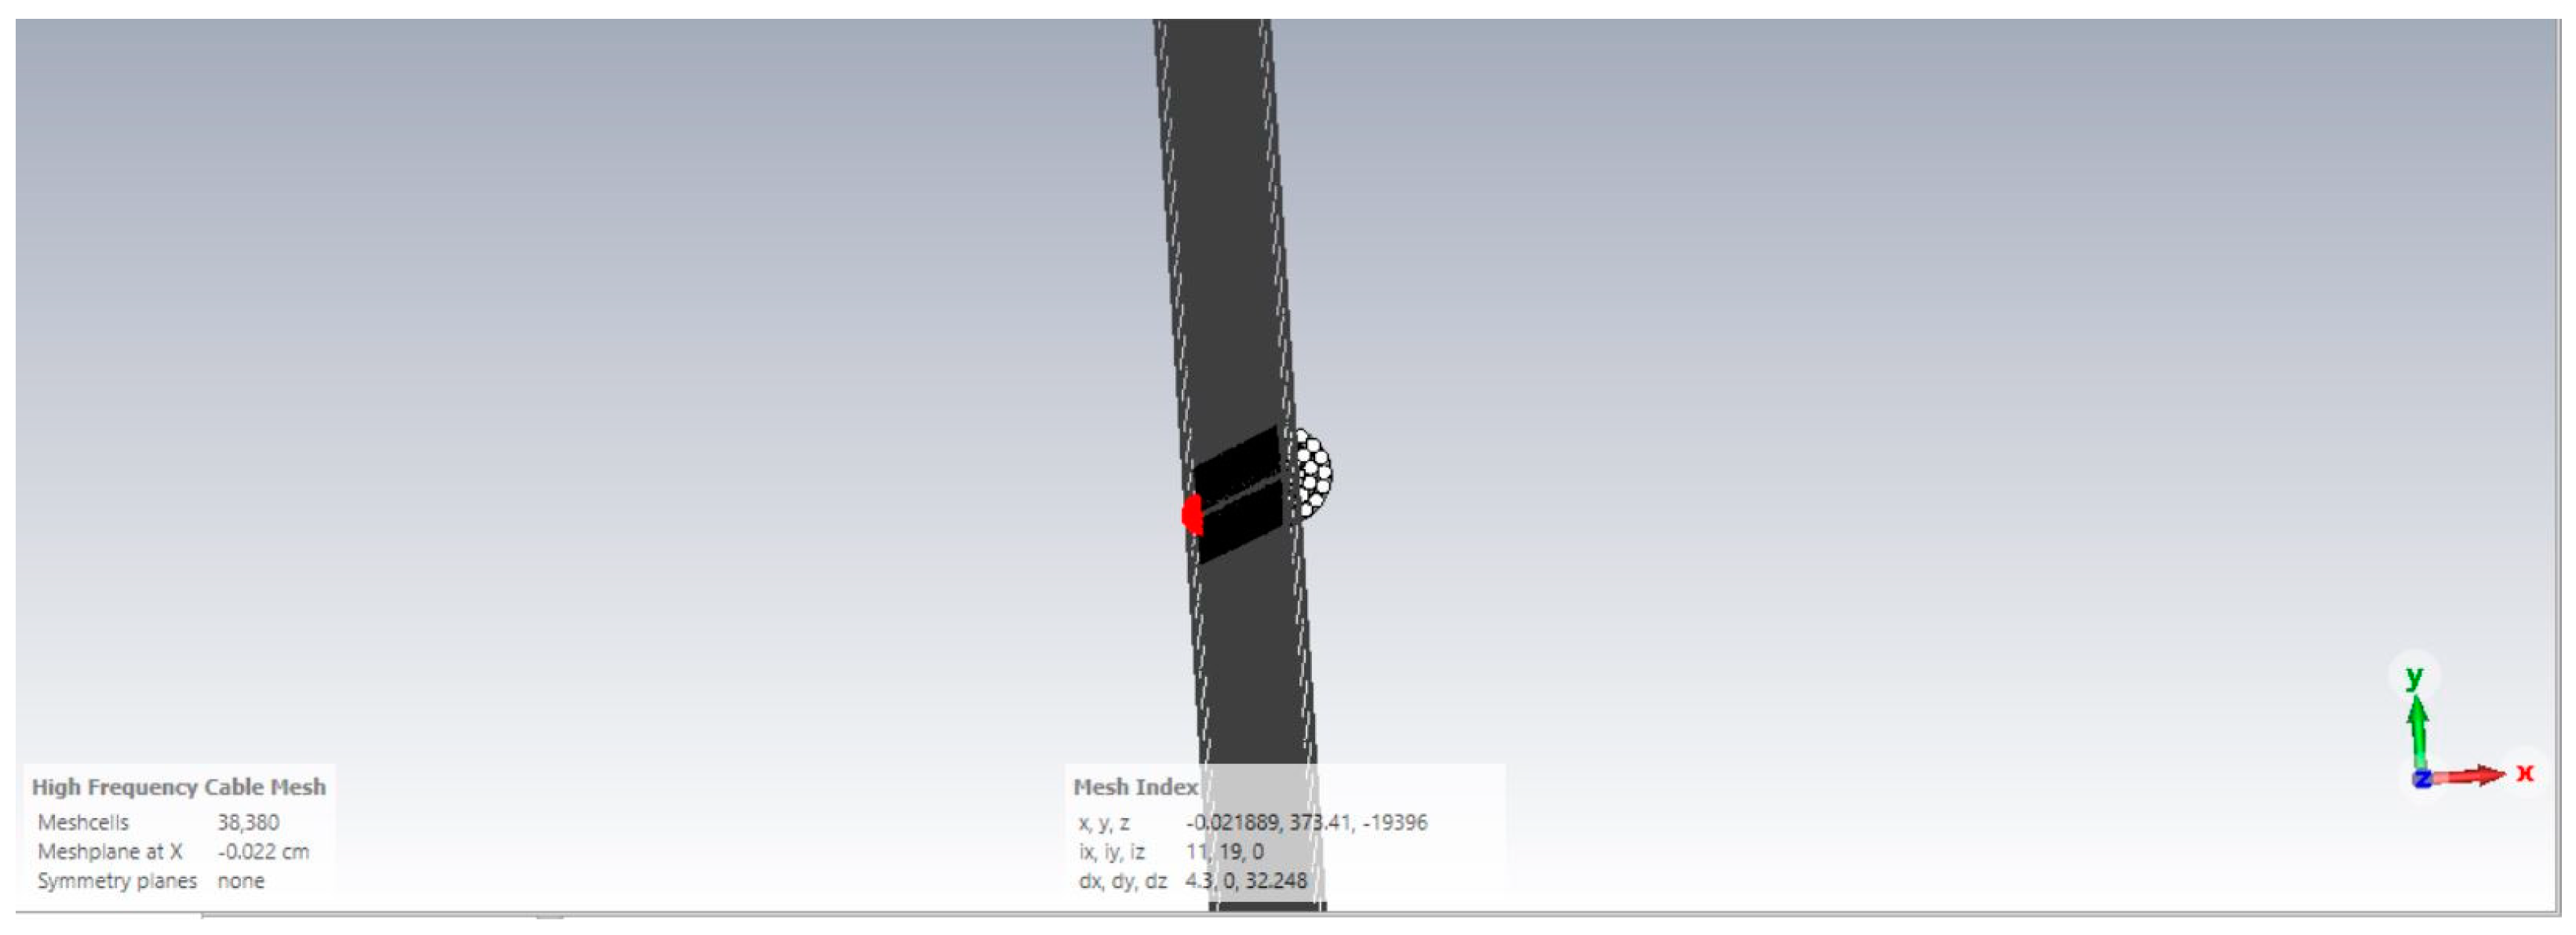
Discretization of the analysis domain was carried out by “adaptive refinement”, a process that helps to reduce the running time and facilitates the optimal running of the program. As can be seen in Figure 8, the domain was structured in 38,380 elements created by the solver automatically.
Magnetic field samples 1 and 2 were placed at a distance of 0.5 m and 1 m from the cable, respectively. The graphic layout of the field samples used in the simulation can be seen in Figure 9, where the associated equivalent electrical circuit is presented.
The distance between the measuring instrument and the source is extremely important because the propagation of the field is achieved by contiguity. For this reason, the distance from the source causes, under the influence of the propagation medium, the field values to decrease (directly proportional to its variation).

4. Results and Conclusions

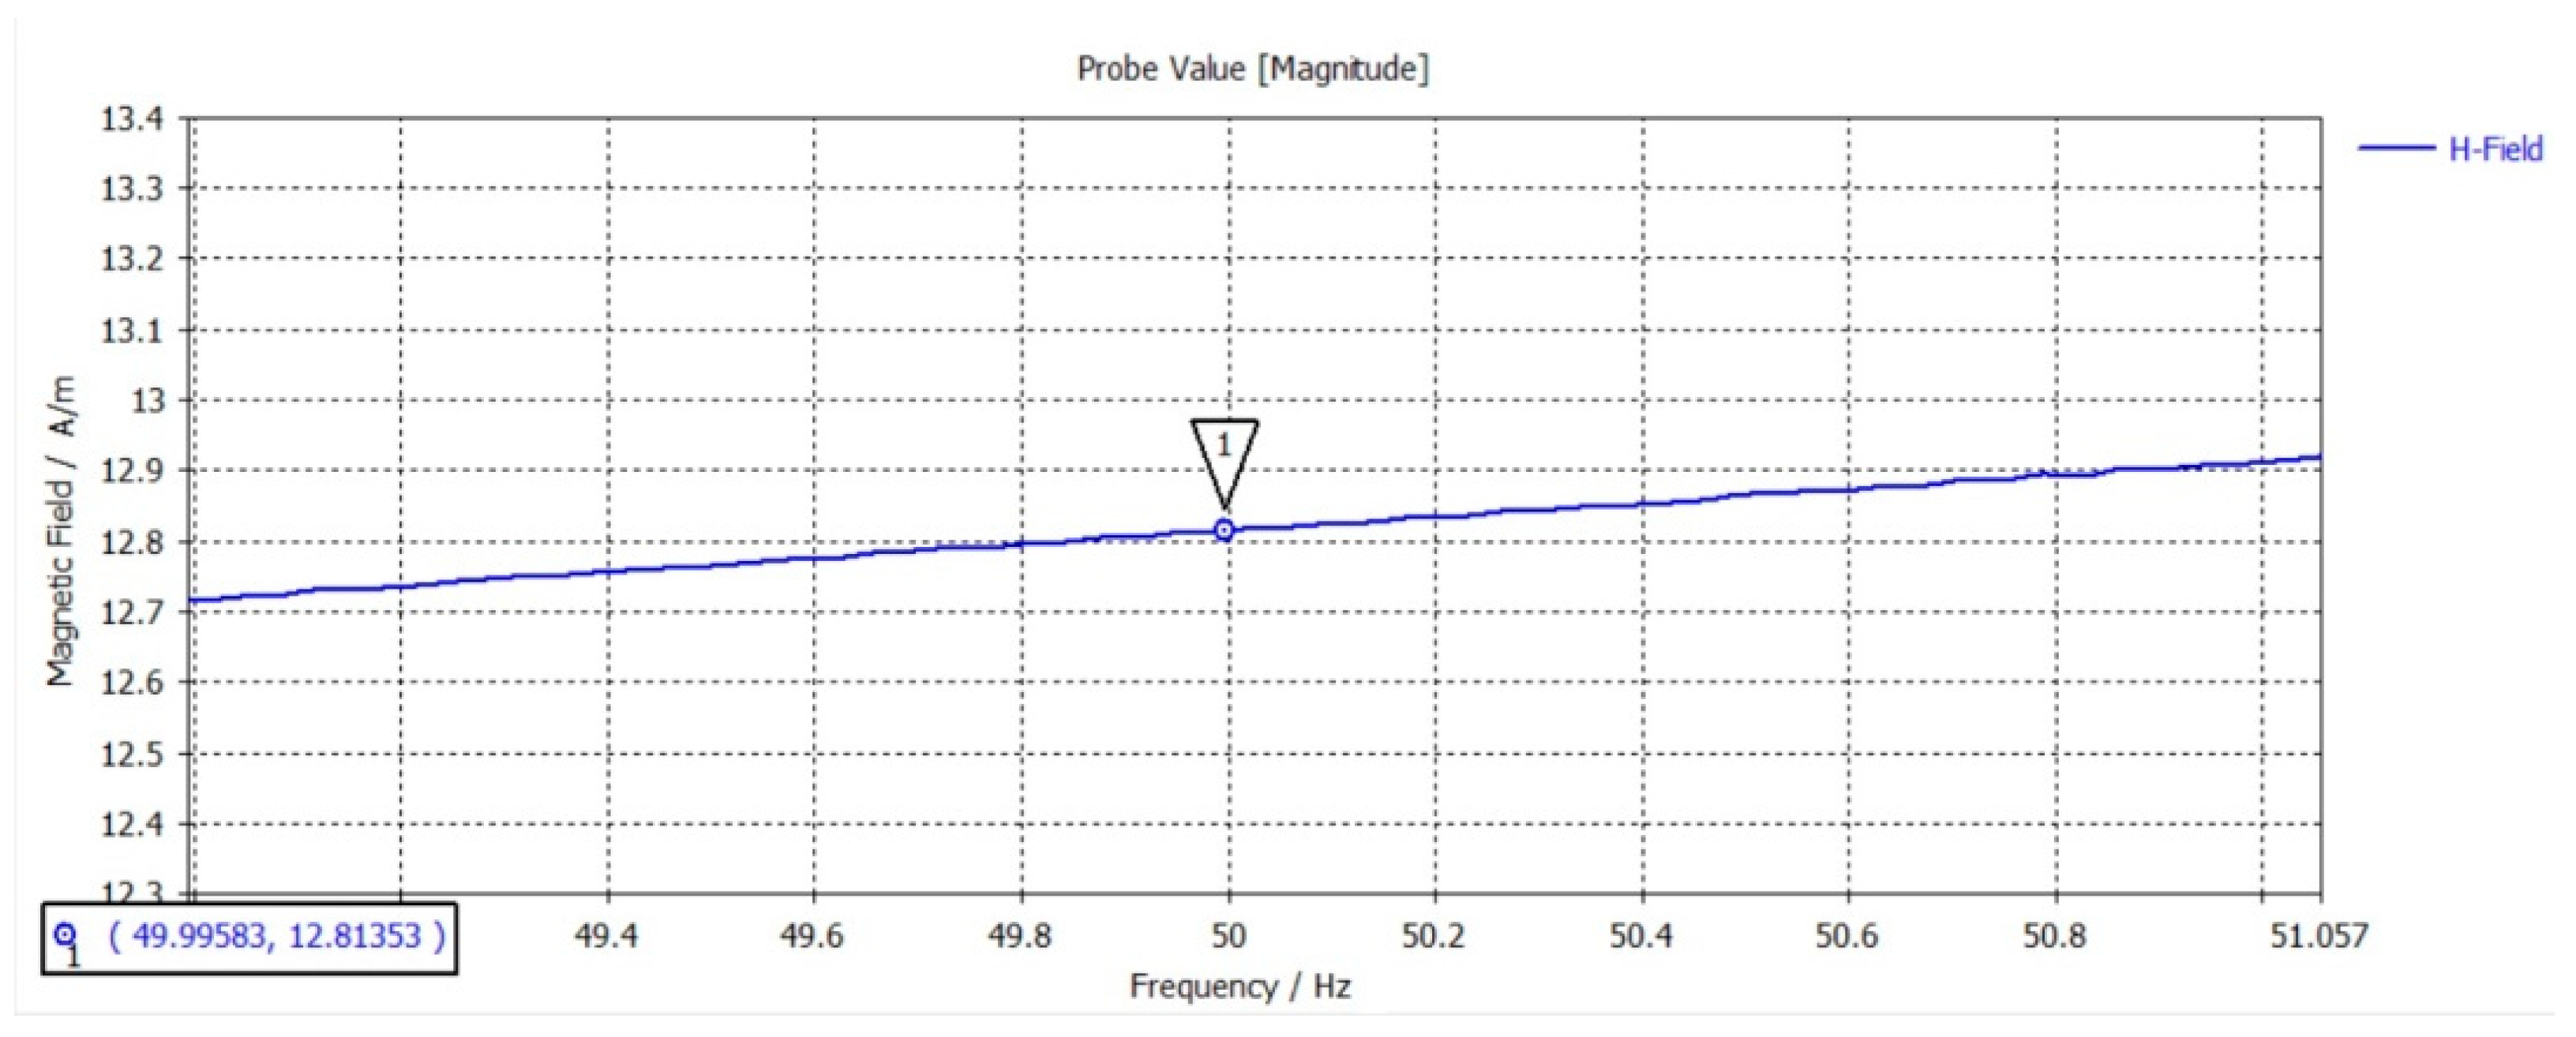
The variation in the magnetic field recorded by the field sample placed at a height of 1 m is illustrated in Figure 10.
In the above figure, the relatively low variation of the magnetic field intensity level can be seen. As reported in Tesla, the magnetic induction value is 16.11 µT. The relationship between the field strength H (A/m) and flux density B(T) determines a conversion factor of 0.796 and 1.257 × 10−60).
Values for the simulated magnetic field are presented in Table 6 and Table 7.
The proposed model is viable, and the applied conditions are optimized so as to reproduce the real operating conditions while using, at the same time, minimal computing resources from the conceptual modeling stage.
Finite element-type analysis, which most software has implemented (simple or coupled with other analysis methods and techniques), facilitates solving a complex numerical model. Since the creation of a formulated complex mathematical model implies the difficulty of compiling the solution and requires serious computing infrastructure, the need for analytical modeling is fierce.
The finite element method is a numerical technique for calculating approximate solutions of partial differential equations, which are found in the most diverse applications in physical or engineering fields. This one can be viewed as a particular form of Galerkin’s method, where the spatial variation of the solution is approximated by polynomial functions on portions with elements of simple geometric shape. For the 2D representation, the geometric shape of the elements is triangular or quadrilateral, and for the 3D one, tetrahedrons, hexahedrons, prisms, or pyramids are used [23,24,25].
The finite difference method represents a numerical tool for solving partial differential equations using finite difference discretization, which assumes that the partial derivatives are approximated by algebraic expressions of the derivative function at points neighboring the one whose derivative is estimated. The purpose of this discretization operation is to transform the equations with partial derivatives into a system of linear algebraic equations [23,24].
To realize the discretization, a lattice network of points that belong to the calculation domain is needed, points that are called “nodes”. The architecture of the network of nodes is a structured one, obtained from a tensor product of one-dimensional networks, whose sides formed between neighboring nodes create a graph with a regular topology called a grid.
The establishment of the calculation domain will be performed so that its surface can be considered covering, with the points where the equations with partial derivatives will be discretized being the nodes of the discretization network of the domain. The shape of the network is established depending on the type of the field problem (two-dimensional or three-dimensional); consequently, both the shape of the elements into which the domain is divided and the appropriate coordinate system must be determined.
Discretization of the operators is based on the polynomial approximation of the function to be derived. Using the Newton interpolation polynomial for the nodes of the discretization network is intended to estimate the value of the derivative in the respective nodes. This expression is called “finite difference” and is used to approximate the value of the derivative of the exact function.
The closer the nodes are, the lower the approximation error, with the degree of the polynomial being inversely proportional to the error obtained [5].
The methods of discretization of the computational domain are automatic, manual, and adaptive discretization techniques, offering the possibility to select the refinement mode of the discretization network.
The input, state, and output quantities of a system must be analyzed so that an approximate solution to solve the system of equations related to the designed model is quickly provided. The optimal compromise between the accuracy of the results and the simplicity of the model is the key to a successful simulation.
Researched and presented aspects in the previous section, followed by a comparison of the numerical results of this model with those obtained experimentally, can represent analytical solutions for the design, placement, and lifetime of conductors. This study contributes to the understanding of a complex context of a numerical approach for studying the electromagnetic field and its effects.
According to the induction values recorded by the measuring instrument at a height of 1 m, it can be seen that even in this situation, the permitted limit, according to the regulations, is approximately 50 times higher.
It can also be seen from the values specified in Table 4 and Table 5 that the inductance value decreases with increasing distance from the cable. So, the greater the distance from the source, the greater the magnetic induction; implicitly, the magnetic field has a lower value. This variation remains valid in the case of the results that emerge from the simulation. This can be checked in Table 6 and Table 7.
Numerical modeling and simulation represent the most appropriate approach for obtaining calculation solutions and for determining the electromagnetic field. In complex configuration cases, determining the solutions is the optimal compromise between accuracy and simplicity; in most situations, accuracy is the one that tilts this ratio.
The authors opted for modeling the propagation mode of the electromagnetic field around a standard conductor used in the transport/distribution of electricity. The research is the subject of complex studies that have in mind the establishment/observance of maximum values of the magnetic field and the implementation of a European directive that limits the values of these field levels.
By comparing the values of the field obtained from the simulation with real values measured in test conditions that were also considered in the simulation, an attempt was made to validate the modeling results. The simulation–measurement comparison is a method often used in research, with multiple similar studies being presented in the specialized literature [22,23,24,25,26,27].

5. Discussion

The evaluation of results depends on several parameters and factors. Among these environmental conditions, current flow, humidity, and ambient temperature are the most versatile factors. The fact that the parameters and factors involved are constantly changing is also an important aspect. In order to optimize maintenance and prevention strategies, there are multiple research studies based on reliability. It is therefore aimed, globally, for preventive maintenance to be replaced by predictive maintenance [28,29].
Although overhead power lines are designed to operate in the worst weather conditions, in order to limit voltage drops to the maximum, in practice, it is observed that the environment, although it is constantly fluctuating, offers, most of the time, less restrictive conditions than those designed in the standards. In this regard, the issue of optimization and development of current diagnostic and prognostic techniques appears [30].
The possibility of performing effective line measurements in real time can lead to safer use and save the money needed to build new overhead lines. On the other hand, it is generally impossible to correlate the load capacity of the conductors with the real time weather conditions.
There have been several attempts to make real-time line monitoring tools. This is also important and up-to-date to the real-time monitoring of bending and other movement characteristics based on frequency analysis (in the range between 0 and 100 Hz) with an error margin of ±2% in bending, as specified in [31].
This, like other measuring and monitoring devices, in addition to the advantages presented, retains a series of shortcomings, such as the impossibility of determining the stage of conductor degradation, high maintenance costs, as well as the problem of introducing new disruptive elements into the system. Detecting early defects, monitoring operational defects, forecasting and diagnosing them, and investigating the effects of combined stresses on lifetime and failure rates are still topical issues.
Numerical model creation is an important scientific contribution in the field, given that the established methods of ultrasonic control—usually in the case of bars or single-wire cables—cannot detect the defects appearing in the conductor section [29,30,32].
The optimization of costs and an increase in operational safety could be performed by simulating the conditions imposed by the working environment and by comparative analyses of the condition of new and used conductors in order to establish maintenance and replacement intervals [33,34].
As a future direction of research, we propose determining the degree of influence on the conductor after the application of the forced-aging process through thermal cycles. It is also considered to carry out a mechanical analysis by simulating the previously presented effects. It is also considered useful to determine the field level measured around conductors with an advanced degree of wear in order to analyze the effects on the way the field propagates around them.

Author Contributions

Conceptualization, L.-A.D. and V.V.; methodology, P.-M.M.; software, L.-A.D.; validation, I.D., P.-M.M. and V.V.; formal analysis, I.D.; investigation, L.-A.D.; resources, V.V. and I.D.; data curation, L.-A.D. and I.D.; writing—original draft preparation, L.-A.D., I.D.N., P.-M.M. and V.V.; writing—review and editing, L.-A.D.; visualization, L.-A.D.; supervision V.V. and I.D.; project administration, L.-A.D.; funding acquisition, V.V. All authors have read and agreed to the published version of the manuscript.

Funding

National Institute for Research-Development and Testing in Electrical Engineering—Ministry of Research, Innovation, and Digitization.

Institutional Review Board Statement

Not applicable.

Informed Consent Statement

Not applicable.

Data Availability Statement

The original contributions presented in the study are included in the article.

Acknowledgments

This work was developed within the project PN 23 33 01 02— “Research on the development of the capability of ICMET Craiova in the field of electromagnetic compatibility"—by implementing a high-performance system for evaluating the efficiency of the shielding of products with electronic components, in accordance with IEEE Std 299.1-2013 and compliance with the requirements of Directive 2014/30/EU.

Conflicts of Interest

The authors declare no conflicts of interest.

References

  1. Directive 2013/35/EU of the European Parliament and of the Council of 26 June 2013 on the Minimum Health and Safety Requirements Regarding the Exposure of Workers to the Risks Arising from Physical Agents (Electromagnetic Fields) (20th Individual Directive within the Meaning of Article 16(1) of Directive 89/391/EEC) and Repealing Directive 2004/40/EC. Available online: https://eurlex.europa.eu/LexUriServ.do?uri=OJ:L:2004:184:0001:0009:EN:PDF (accessed on 11 May 2024).
  2. Decision No. 520/2016 Regarding the Minimum Safety and Health Requirements Regarding the Exposure of Workers to Risks Generated by Electromagnetic Fields—In Romanian, Published in the Official Gazette No. 576 of 28 July 2016. Available online: https://mmuncii.ro/j33/images/Documente/Legislatie/HG520-2016.pdf (accessed on 9 May 2024).
  3. Laakso, I.; Tsuchida, S.; Hirata, A.; Kamimura, Y. Evaluation of SAR in a human body model due to wireless power transmission in the 10 MHz band. Phys. Med. Biol. 2012, 57, 4991. [Google Scholar] [CrossRef] [PubMed]
  4. IEEE Standard C95.1-2019; IEEE Standard for Safety Levels with Respect to Human Exposure to Electric, Magnetic, and Electromagnetic Fields, 0 Hz to 300 GHz (Revision to IEEE 2006 IEEE C95.1). IEEE: New York, NY, USA, 2019.
  5. Araújo Alves, J.; Neto Paiva, F.; Torres Silva, L.; Remoaldo, P. Low-Frequency Noise and Its Main Effects on Human Health—A Review of the Literature between 2016 and 2019. Appl. Sci. 2020, 10, 5205. [Google Scholar] [CrossRef]
  6. Hirata, A.; Laakso, I.; Oizumi, T.; Hanatani, R.; Chan, K.H.; Wiart, J. The relationship between specific absorption rate and temperature elevation in anatomically based human body models for plane wave exposure from 30 MHz to 6 GHz. Phys. Med. Biol. 2013, 58, 903. [Google Scholar] [CrossRef] [PubMed]
  7. Morimoto, R.; Laakso, I.; De Santis, V.; Hirata, A. Relationship between peak spatial-averaged specific absorption rate and peak temperature elevation in human head in frequency range of 1–30 GHz. Phys. Med. Biol. 2016, 61, 5406. [Google Scholar] [CrossRef] [PubMed]
  8. ORDER no. 1193 of 29 September 2006 for the Approval of the Norms on Limiting the Exposure of the General Population to Electromagnetic Fields from 0 Hz to 300 GHz. Available online: https://www.ancom.ro/uploads/links_files/Odinul_1193_2006_norme.pdf (accessed on 28 April 2024). (In Romanian).
  9. Sharma, G.P.; Himburg, H.A. Organ-Specific Endothelial Dysfunction Following Total Body Irradiation Exposure. Toxics 2022, 10, 747. [Google Scholar] [CrossRef] [PubMed]
  10. Voicu, V.; Dina, L.-A.; Mircea, P.-M.; Dumbrava, I. Magnetic and Electric Field Measurement Experiments. In Proceedings of the 2023 Power Quality and Electromagnetic Compatibility at Low Frequency (PQEMC-LF), Craiova, Romania, 28–30 June 2023; pp. 61–64. [Google Scholar] [CrossRef]
  11. Russ, E.; Davis, C.M.; Slaven, J.E.; Bradfield, D.T.; Selwyn, R.G.; Day, R.M. Comparison of the Medical Uses and Cellular Effects of High and Low Linear Energy Transfer Radiation. Toxics 2022, 10, 628. [Google Scholar] [CrossRef] [PubMed]
  12. Holbert, K.E.; Karady, G.G.; Adhikari, S.G.; Dyer, M.L. Magnetic fields produced by underground residential distribution system. IEEE Trans. Power Deliv. 2009, 24, 1616–1622. [Google Scholar] [CrossRef]
  13. Voicu, V.; Dina, L.-A.; Dumbrava, I.; Mircea, P.-M.; Fieraru, I. Experiments on the Measurement of the Electromagnetic Field. In Proceedings of the 2023 International Conference on Electromechanical and Energy Systems (SIELMEN), Craiova, Romania, 11–13 October 2023; pp. 1–6. [Google Scholar] [CrossRef]
  14. Voicu, V.; Pătru, I.; Dina, L.-A.; Nicolae, P.-M.; Smărăndescu, I.D. Shielding effectiveness evaluation using a non-standardized method. In Proceedings of the 2017 International Conference on Electromechanical and Power Systems (SIELMEN), Iasi, Romania, 11–13 October 2017; pp. 208–211. [Google Scholar] [CrossRef]
  15. Voicu, V.; Pătru, I.; Nicoleanu, A.; Dina, A.; Smărăndescu, D.; Nicolae, M.; Aipu, R.A. Modeling the Electromagnetic Field Distribution Inside an Anechoic Chamber Lined with Different Types of Radio-Frequency Absorbers. In Proceedings of the 2018 IEEE Symposium on Electromagnetic Compatibility, Signal Integrity and Power Integrity (EMC, SI & PI), Long Beach, CA, USA, 30 July–3 August 2018; pp. 175–180. [Google Scholar] [CrossRef]
  16. Voicu, V.; Pătru, I.; Nicolae, P.-M.; Dina, L.-A. Analyzing the attenuation of electromagnetic shielding materials for frequencies under 1 GHz. In Proceedings of the 2017 10th International Symposium on Advanced Topics in Electrical Engineering (ATEE), Bucharest, Romania, 23–25 March 2017; pp. 336–339. [Google Scholar] [CrossRef]
  17. Voicu, V.; Dina, L.-A.; Nicolae, P.-M.; Aipu, R.A.; Pătru, I.; Nicoleanu, P.-A. Modeling the Electromagnetic Field Distribution in a Shielded Enclosure Lined with Radio-Frequency Absorbers. In Proceedings of the 2018 International Conference on Applied and Theoretical Electricity (ICATE), Craiova, Romania, 4–6 October 2018; pp. 1–5. [Google Scholar] [CrossRef]
  18. Dina, L.-A. Electromagnetic Field Modeling in EMC Test chambers; Sitech: Craiova, Romania, 2024; ISBN 978-606-11-8572-6. [Google Scholar]
  19. Osmani, K.; Schulz, D. Modeling Magnetic Fields around Stranded Electrical Transmission Lines via Finite Element Analysis (FEA). Energies 2024, 17, 801. [Google Scholar] [CrossRef]
  20. Deltuva, R.; Lukočius, R. Distribution of Magnetic Field in 400 kV Double-Circuit Transmission Lines. Appl. Sci. 2020, 10, 3266. [Google Scholar] [CrossRef]
  21. Nicolaou, C.; Papadakis, A.; Razis, P.; Kyriacou, G.; Sahalos, J. Experimental measurement, analysis and prediction of electric and magnetic fields in open type air substations. Electr. Power Syst. Res. 2012, 90, 42–54. [Google Scholar] [CrossRef]
  22. Gierczak, M.; Markowski, P.M.; Dziedzic, A. The Modeling of Magnetic Fields in Electromagnetic Microgenerators Using the Finite Element Method. Energies 2022, 15, 1014. [Google Scholar] [CrossRef]
  23. Mamishev, A.V.; Nevels, R.D.; Russell, B.D. Effects of conductor sag on spatial distribution of power line magnetic field. IEEE Trans. Power Deliv. 1996, 11, 1571–1576. [Google Scholar] [CrossRef]
  24. Budnik, K.; Machczyński, W. Contribution to studies on calculation of the magnetic field under power lines. Eur. Trans. Electr. Power 2006, 16, 345–364. [Google Scholar] [CrossRef]
  25. Modric, S.V.T.; Lovric, D. 3D computation of the power lines magnetic field. Prog. Electromagn. Res. M 2015, 41, 1–9. [Google Scholar] [CrossRef]
  26. Yang, Y.; Yin, Q.; Li, C.; Li, H.; Zhang, H. Simulation and Experimental Verification of Magnetic Field Diffusion at the Launch Load during Electromagnetic Launch. Sensors 2023, 23, 8007. [Google Scholar] [CrossRef] [PubMed]
  27. Su, Z.; Wei, R.; Du, Y.; Fan, W.; Chen, J. Numerical Simulation of Magnetic Field and Flow Field of Slab under Composite Magnetic Field. Metals 2023, 13, 1237. [Google Scholar] [CrossRef]
  28. Chan, J.; Havard, D.; Rawlins, C.; Diana, G.; Cloutier, L.; Lilien, J.L.; Hardy, C.; Wang, J.; Goel, A. EPRI Transmission Line Reference Book: Wind Induced Conductor Motion; Electric Power Research Institute: Palo Alto, CA, USA, 2006. [Google Scholar]
  29. Rizzo, P.; Di-Scalea, F.L. Monitoring steel strands via ultrasonic measurements. In Smart Structures and Materials 2002: Smart Systems for Bridges, Structures, and Highways; SPIE: Washington, DC, USA, 2002; Volume 4696, pp. 62–73. [Google Scholar]
  30. Wilson, M.; Hurlebaus, S. Power line monitoring. In Proceedings of the 2007 American Control Conference, New York, NY, USA, 9–13 July 2007; pp. 231–235. [Google Scholar]
  31. Černín, K. Reconstruction of Conductor Movement and Monitoring of High Voltage. Ph.D. Thesis, Brno University of Technology, Brno, Czechia, 2009. [Google Scholar]
  32. Baltazar, A.; Hernandez-Salazar, C.D.; Manzanares-Martinez, B. Study of wave propagation in a multiwire cable to determine structural damage. NDTE Int. 2010, 43, 726–732. [Google Scholar] [CrossRef]
  33. ASTM E-1876-01; Standard Test Method for Dynamic Young’s Modulus, Shear Modulus, and Poisson’s Ratio by Impulse Excitation Technique of Vibration. ASTM International: West Conshohocken, PA, USA, 2017.
  34. Matthes, R.; McKinlay, A.F.; Bernhardt, J.H.; Vecchia, P.; Veyret, B. Exposure to Static and Low Frequency Electromagnetic Fields Biological Effects and Health Consequences (0-100 kHz)—Review of the Scientific Evidence Munich 2003; ICNIRP 13/2003; ICNIRP: Munich, Germany, 2003; ISBN 978-3-934994-03-4. [Google Scholar]
Figure 1. Magnetic field measurement scheme.
Sustainability 16 06659 g001
Figure 2. Representation of the transversal mode of propagation for electromagnetic waves [18].
Sustainability 16 06659 g002
Figure 3. Distribution of the magnetic field density in the xz-plane [21].
Sustainability 16 06659 g003
Figure 4. Actual (real) representation of a twisted conductor.
Sustainability 16 06659 g004
Figure 5. The geometric scale model of the analyzed conductor.
Sustainability 16 06659 g005
Figure 6. Sectional view of the geometric model for the simulated cable.
Sustainability 16 06659 g006
Figure 7. Material properties considered for the simulated cable.
Sustainability 16 06659 g007
Figure 8. Mesh network considered.
Sustainability 16 06659 g008
Figure 9. Layout of field samples in plan.
Sustainability 16 06659 g009
Figure 10. Graphical representation of simulated H magnetic field strength.
Sustainability 16 06659 g010
Table 1. The established performance criterion according to the specifications of HG 520/2016.
Frequency
Range
Magnetic Induction
AL(B)
Low-Frequency
[µT] (RMS)
Magnetic Induction AL(B)
High-Frequency [µT] (RMS)
Magnetic Induction
AL for Exposure of Limbs to Localized Magnetic Field [µT] (RMS)
1 ≤ f ≤ 8 Hz2.0 × 105/f23.0 × 105/f9.0 × 105/f
8 ≤ f ≤ 25 Hz2.5 × 104/f3.0 × 105/f9.0 × 105/f
25 ≤ f ≤ 300 Hz1.0 × 1033.0 × 105/f9.0 × 105/f
300 Hz ≤ f ≤ 3 kHz3.0 × 105/f3.0 × 105/f9.0 × 105/f
3 kHz ≤ f ≤ 100 MHz1.0 × 1021.0 × 1023.0 × 102
100 kHz ≤ f ≤ 1 MHz2.0 × 106/f--
1 ≤ f ≤ 10 MHz2.0 × 106/f--
10 ≤ f ≤ 400 MHz0.2--
400 MHz ≤ f ≤ 2 GHz1.0 × 10−5 f1/2--
2 ≤ f ≤ 6 GHz4.5 × 10−1--
6 ≤ f ≤ 3004.5 × 10−1--
Table 2. Limit values regarding public exposure, according to OMSP 1193/2006.
Frequency
Range
Magnetic Field
Intensity
(A/m)
Magnetic
Induction
(µT)
The Power Density of
the Equivalent Plane Wave Seq (W/m2)
0–1 Hz3.2 × 1044 × 104-
1–8 Hz3.2 × 104 /f24 × 104/f2-
8–25 Hz4000 /f5000/f-
0.025–0.8 kHz4/f5/f-
0.8–3 kHz56.25-
3–150 kHz56.25-
0.15–1 MHz0.73/f0.92/f
1–10 MHz0.73/f0.92/f
10–400 MHz0.730.922
400–2000 MHz0.037∙f1/20.046∙f1/2f/200
2–300 GHz0.160.210
Table 3. Limit values for triggering action on public exposure, according to OMSP 1193/2006.
Frequency
Range
Magnetic
Induction
(µT)
Medium SAR in All Body
(W/m2)
The Power Density of
the Equivalent Plane Wave Seq (W/m2)
0 Hz40--
0–1 Hz---
1–4 Hz---
4–1000 Hz---
1000 Hz–100 kHz---
100 kHz–10 MHz--0.08
10 MHz–10 GHz--0.08
10 GHz–300 GHz-10-
Table 4. Measuring the magnetic field B at a height of 0.5 m.
MeasurementThe Measured Value
(μT)
Frequency (Hz)Limit
2013/35/EU
(μT)
MeasurementThe Measured Value
(μT)
Frequency (Hz)Limit
2013/35/EU
(μT)
19.97501000199.96501000
29.95501000209.94501000
39.97511000219.92501000
49.98501000229.99511000
59.97511000239.94501000
69.98501000249.91511000
79.97501000259.90501000
89.98511000269.88511000
99.98511000279.90501000
109.97501000289.90511000
119.97511000299.90501000
129.97501000309.88501000
139.96501000319.90501000
149.96511000329.91511000
159.95501000339.89501000
169.95511000349.90511000
179.94501000359.89511000
189.95511000369.88511000
Table 5. Measuring the magnetic field B at a height of 1 m.
MeasurementThe Measured Value
(μT)
Frequency (Hz)Limit
2013/35/EU
(μT)
MeasurementThe Measured Value
(μT)
Frequency
(Hz)
Limit
2013/35/EU
(μT)
118.495110001918.71501000
218.575110002018.72511000
318.515010002118.65501000
418.705010002218.77501000
518.645010002318.71511000
618.685010002418.69511000
718.675110002518.77501000
818.635010002618.72501000
918.685110002718.74501000
1018.675010002818.79501000
1118.645110002918.74511000
1218.665010003018.73511000
1318.765010003118.75501000
1418.735010003218.77511000
1518.755110003318.76501000
1618.695110003418.75511000
1718.675110003518.73501000
1818.705110003618.75511000
Table 6. Simulated values for magnetic field B at a height of 1 m.
The Analytical
Value
(A/m)
The Analytical
Value
(μT)
Frequency
(Hz)
Limit
2013/35/EU
(μT)
12.71915.983491000
12. 73816.00749.21000
12. 76316.03849.41000
12.77916.05849.61000
12.80416.08949.81000
12.82016.110501000
12.83016.12250.21000
12.86416.16550.41000
12.87916.18450.61000
12.89216.20050.81000
12.91116.224511000
Table 7. Simulated values for magnetic field B at a height of 0.5 m.
The Analytical
Value
(A/m)
The Analytical
Value
(μT)
Frequency
(Hz)
Limit
2013/35/EU
(μT)
6.3698.003491000
6. 3768.01249.21000
6. 3828.01949.41000
6.3958.03649.61000
6.4048.04749.81000
6.4098.053501000
6.4118.05650.21000
6.4238.07150.41000
6.4368.08750.61000
6.4418.09350.81000
6.4518.099511000
Disclaimer/Publisher’s Note: The statements, opinions and data contained in all publications are solely those of the individual author(s) and contributor(s) and not of MDPI and/or the editor(s). MDPI and/or the editor(s) disclaim responsibility for any injury to people or property resulting from any ideas, methods, instructions or products referred to in the content.