Article

Exploring Smartphone User Interface Experience-Sharing Behavior: Design Perception and Motivation-Driven Mechanisms through the SOR Model

by
Jie Gao
1,*,
Wenjing Jia
1 and
Jun Yin
2,*
1
Faculty of Humanities and Arts, Macau University of Science and Technology, Macau 999078, China
2
College of Design, Jiangnan University, Wuxi 214122, China
*
Authors to whom correspondence should be addressed.
Sustainability 2024, 16(15), 6670; https://doi.org/10.3390/su16156670
Submission received: 19 May 2024 / Revised: 20 July 2024 / Accepted: 1 August 2024 / Published: 4 August 2024
(This article belongs to the Special Issue Sustainable Product Design, Manufacturing and Management)

Abstract

:
This study investigates user experience (UX) sharing behaviors in the context of smartphone user interface (UI) design, emphasizing their significance for UI enhancement and effective marketing strategies. Grounded in the Stimulus–Organism–Response (SOR) framework, we examine how design perception attributes—perceived usability, novelty, enjoyment, and brand image—influence UX sharing, with a spotlight on the mediating role of individual motivation. A quantitative analysis (N = 472), Structural Equation Modeling (SEM), and mediation analysis were conducted. Our findings confirm that these components can positively impact UX sharing by bolstering personal expectations and self-efficacy in knowledge sharing, with perceived usability being an exception as it unexpectedly showed a negative association with sharing frequency. Moreover, perceived brand image and individual self-expectancy and self-efficacy enhance sharing outcomes. This research enriches our understanding of the strategic importance of user interface (UI) design in the context of smartphones, furnishing empirical grounding for devising sustainable UI design strategies and productive marketing tactics. Consequently, it bears considerable relevance to both theoretical insights and practical applications.

1. Introduction

Smartphones have become indispensable devices worldwide. According to data from the International Telecommunication Union (ITU), more than three-quarters of the world’s population own a mobile phone [1]. According to data provided by the market research firm IDC, global smartphone shipments nearly reached 1.17 billion units in 2023 [2]. This highlights the significant role of smartphones in daily life and their impact on changing communications and information dissemination methods. In the business sector, smartphones continue to possess substantial market potential and are important technological products that receive widespread attention. The introduction of new products by major tech companies like Apple, Samsung, and Huawei each year still garners wide interest. After new smartphones are released, user groups and tech bloggers share their experiences and evaluations of the products through online platforms in the form of text, images, and videos [3]. Consequently, the Internet has become one of the primary channels for obtaining product information [4]. Consumers frequently refer to various tech review articles or videos to understand the product’s performance and features and make informed purchasing decisions [5]. Apart from online platforms, buying a new smartphone often becomes a topic of social conversation in daily life, where users share details about the phone’s design, new features, and user experience.
At the product design level, contemporary smartphones predominantly employ touchscreens for human–computer interaction, with screen sizes progressively expanding to occupy a larger portion of the device’s face. Users’ direct impressions of phones primarily come from the UI design of the smartphone operating systems. UI design directly impacts the establishment of the product image [6]. Good UI design not only meets functional requirements but also helps in shaping the corporate image through visual elements such as icons, colors, and navigation [7]. Therefore, UI design plays a significant role in influencing user preferences.
Smartphone shipments have shown a year-to-year declining trend in recent years [8]. One reason is that the new generation of smartphones lacks stimulating innovative capabilities, leading to a tendency toward homogenization in product appearance and user interface (UI) design. Users prefer simple operation modes, concise interfaces, and functions that are fixed, with higher acceptance for applications that have highly consistent operation logic and usage patterns [9,10]. More consistent user behaviors also reflect less innovative investments by manufacturers, thereby leading to a decrease in differentiation between smartphone product design and UI design. Uniform designs lack the capacity to offer users fresh visual and usage experiences, impeding the fostering of shared experiences among users and undermining efforts to garner product attention through word of mouth, consequently stalling innovation cycles.
While the existing literature extensively explores user interface (UI) design strategies and their effectiveness in enhancing smartphone user experience, it provides minimal attention to the motivations and behaviors of digital product users when sharing their usage experience. This study seeks to bridge this gap by investigating the user experiences prompted by UI design within the context of knowledge sharing. In doing so, it aims to spark a new academic dialogue that examines the complex interplay among designers, consumers, and experience sharers, potentially fostering advancements in smartphone UI design towards greater sustainability and a more user-centric approach.
Influenced by the S–O–R (Stimulus–Organism–Response) model, user behavior should not be viewed as a simple passive response process driven by external stimuli. Users actively seek external information and form behavioral responses to stimuli through internal psychological processing [11]. This study posits that users sharing their experiences with smartphone UI through various channels also aligns with this Stimulus–Organism–Response relationship: users first receive external stimuli, then their internal motivation is stimulated, and finally, their sharing behavior is formed. Based on this, this study will utilize the S–O–R model framework, with the smartphone operating system UI design as the stimulus factor and personal internal motivation as the mediating variable, and through questionnaire surveys, explore the influence mechanism of UI user experience-sharing behavior, aiming to provide UI design improvement strategies and enhance digital product attention.

2. Theoretical Background and Hypothesis Development

2.1. Theoretical Background

2.1.1. S–O–R Theory

The S–O–R model is an important research framework in the fields of cognitive psychology and educational psychology, primarily used to study consumer purchasing behaviors. It has also demonstrated its versatility in exploring new social phenomena. For example, Wang et al. [12] used it to study the participation inclination in smart cities, while Saman Attiq et al. [13] used the model to reveal the mechanism by which a brand’s “coolness” enhances its competitiveness.
The core architecture of the S–O–R model includes three main elements. First are ‘Stimuli’, representing the triggering factors from the external environment. ‘Organism’ involves the individual’s emotional state and internal psychological mechanisms. Lastly, ‘Response’ is manifested as the individual’s attitude adjustment or behavioral reaction based on emotions and cognitive processes. The core assumption of the model is that external stimuli affect the individual’s emotions, which then drive specific behavioral performances [14]. Specifically, the stimulus factors, as external conditions, shape the basis of the response by affecting the individual’s cognitive processes and psychological states [15]. The organism-level processing covers a series of complex psychological activities and cognitive processes from receiving the stimulus to forming internal attitudes or external behaviors. According to the S–O–R model, stimuli encompass any elements capable of attracting user attention, such as visual components and interaction methods within a smartphone interface. These stimuli impact the user’s internal state—their cognitive, emotional, preferential, and physiological responses to the user interface experience. Consequently, this internal state influences user behavior, leading to actions like product usage or service engagement [16,17].
In the scenario of sharing user experiences in smartphone UI design, this behavior can be seen as a specific form of knowledge sharing, motivated by the psychological or cognitive changes that occur in individuals after encountering specific external stimuli, which then leads to the motivation to share knowledge and experiences, and is transformed into actual activity. Although existing research on knowledge sharing often focuses on the direct relationships between external stimuli, internal psychological states, and sharing behaviors or intentions [18], there has been less exploration of the specific dynamic processes by which external stimuli are internalized into individual psychological responses and ultimately lead to behavioral changes. In view of this, the present study aims to use the S–O–R model as a theoretical support to analyze the complex psychological mechanisms and dynamic evolutionary paths behind the behavior of sharing user experiences in smartphone UI design and to provide a deeper understanding of this occurrence.

2.1.2. Motivation Theory

Motivation, as the fundamental driving force behind individuals engaging in various activities, can be divided into two major categories: intrinsic and extrinsic. Extrinsic motivation originates from external demands or pressures and is reflected in the individual’s behavior aimed at material rewards or in achieving external goals (such as social status improvement, reputation accumulation, and economic benefits) [19]. This view echoes E. C. Tolman’s theory, which demonstrated the purpose-driven nature of behavior, revealing that the pursuit of expected rewards or the avoidance of adverse incidents is the root of behavioral motivation.
Different types of extrinsic motivation have varying effects on shaping individual behavior patterns [20], as found by Wang et al. [21] in their study of UI design experience sharing on social platforms. Participants were attracted by direct economic incentives (such as points, virtual currency, and rewards) and highly valued non-material rewards (such as likes, positive feedback, social status improvement, and social network enhancement). Particularly noteworthy is that individuals committed to building a positive personal image tend to exhibit a higher level of enthusiasm for knowledge sharing [22].
In contrast, intrinsic motivation stems from an individual’s internal satisfaction and happiness and is the driving force behind individuals actively contributing knowledge and assisting others. Altruistic sentiment and self-efficacy play central roles within this category. Under the framework of social cognitive theory, self-efficacy is defined as an individual’s confidence in their ability to complete specific tasks. This belief not only guides an individual’s choice behaviors, cognitive processing, and emotional responses but is also positively correlated with performance outcomes and negatively correlated with emotional stress [23]. Specifically, in terms of knowledge-sharing behavior, self-efficacy can significantly and directly influence the willingness of individuals to participate in knowledge-exchange activities in organizational and network environments [24].
In summary, the motivation for individuals to participate in user experience sharing is woven from two core forces. One is the extrinsic motivation driven by expectations of social status, reputation, material gains, and social circle optimization. The other is intrinsic motivation, driven by self-efficacy in knowledge sharing, which is the spiritual satisfaction and pleasure obtained from helping others solve problems. These two motivations intertwine and collectively form the deep psychological mechanism that inspires individuals to actively engage in user experience-sharing behavior.

2.1.3. UI Design User Experience

User experience (UX) is a multi-dimensional concept that encompasses the behaviors, emotional attitudes, and cognitive evaluations of individuals interacting with products, systems, or services. It involves various aspects of human–computer interaction, such as operability, emotional responses, perceived value, and evaluations of system functionality, usability, and efficiency. In the field of mobile devices, user experience is particularly important and is considered an integrated perception and reaction of users to the system [25]. Sensory input, as the primary contact point, plays a decisive role in driving consumer decision-making and promoting sharing behaviors [26].
User interface (UI) design is not only a key element of product design, but it is also an independent design product that needs to be carefully crafted from both functional and aesthetic perspectives [27]. The dimensions of UI design include, but are not limited to, aesthetics (appearance attractiveness), functionality (effectiveness in achieving set purposes), and symbolism (conveying user self-identity and social status through visual elements) [28]. These dimensions collectively impact user purchase intentions, word-of-mouth spread, and willingness to pay. For mobile device UI design, the components of user experience can be summarized as brand influence, usability, functionality, and content quality [29].
Usability is central to explaining the functional features of UI user experience and may interact with aesthetic dimensions. Some studies treat aesthetics and usability as distinct factors, implying that users evaluate these aspects separately [30]. However, alternative perspectives suggest an interplay between them. For example, interfaces that prioritize aesthetics may enhance user satisfaction and brand affinity, thereby indirectly influencing the perception of their usability [31,32]. Novelty reflects consumers’ subjective perception of product innovation [33], and the novelty of a product’s appearance can positively influence perceived performance quality [34], highlighting the aesthetic uniqueness and competitive strength of UI products. Enjoyment represents the aesthetic pleasure and fulfillment of functional needs derived from the product experience. Branding is a more complex component that encompasses the recognition and reputation of interface products and the emotional connection and trust between users and the brand. Brand image, as a heuristic device, influences users’ expectations and judgments regarding product quality and usability. Moreover, a strong brand identity can foster users’ loyalty and advocacy, motivating them to share positive experiences, thereby enhancing the brand’s visibility and appeal in the market [35].
Based on this, this study selects perceived usability, perceived novelty, perceived enjoyment, and perceived brand identity as core variables, aiming to deeply analyze how these factors influence the formation and dissemination of user experience in UI design. A comprehensive consideration of these variables will help reveal the specific mechanisms by which UI design promotes positive user experiences and user sharing behaviors.

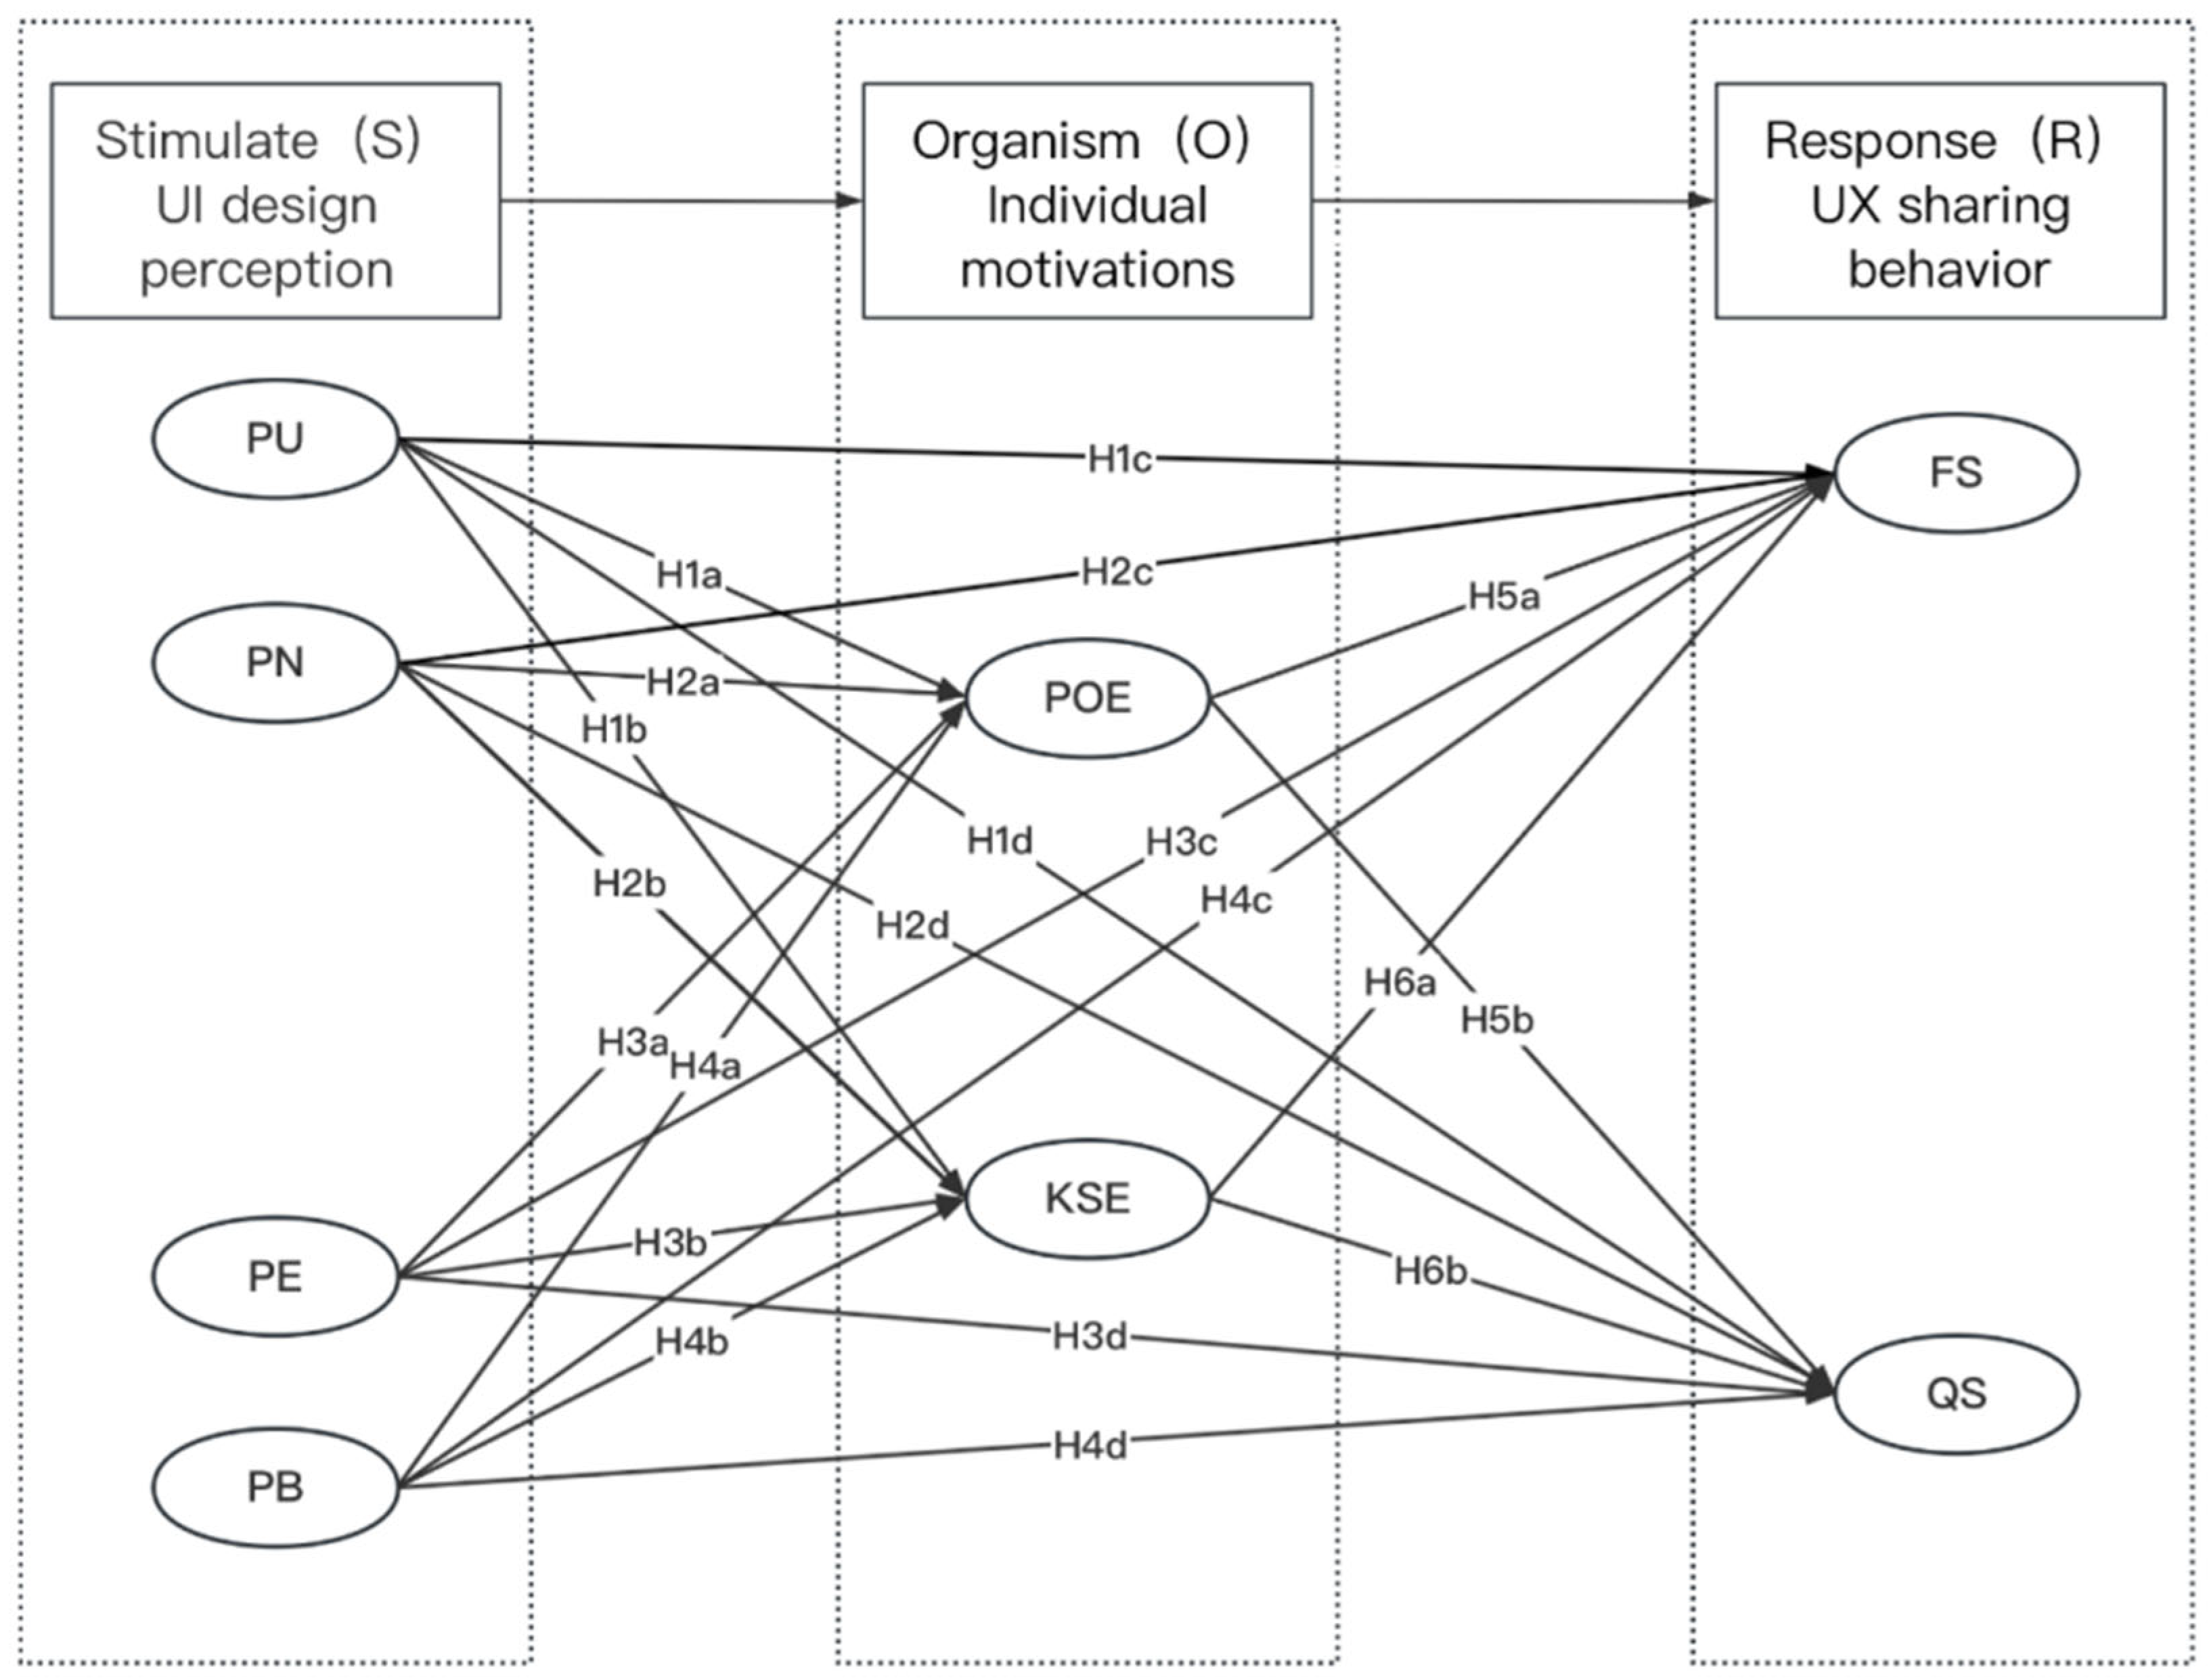
2.2. Research Hypothesis and Model Construction

This study constructs an innovative theoretical framework by integrating the S–O–R model with motivation theory, aimed at deeply analyzing the intrinsic mechanisms of UI user experience-sharing behavior (see Figure 1). Within this framework, the four key perceptual components of UI design, namely perceived usability, perceived novelty, perceived enjoyment, and perceived brand identity, form the external stimuli (S). These design features directly influence users’ cognitive and emotional evaluations of the UI experience. The organism level (O) includes outcome expectations and self-efficacy in knowledge exchange: outcome expectations represent external motivation, reflecting the feedback expected from sharing, while self-efficacy in knowledge exchange includes internal motivation, emphasizing the belief in the efficacy of sharing knowledge. These two motivational factors together shape the individual’s cognitive processing, emotional adjustment, and psychological preparedness in response to UI stimuli. The response (R) focuses on the actual sharing behaviors exhibited by users, specifically the frequency and quality of sharing. These behavioral responses directly stem from the individual’s internal digestion of and motivational drive from their perception of UI design. Thus, this study’s framework describes the complex dynamic process from the systemic perspective, where perceived traits of UI design, through internal motivational transformation, are externalized into specific sharing behaviors, providing a comprehensive and in-depth theoretical perspective for studying UI user experience-sharing behaviors.

2.2.1. Impact of Perceived Usability on Individual Motivation and UI Experience-Sharing Behavior

In the domain of product design, usability is a core element that satisfies user needs and plays a critical role in consumer product selection decisions [36]. Research outcomes in ergonomics and human–computer interaction provide valuable guidance to designers, enabling them to consciously adopt design features to enhance the objective usability of products during the development process [37]. However, the academic community has gradually recognized that, beyond objective aspects, the subjective usability and apparent usability of products cannot be overlooked. Apparent usability refers to the consumer’s pre-use estimation based on product appearance, assessing ease of use, functionality, and efficiency, i.e., the intuitive “ease of use” characteristics presented by the product [38]. The appearance of a product, as a key visual element, plays a decisive role in shaping apparent usability.
High-quality user interface (UI) design not only directly relates to the intensity of the motivation for information sharing but also indirectly enhances this intention by improving the perceived quality of the user experience [39]. In the context of smartphone UI experiences, users assess the usability of UI design through both intuitive perception and subjective experience. When this assessment is positive, that is, when users perceive high usability, their expectations of positive outcomes are not only strengthened but also stimulate intrinsic motivation for knowledge sharing, positively influencing the behavior of sharing user experiences. As such, we introduce the following hypotheses:
Hypothesis 1a (H1a).
Perceived usability positively influences users’ outcome expectations in individual motivation.
Hypothesis 1b (H1b).
Perceived usability positively influences users’ knowledge-sharing self-efficacy in individual motivation.
Hypothesis 1c (H1c).
Perceived usability positively influences the frequency of sharing smartphone UI usage experiences by users.
Hypothesis 1d (H1d).
Perceived usability positively influences the quality of sharing smartphone UI usage experiences by users.

2.2.2. Impact of Perceived Novelty on Individual Motivation and UI User Experience-Sharing Behavior

Perceived novelty, within the discipline of design, specifically refers to the degree of visual innovation of the user interface (UI) compared to existing market products and is an important dimension of design differentiation [40]. The user interface, as an intuitive expression of the product, significantly affects consumers’ cognitive structures [41]. Through continuous experience accumulation, consumers gradually form a prototypical impression of specific product categories in their minds, representing the standard model of that category in consumer consciousness [42]. Studies have shown that the novelty of a product is negatively correlated with its conformity to existing prototypes, meaning that the more a product design breaks with tradition, the more significant its novelty [34]. Visually novel UI designs not only effectively attract user attention [43] but are also often seen by users as a symbol of technological innovation, stimulating associations with product advancement [34,44]. Furthermore, the growing demands of consumers have prompted designers and researchers to explore the integration of emerging technologies and modern ways of life at a deeper level [45]. The continuous updating of appearance design is a vivid manifestation of the concept of product design sustainability, aiming to maintain the product’s place in the zeitgeist and market competitiveness. Therefore, in the context of significant innovation and upgrades, especially in UI design, perceived interface novelty is highly likely to trigger users’ intrinsic motivations, driving them to share their unique user experiences. As such, our hypotheses are as follows.
Hypothesis 2a (H2a).
Perceived novelty positively influences users’ personal outcome expectations in individual motivation.
Hypothesis 2b (H2b).
Perceived novelty positively influences users’ knowledge-sharing self-efficacy in individual motivation.
Hypothesis 2c (H2c).
Perceived novelty positively influences the frequency of users sharing their smartphone UI usage experience.
Hypothesis 2d (H2d).
Perceived novelty positively influences the quality of users sharing their smartphone UI usage experience.

2.2.3. The Influence of Perceived Enjoyment on Individual Motivation and UI User Experience-Sharing Behavior

Product appearance design is not only a carrier of visual expression but also carries a rich aesthetic and has a symbolic value. These elements are increasingly becoming key factors in influencing consumer decisions [46]. Aesthetic attributes play the role of creators of pleasant impressions in user consumption experiences and are an important component in the enhancement of user satisfaction [47]. Design aesthetics not only create an atmosphere of enjoyment but also correspond to users’ emotions, therefore deepening the emotional bond between users and products [48]. Research evidence shows that the skillful use of aesthetic design can significantly increase the frequency of interaction between users and products, directly promoting user sharing behaviors [49]. In the context of user interface (UI) design, aesthetic design elements, as dual catalysts for visual and emotional stimuli, have a positive impact on users’ willingness to share. Users often attribute the pleasurable experiences during use to the pleasing aesthetic features in UI design [50], activating users’ internal psychological mechanisms and promoting positive incentives for sharing behavior. As such, the following hypotheses are proposed:
Hypothesis 3a (H3a).
Perceived enjoyment positively influences the outcome expectations in users’ individual motivation.
Hypothesis 3b (H3b).
Perceived enjoyment positively influences the self-efficacy of knowledge sharing in users’ individual motivation.
Hypothesis 3c (H3c).
Perceived enjoyment positively influences the frequency of sharing smartphone UI user experiences.
Hypothesis 3d (H3d).
Perceived enjoyment positively influences the quality of sharing smartphone UI user experiences.

2.2.4. The Influence of Perceived Brand Image on Individual Motivation and UI User Experience-Sharing Behavior

The appearance of a product, as a visual carrier of information, conveys rich emotional meanings and quality images through its design features such as shape, color, and material. These visual features not only enhance the expressiveness of the brand image but are also key in the visual expression of brand identity [51]. Consumers tend to integrate the core values of the brand with the physical attributes of the product’s appearance, constructing a cognitive framework and emotional bonds with the brand at the level of psychology. In the practice of UI design, the aesthetic elements of graphic design, such as style, content, and color schemes, also carry the brand’s values and ideas, thereby becoming a medium for brand communication. Existing literature can sufficiently demonstrate that the symbolic meanings embedded in products occupy an increasingly important position in consumer decision-making and brand image construction [52]. Reputation, historical performance, and alignment with consumers’ values and expectations form the basis of consumer brand trust. This trust not only influences initial purchase decisions but also impacts customers’ propensity for repeat purchases and their willingness to recommend a specific brand to others [53]. Through the visual language of UI design, users can gain insights into the historical and cultural heritage and personality of the brand. This kind of visual enjoyment experience can effectively stimulate users’ intrinsic motivation and potentially positively influence their tendency to share their UI experiences. As such, we propose the following hypotheses:
Hypothesis 4a (H4a).
Perceived brand image positively influences the outcome expectations in users’ individual motivation.
Hypothesis 4b (H4b).
Perceived brand image positively influences the self-efficacy of knowledge sharing in users’ individual motivation.
Hypothesis 4c (H4c).
Perceived brand image positively influences the frequency of sharing smartphone UI user experiences.
Hypothesis 4d (H4d).
Perceived brand image positively influences the quality of sharing smartphone UI user experiences.

2.2.5. The Influence of Individual Outcome Expectations on UI User Experience-Sharing Behavior

Outcome expectations, as defined by Bartol (2002) [54], encompass individuals’ perspectives and evaluative understanding of the potential consequences of their behavior. Bandura’s (1989) [55] theoretical framework further categorizes outcome expectations into three core dimensions: physiological responses, social effects, and self-evaluation. In the field of knowledge sharing, outcome expectations linked to reward mechanisms have been identified as significant motivators driving individuals’ willingness to disseminate knowledge and engage in practical activities [54]. Sharing experiences of UI design can be seen as a specific manifestation of social interaction and mutually beneficial behavior, where users invest knowledge capital to build potential networks of feedback, mutual assistance, and cooperation through the exchange of information. The widespread availability of the Internet has greatly expanded the dissemination of user experience information, enabling users to establish broad social networks and follower groups through this platform. Users can thus reap diverse rewards such as approval, feedback, and economic incentives during this process, which have both material and immaterial aspects, as well as the accumulation of social capital. Most importantly, the act of sharing UI experiences has evolved into a strategy itself, through which users shape their professional images, and enhance their social statuses and peer recognition, thus further reinforcing the positive incentive role of outcome expectations on UI user experience-sharing behavior. As such, we assume that:
Hypothesis 5a (H5a).
Outcome expectations in individual motivation positively influence the frequency of sharing smartphone UI user experiences.
Hypothesis 5b (H5b).
Outcome expectations in individual motivation positively influence the quality of sharing smartphone UI user experiences.

2.2.6. The Influence of Knowledge-Sharing Self-Efficacy on UI User Experience-Sharing Behavior

Self-efficacy in knowledge sharing, as a specific application of self-efficacy theory in the context of knowledge sharing, describes the extent to which individuals assess their ability and confidence in providing useful information to support others in solving problems [56]. Existing literature demonstrates a positive correlation between an individual’s self-efficacy in knowledge sharing and the likelihood of engaging in knowledge-sharing behaviors [57]. This sense of efficacy is closely linked to the consistency perceived between knowledge-sharing behaviors and the individual’s internal value system; when personal actions align with personal values, this internal consistency becomes a significant driving force for knowledge-sharing behaviors [58].
Further research on the topic indicates that self-efficacy in knowledge sharing can not only positively correlate with the frequency of knowledge-sharing behaviors within communities but also with the quality of the shared content [59]. An individual’s knowledge-sharing behavior is a multidimensionally influenced outcome, involving the breadth and depth of their knowledge base, the ability to transform and structure knowledge, skills in disseminating knowledge efficiently, and the art of effectively communicating with diverse audiences in various contexts. Individuals with high levels of self-efficacy in knowledge sharing demonstrate greater ease and confidence when sharing information, which in turn further promotes the activity and depth of UI user experience-sharing behavior. As such, we suggest:
Hypothesis 6a (H6a).
Knowledge-sharing self-efficacy positively influences the frequency of sharing smartphone UI user experiences.
Hypothesis 6b (H6b).
Knowledge-sharing self-efficacy positively influences the quality of sharing smartphone UI user experiences.

3. Research Design

3.1. Questionnaire Design

This study adopted questionnaire surveys as the main tool for empirical analysis, constructed a measurement scale covering eight core variables based on previous literature, and adapted and optimized the measurement items according to the unique context of smartphone UI experiences and the special attributes of UI brand information (Table 1).
Specifically, the three measurement items for personal outcome expectations (POE) were adapted from the research of Wasko and Faraj (2005) [57], Compeau and Higgins (1995) [60], and Wang and Fesenmaier (2004) [61]. The three items for knowledge-sharing self-efficacy (KSE) are based on the work of Bandura (1982) and Hsu et al. (2007) [62,63]. The measurement of perceived usability (PU) employed the UMUX scale, a four-item scale designed for the subjective assessment of the perceived usability of applications. The UMUX scale, known for its good reliability and validity, as well as its concise measurement criteria, has been widely applied in the measurement of user experience [64,65].
The six measurement items for perceived novelty (PN) draw from the research of Rogers (2014) [33]. The four items for perceived enjoyment (PE) were adapted from the work of Blijlevens et al. (2017) [66]. The four items for perceived brand image (PB) integrate the research of Völckner and Sattler (2006) [67], Nam and Piao (2017) [68], and Liu and Zheng (2020) [35]. The two dependent variables of sharing behavior—frequency of sharing (FS) and quality of sharing (QS)—come from the studies of Hsu et al. (2007) [63] and Liao et al. (2021) [69]. The final survey instrument is presented in Appendix A. The questionnaire design utilized a Likert seven-point scale, requiring respondents to rate their agreement with the statements on a scale from 1 to 7, where 1 represents “strongly disagree” and 7 represents “completely agree”, to reflect respondents’ acceptance of each statement.

3.2. Sample and Data Collection

To verify the research hypotheses, this study conducted an online questionnaire survey from April 2023 to August 2023. Before engaging in the survey, all participants received a formal consent agreement, detailing the study’s objectives and assuring the confidentiality of their responses. This agreement underscored that the gathered data would be utilized exclusively for scholarly purposes, with strict anonymity maintained for all participants throughout the entirety of the research. The questionnaire was designed using the “Questionnaire Star” platform and was widely distributed via social media platforms such as WeChat, QQ, and Toutiao, effectively covering the Chinese smartphone user population. Data collection followed the principle of random sampling to ensure the representativeness of the sample.
During the survey period, spanning several months, a total of 682 users participated in the study. Considering the high smartphone penetration rate in China, which stands at 99.8%, it is assumed that nearly all participants have some experience with sharing. Following the exclusion of questionnaires completed in less than 60 s and those exhibiting identical responses across all items, the final effective sample size was determined to be 472. In our study, we followed the standard that the ratio of sample size to the number of items should be 10:1 [70,71]. The sample size of 472 meets the requirement to ensure the validity of the significance test. Descriptive statistics of the sample (Table 2) show that the age distribution of young users aged 18 to 30 years was as high as 77.6%, with males accounting for 39.2% and females 60.8%. In terms of educational background, 93.7% of respondents had an associate degree or higher level of education.
Most of the samples were collected from China, with the top three contributing regions being Jiangsu Province (142 samples), Guangdong Province (69 samples), and Henan Province (28 samples), which together account for approximately 51% of the total sample size. The geographic coverage of the sample sources extended across 85% of China’s administrative regions, excluding Hong Kong, Qinghai, Ningxia, Hainan, and Taiwan. In this study, the term “samples” refers to individual units, providing clarity on the nature of our data points.

4. Data Analysis Results

4.1. Reliability and Validity

Before conducting a comprehensive data analysis, this study implemented a small-scale preliminary test to meticulously pre-screen the questionnaire items. This process focused on evaluating the logical coherence, comprehensibility, arrangement order, and relevance to the research tasks of each item. Its aim was to fundamentally enhance the effectiveness and quality of data collection, ensuring the accuracy and reliability of subsequent analyses. Using the “Reliability Analysis” function of SPSS 26.0 software, the study selected Cronbach’s α coefficient as the standard for measuring internal consistency, and reliability analysis was performed on 108 valid samples. The analysis results showed that Cronbach’s α coefficients for all variables were above 0.8, reaching a satisfactory level of reliability.
To further verify the validity of the research variables, the study employed the Kaiser–Meyer–Olkin (KMO) measure and Bartlett’s test of sphericity to assess the suitability of factor analysis. As shown in Table 3, the KMO value was 0.868, exceeding the generally accepted threshold of 0.7, and the p-value of Bartlett’s test of sphericity was <0.001, indicating that the data samples are suitable for principal component analysis using factor analysis.
Exploratory factor analysis and principal component analysis were used to extract factors from the sample data. The cumulative variance contribution rate reached 75.36%, indicating that these factors adequately reflect the original data. Common factors were extracted using the maximum variance method through orthogonal rotation. The α rotation converged after 10 iterations, ultimately extracting six common factors with total variance > 1 (Table 4). As shown in Table 5, the factor loadings highlighted in bold are >0.5, meaning that all measurement items of these variables are consistent with their corresponding factors and align with the model assumptions.
For clarity, the theoretical framework and literature review establish PB and PE as distinct conceptual domains, thereby necessitating their treatment as separate, independent factors. Our reference to the exploratory factor analysis (EFA) results from SPSS adheres to this perspective, without conflating or merging the two parts.
This study conducted confirmatory factor analysis using AMOS 24.0 software to further test the reliability and validity of the variables. The CFA model evaluation yielded the following results: The chi-square value (χ2) was 669.010 with 349 degrees of freedom (df), resulting in a chi-square-to-degrees-of-freedom ratio (χ2/df) of 1.92, which is below the recommended threshold of 3.0. The root mean square error of approximation (RMSEA) was 0.044, below the criterion of 0.08. The goodness-of-fit index (GFI) was 0.908, exceeding the standard of 0.9. The adjusted goodness-of-fit index (AGFI) was 0.885, surpassing the standard of 0.8 [72]. Furthermore, the normed fit index (NFI), comparative fit index (CFI), and incremental fit index (IFI) were all greater than the benchmark of 0.9, with values of 0.944, 0.972, and 0.972, respectively. Together, these indices suggest that the CFA model exhibits a satisfactory level of model fit. Additionally, we have excluded the item “I do not want to share a frustrating mobile UI to use.” from the PU scale because its SMC value is 0.278, which is below the threshold of 0.36.
Table 6 indicates that the majority of standard factor loadings between observed variables and their corresponding latent variables exceed 0.7, falling within the acceptable range, suggesting a close relationship between observed variables and latent variables. To assess the convergent and discriminant validity of the model, the study calculated the average variance extracted (AVE) and the correlation coefficients between variables. The squared multiple correlations (SMC) values range from 0.391 to 0.863, the AVE values are all above the standard of 0.5, ranging from 0.511 to 0.803, and the composite reliability (CR) values are all above 0.7, meeting the standards set by Hair et al. [73] and Fornell and Larcker (1981) [74], indicating that the variables have high convergent validity.
To test the discriminant validity of the scales, this study examined the square root of the average variance extracted (AVE) for each variable compared to the correlation coefficients between those variables and other variables. As shown in Table 7, the bold numbers on the diagonal represent the square root of the AVE values, all of which are higher than the correlation coefficients with other variables. This indicates that the variables in the study have good discriminant validity.

4.2. Structural Model Analysis

This study employed AMOS 24.0 software to construct and evaluate the structural equations for model fitting, with the detailed results shown in Table 8. The chi-square statistic for our model, calculated based on 341 degrees of freedom, is 575.128, yielding a chi-square-to-degrees-of-freedom ratio (χ2/df) of 1.687 (p < 0.001). This ratio is considered favorable as it is below the recommended threshold of 3. The goodness-of-fit index (GFI) is 0.900, and the root mean square error of approximation (RMSEA) is 0.038, both suggesting an adequate model fit. Furthermore, the comparative fit index (CFI) is 0.980, which is indicative of a good model fit. Although the adjusted goodness-of-fit index (AGFI) at 0.900 is somewhat lower, it remains within the acceptable range for a well-fitted model [75]. The 90% confidence interval for the RMSEA further substantiates the robustness and reliability of the model fit. All indicators have met the required standards, indicating that the study model has a good fit with the data, possesses excellent explanatory and predictive capabilities, and confirms the suitability of the model for the research context.
Path coefficient estimates are shown in Figure 2. The results of the structural equation model indicate that the absolute values of the path coefficients range from 0 to 1. Considering the magnitude of each path coefficient, perceived usability (PU) has a more significant impact on knowledge-sharing self-efficacy (KSE) compared to PN, PE, and PB, while perceived enjoyment (PE) has a more significant impact on personal outcome expectations (POE) than PU, PN, and PB. Knowledge-sharing self-efficacy (KSE) has the greatest impact on the frequency of sharing UI experiences (FS). Perceived brand image (PB) has the greatest impact on the quality of sharing UI experiences (QS). Compared to personal outcome expectations (POE), knowledge-sharing self-efficacy (KSE) significantly influences user experience-sharing behavior.

4.3. Hypothesis Test

The data analysis indicated that the p-values for H1a, H1d, H2c, H2d, H3b, H3c, H3d, and H4a surpassed the standard threshold of statistical significance at 0.05. Conversely, the p-values for the remaining hypotheses were all at or below 0.05, suggesting statistical significance. As shown in Table 9, perceived usability (PU) can significantly and positively affect knowledge-sharing self-efficacy (KSE) and can have a negative correlation with sharing frequency (FS), but it does not have a significant direct impact on personal outcome expectations (POE) and sharing quality (QS). Therefore, hypotheses H1a, H1c, and H1d are not supported. Perceived novelty (PN) significantly promotes personal outcome expectations (H2a) and enhances knowledge-sharing self-efficacy (H2b), but its direct impact on sharing frequency (H2c) and quality (H2d) is not significant. This suggests that although perceived novelty can stimulate sharing motivations, its direct impact on the frequency and quality of sharing activities requires further investigation.
Perceived enjoyment (PE) only significantly affects personal outcome expectations (H3a), and its impact on other variables is not significant, so hypotheses H3b to H3d do not hold. Perceived brand image (PB) significantly and positively affects knowledge-sharing self-efficacy, sharing frequency, and sharing quality (H4b to H4d), but its direct impact on personal outcome expectations (H4a) is not significant. Additionally, personal outcome expectations (POE) and knowledge-sharing self-efficacy (KSE) have significant positive effects on enhancing sharing frequency (FS) and quality (QS) (H5a, H5b, H6a, H6b).

4.4. Mediation Test

This study, based on the S–O–R theoretical framework, constructed a user experience-sharing behavior model using personal outcome expectations (POE) and knowledge-sharing self-efficacy (KSE) as mediating variables. We used the Process tool to conduct mediation effect analysis, running 5000 bootstrap iterations to test the hypothesis within a 95% confidence interval. The test results are shown in Table 10. The results indicate that the perceived dimensions of UI design significantly mediate their impact on sharing frequency (FS) and quality (QS) through POE and KSE. Specifically, the impact of perceived usability (PU) on FS and QS through POE is 0.179 and 0.124, respectively, and through KSE mediation, both impacts are fully significant (0.378 and 0.202). The impact of perceived novelty (PN) on FS and QS through the two mediating variables is significant (0.190, 0.116, 0.334, and 0.163). Perceived enjoyment (PE) and perceived brand image (PB) also significantly affect FS and QS through the two mediating variables (PE: 0.168, 0.108, 0.243, and 0.142; PB: 0.122, 0.108, 0.191, and 0.139). Specifically, PU and PN have a mediating effect on FS through KSE, highlighting the importance of mediating variables in explaining the relationship between design perception and sharing behavior. The research results validate the theoretical model and provide deeper insights into how design perception affects user sharing through individual motivation, offering empirical evidence for the sustainable design of digital products.

5. Discussion and Conclusions

This study, grounded in the S–O–R theory model and employing Structural Equation Modeling (SEM) analysis, explores the impact of design perception characteristics (perceived usability, novelty, enjoyment, and brand image) on smartphone user interface (UI) experience-sharing behavior, while also investigating the mediating role of individual motivation. The findings indicate that perceived characteristics of UI design significantly influence user sharing behavior. While perceived usability (PU) exhibits a negative direct impact on sharing frequency (FS), its positive influence on FS and sharing quality (QS) is evidenced through the mediating roles of personal outcome expectations (POE) and knowledge-sharing self-efficacy (KSE), with a confirmed full mediation effect. This suggests that highly usable UI designs indirectly foster sharing behavior by enhancing users’ self-expectations and self-efficacy.
The present counterintuitive result implies that while highly optimized UI designs may immerse users in the experience, reducing the impulse to share externally, deeper motivational mechanisms still drive high-quality sharing. Perceived novelty (PN) can significantly and positively impact individual motivation and sharing quality, but not sharing frequency, underscoring the novelty of UI design as a significant factor for users, especially in enhancing sharing quality. This further underscores the need for continual innovation in UI design to stimulate users’ curiosity and unique experience sharing. Perceived enjoyment (PE) and perceived brand image (PB) notably influence individual motivation and consequently the frequency and quality of sharing behavior, with PB’s impact being particularly noteworthy, highlighting the pivotal role of brand power in shaping user sharing behavior. Brand recognition and cultural identity not only bolster user confidence but also foster broader and more frequent sharing. Smartphone UI experience-sharing behavior is positively driven by personal outcome expectations and knowledge-sharing self-efficacy within individual motivation, emphasizing the central role of intrinsic motives in promoting sharing, both in frequency and quality. This underscores the importance of design to not only prioritize functionality and aesthetics but also consider how to stimulate and meet users’ inner needs and expectations. Based on these findings, the ensuing discussions offer insights into the sustainable development of UI design and brand strategy.
Firstly, differentiation and innovation in UI design should be prioritized. Given the significance of perceived novelty for sharing quality, design teams should aim to create distinct UI elements, as even minor innovations in details can substantially enhance users’ willingness to share. Companies need to continuously explore more innovative visual expressions and interaction methods to break through the prevalent homogenization of the market. For instance, the release of the iPhone XS series in 2018 saw its wallpaper designs swiftly capture extensive public attention due to their striking visual impact. This achievement owes to Apple’s innovative approach—departing from the prevailing trend of fully digital image creation, they employed real-world photography and simulation techniques for wallpaper design. This counter-current creative ideology stands out in the digital era, highlighting not only the personalized charm of user interface (UI) design but also reinforcing the profound value of the brand. By adopting such innovative visual languages and interaction models, user emotions can be effectively aroused and engaged.
Secondly, the embedding of UI brand value should be strengthened. The comprehensive positive impact of perceived brand image on sharing behavior underscores the indispensability of brand in UI design. Consumers are increasingly seeking culturally infused products that embody innovative design elements. Concurrently, “vitality” has gained heightened importance within the discourse on cultural sustainability. This requires designers and researchers to move beyond traditional visual stereotypes and instead delve deeply into exploring the essence and significance of technology collaboration initiatives that better resonate with today’s youth demographic [76]. Businesses should integrate brand values and cultural depth into the design, convey brand stories through design, enhance user brand loyalty, and prompt users to share their experiences more readily. Branding not only serves as a symbol of trust but also as a catalyst for cross-platform sharing.
Lastly, design stimulates emotional resonance in the user experience. Design should prioritize enhancing the emotional aspects of user experience, meeting users’ basic needs while evoking deeper aesthetic and emotional resonance. Through simple, beautiful, and creative designs that satisfy users’ curiosity and desire for exploration, the intrinsic motivation to share can be heightened. The convergence of aesthetics and design styles has been shown to reduce users’ desire to share and their level of engagement. Therefore, UI designers should place greater emphasis on users’ micro-experiences, adopting a “micro-interaction” design approach [77]. By seizing every iteration opportunity, they can construct a unique design DNA and product narrative, thereby enhancing users’ sustained preference and recognition of the product. Additionally, designs should consider users’ psychological states in different contexts, crafting pleasurable and valuable sharing experiences.

6. Limitations and Further Research

This study explores the behavior of sharing user interface (UI) experiences among smartphone users and its influencing factors, with a particular focus on the mediating effect of individual motivation between design perception and attitudes toward knowledge exchange. While the study has yielded important insights, it also exhibits several limitations.
Firstly, the sampling was concentrated in a single geographical area, namely China, which may limit the generalizability of the findings globally. Cultural customs and technology adoption habits in different countries and regions may influence user sharing behavior differently, highlighting the necessity for future cross-cultural validation. Secondly, future research designs could consider including industrial design (ID) as a factor for a more comprehensive assessment of design impact. Lastly, this study used survey methods to explore sharing behavior, resulting in potentially abstract indicators. Future research might consider using focus groups or other small-scale expert user research methods, combined with practical operational experience, to enhance the persuasiveness of the research findings.

Author Contributions

Conceptualization, J.G.; methodology, J.G., W.J. and J.Y.; software, J.G. and W.J.; investigation, J.G. and W.J.; funding acquisition, J.Y.; writing—original draft preparation, J.G.; writing—review and editing, J.G. and J.Y. All authors have read and agreed to the published version of the manuscript.

Funding

This research has received funding from the National Social Science Foundation of China Key Project of Art Science (Grant No. 20AC003).

Institutional Review Board Statement

This study was conducted according to the guidelines of the Declaration of Helsinki and approved by the Medical Ethics Committee of Macau University of Science and Technology (Approval Code: MUST-20240718003).

Informed Consent Statement

Informed consent was obtained from all subjects involved in the study.

Data Availability Statement

Data are contained within the article. The raw data presented in this study are available upon request from the corresponding author.

Acknowledgments

We would like to express our sincere gratitude to the editors and the reviewers for their valuable insights and guidance throughout the peer review process.

Conflicts of Interest

The authors declare no conflicts of interest.

Appendix A

Table A1. Survey instrument.
ConstructsLatent VariableNO.Measurement Item
Individual motivationsPOEQ1I anticipate recognition from others when sharing mobile UI experiences.
Q2Sharing mobile UI experiences contributes to enhancing/maintaining my personal image.
Q3Sharing mobile UI experiences fosters deeper connections with friends.
KSEQ4I am confident in my ability to share mobile UI information.
Q5I am confident in my ability to share quality mobile UI product experiences.
Q6I am confident in the way I share mobile UI experiences.
UI design perceptionPUQ7I tend to share mobile UI designs that meet my personal needs.
Q8I enjoy sharing mobile UI designs that are easy and intuitive to operate.
Q9I avoid sharing mobile UI designs that require a long time to learn and adapt to.
PNQ10The mobile UI I share is innovative in functionality.
Q11The innovation in functionality of the mobile UI I share is necessary.
Q12The mobile UI I share is novel and unique in visual design.
Q13The mobile UI I share has distinctive visual effects.
Q14The innovation in the visuals of the mobile UI I share is valuable.
Q15The innovation in the visuals of the mobile UI I share is indispensable.
PEQ16The mobile UI design I share has outstanding aesthetic performance.
Q17The mobile UI I share is attractive.
Q18The mobile UI I share is pleasing to the senses.
Q19The mobile UI I share looks good.
PBQ20The mobile UI brand I share continues to launch high-quality products.
Q21The product quality of the mobile UI brand I share is above the market average.
Q22The products related to the mobile UI brand I share are very reliable.
Q23I have a deep understanding of the mobile UI brand I share.
UX sharing behaviorFSQ24I often share mobile UI experiences.
Q25I share mobile UI experiences more frequently than others.
Q26I invest a lot of time in sharing mobile UI experiences.
QSQ27My behavior when sharing mobile UI experiences is well-considered.
Q28The content of the mobile UI experiences I share is carefully thought out.
Q29When sharing mobile UI experience information, I incorporate my own views and opinions.

References

  1. Measuring Digital Development—Facts and Figures 2023. Available online: https://www.itu.int/hub/publication/d-ind-ict_mdd-2023-1/ (accessed on 6 May 2024).
  2. IDC: The Global Smartphone Market in 2023. 2024. Available online: https://www.idc.com/getdoc.jsp?containerId=prCHC51776924 (accessed on 6 May 2024).
  3. Cheung, C.M.; Shen, X.L.; Lee, Z.W.; Chan, T.K. Promoting sales of online games through customer engagement. Electron. Commer. Res. Appl. 2015, 14, 241–250. [Google Scholar] [CrossRef]
  4. Alalwan, A.A.; Rana, N.P.; Dwivedi, Y.K.; Algharabat, R. Social media in marketing: A review and analysis of the existing literature. Telemat. Inform. 2017, 34, 1177–1190. [Google Scholar] [CrossRef]
  5. Kotler, P.; Kartajaya, H.; Setiawan, I. Marketing 5.0: Technology for Humanity; John Wiley & Sons: Hoboken, NJ, USA, 2021; ISBN 978-1-119-66851-0. [Google Scholar]
  6. Zhang, H. Study on Impact of Mobile Internet APP Interface Design on Brand. In Proceedings of the 2016 2nd International Conference on Education, Social Science, Management and Sports (ICESSMS 2016), Orlando, FL, USA, 4–6 February 2016; Atlantis: Dordrecht, The Netherlands, 2016; pp. 433–440. [Google Scholar] [CrossRef]
  7. Lin, L.Y.; Lu, C.Y. The influence of corporate image, relationship marketing, and trust on purchase intention: The moderating effects of word-of-mouth. Tour. Rev. 2010, 65, 16–34. [Google Scholar] [CrossRef]
  8. Global Smartphone Shipments from 2009 to 2023. Available online: https://www.statista.com/statistics/271491/worldwide-shipments-of-smartphones-since-2009/ (accessed on 6 May 2024).
  9. Böhmer, M.; Hecht, B.; Schöning, J.; Krüger, A.; Bauer, G. Falling Asleep with Angry Birds, Facebook, and Kindle: A Large-Scale Study on Mobile Application Usage. In Proceedings of the 13th International Conference on Human-Computer Interaction with Mobile Devices and Services, Stockholm, Sweden, 30 August–2 September 2011; ACM: New York, NY, USA, 2011; pp. 47–56. [Google Scholar] [CrossRef]
  10. Hoehle, H.; Zhang, X.; Venkatesh, V. An espoused cultural perspective to understand continued intention to use mobile applications: A four-country study of mobile social media application usability. Eur. J. Inf. Syst. 2015, 24, 337–359. [Google Scholar] [CrossRef]
  11. Mehrabian, A.; Russell, J.A. An Approach to Environmental Psychology; The MIT Press: Cambridge, MA, USA, 1974; ISBN 9780262630719. [Google Scholar]
  12. Wang, Y.; Zhang, W.; Chu, J. What Drives Citizen’s Participate Intention in Smart City? An Empirical Study Based on Stimulus-Organism-Response (SOR) Theory. J. Knowl. Econ. 2023, 14, 1–23. [Google Scholar] [CrossRef]
  13. Attiq, S.; Abdul Hamid, A.B.; Khokhar, M.N.; Shah, H.J.; Shahzad, A. “Wow! It’s Cool”: How brand coolness affects the customer psychological well-being through brand love and brand engagement. Front. Psychol. 2022, 13, 923870. [Google Scholar] [CrossRef] [PubMed]
  14. Lin, S.W.; Lo, L.Y.S. Evoking online consumer impulse buying through virtual layout schemes. Behav. Inf. Technol. 2016, 35, 38–56. [Google Scholar] [CrossRef]
  15. Lorenzo-Romero, C.; Alarcón-del-Amo, M.D.C.; Gómez-Borja, M.Á. Analyzing the user behavior toward electronic commerce stimuli. Front. Behav. Neurosci. 2016, 10, 224. [Google Scholar] [CrossRef]
  16. Chin, D.N. The Fifth International Conference on User Modeling. AI Mag. 1997, 18, 85. [Google Scholar] [CrossRef]
  17. Kim, J.-H.; Park, J.-W. The Effect of Airport Self-Service Characteristics on Passengers’ Perceived Value, Satisfaction, and Behavioral Intention: Based on the SOR Model. Sustainability 2019, 11, 5352. [Google Scholar] [CrossRef]
  18. Cao, X.; Sun, J. Exploring the effect of overload on the discontinuous intention of social media users: An SOR perspective. Comput. Hum. Behav. 2018, 81, 10–18. [Google Scholar] [CrossRef]
  19. Lawler, E.E.; Porter, L.W.; Tennenbaum, A. Managers’ attitudes toward interaction episodes. J. Appl. Psychol. 1968, 52, 432–439. [Google Scholar] [CrossRef]
  20. Roca, J.C.; Gagné, M. Understanding e-learning continuance intention in the workplace: A self-determination theory perspective. Comput. Hum. Behav. 2008, 24, 1585–1604. [Google Scholar] [CrossRef]
  21. Wang, W.T.; Hou, Y.P. Motivations of employees’ knowledge sharing behaviors: A self-determination perspective. Inf. Organ. 2015, 25, 1–26. [Google Scholar] [CrossRef]
  22. Yu, J.; Jiang, Z.; Chan, H.C. Knowledge contribution in problem solving virtual communities: The mediating role of individual motivations. In Proceedings of the 2007 ACM SIGMIS CPR Conference on Computer Personnel Research: The Global Information Technology Workforce, St. Louis, MO, USA, 19–21 April 2007; ACM: New York, NY, USA, 2007; pp. 144–152. [Google Scholar] [CrossRef]
  23. Bandura, A.; Cervone, D. Differential engagement of self-reactive influences in cognitive motivation. Organ. Behav. Hum. Decis. Process. 1986, 38, 92–113. [Google Scholar] [CrossRef]
  24. Chen, S.S.; Chuang, Y.W.; Chen, P.Y. Behavioral intention formation in knowledge sharing: Examining the roles of KMS quality, KMS self-efficacy, and organizational climate. Knowl.-Based Syst. 2012, 31, 106–118. [Google Scholar] [CrossRef]
  25. Ayada, W.M.; Hammad, M.A.E.E. Design quality criteria for smartphone applications interface and its impact on user experience and usability. Int. Des. J. 2023, 13, 339–354. [Google Scholar] [CrossRef]
  26. Rajaguru, R. Motion picture-induced visual, vocal and celebrity effects on tourism motivation: Stimulus organism response model. Asia Pac. J. Tour. Res. 2014, 19, 375–388. [Google Scholar] [CrossRef]
  27. Noble, C.H.; Kumar, M. Using product design strategically to create deeper consumer connections. Bus. Horiz. 2008, 51, 441–450. [Google Scholar] [CrossRef]
  28. Homburg, C.; Schwemmle, M.; Kuehnl, C. New product design: Concept, measurement, and consequences. J. Mark. 2015, 79, 41–56. [Google Scholar] [CrossRef]
  29. Rubinoff, R. How to Quantify the User Experience. Design & UX. 2004. Available online: https://www.sitepoint.com/quantify-user-experience/ (accessed on 6 May 2024).
  30. Alharoon, D.; Gillan, D.J. The Relation of the Perceptions of Aesthetics and Usability. Proc. Hum. Factors Ergon. Soc. Annu. Meet. 2020, 64, 1876–1880. [Google Scholar] [CrossRef]
  31. Hassenzahl, M. The Interplay of Beauty, Goodness, and Usability in Interactive Products. Hum.–Comput. Interact. 2004, 19, 319–349. [Google Scholar] [CrossRef]
  32. Hamborg, K.-C.; Hülsmann, J.; Kaspar, K. The Interplay between Usability and Aesthetics: More Evidence for the “What Is Usable Is Beautiful” Notion. Adv. Hum.-Comput. Interact. 2014, 2014, 946239. [Google Scholar] [CrossRef]
  33. Rogers, E.M.; Singhal, A.; Quinlan, M.M. Diffusion of innovations. In An Integrated Approach to Communication Theory and Research, 3rd ed.; Don, W.S., Michael, B.S., Kristen, C., Eds.; Routledge Press: London, UK, 2014; pp. 432–448. ISBN 978-1138561472. [Google Scholar]
  34. Mugge, R.; Schoormans, J.P.L. Newer is better! The influence of a novel appearance on the perceived performance quality of products. J. Eng. Des. 2012, 23, 469–484. [Google Scholar] [CrossRef]
  35. Liu, Z.C.; Zheng, Y. The Influential Mechanism of Perceived Product Innovativeness on Brand Loyalty. South China Univ. Technol. (Soc. Sci. Ed.) 2020, 22, 30–38. [Google Scholar] [CrossRef]
  36. Mack, Z.; Sharples, S. The importance of usability in product choice: A mobile phone case study. Ergonomics 2009, 52, 1514–1528. [Google Scholar] [CrossRef] [PubMed]
  37. Tenner, E. The design of everyday things by donald norman (review). Technol. Cult. 2015, 56, 785–787. [Google Scholar] [CrossRef]
  38. Fenko, A.; Schifferstein, H.N.; Hekkert, P. Shifts in sensory dominance between various stages of user–product interactions. Appl. Ergon. 2010, 41, 34–40. [Google Scholar] [CrossRef] [PubMed]
  39. McMillan, S.J.; Hwang, J.S.; Lee, G. Effects of structural and perceptual factors on attitudes toward the website. J. Advert. Res. 2003, 43, 400–409. [Google Scholar] [CrossRef]
  40. Talke, K.; Salomo, S.; Wieringa, J.E.; Lutz, A. What about design newness? Investigating the relevance of a neglected dimension of product innovativeness. J. Prod. Innov. Manag. 2009, 26, 601–615. [Google Scholar] [CrossRef]
  41. Raskin, J. The Humane Interface: New Directions for Designing Interactive Systems; Addison-Wesley Professional: Boston, MA, USA, 2000. [Google Scholar] [CrossRef]
  42. Mervis, C.B.; Rosch, E. Categorization of natural objects. Annu. Rev. Psychol. 1981, 32, 89–115. [Google Scholar] [CrossRef]
  43. Schoormans, J.P.L.; Robben, H.S.J. The effect of new package design on product attention, categorization and evaluation. J. Econ. Psychol. 1997, 18, 271–287. [Google Scholar] [CrossRef]
  44. Rindova, V.P.; Petkova, A.P. When is a new thing a good thing? Technological change, product form design, and perceptions of value for product innovations. Organ. Sci. 2007, 18, 217–232. [Google Scholar] [CrossRef]
  45. Qin, Z.; Ng, S. Culture as Inspiration: A Metaphorical Framework for Designing Products with Traditional Cultural Properties (TCPs). Sustainability 2020, 12, 7171. [Google Scholar] [CrossRef]
  46. Creusen, M.E.; Schoormans, J.P. The different roles of product appearance in consumer choice. J. Prod. Innov. Manag. 2005, 22, 63–81. [Google Scholar] [CrossRef]
  47. Pandey, R. Impact of Aesthetics in Innovative Product Development on Consumer Perception and Acceptance. ECS Trans. 2022, 107, 9915. [Google Scholar] [CrossRef]
  48. Noble, C.H.; Kumar, M. Exploring the appeal of product design: A grounded, value-based model of key design elements and relationships. J. Prod. Innov. Manag. 2010, 27, 640–657. [Google Scholar] [CrossRef]
  49. Verganti, R. Design, meanings, and radical innovation: A metamodel and a research agenda. J. Prod. Innov. Manag. 2008, 25, 436–456. [Google Scholar] [CrossRef]
  50. Desmet, P.M.; Porcelijn, R.; Van Dijk, M.B. Emotional design; application of a research-based design approach. Knowl. Technol. Policy 2007, 20, 141–155. [Google Scholar] [CrossRef]
  51. Schmitt, B.H. Who is the Chinese consumer? Segmentation in the People’s Republic of China. Eur. Manag. J. 1997, 15, 191–194. [Google Scholar] [CrossRef]
  52. Bloch, P.H. Seeking the ideal form: Product design and consumer response. J. Mark. 1995, 59, 16–29. [Google Scholar] [CrossRef]
  53. Rudzewicz, A.; Strychalska-Rudzewicz, A. The Influence of Brand Trust on Consumer Loyalty. Eur. Res. Stud. 2021, XXIV, 454–470. [Google Scholar] [CrossRef]
  54. Bartol, K.M.; Srivastava, A. Encouraging knowledge sharing: The role of organizational reward systems. J. Leadersh. Organ. Stud. 2002, 9, 64–76. [Google Scholar] [CrossRef]
  55. Bandura, A. Human agency in social cognitive theory. Am. Psychol. 1989, 44, 1175–1184. [Google Scholar] [CrossRef]
  56. Chen, C.J.; Hung, S.W. To give or to receive? Factors influencing members’ knowledge sharing and community promotion in professional virtual communities. Inf. Manag. J. 2010, 47, 226–236. [Google Scholar] [CrossRef]
  57. Wasko, M.M.; Faraj, S. Why should I share? Examining social capital and knowledge contribution in electronic networks of practice. MIS Q. 2005, 29, 35–57. [Google Scholar] [CrossRef]
  58. Lin, M.J.J.; Hung, S.W.; Chen, C.J. Fostering the determinants of knowledge sharing in professional virtual communities. Comput. Hum. Behav. 2009, 25, 929–939. [Google Scholar] [CrossRef]
  59. Sedighi, M.; Lukosch, S.; Brazier, F.; Hamedi, M.; Van Beers, C. Multi-level knowledge sharing: The role of perceived benefits in different visibility levels of knowledge exchange. Int. J. Knowl. Manag. 2018, 22, 1264–1287. [Google Scholar] [CrossRef]
  60. Compeau, D.R.; Higgins, C.A. Application of social cognitive theory to training for computer skills. Inf. Syst. Res. 1995, 6, 118–143. [Google Scholar] [CrossRef]
  61. Wang, Y.; Fesenmaier, D.R. Towards understanding members’ general participation in and active contribution to an online travel community. Tour. Manag. 2004, 25, 709–722. [Google Scholar] [CrossRef]
  62. Bandura, A. Self-efficacy mechanism in human agency. Am. Psychol. 1982, 37, 122–147. [Google Scholar] [CrossRef]
  63. Hsu, M.H.; Ju, T.L.; Yen, C.H.; Chang, C.M. Knowledge sharing behavior in virtual communities: The relationship between trust, self-efficacy, and outcome expectations. Int. J. Hum.-Comput. Stud. 2007, 65, 153–169. [Google Scholar] [CrossRef]
  64. Finstad, K. The usability metric for user experience. Interact. Comput. 2010, 22, 323–327. [Google Scholar] [CrossRef]
  65. Bosley, J.J. Creating a Short Usability Metric for User Experience (UMUX) Scale. Interact. Comput. 2013, 25, 317–319. [Google Scholar] [CrossRef]
  66. Blijlevens, J.; Thurgood, C.; Hekkert, P.; Chen, L.L.; Leder, H.; Whitfield, T.W. The Aesthetic Pleasure in Design Scale: The development of a scale to measure aesthetic pleasure for designed artifacts. Psychol. Aesthet. Creat. Arts 2017, 11, 86–98. [Google Scholar] [CrossRef]
  67. Völckner, F.; Sattler, H. Drivers of brand extension success. J. Mark. 2006, 70, 18–34. [Google Scholar] [CrossRef]
  68. Nam, Y.; Shanji, P. Moderator Effect of Product Involvement and Brand Familiarity on the Relationship of Country of Manufacture and Chinese Consumers’ Product Attitude. J. China Stud. 2017, 20, 1–16. [Google Scholar] [CrossRef]
  69. Liao, B.Y.; Li, Y.R.; Liu, S.Y. Research on Influencing Factors of Advertisements Sharing Behavior of Users on WeChat Moments in China. Chin. J. Journal. Communication 2021, 43, 118–140. [Google Scholar] [CrossRef]
  70. Bentler, P.M.; Chou, C.-P. Practical Issues in Structural Modeling. Sociol. Methods Res. 1987, 16, 78–117. [Google Scholar] [CrossRef]
  71. Jackson, D.L. Revisiting Sample Size and Number of Parameter Estimates: Some Support for the N:Q Hypothesis. Struct. Equ. Model. Multidiscip. J. 2003, 10, 128–141. [Google Scholar] [CrossRef]
  72. Zhu, B.; Kowatthanakul, S.; Satanasavapak, P. Generation Y Consumer Online Repurchase Intention in Bangkok: Based on Stimulus-Organism-Response (SOR) Model. IJRDM 2019, 48, 53–69. [Google Scholar] [CrossRef]
  73. Hair, J.F.; Black, W.C.; Babin, B.J.; Anderson, R.E. Multivariate Data Analysis, 7th ed.; Pearson Prentice Hall Press: Upper Saddle River, NJ, USA, 2014; ISBN 978-0138132637. [Google Scholar]
  74. Fornell, C.; Larcker, D.F. Evaluating structural equation models with unobservable variables and measurement error. J. Mark. Res. 1981, 18, 39–50. [Google Scholar] [CrossRef]
  75. Tan, R.; Wu, Y.; Zhang, S. Walking in Tandem with the City: Exploring the Influence of Public Art on Encouraging Urban Pedestrianism within the 15-Minute Community Living Circle in Shanghai. Sustainability 2024, 16, 3839. [Google Scholar] [CrossRef]
  76. Qin, Z.; Song, Y.; Tian, Y. The Impact of Product Design with Traditional Cultural Properties (TCPs) on Consumer Behavior Through Cultural Perceptions: Evidence from the Young Chinese Generation. Sustainability 2019, 11, 426. [Google Scholar] [CrossRef]
  77. Saffer, D. Microinteractions: Designing with Details; O’Reilly Media, Inc.: Sebastopol, CA, USA, 2013; ISBN 978-1-4493-4280-7. [Google Scholar]
Figure 1. Research model. FS = frequency of sharing; QS = quality of sharing; POE = personally relevant outcome expectations; KSE = knowledge-sharing self-efficacy; PU = perceived usability; PN = perceived novelty; PE = perceived enjoyment; PB = perceived brand image.
Sustainability 16 06670 g001
Figure 2. Results of structural equation model. (Note: * p < 0.05; ** p < 0.01; *** p < 0.001).
Sustainability 16 06670 g002
Table 1. Measurement items reference.
ConstructLatent VariableReference Source
Individual motivations1. POEWasko and Faraj (2005) [57]
Compeau and Higgins (1995) [60]
Wang and Fesenmaier (2004) [61]
2. KSEBandura (1982) [62]
Hsu et al. (2007) [63]
UI design perception1. PUFinstad (2010)—UMUX [64]
J. Bosley (2013) [65]
2. PNRogers (2014) [33]
3. PEBlijlevens, J. et al. (2017) [66]
4. PBVölckner and Sattler (2006) [67]
Nam and Piao (2017) [68]
Liu and Zheng (2020) [35]
UX sharing behavior1. FS
2. QS
Hsu et al. (2007) [63]
Liao et al. (2021) [69]
Table 2. Demographic characteristics of the sample (N = 472).
ItemsIndexFrequencyPercentage
GenderMale identifying18539.2%
Female identifying28760.8%
Age<1840.8%
18–2526656.4%
26–3010021.2%
31–406313.3%
41–44285.9%
>45112.3%
EducationHigh school and technical secondary school306.4%
Associate degree12326.1%
Bachelor’s Degree26455.9%
Master’s Degree and above5511.7%
Table 3. KMO and Bartlett’s test results.
KMO Measure of Sampling Adequacy 0.868
Bartlett’s Test of SphericityApprox. Chi-Square1935.632
df28
Sig.0.000
Table 4. Exploratory factor analysis of variables.
ComponentsInitial EigenvaluesRotated Sums of Squared Loadings
Total% of VarianceCumulative %Total% of VarianceCumulative %
113.54146.69246.6925.30218.28418.284
22.6439.11555.8074.89816.88835.172
31.9446.70362.5093.43611.84947.021
41.4144.87567.3853.38511.67258.693
51.2344.25571.642.598.9367.624
61.0793.71975.3592.2437.73575.359
Table 5. Factor load coefficients after rotation.
Latent VariableNO.Factor1Factor2Factor3Factor4Factor5Factor6
POEQ10.1960.160.1970.1410.8000.07
Q20.2330.2010.1770.1430.7940.089
Q30.1910.2760.0850.1280.7630.126
KSEQ40.2070.2790.3860.710.197−0.031
Q50.1640.3240.370.7110.2250.007
Q60.1310.2370.3940.7230.198−0.007
PUQ70.2890.386−0.0170.5890.2120.221
Q80.1940.341−0.1650.6090.0590.361
Q90.1940.238−0.0450.547−0.0220.201
PNQ100.2390.7190.0980.2880.1650.098
Q110.2510.7650.1150.1990.1660.178
Q120.2770.8030.0510.2520.1210.119
Q130.2780.8090.080.2540.1750.115
Q140.2310.7800.1190.2280.1890.141
Q150.2650.7660.1590.2150.1640.119
PEQ160.6900.273−0.0040.2750.1910.257
Q170.7100.2480.0240.2930.2430.194
Q180.7130.2270.0110.2820.2950.24
Q190.7110.2690.030.2220.2770.235
PBQ200.7650.2280.2940.1020.0520.028
Q210.7520.2380.2750.1610.061−0.014
Q220.7980.2050.2480.0790.080.106
Q230.6800.2030.3120.0160.1450.118
FSQ240.2570.0980.7970.1280.140.218
Q250.1680.0920.8310.1320.1250.217
Q260.2070.070.8450.0820.140.199
QSQ270.1920.1950.4860.0870.150.687
Q280.1720.2170.3870.1410.1140.742
Q290.2880.1940.2610.1760.1110.701
Table 6. Confirmatory factor analysis results.
PathEstimateSMCCACRAVE
Q1 ← POE0.7580.5750.8530.8390.634
Q2 ← POE0.8280.686
Q3 ← POE0.8020.643
Q4 ← KSE0.8930.7970.9240.9250.803
Q5 ← KSE0.9290.863
Q6 ← KSE0.8660.750
Q7 ← PU0.8840.7810.7730.8050.584
Q8 ← PU0.7610.579
Q9 ← PU0.6250.391
Q10 ← PN0.8110.6580.9430.9400.725
Q11 ← PN0.8410.707
Q12 ← PN0.8620.743
Q13 ← PN0.8910.794
Q14 ← PN0.8570.734
Q15 ← PN0.8440.712
Q16 ← PE0.8590.7380.9340.9330.779
Q17 ← PE0.8810.776
Q18 ← PE0.9030.815
Q19 ← PE0.8860.785
Q20 ← PB0.8480.7190.9000.9070.709
Q21 ← PB0.8640.746
Q22 ← PB0.8820.778
Q23 ← PB0.7700.593
Q24 ← FS0.8920.7960.9340.9340.825
Q25 ← FS0.9040.817
Q26 ← FS0.9290.863
Q27 ← QS0.9010.8120.8830.8860.722
Q28 ← QS0.8810.778
Q29 ← QS0.7610.581
Notes: SMC = squared multiple correlations; CA = Cronbach’s alpha; CR = composite reliability; AVE = average variance extracted.
Table 7. Results of the discriminant validity test.
PEPNPBPUPOEKSEFQFS
PE0.882
PN0.6920.851
PB0.7750.5950.842
PU0.6630.7490.5140.762
POE0.6180.6010.4970.5330.796
KSE0.5610.6640.5040.6860.5550.896
FQ0.5320.5390.5380.4710.4730.5060.850
FS0.410 0.3870.5110.2920.4350.5140.6600.908
Table 8. Model fit index.
Fit Indexχ2/dfGFIAGFICFIIFIRMSEA
Standard1 > NC < 3>0.90>0.90>0.90>0.90>0.08
Result1.6870.9220.9000.9800.9800.038
Table 9. Hypothesis report and structural equation model estimate.
Structural PathStandardized EstimatesNon-Standardized EstimatesS.E.t-Valuep-ValueResult
H1aPU POE0.0730.0720.0760.9500.342No
H1bPU KSE0.4100.4530.0795.757***Yes
H1cPU FS−0.209−0.2440.096−2.527*No
H1dPU QS0.010.010.0850.1190.906No
H2aPN POE0.2900.2860.0783.668***Yes
H2bPN KSE0.2890.3230.0764.222***Yes
H2cPN FS−0.075−0.0880.092−0.9620.336No
H2dPN QS0.1370.1430.0821.7440.081No
H3aPE POE0.3170.3170.0903.521***Yes
H3bPE KSE−0.019−0.0210.086−0.2490.803No
H3cPE FS−0.082−0.0970.105−0.9620.336No
H3dPE QS0.0540.0570.0940.6090.543No
H4aPB POE0.0630.070.0850.8230.411No
H4bPB KSE0.1390.1750.0812.151*Yes
H4cPB FS0.4060.5370.0995.448***Yes
H4dPB QS0.2570.3040.0873.476***Yes
H5aPOE FS0.1970.2350.0773.058**Yes
H5bPOE QS0.1250.1330.0681.939*Yes
H6aKSE FS0.4390.4630.0716.553***Yes
H6bKSE QS0.180.1690.0622.731**Yes
Note: * p < 0.05; ** p < 0.01; *** p < 0.001.
Table 10. Results of the mediation effect test.
Mediation PathEffect SizeStd. ErrorBootstrap 95% CIResult
LLCIULCI
PU => POE => FS0.1790.0290.0920.203Supported
PU => POE => QS0.1240.0260.0740.178Supported
PU => KSE => FS0.3780.0350.2330.372Supported
PU => KSE => QS0.2020.0340.1330.265Supported
PN => POE => FS0.1900.0320.0960.218Supported
PN => POE => QS0.1160.0310.0560.178Supported
PN => KSE => FS0.3340.0370.2000.344Supported
PN => KSE => QS0.1630.0380.0870.236Supported
PE => POE => FS0.1680.0310.0830.203Supported
PE => POE => QS0.1080.0290.0550.171Supported
PE => KSE => FS0.2430.0310.1440.265Supported
PE => KSE => QS0.1420.0290.0900.203Supported
PB => POE => FS0.1220.0250.0540.151Supported
PB => POE => QS0.1080.0250.0600.160Supported
PB => KSE => FS0.1910.0270.1050.210Supported
PB => KSE => QS0.1390.0270.0860.192Supported
Disclaimer/Publisher’s Note: The statements, opinions and data contained in all publications are solely those of the individual author(s) and contributor(s) and not of MDPI and/or the editor(s). MDPI and/or the editor(s) disclaim responsibility for any injury to people or property resulting from any ideas, methods, instructions or products referred to in the content.

