Abstract
In the framework of the implementation of the all-Russian climatic project “Carbon measurement test sites”, reference soils of “Seven Larches” carbon supersite, which is a benchmark and the only monitoring site in the Artistic latitudes, were investigated. The morphological structure of representative soils was specified, and it was found that soils are classified as Cryosols of different types (Histic, Stagnic or Gleyic). The basic physico-chemical characteristics of the soils were studied. By means of elemental analysis and 13C NMR spectroscopy, the composition and molecular structure of humic acids from organic and mineral soil horizons were studied. The surface (organic) soil horizons are characterized by high values of H:C molar ratios (1.2–1.3), which indicates a lower degree of the molecular structure aromaticity of humic acids from organic soil horizons. Analysis of the molecular structure of humic acids by 13C NMR spectroscopy showed that humic acids of the studied soils are characterized by the predominance of non-substituted aliphatic (0–47 ppm) and aromatic (108–164 ppm) fragments. Mineral soil horizons are characterized by higher stabilization of organic matter (with lower SOC content—0.5–0.9%) and higher hydrophobicity of humic acid molecules. Comparison of the obtained results with previously published data on the structural and elemental composition of humic acids isolated from soils of similar genesis and geographical location did not reveal any significant differences between the data obtained by us and previously published data. Thus, for “Seven Larches” carbon supersite “reference” parameters of elemental composition of humic acids, their molecular composition and degree of stabilization of soil organic matter were identified.
1. Introduction
“Carbon measurement test sites” (or carbon measurement supersites) is an all-Russian climatic project launched in 2022, which represents a network of many terrestrial plots located in different natural zones of Russia. Each carbon supersite is characterized by parameters typical of its natural zone, such as relief, structure of vegetation, and soil cover, and it represents a “reference” ecosystem [1,2,3]. The functioning of Carbon supersites is focused on the development and testing of technologies to control and measure the emission of various climatically active gases [2,4]. Currently, 18 Carbon supersites with a total area of more than 39,000 hectares are working in Russia, which covers various types of terrestrial and aquatic ecosystems, as well as agro-ecosystems [2]. “Seven Larches” carbon supersite is the only reference site that is located in the Arctic latitudes (66.6993, 66.2684), namely in the Yamal-Nenets Autonomous Okrug (YNAO).
One of the most important tasks implemented within the framework of the Carbon measurement supersites project is the assessment of stocks and trends of soil organic matter (SOM) stabilization in different reference ecosystems for various natural regions [5,6]. The stabilization of SOM consists of its resistance to various biotic and abiotic influences; in particular, it means the transition of SOM to a biodegradation-tolerant state [7,8]. Humic acids (HA) are defined as a complex of polydisperse substances, which are formed in soils as a result of a combination of biochemical reactions in the process of decomposition and transformation of plant and microorganism mortmass [6,7,8]. Their functional features depend on a number of factors, such as climate, composition of humification precursors, and taxonomic composition of soil microbiota [9,10,11]. To be considered sequestered, organic matter must not only be released into the soil but become stabilized, becoming protected from rapid decomposition but capable of slow mineralization [12,13]. Whereas soil carbon sequestration necessarily involves the removal of CO2 from the atmosphere through the production of new biomass, sequestration aims to retain organic carbon in the soil and prevent its relatively rapid return from the soil to the atmosphere during mineralization [12,14]. Soil humic acids (HA) parameters (hydrophobicity of molecules, etc.) can be indicators of soil SOM stabilization [15]. SOM and soil organic carbon (SOC) play a crucial role in the global carbon cycle. A significant carbon stock is deposited in soils; its pool of soil carbon is more than three times larger than that of atmospheric carbon and 4 times larger than that of biotic carbon [16,17]. According to some estimates, up to 20% of the world’s SOC stocks are accumulated in Russia [18]. World soil carbon stocks are currently estimated from 1417 to 1824 Pg SOC in a meter layer of soil, while in Russian territory, carbon stocks in a meter layer of soil are estimated from 285 to 364 Pg [19,20]. The amount of accumulated carbon varies with the genesis and composition of soils and soil horizons. Thus, 9% of SOC (in a 30-centimeter layer) is accumulated in litter and fallen leaves, another 9% in semihydromorphic peat soils, 20% in peat bog soils, 62% in mineral soil horizons [20]. Permafrost soils of high-latitude ecosystems play a special role in carbon storage as they deposit large amounts of carbon and are a climate-sensitive component of the global carbon cycle [21,22,23]. There are various estimates of carbon stocks in the northern permafrost region ranging from 380 ± 58 and 813 ± 136 Pg for 100 and 300 cm soil depths [24] to 510 Pg (−78 to +79 Pg) and 1000 (−170 to +186 Pg) for 100 and 300 cm soil depths [22]. Climate warming enhances the decomposition of organic matter deposited in permafrost and permafrost soils to form CH4, CO2, and N2O, which will result in positive feedback on global climate warming [25].
For each of the 18 measurement test sites within the framework of the all-Russian climatic project “Carbon measurement test sites”, it is necessary to establish a “zero point” for further work on monitoring of soil transformation processes, SOM reserves and quality, vegetation cover and etc. That is, to capture the parameters of each of the studied ecosystems. “Seven Larches” is currently the only polygon in the Arctic zone of Russia, so it is extremely important to establish its reference parameters and assess the possibility of extrapolating the data obtained further to the Arctic ecosystems of Russia. The “Carbon measurement test sites” project will allow us to study the planetary carbon cycle and clarify the sequestration potential of Russia’s territory; it will help accelerate the achievement of the UN Sustainable Development Goals [1,2,3,4,20,26].
To clarify the reference parameters of soils and SOM specifications of the “Seven Larches” carbon measurement supersite, as a representative ecosystem, it is necessary to: (1) clarify the morphological structure of the main types of soils in the area; (2) determine their basic physical and chemical properties (pH, content and stock of SOC, intensity of microbiological activity, particle size distribution); (3) provide a general characteristic of the composition of SOM and estimate the degree of its stabilization; and (4) identify differences (or similarities) of SOM on Seven Larches” carbon measurement supersite with soils most similar in genesis in the Russian arctic.
2. Materials and Methods
2.1. General Characteristic of Study Area
The “Seven Larches” carbon measurement supersite (Figure 1) is located in the Yamal-Nenets Autonomous Okrug (Russia). It is the only carbon polygon above the Arctic Circle (66.6993, 66.2684), and its area is 2395.6 ha. The climate is subarctic (Dfc), with an average air temperature of −5.1 °C (average January temperature: −23.1 °C; July +15 °C). The period with air temperature below 0 °C is up to 240 days, the vegetation period is less than 70 days, and precipitation is about 500 mm per year with a strong summer maximum. Stable snow cover lasts from November to May; its thickness is from 0.4 to 1 m. The geological structure is confined to the subarctic area of the coastal plains of the north of Western Siberia. The sedimentary deposits are of Neogene and Quaternary age, and they are stratified and occur on Lower Cretaceous rocks. The study area is located in the permafrost zone with an isolated type of distribution. The thickness of the active layer is 0.8–2.5 m, temperatures at the depth of the active layer are from −3 to −1 °C; permafrost ice content is 5–20%. The influence of permafrost strongly affects the meso- and macrorelief of the carbon measurement supersite; frost heave up to 0.4 m high and 0.5–1.5 m in diameter and thermokarst features are widespread. The flat relief of the carbon measurement supersite “Seven larches” was formed as a result of the Ob River’s landforming function—these are complexes of floodplains, floodplain terraces and leveled territories of watersheds. There are many thermokarst lakes on the territory, which are at various stages of waterlogging [2,27].
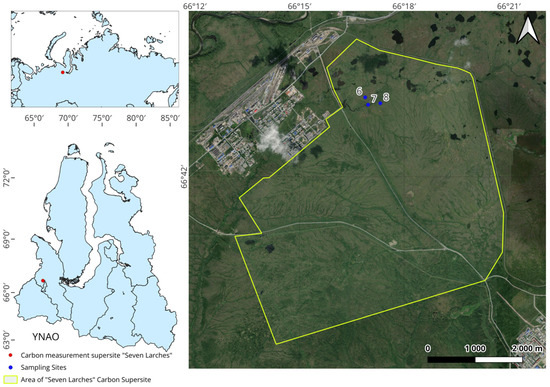
Figure 1.
Location of “Seven Larches” carbon measurement test area on the global and regional scales and sampling sites.
The “Seven Larches” carbon measurement supersite is located on the southern border of the forest tundra, which has a combination of tundra and taiga vegetation. Betula nana, Ledum palustre grow on the felling hillocks, and Empetrum nigrum, Vaccinium vitis-idaea, Vaccinium uliginosum, Andromeda polifolia, Luzula spicata, Bistorta major, Rubus chamaemorus, Carex rotundata, C. globularis, C. arctosibirica, Eriophorum sheuchzeri grow on the slopes of felling hillocks and between them. The forest stand is formed mainly by Larix sibirica, Picea obovata and Betula pubescens; tree height is 6–8 m, and average trunk diameter is 8–10 cm. The undergrowth is dominated by B. nana and V. Uliginosum 0.8–1.0 m high with projective coverage of 30–70%. The herbaceous layer is represented by heather-grass (E. nigrum, Loiseleuria procumbens, V. vitis-idaea, A. polifolia, Arctous alpine, L. palustre, Festuca ovina). Parent materials are medium-loamy boulder and gravelly polygenetic and polydisperse sedimentary Neopleistocene-Holocene sediments [27,28]. Zonal soil types are Histosols, Gleysols and Cryosols.
2.2. Field Work and Sampling Strategy
Field work at “Seven Larches” carbon measurement supersite was conducted in mid-July 2022, at maximum thawing of the active layer and at the peak of vegetation activity. On the territory of the test site was chosen the area of terrain that most fully reflects all the diversity of soils on the territory of “Seven Larches” carbon measurement supersite. Three soil sections were established (Figure 1), and the main soils of the carbon polygon were described and classified according to the World Reference Base for Soil Resources [29]. Furthermore, additional soil samples from soil horizons similar to the main section were collected within a radius of 10 m from the main section. Thus, three soil samples weighing 1000 g each from each genetic soil horizon were obtained for every soil section.
2.3. Samples Preparation and Laboratory Analysis
After drying at +24 °C, the samples were ground in a mortar and sieved through a sieve with a mesh diameter of 2 mm. An average sample was formed for further analyses. Samples from peat soil horizons were ground in a laboratory mill. Soil physicochemical parameters were determined according to standard methods (Figure 2).

Figure 2.
Overall framework of the research.
Actual acidity (pHw) was determined in suspensions in the ratio soil: water—1:2.5 (1:25 for peat horizons); Exchangeable acidity (pHs)—soil: KCl 1 N in the same proportions [30]. The pH/ORP/Temp tester Milwaukee Mi106 (Milwaukee Electronics, Portland, OH, USA) was used. To determine the content of soil organic carbon (SOC), samples were further milled to a fraction size less than 0.25 mm. Directly SOC content was determined using an elemental analyzer (EA3028-HT EuroVector, Pravia PV, Italy). Soil density was determined by the cutting ring method followed by drying the sample at 105 °C to constant weight. SOC stock in the soil horizon was calculated as the quotient of SOC concentration (kg × m−2), horizon thickness and density using a conversion factor of 0.1. Soil respiratory activity was determined in hermetic chambers by CO2 capture with 10 mL of 0.1 N NaOH for 7 days (with a preincubation of 10 days). The final amount of C-CO2 was determined by titration with 0.05 N HCl [31]. The particle size distribution was determined by the sedimentation method [32].
2.4. HAs Extraction, 13C NMR Spectroscopy and Elemental Analysis
Humic acid was extracted using the modified method of the International Humic Substances Society (IHSS) [33,34]. The procedure was as follows: (1) sieving the crushed sample through a 2 mm mesh; (2) double extraction of humic substances with 0.1 N NaOH for 48 h each time; (3) filtration of the extractant; (4) precipitation of humic acids with 1 N H2SO4; (5) centrifugation at 3000 rpm for 15 min; (6) dialysis in water using cellophane bags with a pore diameter of 12–14 kDa (water was changed every 24 h for 10 days); and (7) after dialysis, the preparations were placed in crystallizers and dried in vacuum.
CP/MAS 13C NMR spectroscopy is an effective tool for SOM studies and has become widely used due to its high informativeness and relative ease of obtaining results. To analyze SOM, the characterization of chemical shift ranges (according to the position of resonances of atoms with a similar chemical environment) is used [35]. Solid-state CP/MAS 13C NMR spectra of HAs separated from soils were measured with a Bruker Avance 500 NMR spectrometer in a 3.2 mm ZrO2 rotor. The magic angle spinning frequency was 20 kHz in all cases, and the nutation frequency for cross-polarization was u1/2p 1/4 62.5 kHz. Repetition delays were 3 s. The number of scans was 6500–32,000. The contact time is 0.2 μs. Structural compounds were identified by chemical shifts’ values: 0–47 ppm—Alkyl C (CH3-C al); 47–60 ppm—N-alkyl/methoxyl (O-CH3 al); 60–108 ppm—O-alkyl (CH2OH al); 108–144 ppm—Aromatic C (C,H ar); 144–164 ppm—O/N-aryl-O (O,N ar); 164–183 ppm—Carboxyl group (COO-R al); 183–190 ppm—Quinone group (AR = O); 190–204 ppm—Carbonyl group (C = O al) [9,34,35].
The elemental composition of HAs was determined using an elemental CHN analyzer EA3028-HT EuroVector (Pravia PV, Italy) in triplicate. For elemental analysis, HAs preparations were additionally milled and homogenized using a ball mill. Concentrations of elements were calculated taking into account the ash content of HAs. O content was determined by the difference. H:C, O:C, C:N ratios based on atomic percentages. The H:Cmod ratio was defined as (H:C + (2 × O:C)) × 0.67. The degree of oxidation of HAs was calculated as ((2 × O) − H)/C [34,35].
2.5. Software and Statistics
Solid-state CP/MAS 13C NMR spectra were integrated using the MestreNova 12 (Mestrelab Research) program. Data visualization and statistics were performed using QGIS 3.34.1, GraphPad Prism 10. Pairwise comparisons were performed using unpaired t-test at the 95% confidence interval. Graphostatistical analysis was carried out using van Krevelen diagrams (H:C − O:C) and in coordinates H:C − C:N and degree of organic matter decomposition (C,H-alkyl: O,N-alkyl) to integral index of hydrophobicity (Al H,R + Ar H,R) [35].
3. Results
3.1. Soil General Properties and Morphology
All studied soil types are classified as Cryosol (Figure 3) of different subtypes (Histic, Stagnic or Gleyic), since the upper boundary of permafrost (Cryic) is located within the upper 100 cm of the soil profile [29]. All studied soils are characterized by cryoturbation effects.

Figure 3.
Profiles and classification of the studied soils according to the international soil classification system.
The basic chemical properties of the studied soils are given in Table 1. All studied soils are characterized by acidic–strongly acidic pH values. The lowest values of pH are observed in organogenic soil horizons; for all organogenic soil horizons pHw values are below 5, pHs values are below 3.5. In mineral soil horizons and parent material, pH values increase.

Table 1.
Basic chemical properties of studied soils.
The soil organic carbon (SOC) content is maximum in organogenic soil horizons and reaches 31.2 ± 0.7%. Below the soil profile, SOC content decreases sharply; in mineral soil horizons and parent material, its concentration is 0.4–1.5%. The maximum SOC content is confined to organogenic soil horizons with low bulk density (BD), where soil density values do not exceed 0.3 g × cm−3. The underlying soil horizons are much more dense 1.5–2.2 g × cm−3. They also have heavy particle size distribution with clay fraction (<0.001 mm) content of more than 23%. Based on the given soil density and SOC content, carbon stocks were calculated for soil horizons and the 0–30 cm soil layer. The studied soils also have differentiation by parameters of biological activity. In surface soil, the basal respiration intensity (BAS) is higher compared to underlying horizons. BAS in Histic horizons was found to vary from 7.9 to 21.6 µg C-CO2 × g−1 × h−1.
3.2. Elemental Composition of HAs
The elemental composition data of HAs isolated from typical soils of “Seven Larches” carbon measurement test area show (Table 2) that HAs extracted from surface organogenic horizons are characterized by a lower C content compared to HAs from lower soil horizons. The C content (in atomic percent/mole fraction) for organic and organomineral horizons varies from 35.53 ± 0.20 to 35.62 ± 0.20%. Humic acids from mineral soil horizons have a higher C content, ranging from 37.64 ± 0.20 to 38.10 ± 0.06%. The change in the mole fraction of O in HA along the soil profile does not have a clearly expressed regularity. The N content in HAs of organic and organomineral horizons of the studied soils is higher than in mineral ones. From 2.40 ± 0.01 to 2.62 ± 0.01% in organic horizons (He, Hi, Oi/Ah) against 2.07 ± 0.02 to 2.26 ± 0.01% in mineral horizons (Crg@, Cf@, Cg@). This is confirmed by higher values of C:N ratio: 13.17–14.97 for organic horizons and 16.86–18.23 for mineral horizons; thus, HAs in organic horizons of the studied soils are more enriched with N. Clustering between mineral and organic horizons is also noted for H:C − C:N (Figure 4B) coordinates C:N ratio in HAs of organogenic horizons is slightly lower (13.61–14.97) against mineral horizons (16.86–18.23). The H:Cmod ratio in HAs decreases from organic (1.91–1.94) to mineral (1.73–1.75) soil horizons. Calculation of the degree of oxidation (W) of HAs preparations shows that all the studied acids are in the reduced form (W from −0.11 to −0.36).
Table 2.
Elemental composition and major elemental ratios of the studied humic acids.

Figure 4.
(A)—The van Krevelen diagram of the elemental composition of HAs isolated from the study soil. (B)—H:C to C:N scatter plot for studied soil. (C)—Tukey’s boxplots and results of unpaired t-test for H:C, O:C and C:N molar ratios between HAs extracted from mineral (Min) and organic (Org) soil horizons, ****—p-value < 0.0001.
Measurement comparison (Figure 4C) of H:C, C:N, O:C molar ratios between HAs of mineral and organic horizons using unpaired t-test shows that the differences in molar ratios (Min vs. Org) are statistically significant (p < 0.0001).
3.3. CP/MAS 13C NMR Spectroscopy of HAs
The analysis of HAs isolated from “Seven Larches” soils by carbon measurement test site allowed us to identify chemical shifts that refer to carbon atoms of various functional groups and molecular fragments of HAs [9]. CP/MAS 13C NMR spectra (Figure 5) show that the highest intensity is characterized by the regions 0–47, 60–108 and 164–183 ppm, which correspond to C,H-alkyl, O,N-alkyl and Caboxyl compounds. The proportion of aliphatic fragments in the HAs structure is extremely high, the maximum content of C,H-substituted aliphatic fragments (0–47 ppm), their content reaches 49.1% and generally increases down the soil profile (Table 3, profiles P6 and P7). The content of O,N-substituted aliphatic fragments is also high, up to 20%, but their distribution over the profile is not regular. Aromatic fragments are also found in HAs of the studied soils in a large proportion, and their content increases with depth, up to 20.7%. The content of aromatic structures (AR) in HAs of organic horizons of soils from 15.6 to 20.4%, in HAs of mineral horizons from 23.6 to 25.8%. Aliphatic fragments (AL) of HAs in organic horizons range from 79.6 to 84.4%, in mineral horizons of soils from 74.2 to 76.4%. Aromaticity (ARM) of HAs in mineral horizons is generally higher compared to HAs of organic horizons, from 26, 2 to 27.2 and 17.1 to 22.7%, respectively.
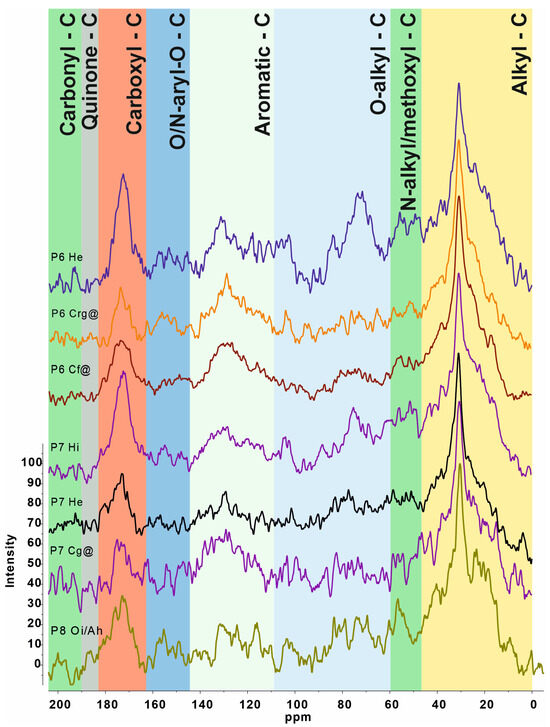
Table 3.
Percentage of carbon in the main structural fragments of HAs from the studied soil horizons (according to CP/MAS 13C NMR data).
The ratio of aromatic to aliphatic structures (AR/AL) of HAs also increases along the soil profile and is maximum in mineral soil horizons 0.31–0.35, HAs of organic soil horizons 0.18–0.26. The integral index of hydrophobicity (Al H,R + Ar H,R) of HAs molecules showed that HAs of organic soil horizons are less hydrophobic compared to HAs of mineral soil horizons, with hydrophobicity index values of 51.4–60.3 and 67.4–69.1, respectively. The degree of organic matter decomposition index C,H-alkyl/O,N-alkyl indicates a lower degree of humification in organic horizons, where the index values range from 1.3 to 1.6. In mineral soil horizons, the degree of humification is higher, with C,H-alkyl/O,N-alkyl index values ranging from 2.1 to 2.9.
For standardization of the obtained results, the graphostatistical analysis (Figure 6A) was used with the application of the following parameters: degree of organic matter decomposition (C,H-alkyl: O,N-alkyl) and integral index of hydrophobicity (total fraction of non-oxidized carbon atoms)—Al H,R + Ar H,R [9]. A clear clustering of the obtained data on the HAs of mineral and organic soil horizons was observed. Statistical processing (Figure 6C) of the data on the values of C,H-alkyl: O,N-alkyl and Al H,R + Ar H,R indices using unpaired t-test allowed to establish that the differences between HAs from mineral and organic soil horizons are statistically significant (p-value < 0.01).
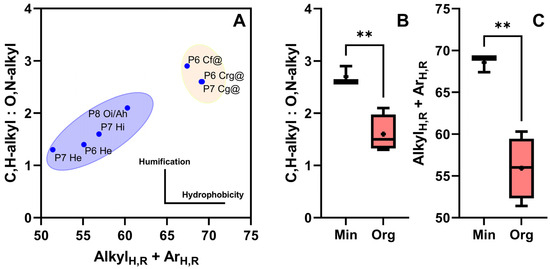
Figure 6.
(A)—diagram of integral indices of the molecular structure of HAs in C,H-alkyl: O,N-alkyl to ALH,R + ArH,R coordinates for the soil of “Seven Larches” carbon measurement test area. (B,C)—Tukey’s boxplots and results of unpaired t-test between HAs extracted from mineral (Min) and organic (Org) soil horizons, **—p-value < 0.01.
4. Discussion
4.1. Morphology and General Properties of Soils
The sampled soils are typical for the Labytnangsky soil-ecological region of the Yamal-Nenets Autonomous Okrug; on loamy parent materials with a lack of drainage, soils with a pronounced gleyic process develop, and on swampy areas, peaty oligotrophic soils are developed [36]. Parent materials of heavy particle size distribution and close upper boundary of the active layer of permafrost impede surface drainage, which promotes the development of the gleyic process. The thickness of peat-bog cover (Histic horizon) varies considerably on the territory (Figure 3); in lowlands, there is more active peat accumulation (Figure 3B), and the thickness of the Histic horizon often exceeds 20 cm. On gentle slopes, the thickness of the peat layer decreases (Figure 3A). Peat horizons are not formed at all on the tops of micro-raises; here, surface soil horizons are low thickness (3–5 cm) and can be called coarse humus [27]. In general, a high contrast of geocryological conditions is observed in the “Seven Larches” carbon measurement test area; the thickness of the active layer varies from 55 to 180 cm. There is an inverse dependence of the active layer thickness on the thickness of the organogenic horizon (Figure 3) of the soil-peat or litter [27].
The lowest values of pH are observed in organogenic soil horizons. For all organogenic soil horizons, pHw values are below 5, pHs values are below 3.5. Low pH values are characteristic of most zonal soils in the YNAO [37,38,39]. The organic carbon (SOC) content is maximum in organogenic soil horizons and reaches 31.2 ± 0.7%. Below the soil profile SOC, content decreases sharply; in mineral soil horizons and parent material, its concentration is 0.4–1.5%. Histic Cryosol with an organogenic horizon stored more carbon compared to Gleyic Cryosol, where the surface horizon is thin. According to the latest estimates in the 0–30 cm soil layer in the northern circumpolar permafrost region, the average SOC stock is 9.0 ± 1.4 kg × m−2, giving a total carbon stock of 160 ± 25 Pg with the highest SOC contents in permafrost peat soils in Western Siberia (Russia) and within Canada [24]. Early studies noted that in the meter layer of permafrost-affected soils in the Arctic territories, SOC stocks vary widely, from 4.0 to 71.3 kg × m−2, due to the high diversity of studied environments and objects [40].
Differentiation by parameters of biological activity: In surface soil horizons (especially in organogenic Histic horizons), the basal respiration intensity (BAS) is higher than that of underlying horizons. BAS in Histic horizons varies from 7.9 to 21.6 µg C-CO2 × g−1 × h−1. This indicates a high content of microbial biomass in these soil horizons. The mutual dynamics of SOC content decrease and BAS intensity can be traced since the rate of SOM decomposition in Arctic conditions is higher in the surface active layer [41]. The profile differentiation of permafrost-affected soils by the intensity of microbiological activity was previously reported in a number of other studies [37,38,42,43].
4.2. Elemental Composition of HAs
As was mentioned above, the elemental composition of HAs of the main soil types of the “Seven Larches” carbon measurement test area differs between mineral and organic soil horizons (Figure 4). Statistically significant differences were found in H:C, C:N and O:C ratios (p-value < 0.0001), with H:C and O:C ratios being higher in HC of organic horizons and C:N in mineral horizons. Unfortunately, there is not much data on the elemental composition of HAs in soils of the Russian Arctic (Table 4). Most of the results are presented for surface organic soil horizons, probably due to the fact that mineral horizons contain extremely small amounts of SOM, and the isolation of HAs isolation is difficult. Nevertheless, there are data on the elemental composition of HAs of mineral soil horizons for Stagnic Cambisol (H:C—1.17, C:N—12.8, O:C—0.38, W = −0.41), Histic Gleysol (H:C—1. 14, C:N—13.0, O:C—0.46, W = −0.22) and Cryosol (H:C—1.25, C:N—14.2, O:C—0.45, W = −0.36) in soils of the southern tundra (Bolshezemelskaya tundra) of the European part of Russia [44]. The elemental composition of HA of mineral horizon Bg Turbic Cryosol (H:C—0.91, C:N—11.99, O:C—0.41, W = –0.08) and horizon Bh Histic Cryosol (H:C—1.11, C:N—13.49, O:C—0.48, W = −0.15) of mountain-tundra zone with permafrost icy rock of the Subpolar Urals was also published [45]. In general, these data are consistent with our results that HAs of mineral horizons possess lower ratios of H:C and O:C (Figure 4). SOM in subarctic and arctic soils is mainly concentrated in surface soil horizons and may influx into deep horizons in limited quantities as a result of cryoturbation, frost churning, or infiltration processes [46,47]. After storage, the permafrost layer serves as a barrier to further leaching of SOM, and the conservation and protection of SOM are enhanced by the formation of organo-mineral associations during mixing with mineral soil horizons [46]. Thus, we can say that while low total SOC content, organic matter of mineral soil horizons is more stable, high clay content (23.1–35.3% (Table 1)) allows the formation of organo-mineral matrices. HAs have a greater degree of dehydrogenation and hydrophobicity (Figure 4A) and are characterized by a greater proportion of aromatic structures in HAs molecules (lower values of H:C, H:Cmod ratios), which also indicates a better degree of SOM stabilization [48,49]. In addition, the sequestration of SOM in mineral horizons is promoted by a high degree of hydromorphism, more reductive redox conditions (degree of oxidation (W) of studied HAs negative), and low temperatures, which limits the biodegradation of SOM [48,49,50,51,52].
Table 4.
Elemental composition and major elemental ratios of the HAs in selected natural soils of Russian Arctic according literature data.
The data on the elemental composition of HAs of organic soil horizons of soils in the Russian Arctic are much more extensive and diverse (Table 4). Data on the HAs composition of organic soil horizons have been published for Stagnic Cambisol, Histic Gleysol, Cryosol of South tundra (Bolshezemelskaya tundra) [44]; Hemic Folic Cryic Histosol and Hemic Folic Cryic Histosol (Turbic) permafrost peat soils of the eastern European Arctic [34]; Turbic Cryosols (Loamic) of Lena River Delta [53]; Turbic and Histic Cryosol mountain tundra (Subpolar Ural Mountains) [45] and shrub moss tundra (Erkuta river) [38]. The previously published data on the elemental composition of HAs (Table 2 and Table 4) and the newly obtained data show low coefficients of variation for the main molar ratios H:C—8.94%; O:C—16.8%; C:N—13.92%. However, it was noted earlier that the value of molar ratios (especially H:C) is climatically related and varies in a narrow range for HAs isolated from zonal soils of different landscapes and vegetation cover [54,55]. This finding may explain the fact that our obtained data have no statistically significant differences (Figure 7C) with the literature data on H:C ratio (p-value < 0.05). Variation in the H:C ratio (i.e., different aromaticity of SOM) may also be associated with different sources of fresh organic residues, with a high proportion of aliphatic structures being associated with algal and fungal sources [56,57]. There is also data that Cryosols covered with polygonal and geophytic initial tundra vegetation have higher SOM decomposition rates [58]. For other atomic ratios (O:C, C:N p-value > 0.05), no statistically significant differences (Figure 7C) were found between our findings (Table 2) and the literature data (Table 4).
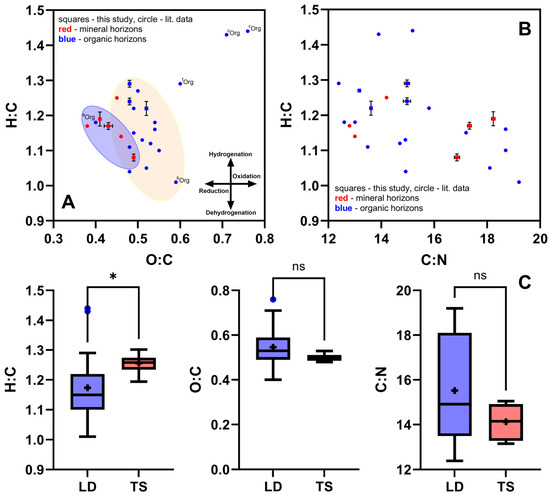
Figure 7.
(A)—The van Krevelen diagram of the elemental composition of HAs isolated from the study soil and from literature data (Table 4). (B)—H:C to C:N scatter plot for studied soil and from literature data. (C)—Tukey’s boxplots and results of unpaired t-test for H:C, O:C and C:N molar ratios between HAs from our study (TS) and literature data (LD) ratios only for organic soil horizons, *—p-value < 0.05, ns—p-value > 0.05.
4.3. CP/MAS 13C NMR Spectroscopy of HAs
The 13C NMR spectroscopy data (Table 3) of HAs isolated from “Seven Larches” soils support the earlier data on the decrease of SOM aromaticity from organic to mineral soil horizons based on elemental analysis (Table 2) of HAs. The high aliphaticity of HAs of organic horizons can be explained by the high content of labile carbon from weakly decomposed plant residues [59]. In addition, the predominance of aliphatic structural fragments is associated with the lignin and lignin-like compounds deficit in the composition of humification precursors. Low lignin content is characteristic of typical tundra vegetation (mosses, lichens, etc.), which is the main source of plant residues in this natural zone [60]. The increase of aromatic (108–164 ppm) and carboxyl (164–183 ppm) fragments in the structure of HAs (Figure 5) in the process of lignin humification and the high content of aromatic structures indicate the resistance of SOM to biodegradation, which is characteristic for HAs of mineral horizons [14]. Moreover, the overall low aromaticity of SOM in Arctic soils (Table 5) is associated with high humidity, dominance of anaerobic conditions and low biological activity, and as a consequence, low rate of humification of organic residues [45]. Usually organic horizons are enriched by carbohydrate, amino and methoxyl groups, and their share decreases down along the profile as a result of microbial destruction and oxidation processes [61]. Decomposition of SOM is generally associated with a decrease in the O-alkyl C content and an increase in the alkyl-C [50], which is also confirmed by our data by differences between organic and mineral soil horizons (Table 3, Figure 5). The data we obtained are consistent with previously published data (Figure 8A, Table 5): HAs are characterized by the dominance of aliphatic fragments (78 ± 4) in the molecular structure and relatively not high aromaticity ARM—22.8 ± 3.83%. HAs of soils from southern natural zones are usually characterized by a higher degree of aromaticity due to differences in the composition of humification precursors and due to favorable bioclimatic conditions [61,62].
Table 5.
Percentage of carbon in the main structural fragments of the HAs in selected natural soils of the Russian Arctic according literature data (CP/MAS 13C NMR data).
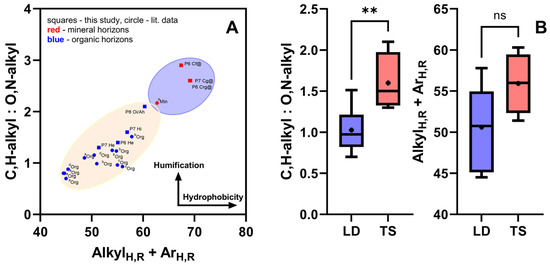
Figure 8.
(A)—diagram of integral indices of the molecular structure of HAs in C,H-alkyl: O,N-alkyl to ALH,R + ArH,R coordinates for soil of “Seven Larches” carbon measurement test area and literature data (Table 5). (B)—Tukey’s boxplots and results of unpaired t-test between HAs from our study (TS) and literature data (LD) ratios only for organic soil horizons, **—p-value < 0.005, ns—p-value > 0.05.
Statistically significant differences in the degree of SOM decomposition (C,H-alkyl: O,N-alkyl) are observed between the data we obtained for HAs of organic soil horizons and previously published data (Figure 8B). SOM decomposition in the “Seven Larches” site soils is higher (p-value < 0.005). This may be due to the different composition of soil organic horizons (see 4.1). Nevertheless, the integral index of molecule hydrophobicity (ALH,R + ArH,R) is not statistically different between our data and previously published data (Figure 8B).
5. Conclusions and Reflection on Perspectives
Humic acids isolated from organogenic and mineral soil horizons of three reference soil types of the “Seven Larches” carbon measurement test have a remarkable difference between the molecular structures of HAs of these horizons. Organic horizons are characterized by large values of H:C molar ratios (1.2–1.3), which indicates a lower degree of aromaticity of the molecular structure of HAs of organic soil horizons. All studied HAs are characterized by a negative degree of oxidation, which is associated with the dominance of reducing bioclimatic conditions due to a high degree of hydromorphism, predominance of precipitation over evaporation and total soil moisture saturation due to the heavy particle size distribution of parent materials (<0.01 mm—36–65%) and the close occurrence of permafrost. Analysis of the molecular structure of HAs using 13C NMR spectroscopy shows that HAs of the studied soils are characterized by the predominance of non-substituted aliphatic (0–47 ppm) and aromatic (108–164 ppm) fragments. Organic soil horizons are characterized by a greater proportion of unsubstituted aliphatic fragments in the structure of HAs (37–40%), and for mineral soil horizons, their increased aromaticity was noted (26–27%). Thus, mineral soil horizons are characterized by a higher stabilization rate of organic matter (with lower SOC content—0.5–0.9%); here, HAs molecules are more hydrophobic (Figure 6), the degree of humification is higher (C,H-alkyl/O,N-alkyl—2.6–2.9). Organic soil horizons (with higher SOC content—28–31%) are characterized by a lower degree of humification and hydrophobicity of SOM (C,H-alkyl/O,N-alkyl—1.3–2.1), with higher nitrogen content (C:N—13.17–14.97). Comparison of the obtained data with literature sources did not reveal major differences in the elemental and structural composition of HAs of soils of “Seven Larches” carbon measurement test area with HAs of soils close in genesis and geographical location. Thus, it is possible to consider soils of the “Seven Larches” carbon measurement test area as reference soils for this region.
Within the framework of further development of the Carbon measurement supersites projects (let us remind the reader that these are 18 experimental sites in different natural zones of Russia), it is extremely important to establish reference parameters for ecosystems. We would like to draw special attention to the urgent need to use similar methodological approaches when working at these test sites to organize environmental monitoring and other measurements. Using the example of the “Seven Larches” Carbon Measurement Supersite, we have shown that the use of HAs as indicators of SOM stability based on modern equipment (13C NMR) is an effective method. We encourage other Carbon measurement supersites project participants to use it as well; otherwise, we run the risk of producing only an array of scattered data. Following a harmonized methodology will allow us to adequately assess the degree of SOM transformation in the long term and to communicate this information to decision makers. This is crucial for achieving sustainable development goals in the context of climate change.
Author Contributions
Conceptualization, T.N. and E.A.; methodology, E.A.; software, T.N.; validation, T.N., O.B. and E.M.; formal analysis, O.B.; investigation, T.N. and O.B.; resources, E.A.; data curation, O.B.; writing—original draft preparation, T.N. and O.B.; writing—review and editing, E.A. and E.M.; visualization, T.N.; supervision, E.A.; project administration, E.A.; funding acquisition, E.A. All authors have read and agreed to the published version of the manuscript.
Funding
The research was supported by the Russian Science Foundation grant № 24-44-00006 “Comparative metagenomics study on carbon-cycling microbiome in permafrost regions in Yamal and the Qinghai-Tibet Plateau”.
Institutional Review Board Statement
Not applicable.
Informed Consent Statement
Not applicable.
Data Availability Statement
Data can be obtained upon request from the corresponding author.
Acknowledgments
The authors are also grateful to the Department of External Relations of Yamal-Nenets AO and to the Arctic Research Center for assistance in conducting and organizing fieldwork. Authors thanks Research park of St. Petersburg State University (Research Center of Chemical Analyses and Materials and Center of Magnetic Resonance Research).
Conflicts of Interest
The authors declare no conflicts of interest.
References
- Abakumov, E.V.; Polyakov, V.I.; Chukov, S.N. Approaches and Methods for Studying Soil Organic Matter in the Carbon Polygons of Russia (Review). Eurasian Soil Sci. 2022, 55, 849–860. [Google Scholar] [CrossRef]
- Carbon Supersites. Russian Federation. Available online: https://carbon-polygons.ru/en/ (accessed on 4 April 2024).
- Polyakov, V.; Abakumov, E.; Nizamutdinov, T.; Shevchenko, E.; Makarova, M. Estimation of Carbon Stocks and Stabilization Rates of Organic Matter in Soils of the «Ladoga» Carbon Monitoring Site. Agronomy 2023, 13, 807. [Google Scholar] [CrossRef]
- Abakumov, E.; Polyakov, V. Carbon polygons and carbon offsets: Current state, key challenges and pedological aspects. Agronomy 2021, 11, 2013. [Google Scholar] [CrossRef]
- Davidson, E.A.; Janssens, I.A. Temperature sensitivity of soil carbon decomposition and feedbacks to climate change. Nature 2006, 440, 165–173. [Google Scholar] [CrossRef]
- Wershaw, R.L. Evaluation of Conceptual Models of Natural Organic Matter (humus) from a Consideration of the Chemical and Biochemical Processes of Humification; U.S. Geological Survey: Reston, VA, USA, 2004. [Google Scholar]
- Orlov, D.S. Soil Humic Acids and General Theory Humification; Moscov State University: Moscow, Russia, 1990; p. 325. [Google Scholar]
- Semenov, V.M.; Ivannikov, L.A.; Tulina, A.S. Stabilization of organic matter in the soil. Agrochimia 2009, 10, 77–96. (In Russian) [Google Scholar]
- Lodygin, E.D.; Beznosikov, V.A.; Vasilevich, R.S. Molecular Composition of Humic Substances in Tundra Soils (C-13-NMR Spectroscopic Study). Eurasian Soil Sci. 2014, 47, 400–406. [Google Scholar] [CrossRef]
- Zavarzina, A.G.; Kravchenko, E.G.; Konstantinov, A.I.; Perminova, I.V.; Chukov, S.N.; Demin, V.V. Comparison of the Properties of Humic Acids Extracted from Soils by Alkali in the Presence and Absence of Oxygen. Eurasian Soil Sci. 2019, 52, 880–891. [Google Scholar] [CrossRef]
- Rodríguez-Murillo, J.C.; Almendros, G.; Knicker, H. Humic acid composition and humification processes in wetland soils of a mediterranean semiarid wetland. J. Soils Sediments 2017, 17, 2104–2115. [Google Scholar] [CrossRef]
- Kogut, B.M.; Semenov, V.M. Estimation of soil saturation with organic carbon. Dokuchaev Soil Bull. 2020, 102, 103–124. [Google Scholar] [CrossRef]
- Hammes, K.; Torn, M.S.; Lapenas, A.G.; Schmidt, M.W.I. Centennial black carbon turnover observed in a Russian steppe soil. Biogeosciences 2008, 5, 1339–1350. [Google Scholar] [CrossRef]
- Semenov, V.M.; Tulina, A.S.; Semenova, N.A.; Ivannikova, L.A. Humification and nonhumification pathways of the organic matter stabilization in soil: A review. Eurasian Soil Sci. 2013, 46, 355–368. [Google Scholar] [CrossRef]
- Spaccini, R.; Piccolo, A.; Contea, P.; Haberhauer, G.; Gerzabek, M.H. Increased soil organic carbon sequestration through hydrophobic protection by humic substances. Soil Biol. Biochem. 2002, 34, 1839–1851. [Google Scholar] [CrossRef]
- Zomer, R.J.; Bossio, D.A.; Sommer, R.; Verchot, L.V. Global Sequestration Potential of Increased Organic Carbon in Cropland Soils. Sci. Rep. 2017, 7, 15554. [Google Scholar] [CrossRef] [PubMed]
- Sommer, R.; Bossio, D. Dynamics and climate change mitigation potential of soil organic carbon sequestration. J. Environ. Manag. 2014, 144, 83–87. [Google Scholar] [CrossRef] [PubMed]
- Kudeyarov, V.N. Current state of the carbon budget and the capacity of Russian soils for carbon sequestration. Eurasian Soil Sci. 2015, 48, 923–933. [Google Scholar] [CrossRef]
- Kurganova, I.N.; Lopes de Gerenyu, V.O.; Ipp, S.L.; Kaganov, V.V.; Khoroshaev, D.A.; Rukhovich, D.I.; Sumin, Y.V.; Durmanov, N.D.; Kuzyakov, Y.V. Pilot carbon polygon in Russia: Analysis of carbon stocks in soils and vegetation. J. Soils Environ. 2022, 5, e169. [Google Scholar] [CrossRef]
- Chernova, O.V.; Golozubov, O.M.; Alyabina, I.O.; Schepaschenko, D.G. Integrated Approach to Spatial Assessment of Soil Organic Carbon in the Russian Federation. Eurasian Soil Sci. 2021, 54, 325–336. [Google Scholar] [CrossRef]
- Hugelius, G.A.-O.; Loisel, J.A.-O.; Chadburn, S.A.-O.X.; Jackson, R.A.-O.; Jones, M.A.-O.; MacDonald, G.; Marushchak, M.; Olefeldt, D.A.-O.; Packalen, M.; Siewert, M.A.-O.; et al. Large stocks of peatland carbon and nitrogen are vulnerable to permafrost thaw. Proc. Natl. Acad. Sci. USA 2020, 117, 20438–20446. [Google Scholar] [CrossRef] [PubMed]
- Mishra, U.; Hugelius, G.; Shelef, E.; Yang, Y.; Strauss, J.; Lupachev, A.; Harden, J.W.; Jastrow, J.D.; Ping, C.-L.; Riley, W.J.; et al. Spatial heterogeneity and environmental predictors of permafrost region soil organic carbon stocks. Sci. Adv. 2021, 7, eaaz5236. [Google Scholar] [CrossRef]
- Hugelius, G.; Strauss, J.; Zubrzycki, S.; Harden, J.W.; Schuur, E.A.G.; Ping, C.-L.; Schirrmeister, L.; Grosse, G.; Michaelson, G.J.; Koven, C.D.; et al. Estimated Stocks of Circumpolar Permafrost Carbon with Quantified Uncertainty Ranges and Identified Data Gaps. Biogeosciences 2014, 11, 6573–6593. [Google Scholar] [CrossRef]
- Palmtag, J.; Obu, J.; Kuhry, P.; Richter, A.; Siewert, M.B.; Weiss, N.; Westermann, S.; Hugelius, G. A high spatial resolution soil carbon and nitrogen dataset for the northern permafrost region based on circumpolar land cover upscaling. Earth Syst. Sci. Data 2022, 14, 4095–4110. [Google Scholar] [CrossRef]
- Turetsky, M.R.; Abbott, B.W.; Jones, M.C.; Walter Anthony, K.; Olefeldt, D.; Schuur, E.A.; Koven, C.; McGuire, A.D.; Grosse, G.; Kuhry, P.; et al. Permafrost collapse is accelerating carbon release. Nature 2019, 569, 32–44. [Google Scholar] [CrossRef] [PubMed]
- Kudryavtseva, O.V.; Sitkina, K.S.; Baraboshkina, A.V. Indicators of the Transition of Russia to Low-Carbon Development. Geogr. Nat. Resour 2023, 44, 260–270. [Google Scholar] [CrossRef]
- Lupachev, A.V.; Abakumov, E.V.; Ginzburg, A.P.; Goryachkin, S.V.; Zhangurov, E.V.; Lesovaya, S.N.; Lapteva, E.M.; Morgun, E.N.; Nizamutdinov, T.I.; Isaev, V.S.; et al. Permafrost soils in the Anthropocene. In Proceedings of the All-Russian Scientific-Practical Conference “Permafrost Soils in the Anthropocene”, Salekhard-Labytnangi, Russia, 20–26 August 2023; Monograph-Guide of the Field Trip. Omskblankizdat: Salekhard, Russia, 2023. [Google Scholar]
- Russian Soil Database. Available online: https://soil-db.ru/map?lat=55.7558&lng=37.6173 (accessed on 14 April 2024).
- IUSS Working Group WRB. World Reference Base for Soil Resources. In International Soil Classification System for Naming Soils and Creating Legends for Soil Maps, 4th ed.; International Union of Soil Sciences (IUSS): Vienna, Austria, 2022. [Google Scholar]
- Vorobyeva, L.N. (Ed.) Theory and Practice of Chemical Analysis of Soils; GEOS: Moscow, Russia, 2006; 400p. [Google Scholar]
- Bloem, J.; Hopkins, D.W.; Benedetti, A. Soil Microbial Activity; CABI Books: Wallingford, UK, 2005; 307p. [Google Scholar]
- Shein, E.V. (Ed.) Field and Laboratory Methods of Research of Physical Properties and Soil Regimes; Moscow State University: Moscow, Russia, 2001; 200p. [Google Scholar]
- Denef, K.; Plante, A.F.; Six, J. Characterization of soil organic matter. In Soil Carbon Dynamics: An Integrated Methodology; Heinemeyer, A., Bahn, M., Kutsch, W.L., Eds.; Cambridge University Press: Cambridge, MA, USA, 2010; pp. 91–126. [Google Scholar]
- Vasilevich, R.; Lodygin, E.; Abakumov, E. Molecular composition of humic substances isolated from permafrost peat soils of the eastern European Arctic. Pol. Polar Res. 2018, 39, 481–503. [Google Scholar]
- Lodygin, E.; Abakumov, E. The Use of Spectroscopic Methods to Study Organic Matter in Virgin and Arable Soils: A Scoping Review. Agronomy 2024, 14, 1003. [Google Scholar] [CrossRef]
- Mikhailov, I.S.; Mikhailov, S.I. The Experience of Creation of Soil-Ecological Map of Yamal-Nenets Autonomous District. Dokuchaev Soil Bull. 2017, 87, 55–72. [Google Scholar] [CrossRef]
- Alekseev, I.; Zverev, A.; Abakumov, E. Organic carbon and microbiome in tundra and forest—Tundra permafrost soils, southern, Yamal, Russia. Polar Res. 2021, 40, 5283. [Google Scholar] [CrossRef]
- Alekseev, I.; Abakumov, E. Soil Organic Carbon Stocks and Stability of Organic Matter in Permafrost-Affected Soils of Yamal Region, Russian Arctic. Geoderma Reg. 2022, 28, e00454. [Google Scholar] [CrossRef]
- Nizamutdinov, T.; Morgun, E.; Pechkin, A.; Kostecki, J.; Greinert, A.; Abakumov, E. Differentiation of Trace Metal Contamination Level between Different Urban Functional Zones in Permafrost Affected Soils (the Example of Several Cities in the Yamal Region, Russian Arctic). Minerals 2021, 11, 668. [Google Scholar] [CrossRef]
- Zubrzycki, S.; Kutzbach, L.; Pfeiffer, E.M. Permafrost-affected soils and their carbon pools with a focus on the Russian Arctic. Solid Earth 2014, 5, 595–609. [Google Scholar] [CrossRef]
- Walz, J.; Knoblauch, C.; Böhme, L.; Pfeiffer, E.M. Regulation of soil organic matter decomposition in permafrost-affected Siberian tundra soils—Impact of oxygen availability, freezing and thawing, temperature, and labile organic matter. Soil Biol. Biochem. 2017, 110, 34–43. [Google Scholar] [CrossRef]
- Mu, C.; Zhang, T.; Zhang, X.; Cao, B.; Peng, X. Sensitivity of soil organic matter decomposition to temperature at different depths in permafrost regions on the northern Qinghai-Tibet Plateau. Eur. J. Soil Sci. 2016, 67, 773–781. [Google Scholar] [CrossRef]
- Pautler, B.G.; Simpson, A.J.; Mcnally, D.J.; Lamoureux, S.F.; Simpson, M.J. Arctic Permafrost Active Layer Detachments Stimulate Microbial Activity and Degradation of Soil Organic Matter. Environ. Sci. Technol. 2010, 44, 4076–4082. [Google Scholar] [CrossRef] [PubMed]
- Lodygin, E.; Beznosikov, V.; Abakumov, E. Humic substances elemental composition of selected taiga and tundra soils from Russian European North-East. Pol. Polar Res. 2017, 38, 125–147. [Google Scholar] [CrossRef][Green Version]
- Dymov, A.; Zhangurov, E.; Hagedorn, F. Soil organic matter composition along altitudinal gradients in permafrost affected soils of the Subpolar Ural Mountains. Catena 2015, 131, 140–148. [Google Scholar] [CrossRef]
- Kögel-Knabner, I.; Amelung, W. Soil organic matter in major pedogenic soil groups. Geoderma 2021, 384, 114785. [Google Scholar] [CrossRef]
- Startsev, V.V.; Mazur, A.S.; Dymov, A.A. The Content and Composition of Organic Matter in Soils of the Subpolar Urals. Eurasian Soil Sci. 2020, 53, 1726–1734. [Google Scholar] [CrossRef]
- Lodygin, E.D.; Beznosikov, V.A.; Vasilevich, R.S. Study of the elemental composition of humic and fulvic acids in soils of taigaand tundra landscapes. Vestn. IB Komi NC UrO RAN 2016, 4, 10–18. (In Russian) [Google Scholar]
- Polyakov, V.; Lupachev, A.; Gubin, S.; Abakumov, E. Soil Organic Matter of Tidal Marsh Permafrost-Affected Soils of Kolyma Lowland. Agronomy 2023, 13, 48. [Google Scholar] [CrossRef]
- Pengerud, A.; Dignac, M.-F.; Certini, G.; Strand, L.T.; Forte, C.; Rasse, D.P. Soil organic matter molecular composition and state of decomposition in three locations of the European Arctic. Biogeochemistry 2017, 135, 277–292. [Google Scholar] [CrossRef]
- Mueller, C.W.; Rethemeyer, J.; Kao-Kniffin, J.; Löppmann, S.; Hinkel, K.M.; GBockheim, J. Large amounts of labile organic carbon in permafrost soils of northern Alaska. Glob. Change Biol. 2015, 21, 2804–2817. [Google Scholar] [CrossRef] [PubMed]
- Yuan, Z.; Jin, H.; Wang, Q.; Wu, Q.; Li, G.; Jin, X.; Ma, Q. Profile distributions of soil organic carbon fractions in a permafrost region of the Qinghai–Tibet Plateau. Permafr. Periglac. Process. 2020, 31, 538–547. [Google Scholar] [CrossRef]
- Polyakov, V.; Abakumov, E. Stabilization of organic material from soils and soil-like bodies in the Lena River Delta (13C-NMR spectroscopy analysis). Span. J. Soil Sci. 2020, 10, 170–190. [Google Scholar] [CrossRef]
- Dergacheva, M.I.; Nekrasova, O.A.; Okoneshnikova, M.V.; Vasil’eva, D.I.; Gavrilov, D.A.; Ochur, K.O.; Ondar, E.E. Ratio of elements in humic acids as a source of information on the environment of soil formation. Contemp. Probl. Ecol. 2012, 5, 497–504. [Google Scholar] [CrossRef]
- Vasilevich, R.; Lodygin, E.; Abakumov, E. The Molecular Composition of Humic Acids in Permafrost Peats in the European Arctic as Paleorecord of the Environmental Conditions of the Holocene. Agronomy 2022, 12, 2053. [Google Scholar] [CrossRef]
- Dai, X.Y.; Ping, C.L.; Candler, R.; Haumaier, L.; Zech, W. Characterization of soil organic matter fractions of tundra soils in arctic Alaska by Carbon-13 nuclear magnetic resonance spectroscopy. Soil Sci. Soc. Am. J. 2001, 65, 87–93. [Google Scholar] [CrossRef]
- Dai, X.Y.; Ping, C.L.; Michaelson, G.J. Characterizing soil organic matter in Arctic tundra soils by different analytical approaches. Org. Geochem. 2002, 33, 407–419. [Google Scholar] [CrossRef]
- Szymański, W. Chemistry and spectroscopic properties of surface horizons of arctic soils under different types of tundra vegetation—A case study from the fuglebergsletta coastal plain (SW spitsbergen). Catena 2017, 156, 325–337. [Google Scholar] [CrossRef]
- Grewer, D.M.; Lafrenière, M.J.; Lamoureux, S.F.; Simpson, M.J. Redistribution of soil organic matter by permafrost disturbance in the Canadian High Arctic. Biogeochemistry 2016, 128, 397–415. [Google Scholar] [CrossRef]
- Polyakov, V.I.; Abakumov, E.V. Humus formation in soils of the Lena River Delta. J. Soils Environ. 2020, 4, e163, (In Russian with English Abstract). [Google Scholar] [CrossRef]
- Lodygin, E.; Vasilevich, R. Environmental aspects of molecular composition of humic substances from soils of northeastern European Russia. Pol. Polar Res. 2020, 41, 115–135. [Google Scholar] [CrossRef]
- Kholodov, V.A.; Konstantinov, A.I.; Kudryavtsev, A.V.; Perminova, I.V. Structure of humic acids in zonal soils from 13C NMR data. Eurasian Soil Sci. 2011, 44, 976–983. [Google Scholar] [CrossRef]


Disclaimer/Publisher’s Note: The statements, opinions and data contained in all publications are solely those of the individual author(s) and contributor(s) and not of MDPI and/or the editor(s). MDPI and/or the editor(s) disclaim responsibility for any injury to people or property resulting from any ideas, methods, instructions or products referred to in the content. |
© 2024 by the authors. Licensee MDPI, Basel, Switzerland. This article is an open access article distributed under the terms and conditions of the Creative Commons Attribution (CC BY) license (https://creativecommons.org/licenses/by/4.0/).