Abstract
Sustainable development is a global focal point. This study aims to analyze the relationship between energy intensity and green innovation using panel data from 285 Chinese cities spanning from 2003 to 2019. The novel element of this research is the first-time exploration of green innovation through the lens of local industry attributes. It explains the impact of energy intensity on the development of green innovation. By employing a two-way fixed-effect model, the regression analysis reveals that higher energy intensity in cities negatively influences green innovation. Robustness and mechanism tests indicate that in regions with higher energy intensity, governments issue more policies to encourage enterprises and research institutions to pursue green innovation. However, these regions have developed significant path dependence, and local enterprises are reluctant to increase green investment even when facing stringent regulations. Heterogeneity analysis proves that cities with higher levels of digitalization, R&D investment, urbanization, and per capita GDP exhibit an increase in green innovation. The research and findings of this study are of significant importance for policy and strategy formulation, allowing governments and enterprises to develop targeted economic strategies to improve energy efficiency and promote green innovation, thereby achieving sustainable development goals. Potential limitations include data quality, and some key information is difficult to obtain from public sources due to confidentiality, which may result in limitations and biases in the results.
1. Introduction
Based on the requirements of sustainable development, local government and researchers are highly focused on green innovation and the circular economy. Governmental environmental attention is experiencing a rising trend with fluctuations [1], as it not only reduces pollution emissions and resource waste but also enhances energy efficiency and corporate competitiveness, thereby promoting sustainable development. Especially in regions with high energy intensity, green innovation plays a critical role. By upgrading industrial technologies and introducing clean energy, energy efficiency can be effectively enhanced, pollution emissions can be reduced, and environmental burdens can be significantly alleviated. The current literature highlights that green innovation and green investment drive socioeconomic development [2] and significantly reduce energy consumption [3]. However, the impact of high energy intensity, that is, the amount of energy consumed per unit of GDP by the International Energy Agency (IEA), on green innovation remains unclear. This paper investigates the influence and mechanisms of energy intensity on green innovation in the context of sustainable development.
This study employs a two-way fixed-effect model to analyze the impact of the independent variable (energy intensity) on the dependent variable (green innovation). The data indicate a negative correlation between energy intensity and green innovation, which has been confirmed through significance testing. In the Robustness Testing Section, this paper replaces the independent variable energy intensity with actual energy consumption metrics, such as total electricity consumption and the total amount of artificial gas and natural gas. To further enhance the robustness of the regression model results, the dependent variable green innovation was also substituted. The results from three tests all confirmed the high reliability of this study. Moreover, endogeneity tests were conducted to further validate the data results. Lagged one-period energy intensity was used as an instrumental variable, and regression analysis was performed using the two-stage least squares (2SLS) method to eliminate endogeneity bias. The regression results indicate that the findings of this study exhibit high reliability and robustness. Based on the regression results of the mechanism tests, this paper finds that in regions with high energy intensity, governments are greatly concerned about environmental pollution. High-energy-intensity regions are areas where a large amount of energy is consumed to produce economic output. Relevant departments enact more environmental policies to encourage local enterprises and research institutions to engage in green innovation and adopt clean energy. Despite facing stringent regulations and hefty fines, local enterprises remain reluctant to increase their investment in green innovation. This indicates that local enterprises and research institutions have developed significant path dependence on energy consumption, making the transition extremely costly. Therefore, it can be inferred that stringent regulations and policies will not change the situation of massive energy consumption. The government should consider structural reforms and allocate additional budgets to promote green technological innovation.
The data results and theoretical analysis of this paper provide guidance for policy formulation. The first significance of this paper is that it addresses the critical gap in the literature by investigating the relationship between green technology innovation and energy intensity—an area that has not been extensively investigated before. This paper explores the driving factors of incentivizing green innovation from a novel perspective. By analyzing the impact between energy intensity and green innovation, it reveals that an increase in energy intensity has a negative impact on green innovation. This indicates that regions with higher energy intensity face more environmental challenges. Based on this, governments and research institutions can develop different strategies to incentivize green innovation in regions with varying energy intensities. Moreover, this paper clearly explains the mechanisms through which energy intensity affects green innovation, providing a clearer description of the fundamental reasons behind the negative impact of energy intensity on green innovation. This lays a solid foundation for future discussions on energy intensity, green innovation, and sustainable development. The third contribution is that, through regression data, this paper finds that despite the government’s significant focus on environmental protection and the enactment of more environmental protection policies, it still fails to change the situation of high energy consumption. The government should implement structural reforms to change the current situation of high path dependence. Finally, heterogeneity analysis reveals that in cities with higher levels of digitalization, R&D investment, urbanization, and economic development, green innovation increases relatively. Based on this, the government should not only undertake structural reforms but also increase resource allocation in these four areas to promote green technological innovation and sustainable development.
The remainder of this paper is organized as follows: Section 2 reviews the relevant literature on energy consumption and green innovation. Section 3 describes the data sources. Section 4 uses a two-way fixed-effect model to explore the relationship between energy intensity and green innovation, presenting the regression results of robustness and endogeneity tests. Section 5 performs a mechanism analysis. Section 6 examines the heterogeneity of the study. Finally, Section 7 presents conclusions and recommendations.
2. Literature Review
2.1. Energy Intensity and Green Innovation
Theoretically, energy intensity is a significant tool for evaluating the energy consumption and efficiency of a country, city, or region, and it suggests that an increase in energy intensity indicates a decrease in energy efficiency [4]. According to traditional perspective, high energy intensity implies high energy consumption, which results in environmental pollution, resource waste, and negative economic impacts [5]. For instance, some studies highlight that high energy intensity in China is closely linked to environmental degradation [6], and sectors such as chemical fiber manufacturing and non-ferrous metal smelting are typically associated with high energy consumption and pollution [7]. Currently, a number of articles and evidences have proven the adverse effects of high energy intensity on the society, economy, and environment [8]; this is reason that both developed and developing countries try to reduce the use of fossil fuels in order to lower energy intensity [9]. However, some scholars argue that energy-intensive industries can still contribute positively to society. This is because governments often implement more environmental policies and stringent regulations in areas with high energy intensity to foster sustainable development [10]. Moreover, consequently, enterprises with higher energy intensity might increase their green investments to reduce energy consumption and costs.
Sustainable economic growth momentum refers to the economic benefits generated by humans through various factors, with green innovation being one of the important factors [11]. Green innovation refers to green technological innovation, which includes technologies or products that reduce environmental pollution and improve energy efficiency [12]. In the past, numerous studies on green innovation have shown that it is a driving force for sustainable development [13], and green investments are considered resources designed to mitigate economic harm from environmental pollution, achieved by either creating favorable conditions or through direct interventions [14]. Many studies have demonstrated that green innovation and the circular economy lay the foundation for sustainable development, and efficient green innovation can significantly reduce waste generation [15] and environmental pollution [16]. Esposito (2018) and Feng (2018) suggested that technological innovation promotes the circular economy [17], generating substantial positive impacts on socioeconomic, green products and environmental aspects [18]. Moreover, many scholars have conducted extensive research on the impact of green innovation on energy consumption. For instance, Wurlod (2018) determined by aligning sector-specific green knowledge stocks from Triadic Patent Families, with input cost functions utilizing EU-KLEMS data, that an increase in green patent activities leads to a reduction in the median energy intensity [19]. Patents have a significant impact on energy consumption in the years following their initial application [20].
In summary, conducting green innovation in areas with high energy consumption is crucial for promoting sustainable development and the circular economy. Although there is extensive research and numerous reports on the impact of green innovation and energy consumption, there remains a significant gap in the study of how energy intensity affects green innovation. This paper aims to address this gap by utilizing data from Chinese prefecture-level cities to investigate whether energy intensity influences local green innovation. By analyzing data on energy intensity, green invention patents, economic development levels, education levels, and the number of environmental regulations issued by the government across these cities, this study seeks to elucidate the specific impacts and mechanisms of energy intensity on green innovation, thus filling a notable gap in the academic understanding of the relationship between energy intensity and green innovation.
2.2. Theoretical Mechanisms
The literature review reveals a lack of research on the impact of energy intensity on green innovation, and the theoretical and practical aspects of this relationship remain unclear. This paper explores how energy intensity affects green innovation from several perspectives:
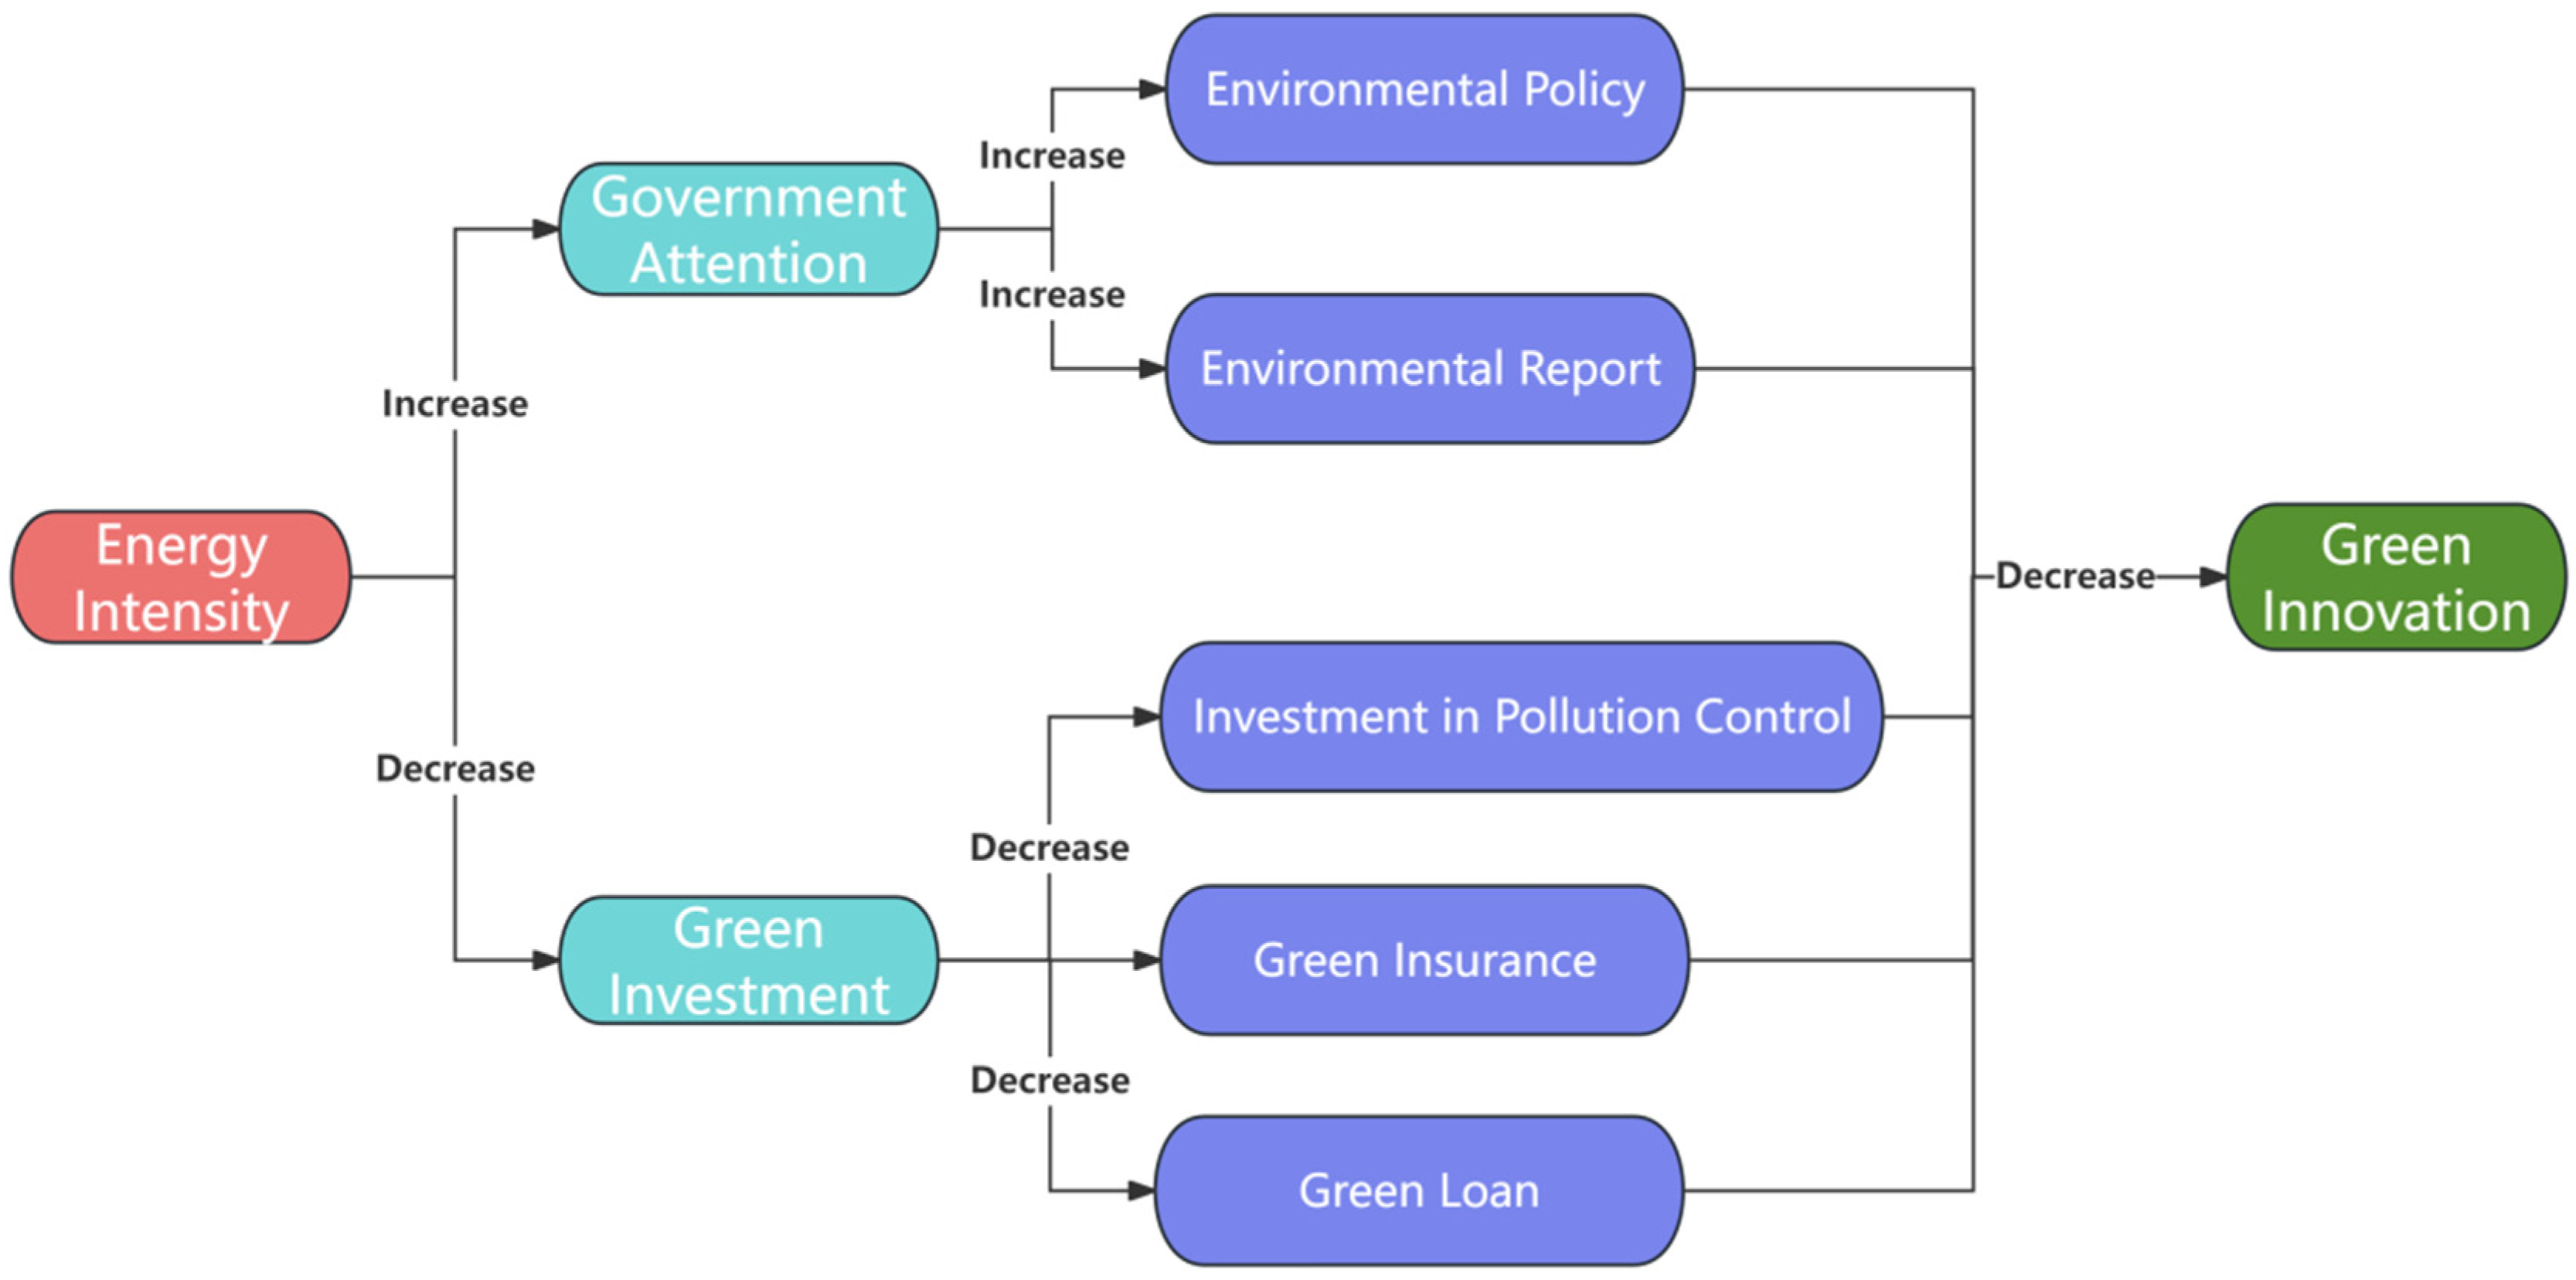
In regions with high energy intensity, promoting green innovation is challenging primarily due to path dependence. The theory of path dependence suggests that existing technologies and industrial structures constrain innovation and reform. Governments and enterprises face significant costs when undertaking industrial structural changes. Consequently, they often hesitate to invest substantial resources and costs in reforms. Firstly, governments typically prioritize maintaining or increasing local GDP and tax revenue. High-energy-intensity regions often rely on energy-intensive industries as their primary sources of GDP and tax revenue. If the government aggressively pushes for green innovation and industrial structural changes, it could negatively impact economic growth and tax revenues. Therefore, to avoid short-term economic losses due to reforms, governments may maintain the status quo (see Figure 1). Additionally, enterprises prioritize profit and are usually reluctant to invest heavily in green innovation. This reluctance stems from the potential impact on profits, technological uncertainties, and market risks associated with green innovation. This conservative strategy results in high-energy-intensity regions lacking sufficient motivation to drive green innovation and sustainable development when facing environmental pressures and energy challenges.

Figure 1.
The main path of mechanisms.
H1.
Regions with high energy intensity will lead to a positive influence on green innovation.
Governments typically emphasize the importance of environmental protection and reducing energy intensity in their reports due to the fact that high energy intensity results in negative influence on environmental sustainability. In recent years, the government has enacted regulations (Figure 1), such as the Environmental Protection Law and the Air Pollution Prevention and Control Regulations to increase costs for high-energy-consuming enterprises and institutions, with the aim of encouraging Chinese companies and institutions to independently develop green technologies and improve energy efficiency. Some articles show that governments will implement stringent policies to curb high energy consumption and encourage enterprises to engage in green innovation [21]. There is report that the Chinese government has formulated numerous policies and regulations to address environmental pollution, even though these conservative energy policies may hinder local economic growth [22]. Therefore, we hypothesize that in regions with high energy intensity, the government will implement more environmental policies to promote sustainable development.
H2.
In regions with high energy consumption, the government will issue more environmental protection regulations and green innovation incentive policies in order to encourage green innovation.
Green investment is reflected in local investments in pollution control, the output of green insurance, and the value of green loans, and it is important for sustainability [14]. These data can indicate the extent to which local governments and enterprises are spending on green innovation and governance. Currently, many cities face path dependence. Path dependence refers to the phenomenon where the current state and future direction of a technology or system are significantly impacted by past decisions and historical events, requiring substantial resources and costs to make changes. Local governments and organizations do not invest in the green loan and green insurance (Figure 1). Also, local enterprises and investors think greenwashing and green investment are pessimistic investment strategies [23]. Even when new and better options emerge, the system may continue along its established path. Therefore, local enterprises, aiming to maintain industrial output, may be reluctant to spend money and resources on making changes. Our hypothesis in this section is that green investment does not increase with higher energy intensity.
H3.
In regions with higher energy intensity, green investment does not increase.
3. Materials and Methods
3.1. Variable Selection
Dependent Variable: Green innovation is a crucial pathway to achieving sustainable development [24]. Consequently, this study uses green innovation as the dependent variable in the regression model. Based on the previous literature, patents have been proven to be the best indicator of green innovation, as they serve as a critical measure of technological knowledge and reserves. Green invention patents provide comprehensive information on green innovation and new green technologies, as well as offer insights into environmentally friendly technologies and applications that promote sustainable development. Therefore, using the number of green invention patents to measure green innovation can accurately describe the extent of efforts towards green innovation in a given region. Consequently, this study uses the number of green invention patents as the dependent variable to measure innovation in the green technology sector. In this study, data on green invention patents are sourced from the China Patent Database, which is both accurate and reliable.
Independent Variable: In the background of promoting sustainable development, energy intensity is the key indicator to evaluate the relationship between energy consumption and economic activities. Therefore, this research uses the energy intensity of Chinese prefecture–cities as the independent variable. Energy intensity is defined as the ratio of a city’s total energy consumption to its actual GDP, also known as the amount of energy consumed per unit of economic output. Moreover, high energy intensity means that more energy is consumed relative to economic output, indicating lower energy efficiency in the region; conversely, low energy intensity indicates higher energy efficiency.
In this study, the formula for calculating energy intensity is as follows:
Energy Intensity = Total Energy Consumption/Groos Domestic Product
By using energy intensity as an explanatory variable, our goal is to explore whether regions with higher energy intensity will generate more green innovation under the goals of sustainable development. By using this method, we are able to assess the role of energy intensity in promoting green innovation and driving sustainable development. We can also determine whether regions with higher energy intensity engage in more green innovation or green investment, thereby improving energy efficiency and reducing environmental impact.
Control Variable: Many other studies [25] have shown that green innovation is influenced by a variety of factors. Therefore, this paper introduces additional control variables to reduce variable bias. Firstly, green innovation is influenced by economic development and financial development levels because higher levels of economic and financial development mean more resources can be invested in R&D and innovation activities, providing more financing opportunities and support, which in turn promotes the development and application of green technologies. Secondly, human capital level and education level also impact green innovation, as a well-educated and well-trained workforce is more likely to adopt and implement new technologies, thereby driving the development of green innovation. The development of the tertiary sector (services) is usually accompanied by technological progress and innovation demands, so the expansion of the service industry can lead to the application of green technologies in energy-saving and environmental protection. Additionally, the secondary sector (industry) and smog index also affect green innovation because the secondary sector (industry) is often associated with high energy consumption and pollution. Higher pollution indices directly reflect environmental quality issues, prompting local governments and residents to demand green technological innovation, thereby improving energy efficiency and reducing pollution. Digitalization and internet penetration reflect the depth of information technology application and the speed of knowledge dissemination; thus, they also drive the development of green innovation.
The definition of variables is presented in Table 1.

Table 1.
Definition of variables.
3.2. Data Source
This research employed a range of statistical approaches to analyze the relationship between green innovation and energy consumption, and the data of 275 cities from 2003 to 2019 used in this article are sourced from the China Statistical Yearbook, the China City Statistical Yearbook, the Peking University Legal Information Database, the China Patent Database, and the China Energy Database. The main variables are utilized in the descriptive statistics. The economic development level and policy environment of municipalities and the cities located in autonomous regions differ significantly from those of the general provinces. Therefore, to ensure that the results of the regression analysis are more robust and generalizable, this research excluded certain regions that may have an excessive impact on the results.
3.3. Correlation Analysis
The main objective of this article is to explore whether regions with higher energy intensity generate more green innovation under the goal of sustainable development. To investigate this relationship, a correlation analysis was conducted to examine the association between energy intensity and green innovation, measured by the number of green invention patents.
As shown in Table 2, the dependent variable, green innovation, is represented by the number of invention patent applications (GP). The independent variable, energy intensity (EI), is defined as the ratio of total energy consumption to GDP, reflecting the amount of energy consumed per unit of economic output. Additionally, this study incorporates 9 control variables to account for other factors that may influence green innovation. Based on the data in Table 3, economic development level, energy intensity, and the number of invention patent applications are negatively correlated. Therefore, the correlation analysis indicates that higher energy intensity has a negative impact on green innovation.
Table 2.
Descriptive statistics.
Table 3.
Descriptive correlation.
3.4. Collinearity Test
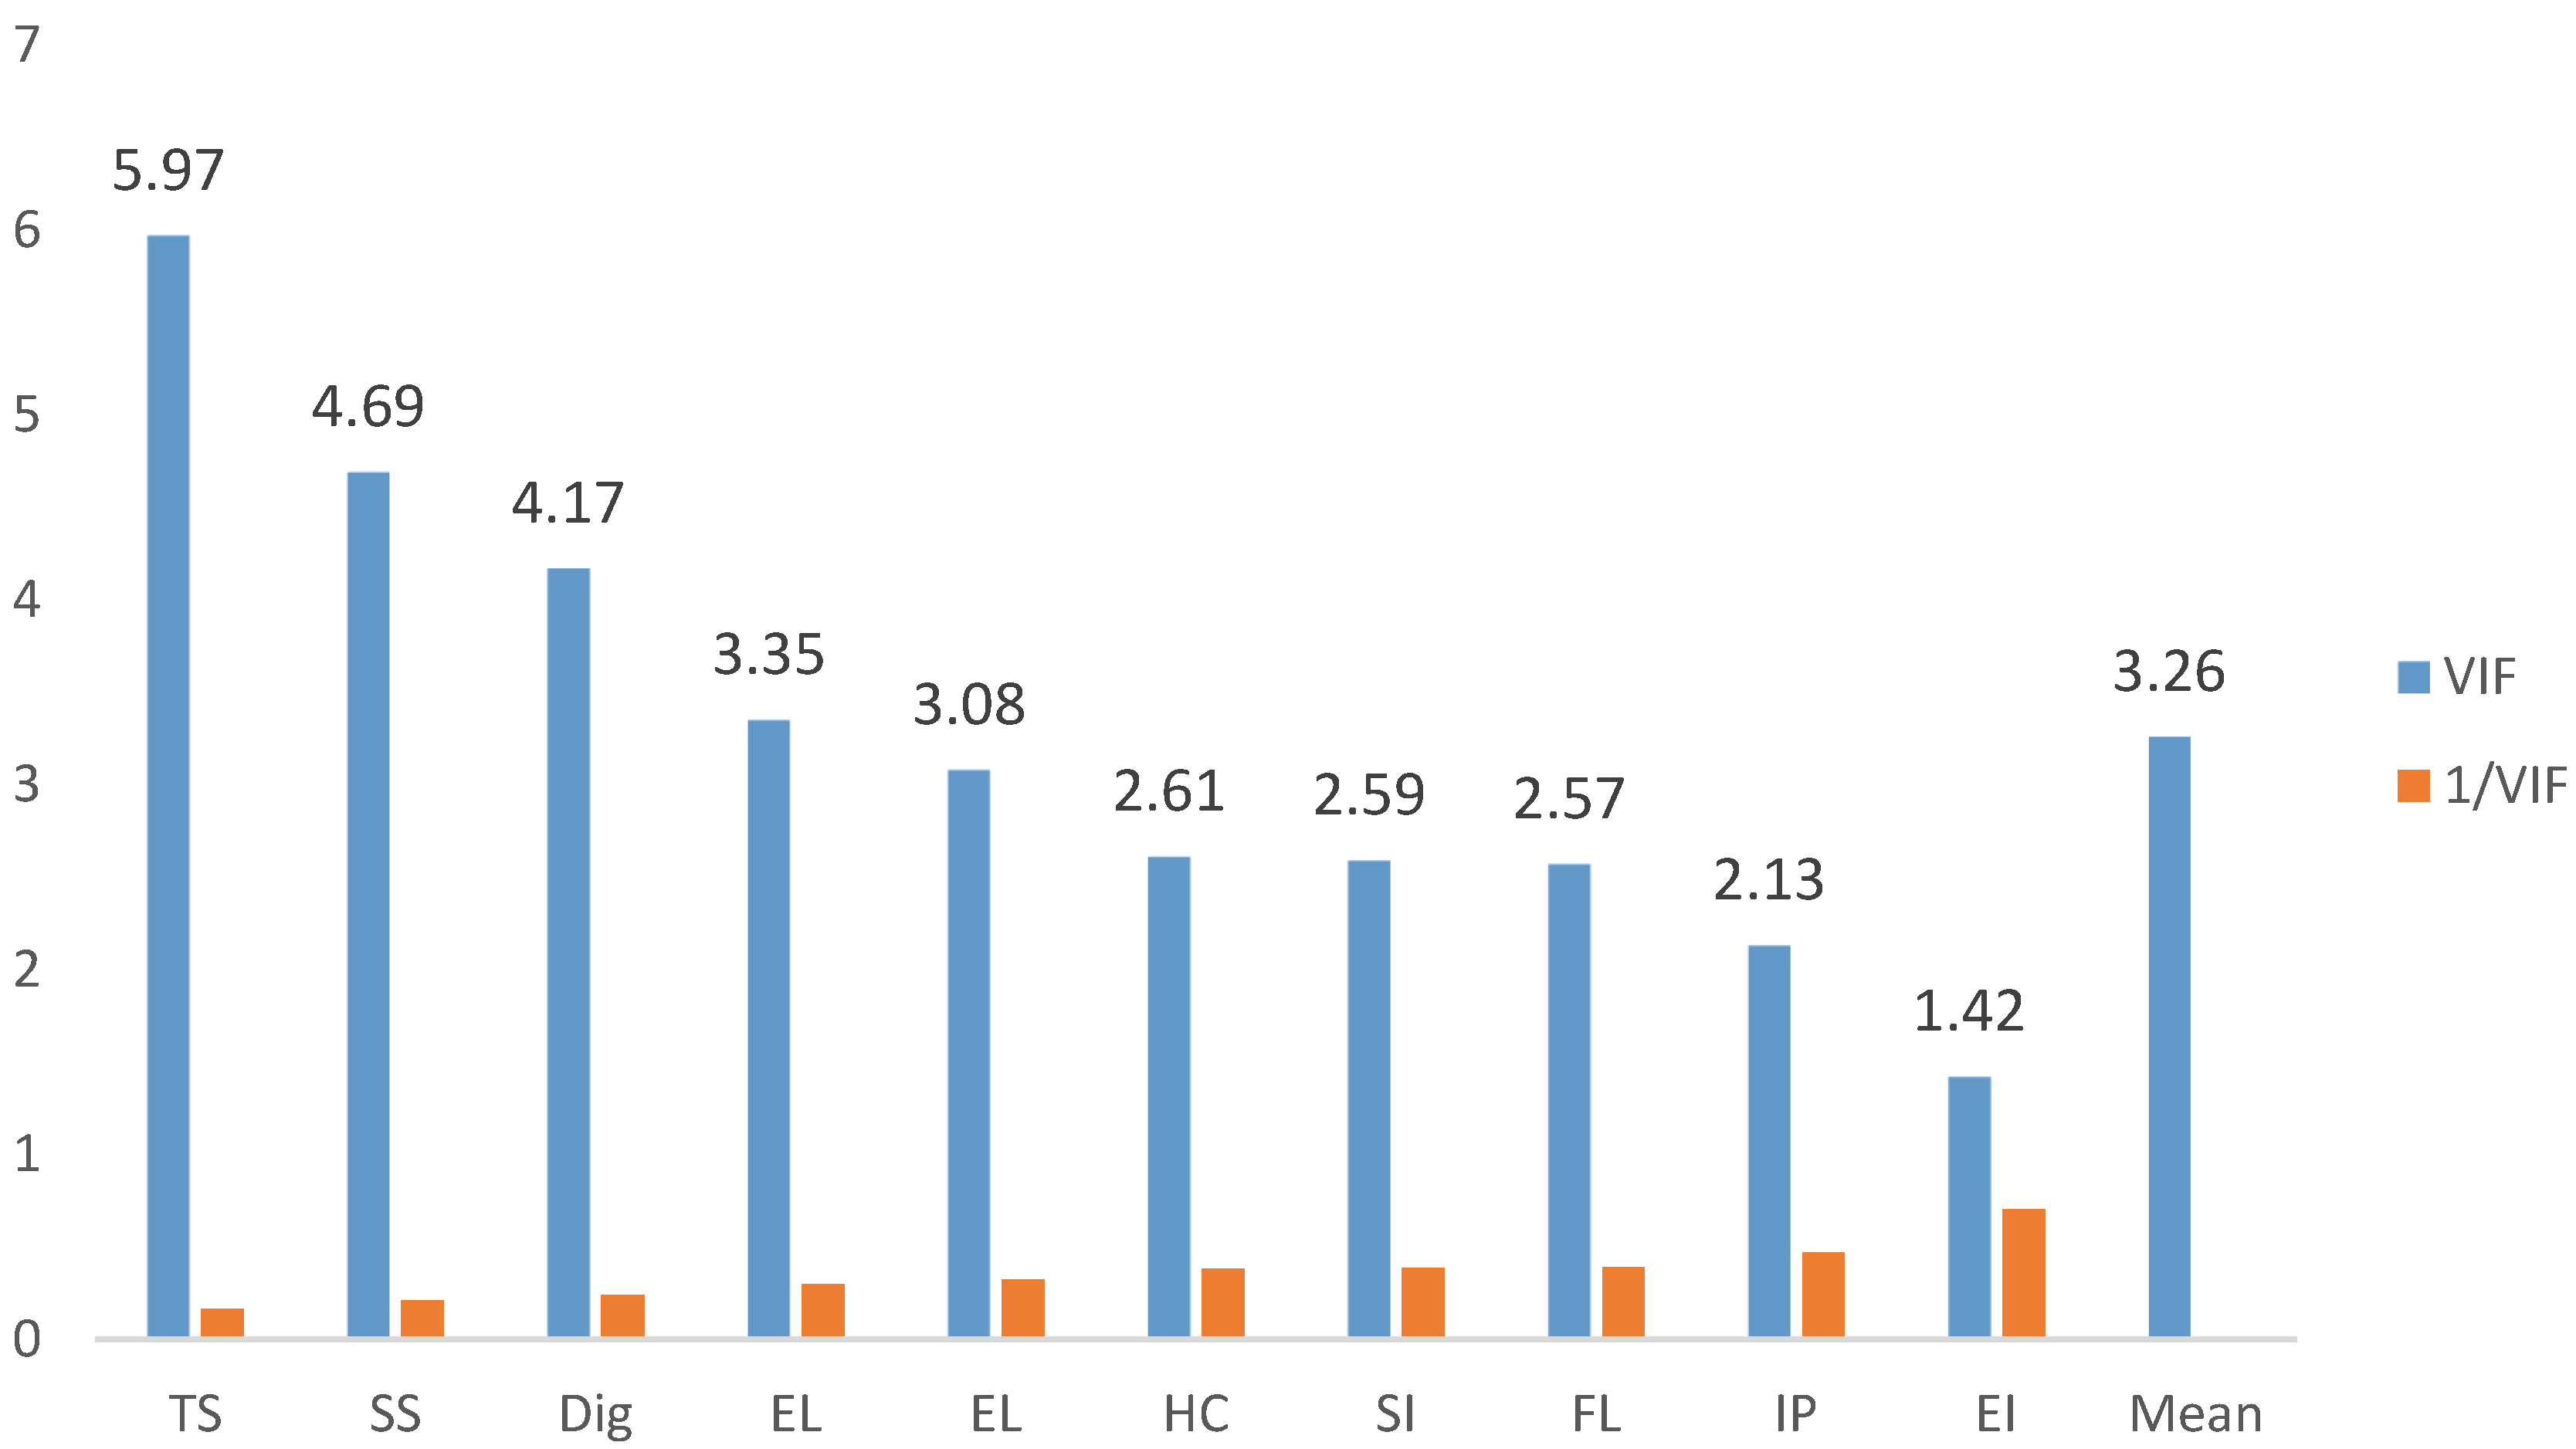
The high correlation that may exist among variables in the regression model may bring negative influence on the regression results. Therefore, this study conducted a collinearity test in order to improve the accuracy of the regression analysis results. This study calculated the variance inflation factor (VIF) to demonstrate the absence of serious collinearity in the regression model. As shown in Table 4 and Figure 2, the VIF value in this paper is 3.26 (less than 10), indicating that while there is slight collinearity between variables, it does not significantly impact the regression results. Hence, the estimation results in the regression model remain robust. Through the collinearity test, we ensured that there would be no severe collinearity issues among the variables in the model. Next, the main regression analysis, robustness checks, and endogeneity tests are conducted to further validate the robustness and reliability of the research findings.
Table 4.
The result of the variance inflation factor.
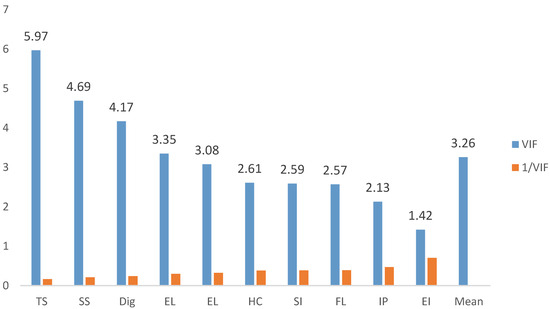
Figure 2.
The result of the variance inflation factor.
3.5. Methodology
To investigate the impact of energy intensity on green innovation, this research uses Stata 17 to perform the regression. Stata 17 is a powerful statistical software used for data analysis. Also, this paper employs a two-way fixed-effect model, which controls for both the city and time effects. Stata’s efficiency lies in its user-friendly interface, extensive built-in functions, and robust performance, making it ideal for handling large datasets and complex econometric analyses. The model is specified as follows:
where i represents the region and t represents the year. The independent variable GI is the number of green invention patents, and it represents the green innovation in region i at time t. The dependent variable EI refers to the energy intensity. FEID and FEyear represent city and year fixed effects, respectively. This study uses these two fixed effects to mitigate omitted effects. Additionally, C represents control variables, which include economic development level, human capital level, proportion of tertiary industry to GDP, average smog index, proportion of secondary industry to GDP, financial development level, digitalization level, and internet penetration rate.
4. Results
4.1. Baseline Regression
This study explains the impact of energy intensity on green innovation. From Table 5, we can see the regression results of the independent and dependent variables. The regression results show that after adding the time effect model, energy intensity and green innovation are significantly negatively correlated. In model (2), after adding the city and year two-way fixed-effect model, we obtained a regression coefficient of −325.058 for energy intensity, which passed the significance test at the 0.01 level. Model (3) adds three control variables on top of the city and year fixed effects. Finally, in Model (4), all control variables and fixed effects were added to improve the explanatory power and goodness of fit (R2 value) of the regression model, and to eliminate the potential impact of omitted variables on the independent and dependent variables. The final results show that under the significant premise of the relationship between energy intensity and green invention patents, the regression coefficient of energy intensity is −545.420. Therefore, we can infer that energy efficiency and green innovation have an inverse relationship, which means that in cities with higher energy intensity, there is less green innovation. Therefore, the above theoretical hypothesis of this paper is proven by the empirical evidence.
Table 5.
Baseline regression results.
4.2. Robustness Test
This study conducts the robustness test in order to ensure the robustness of the research conclusion. At the beginning of the robustness test, the research replaced the independent variable energy intensity with the consumption amount of a specific energy source. As shown in Table 6, the research employs electricity consumption and artificial gas and natural gas consumption as independent variables to replace the primary regression’s independent variable, energy intensity. The results indicate that even when energy intensity is replaced with specific energy consumption, the independent variable and the dependent variable remain negatively correlated, with regression coefficients of −135.190 and −34.136, respectively, both passing the significance test. Therefore, it can be inferred that the result is robust.
Table 6.
Regression results of robustness test.
Moreover, this article replaces the dependent variable to strengthen the robustness test. According to Table 6, the quantity of green invention patent applications is substituted with the quantity of green utility patent applications. The results still show a negative correlation between energy intensity and the dependent variable, with a specific value of −487.158, also passing the significance test. Therefore, it can be concluded that there is no change in the original conclusion and result.
After these three rounds of robustness tests, it can be confirmed that this study’s findings remain consistent and reliable.
4.3. Mitigating the Endogeneity Bias
In studying the impact of energy intensity on green innovation, it is essential to ensure that the research conclusions and results are robust to control for endogeneity issues. Typically, endogeneity can lead to biased estimates and negatively impact the reliability of the conclusions. Thus, this paper employs the two-stage least squares (2SLS) regression method to mitigate the effect of endogeneity on the study’s conclusions.
The first step is the first-stage regression, which uses the one-period lagged energy intensity as an instrumental variable and includes other control variables to estimate the endogenous variable energy intensity. As shown in Table 7, the regression coefficient of the one-period lagged energy intensity is 0.467, which passes the significance test. This indicates a significant positive correlation between the lagged energy intensity and the current energy intensity.
Table 7.
Regression results for instrumental variables.
In the second-stage regression, the regression coefficient of energy intensity on green innovation remains negative, with a specific value of −739.890, and it passes the significance test. Therefore, it can be deduced that the one-period lagged energy intensity can serve as an effective instrumental variable. There is a significant negative correlation between energy intensity and green innovation.
5. Mechanism Testing
According to the above calculation, the benchmark regression results of this paper show a significant negative correlation between green innovation and energy intensity. Controlling for other variables, such as economic level, financial level, digitalization, and education level, the higher the energy intensity, the less green innovation occurs. This section will analyze from two additional perspectives by using a two-step method. The first is from the perspective of government regulation. This paper uses government attention on environmental protection and the promulgation of environmental policies to represent the extent of government regulation. Additionally, this study will evaluate the management of energy intensity and green innovation from the perspective of green investment, which includes the ratio of pollution control investment to total investment, green loans, and green insurance.
In this section, some variables are selected to test the mechanism of the impact of energy intensity on green innovation. In the channel analysis, the impact of energy intensity on green innovation is tested through mediating variables. As shown in Table 8, this study sets up five regression models to evaluate the impact of energy intensity on each mediating variable. The mediating variables include the number of environmental regulations (logged), environmental regulation (measured by the frequency of environmental-related terms mentioned divided by the total number of words in government reports), green loans (measured as the proportion of total green project loans to the total loan amount), green insurance (calculated as the environmental pollution liability insurance revenue divided by total premium income), and green investment (represented by the ratio of investment in environmental pollution control to GDP).
Table 8.
Regression results of mechanism tests.
The regression results show that energy intensity is positively correlated with both the number of environmental regulations and environmental regulation (ER), and these results are statistically significant. This indicates that the higher the energy intensity, the more the government focuses on environmental issues and promulgates more regulations to encourage local enterprises and research institutions to engage in green innovation, thereby promoting sustainable development. Also, some articles prove that the government is highly concerned about environmental issues and takes various measures to incentivize green innovation [30]. Based on Figure 1, it shows that higher energy intensity will result in making more environmental policies and law by local government. The reason is that high-energy-consumption regions lead to severe environmental pollution and harm to local residents’ health [31]. Additionally, high energy intensity reflects inefficiency in environmental performance [32]. When energy consumption constitutes a significant proportion of economic output, it often indicates low energy efficiency. The government needs to introduce corresponding policies and regulations to encourage enterprises to innovate, which can help reduce pollution and resource wastage. This improves the efficiency of green innovation [33], mitigates the environmental impact of high energy intensity, and addresses environmental issues through sustainable development measures. More specifically, the government may issue subsidy measures for clean energy and impose stricter regulations and penalties on high-pollution enterprises. These policies and regulations encourage enterprises to improve their technologies and adopt efficient and environmentally friendly production methods. Additionally, this approach lays a foundation for long-term sustainable development.
However, according to the data in Table 8, green loans, green investment, and green insurance have negative regression coefficients with energy intensity, and these results are statistically significant. This indicates that even though the government continuously demands and encourages enterprises and local institutions to engage in green innovation and use sustainable clean energy, they still adhere to path dependence [34]. Path dependence significantly restricts corporate transformation because the interests of many stakeholders are affected, and there are currently no effective solutions to address this “wicked” problem [35]. For this reason, enterprises and institutions are reluctant to invest in or finance green innovations. Path dependence refers to the phenomenon where behavior patterns, once established and accepted, become increasingly reinforced over time, making it difficult and costly to change, thus continuing to use traditional high-energy consumption models in their work and life. Many studies have also confirmed this view that high energy intensity and strict regulations lead to reduced investment in green innovation [36]. Enterprises and organizations are often reluctant to choose the best technologies or products. This is due to path dependence and lock-in [37].
Based on the above results, it can be inferred that merely relying on punitive measures and incentive policies issued by the government is insufficient to change the path-dependent behavior of local enterprises. The government needs to gain a deeper understanding of energy structure reform and the improvement of the innovation environment to break the current path dependence and achieve genuine green innovation and sustainable development.
6. Heterogeneity Analysis
Due to regional differences, this study conducts heterogeneity analysis to mitigate the effects of these differences. By inserting interaction terms, this study analyzes the impact of energy intensity on green innovation under different conditions, causing the model to more accurately reflect real situations and uncover potential mechanisms so as to better understand the relationship between the independent and dependent variables.
6.1. Heterogeneity of Economic Development Level
Due to China’s vast territory and significant regional economic disparities, this study introduces an interaction term 1 generated by multiplying energy intensity and natural logarithm of per capita gross domestic product (InPgdp) into the regression model. Pgdp refers to the GDP of a region divided by its total population, reflecting the average economic output per person. This indicator can measure the level of economic development, the standard of living, and the quality of life in the area. Higher PGDP typically signifies higher living standards and economic development [38]. By adding the interaction term, the analysis examines the impact of energy intensity on green innovation at different levels of economic development. According to column (1) in Table 6, the regression coefficient of the interaction term is 598.273, and it passes the significance test. It indicates that the per capita gross domestic product has positive influence on green innovation. This suggests that, given the negative correlation between energy intensity and green innovation, cities with higher GDP per capita place greater emphasis on green invention and innovation. Combined with the observation that cities with higher levels of economic development have a greater capacity for green innovation, this drives green innovation and sustainable development. Therefore, when formulating green-related policies, the government should consider regional economic differences and promote tailored green innovation policies that suit local conditions.
6.2. Heterogeneity of Average Year of Education
In this section, we consider educational disparities across cities and introduce interaction term 2, which is the product of energy intensity and average years of schooling. Average years of schooling is defined as the total years of education of the local population divided by the total number of people. It is an excellent indicator of educational level [39]. By incorporating interaction term 2, we analyze the impact of energy intensity on green innovation at different levels of educational attainment. According to column (2) in Table 6, the coefficient of interaction term 2 is also positive (specifically, 411.072) and passes the significance test. Therefore, although higher energy intensity suppresses green innovation, cities with higher average years of schooling experience more green innovation. This is because cities with higher educational attainment typically have more educated researchers and technical experts who can accelerate information dissemination and knowledge sharing. Additionally, higher average years of schooling generally enhance the innovation capacity of enterprises and research institutions, allowing more environmental information and technologies to be shared, thereby promoting green innovation and sustainable development. Hence, this section demonstrates that higher levels of education are often associated with increased green innovation.
6.3. Heterogeneity of R&D Intensity
Considering the varying levels of research and development intensity across different regions, this section introduces interaction term 3, which is generated by multiplying energy intensity and digitalization. The investment of research and development is the reliable indicator to represent the levels of research and development intensity [40]. By adding interaction term 3 into the regression model, we analyze the impact of energy intensity on green innovation in cities with different levels of R&D intensity. According to column (3) in Table 9, the regression coefficient of interaction term 3 is positive (specifically, 60,942.917) and statistically significant. Therefore, it can be inferred that cities with a higher R&D intensity place more emphasis on green innovation. This is because higher R&D investment enhances the technological innovation capabilities of enterprises [41] and research institutions [42], thereby promoting green innovation and sustainable development [43].
Table 9.
Regression results of heterogeneity tests.
6.4. Heterogeneity of Urbanization Level
In the final subsection, this study introduces interaction term 4, which is generated by multiplying energy intensity and urbanization level, into the regression model. In this section, the level of urbanization is quantified as the ratio of the non-agricultural population to the total population. This ratio reflects the degree of urbanization in a region, indicating what proportion of the total population is engaged in non-agricultural activities, thus representing the level of urbanization. This allows for the analysis of the impact of energy intensity on green innovation in cities with different levels of urbanization. According to column (4) in Table 9, the coefficient is positive between green innovation and interaction term 5, and the specific number is 841.969. Thus, given the negative correlation between energy intensity and green innovation, the cities with higher levels of urbanization experience more green innovation. This is because higher levels of urbanization are associated [42] with more efficient resource utilization [44], and these cities typically attract more talented human resources [45].
7. Conclusions and Suggestion
7.1. Summary
This study employs a two-way fixed-effect model to analyze the relationship between energy intensity and green innovation, and observes the impacts of environmental regulation, environmental policies, and green investment as mechanisms. All research data and theoretical analyses fill the research gap in the field of the impact of energy intensity on green innovation. The relationships and mechanisms between them are summarized as follows.
First, the regression coefficient of green innovation and energy intensity was less than 0 and passed the significance test. Therefore, it can be inferred that regions with higher energy intensity bring negative impact on green innovation. To ensure the reliability of the results, collinearity and robustness tests were conducted. The collinearity test showed that the VIF value was less than 10. Additionally, the independent and dependent variables were replaced, and the regression model results confirmed their robustness. Although we hypothesized that regions with high energy intensity would result in more green innovation in order to achieve sustainable development in Section 2, our data analysis showed otherwise. After including nine control variables and employing a two-way fixed-effect model, the coefficient of energy intensity and green innovation was −545.4, and it passed robustness and significance tests. Hence, this study concludes that there is a negative correlation between green innovation and energy intensity and confirms the reliability of the regression results.
Secondly, this study conducted a mechanism analysis to explain the specific pathways through which energy intensity negatively correlates with green innovation. The analysis examined the relationship between government attention and environmental protection, the promulgation of green regulations, and green investment in relation to energy intensity. Regression data confirmed that in regions with higher energy intensity, the government places more emphasis on environmental protection and enacts more regulations and policies, prompting enterprises and institutions to reduce energy consumption and increase green innovation. Sustainable development is vital for the long-term health of future economies, environments, and societies. The government urgently promotes green innovation to transform the current high-energy-consuming situation, which not only reduces pollution but also enhances international competitiveness. Additionally, green technology innovation helps reduce dependence on non-renewable resources, drives energy structure transformation, ensures energy security, and promotes social harmony and stability. In the Hypothesis Section mentioned above, it is hypothesized that in high-energy-consuming cities, the government will place greater emphasis on green innovation and enact more environmental policies to encourage green innovation and reduce pollution. The mechanism tests validated the hypothesis presented in Section 2. However, the regression results for green investment and energy intensity showed that even in high-energy-consuming regions, enterprises and institutions are still reluctant to make green investments or undertake technological reforms. This indicates that even though the government is highly attentive to local environmental protection and enacts a series of regulations to promote green innovation, actual green investments by enterprises, such as pollution control investments, green insurance, and green loans, have not significantly increased. Strict regulations and high government attention have not effectively promoted green innovation and improved energy efficiency. This study suggests that this is primarily due to severe path dependence in high-energy-consuming regions. Due to path dependence, many structural and economic reforms are locked in, and breaking this situation requires significant resource investment, including human and financial resources. This confirms our previous hypothesis that enterprises and institutions are reluctant to invest in green initiatives even if the government enacts stringent laws. This study infers that local enterprises and institutions are heavily reliant on energy and cannot make significant reforms in the short term or require substantial resource input to change the current high energy intensity situation.
7.2. Limitation
In addition, this paper has some limitations mainly due to objective factors that may lead to biases in the data results. During the data collection process, this study found that some related variables could not be obtained from public websites or the literature due to confidentiality reasons, leading to limitations in the completeness of the data. Many control variables have not been considered, and each new control variable represents a shock that may not be captured. For example, specific details on the implementation of environmental policies in certain regions and data on corporate environmental investments are difficult to obtain through public channels, which may affect the accuracy and reliability of the results. Future research should focus more on data collection and mining, trying different methods to obtain more comprehensive and detailed variable data to improve the comprehensiveness and accuracy of the research results. Additionally, the data for this study mainly come from all prefecture-level cities in China, which means that the explanatory power of the research results may be weakened in other countries or regions. Due to significant differences in environmental policies, levels of economic development, and industrial structures among different countries and regions, the conclusions of this study may not be fully applicable to these different contexts. Therefore, future research should be based on data from other countries or regions to conduct broader validation and comparative studies, ensuring the universality and wide applicability of the research results. By expanding the research in this way, we can better understand the effects and mechanisms of environmental policies in different contexts, providing stronger support and references for sustainable development on a global scale.
7.3. Suggestion
It has been established that regions with higher energy intensity have less green innovation and significant path dependence, where enterprises and institutions are unwilling to increase green investments despite stringent environmental protection regulations. Government departments should not only provide financial incentives for green innovation but also refine green investments. Firstly, the government should consider which specific sectors will have a significant positive impact on green innovation. Most of the reward funds and investments should be allocated to these areas. This study provides the following three suggestions aimed at breaking this path dependence, promoting green innovation, and achieving sustainable development.
First, according to the regression data, cities with higher R&D investment experience gradual increases in green innovation. Therefore, the government needs to increase the R&D budget. Especially in cities or regions with high energy intensity, increasing funding support for green projects and technologies can encourage enterprises and institutions to develop green innovation and promote sustainable development.
Second, as mentioned earlier, funding policies alone are insufficient to break path dependence. High-energy-consuming cities or regions also need to improve resource efficiency by enhancing their level of digitalization. Currently, the Internet of Things (IoT), big data analytics, and smart technologies are important means to improve digitalization. Enterprises and research institutions can use these high digitalization methods for technology sharing and knowledge expansion. Additionally, the government should encourage enterprises to adopt advanced digital technologies to optimize resource allocation, thereby reducing energy consumption and pollution emissions.
Third, improving urbanization levels. According to the regression results, regions with higher urbanization levels experience gradual increases in green innovation. Therefore, this study strongly recommends that the government increase investment in urbanization in regions with high energy intensity. This includes strengthening green infrastructure such as electric public transportation, building sponge cities, and constructing eco-industrial parks to provide the foundational conditions for green innovation by enterprises and institutions. Moreover, the government should enhance talent attraction and training, combining talent and capital investment into the green industry to improve green innovation efficiency.
In conclusion, due to severe path dependence, there is a significant negative correlation between energy intensity and both green innovation and green investment. Although the government has implemented measures to change the current situation, the results have been less than satisfactory. This situation can be improved through structural reforms and innovative policies. The government should develop forward-thinking policies and measures, while enterprises and research institutions should actively respond to these initiatives. Additionally, this study suggests that enhancing education, increasing R&D investment, and raising urbanization levels may further promote green innovation. Through collaboration, all parties can effectively promote green innovation and move towards sustainable development.
Funding
This research received no external funding.
Institutional Review Board Statement
Not applicable.
Informed Consent Statement
Not applicable.
Data Availability Statement
No new data were created or analyzed in this study.
Conflicts of Interest
The author declares no conflicts of interest.
References
- Liu, Z.; Tang, Y.; Wilson, J.; Tao, X.; Lv, B.; Wang, Z.; Xu, Y.; Zhang, Z.; Zhang, Y.; Zhao, W. Influence of government attention on environmental quality: An analysis of 30 provinces in China. Environ. Impact Assess. Rev. 2023, 100, 107084. [Google Scholar] [CrossRef]
- Chinnici, G.; Zarbà, C.; Hamam, M.; Pecorino, B.; D’Amico, M. A model of circular economy of citrus industry. In Proceedings of the 19th International Multidisciplinary Scientific GeoConference SGEM 2019, Sofia, Bulgaria, 9–11 December 2019; Volume 19, pp. 19–26. [Google Scholar]
- Tang, C.F.; Tan, E.C. Exploring the nexus of electricity consumption, economic growth, energy prices and technology innovation in Malaysia. Appl. Energy 2013, 104, 297–305. [Google Scholar] [CrossRef]
- Zheng, Y.; Qi, J.; Chen, X. The effect of increasing exports on industrial energy intensity in China. Energy Policy 2011, 39, 2688–2698. [Google Scholar] [CrossRef]
- Danish; Ulucak, R.; Khan, S.U.D. Relationship between energy intensity and CO2 emissions: Does economic policy matter? Sustain. Dev. 2020, 28, 1457–1464. [Google Scholar] [CrossRef]
- Dabachi, U.M.; Mahmood, S.; Ahmad, A.U.; Ismail, S.; Farouq, I.S.; Jakada, A.H.; Kabiru, K. Energy consumption, energy price, energy intensity environmental degradation, and economic growth nexus in African OPEC countries: Evidence from simultaneous equations models. J. Environ. Treat. Tech. 2020, 8, 403–409. [Google Scholar]
- Garbaccio, R.F.; Ho, M.S.; Jorgenson, D.W. Why has the energy-output ratio fallen in China? Energy J. 1999, 20, 63–91. [Google Scholar] [CrossRef]
- Khan, M.K.; Babar, S.F.; Oryani, B.; Dagar, V.; Rehman, A.; Zakari, A.; Khan, M.O. Role of financial development, environmental-related technologies, research and development, energy intensity, natural resource depletion, and temperature in sustainable environment in Canada. Environ. Sci. Pollut. Res. 2022, 29, 622–638. [Google Scholar] [CrossRef]
- El Anshasy, A.A.; Katsaiti, M.S. Energy intensity and the energy mix: What works for the environment? J. Environ. Manag. 2014, 136, 85–93. [Google Scholar] [CrossRef] [PubMed]
- Wang, F.; Yin, H.; Li, S. China’s renewable energy policy: Commitments and challenges. Energy Policy 2010, 38, 1872–1878. [Google Scholar] [CrossRef]
- Wen, Y.; Xu, Y. Statistical monitoring of economic growth momentum transformation: Empirical study of Chinese provinces. AIMS Math. 2023, 8, 24825–24847. [Google Scholar] [CrossRef]
- Braun, E.; Wield, D. Regulation as a means for the social control of technology. Technol. Anal. Strateg. Manag. 1994, 6, 259–272. [Google Scholar] [CrossRef]
- Tran, T.; Do, H.; Vu, T.; Do, N. The factors affecting green investment for sustainable development. Decis. Sci. Lett. 2020, 9, 365–386. [Google Scholar] [CrossRef]
- Kurdyukov, V.; Ovcharenko, A. Assessing the economic efficiency of green investments in the context of sustainable development of the territory. Green Financ. 2023, 5, 343–372. [Google Scholar] [CrossRef]
- Raimondo, M.; Caracciolo, F.; Cembalo, L.; Chinnici, G.; Pecorino, B.; D’Amico, M. Making virtue out of necessity: Managing the citrus waste supply chain for bioeconomy applications. Sustainability 2018, 10, 4821. [Google Scholar] [CrossRef]
- Ghisellini, P.; Ulgiati, S. Circular economy transition in Italy. Achievements, perspectives and constraints. J. Clean. Prod. 2020, 243, 118360. [Google Scholar] [CrossRef]
- Esposito, M.; Tse, T.; Soufani, K. Introducing a circular economy: New thinking with new managerial and policy implications. Calif. Manag. Rev. 2018, 60, 5–19. [Google Scholar] [CrossRef]
- Feng, Z.; Chen, W. Environmental regulation, green innovation, and industrial green development: An empirical analysis based on the Spatial Durbin model. Sustainability 2018, 10, 223. [Google Scholar] [CrossRef]
- Wurlod, J.D.; Noailly, J. The impact of green innovation on energy intensity: An empirical analysis for 14 industrial sectors in OECD countries. Energy Econ. 2018, 71, 47–61. [Google Scholar] [CrossRef]
- Popp, D.C. The effect of new technology on energy consumption. Resour. Energy Econ. 2001, 23, 215–239. [Google Scholar] [CrossRef]
- Liu, Y.; Wang, A.; Wu, Y. Environmental regulation and green innovation: Evidence from China’s new environmental protection law. J. Clean. Prod. 2021, 297, 126698. [Google Scholar] [CrossRef]
- Zhang, X.P.; Cheng, X.M. Energy consumption, carbon emissions, and economic growth in China. Ecol. Econ. 2009, 68, 2706–2712. [Google Scholar] [CrossRef]
- Li, T.; Shu, X.; Liao, G. Does Corporate Greenwashing Affect Investors’ Decisions? Financ. Res. Lett. 2024, 67, 105877. [Google Scholar] [CrossRef]
- Tolliver, C.; Fujii, H.; Keeley, A.R.; Managi, S. Green innovation and finance in Asia. Asian Econ. Policy Rev. 2021, 16, 67–87. [Google Scholar] [CrossRef]
- Zheng, M.; Feng, G.F.; Feng, S.; Yuan, X. The road to innovation vs. the role of globalization: A dynamic quantile investigation. Econ. Modell. 2019, 83, 65–83. [Google Scholar] [CrossRef]
- Barro, R.J.; Lee, J.W. International comparisons of educational attainment. J. Monet. Econ. 1993, 32, 363–394. [Google Scholar] [CrossRef]
- Beck, T.; Demirgüç-Kunt, A.; Levine, R. Finance, inequality, and the poor. J. Econ. Growth 2007, 12, 27–49. [Google Scholar] [CrossRef]
- Brock, J.K.U.; Von Wangenheim, F. Demystifying AI: What digital transformation leaders can teach you about realistic artificial intelligence. Calif. Manag. Rev. 2019, 61, 110–134. [Google Scholar] [CrossRef]
- Xue, L.; Zhang, Q.; Zhang, X.; Li, C. Can digital transformation promote green technology innovation? Sustainability 2022, 14, 7497. [Google Scholar] [CrossRef]
- Liu, Y.; Li, Z.; Yin, X. Environmental regulation, technological innovation and energy consumption—A cross-region analysis in China. J. Clean. Prod. 2018, 203, 885–897. [Google Scholar] [CrossRef]
- Sharma, R.; Shahbaz, M.; Kautish, P.; Vo, X.V. Does energy consumption reinforce environmental pollution? Evidence from emerging Asian economies. J. Environ. Manag. 2021, 297, 113272. [Google Scholar] [CrossRef]
- Muhammad, S.; Pan, Y.; Agha, M.H.; Umar, M.; Chen, S. Industrial structure, energy intensity and environmental efficiency across developed and developing economies: The intermediary role of primary, secondary and tertiary industry. Energy 2022, 247, 123576. [Google Scholar] [CrossRef]
- Lanoie, P.; Patry, M.; Lajeunesse, R. Environmental regulation and productivity: Testing the porter hypothesis. J. Product. Anal. 2008, 30, 121–128. [Google Scholar] [CrossRef]
- Bejczy, V.G. Overcoming the Sociotechnical Barriers of Sustainable Renewable Energy Policies: Path Dependency and Technological Change. Ph.D. Thesis, Central European University, Wien, Austria, 2011. [Google Scholar]
- Vaden, T.; Majava, A.; Toivanen, T.; Järvensivu, P.; Hakala, E.; Eronen, J.T. To continue to burn something? Technological, economic and political path dependencies in district heating in Helsinki, Finland. Energy Res. Soc. Sci. 2019, 58, 101270. [Google Scholar] [CrossRef]
- Hille, E.; Möbius, P. Environmental policy, innovation, and productivity growth: Controlling the effects of regulation and endogeneity. Environ. Resour. Econ. 2019, 73, 1315–1355. [Google Scholar] [CrossRef]
- Barnes, W.; Gartland, M.; Stack, M. Old habits die hard: Path dependency and behavioral lock-in. J. Econ. Issues 2004, 38, 371–377. [Google Scholar] [CrossRef]
- Nikolaev, B. Economic freedom and quality of life: Evidence from the OECD’s Your Better Life Index. J. Priv. Enterp. 2014, 29, 61–96. [Google Scholar]
- Barro, R.J.; Lee, J.W. A new data set of educational attainment in the world, 1950–2010. J. Dev. Econ. 2013, 104, 184–198. [Google Scholar] [CrossRef]
- Guo, D.; Guo, Y.; Jiang, K. Government-subsidized R&D and firm innovation: Evidence from China. Res. Policy 2016, 45, 1129–1144. [Google Scholar]
- De Marchi, V. Environmental innovation and R&D cooperation: Empirical evidence from Spanish manufacturing firms. Res. Policy 2012, 41, 614–623. [Google Scholar]
- Liu, Y.; Lu, F.; Xian, C.; Ouyang, Z. Urban development and resource endowments shape natural resource utilization efficiency in Chinese cities. J. Environ. Sci. 2023, 126, 806–816. [Google Scholar] [CrossRef]
- Horbach, J.; Rammer, C.; Rennings, K. Determinants of eco-innovations by type of environmental impact—The role of regulatory push/pull, technology push and market pull. Ecol. Econ. 2012, 78, 112–122. [Google Scholar] [CrossRef]
- Wang, S.Y.; Chen, W.M.; Wang, R.; Zhao, T. Study on the coordinated development of urbanization and water resources utilization efficiency in China. Water Supply 2022, 22, 749–765. [Google Scholar] [CrossRef]
- Thite, M. Smart cities: Implications of urban planning for human resource development. Hum. Resour. Dev. Int. 2011, 14, 623–631. [Google Scholar] [CrossRef]
Disclaimer/Publisher’s Note: The statements, opinions and data contained in all publications are solely those of the individual author(s) and contributor(s) and not of MDPI and/or the editor(s). MDPI and/or the editor(s) disclaim responsibility for any injury to people or property resulting from any ideas, methods, instructions or products referred to in the content. |
© 2024 by the author. Licensee MDPI, Basel, Switzerland. This article is an open access article distributed under the terms and conditions of the Creative Commons Attribution (CC BY) license (https://creativecommons.org/licenses/by/4.0/).