Article

Simulation of Groundwater Dissolved Organic Carbon in Yufu River Basin during Artificial Recharge: Improving through the SWAT-MODFLOW-RT3D Reaction Module

1
Key Laboratory of Groundwater Resources and Environment, Ministry of Education, Jilin University, Changchun 130021, China
2
Jilin Provincial Key Laboratory of Water Resources and Water Environment, Jilin University, Changchun 130021, China
3
Water Resources Research Institute of Shandong Province, Jinan 250013, China
4
Shandong Provincial Key Laboratory of Water Resources and Environment, Jinan 250013, China
5
Liaocheng City Weishan Irrigation Area Management Service Center, Liaocheng 252000, China
*
Authors to whom correspondence should be addressed.
Sustainability 2024, 16(15), 6692; https://doi.org/10.3390/su16156692 (registering DOI)
Submission received: 29 June 2024 / Revised: 24 July 2024 / Accepted: 1 August 2024 / Published: 5 August 2024

Abstract

:
To keep groundwater levels stable, Jinan’s government has implemented several water management measures. However, considerable volumes of dissolved organic carbon (DOC) can enter groundwater via water exchange, impacting groundwater stability. In this study, a SWAT-MODFLOW-RT3D model designed specifically for the Yufu River Basin is developed, and part of the code of the RT3D module is modified to simulate changes in DOC concentrations in groundwater under different artificial recharge scenarios. The ultimate objective is to offer valuable insights into the effective management of water resources in the designated study region. The modified SWAT-MODFLOW-RT3D model simulates the variations of DOC concentration in groundwater under three artificial recharge scenarios, which are (a) recharged by Yellow River water; (b) recharged by Yangtze River water; and (c) recharged by Yangtze River and Yellow River water. The study shows that the main source of groundwater DOC in the basin is exogenous water. The distribution of DOC concentration in groundwater in the basin shows obvious spatial variations due to the influence of infiltration of surface water. The area near the upstream riverbank is the earliest to be affected. With the prolongation of the artificial recharge period, the DOC concentration in groundwater gradually rises from upstream to downstream, and from both sides of the riverbank to the surrounding area. By 2030, the maximum level of DOC in the basin will exceed 6.20 mg/l. The Yellow River water recharge scenario provides more groundwater recharge and less DOC input than the other two scenarios. The findings of this study indicate that particularly when recharge water supplies are enhanced with organic carbon, DOC concentrations in groundwater may alter dramatically during artificial recharge. This coupled modeling analysis is critical for assessing the impact of recharge water on groundwater quality to guide subsequent recharge programs.

1. Introduction

The redistribution of water resources on a spatial and temporal scale can be achieved through engineering or management measures such as constructing reservoirs, inter-basin water transfers, and artificial recharge [1]. Large-scale water transfer programs have been undertaken worldwide to address water imbalances [2]. For example, the North-South Water Diversion Project (SWP) in California, USA [3], and the South-North Water Diversion Project (SNWTP) in China [4]. Managed Aquifer Recharge (MAR) is a common form of artificial recharge and is widely used to maintain groundwater levels [5]. Recently, the Turkish government has successfully mitigated the depletion of the güzelyurt aquifer through water supply projects [6]. Over time, more and more individuals have realized the value of MAR for aquifer recharging. It has also been lauded as the most cost-effective, robust, and socially acceptable solution to local water resource challenges [7]. One of the often-employed MAR approaches, induced bank infiltration, raises the river level to increase the interaction between the river and groundwater.
Jinan is famous for the many springs within its borders. However, soil hardening has prevented surface water from recharging groundwater; and the population boom has led to over-exploitation of groundwater. As a result, groundwater levels in Jinan have continued to fall in recent years. Several artificial recharge projects were implemented in Jinan City’s spring recharge region to address the decreasing groundwater level [8,9]. River water and groundwater are chemically distinct from one another. River water is usually rich in O2, DOC, and nitrate, while DOC concentration in groundwater is at a low level [10]. When river water is used for recharge, the chemical composition of groundwater is inevitably affected. As an important component of groundwater chemistry, changes in DOC content affect the environmental quality of groundwater [11]. When the DOC level of groundwater is high, bacteria can use the organic carbon for oxidation, producing oxidation products such as carbon dioxide and sulfate. These oxidation products will alter the pH and redox potential of groundwater, hence affecting its chemical stability [12]. Furthermore, the breakdown of organic carbon releases a significant amount of heat, resulting in a rise in groundwater temperature, which affects the physical stability of groundwater. More importantly, the reaction of DOC with chlorine during disinfection produces disinfectant by-products (DBP), which can increase the risk of cancer in drinking water [13]. The Yangtze River and Yellow River both have greater DOC concentrations than groundwater during Jinan’s artificial recharge procedure, which might be dangerous for the city’s groundwater. Therefore, it is important to study the changes in DOC content in groundwater during surface water conversion to groundwater.
It is crucial to conduct routine sampling in recharge zones to evaluate the quality of groundwater supplies. However, the assessment is usually carried out using field measurements, which have many limitations [14]. As a result, modeling becomes a useful method for examining how integrated hydrological interactions between groundwater and surface water affect the groundwater’s chemical environment [15]. For example, Arora et al. [16] assessed the effects of microbial activity, redox conditions, and temporal fluctuations in temperature and water table on subsurface carbon fluxes in the floodplain through the TOUGREACT V3-OMP model. Guo et al. [17] used the PFLOTRAN model to simulate the changes in organic carbon concentration in groundwater due to artificial recharge during the dry period in the Yufu River basin. However, the above model focuses more on groundwater, which results in lower simulation accuracy when it comes to complex watershed conversions between surface water and groundwater. SWAT-MODFLOW, a combined groundwater–surface water model, is widely utilized globally [14,18,19,20,21,22]. Wei and Bailey [21] assessed the fluctuations in nitrate and phosphorus in groundwater as a result of fertilizer application throughout agricultural production processes by combining SWAT-MODFLOW with the subsurface reactive transport model (RT3D). Since the reaction mechanism of DOC in groundwater is different from that of nitrate and phosphate, the existing SWAT-MODFLOW model cannot realize the simulation of DOC for the time being. However, the open-source SWAT-MODFLOW-RT3D model permits changes to the pertinent code to resemble solutes like organic carbon [19].
This study has two goals: (1) modify the existing SWAT-MODFLOW-RT3D model to simulate the fate and transport of DOC in groundwater systems; (2) utilize the model to assess the impact of artificial recharge on DOC in the Yufu River basin’s aquifer system and supply scientific guidance for subsequent water resource regulation.

2. Materials and Methods

2.1. Study Area

The study area is located in Jinan, a major city in China’s southern Bohai Rim region (Figure 1). Jinan is situated to the south of Mount Tai and spans across the Yellow River, lying in the transitional zone between the low mountainous hills in south-central Shandong and the northwest alluvial plain. From south to north, the topography gradually changes from low mountainous hills to a gently sloping plain in the foothills and finally to the floodplain of the Yellow River. Considering the delineation of the major seepage zones within the Jinan area [23], the Yufu River watershed was selected as the focal point for simulation, covering an area of 63.25 km2. The Yufu River is the main river in the study area, with a length of 15.93 km.
According to the Köppen–Geiger classification, the climate is monsoonal (cold, dry winter, hot summer) [24]. For the period 2011–2020, the average temperature in the study area was 15.2 °C, with an annual temperature variation of approximately 29.5 °C. The summer months’ average temperature (June, July, and August) varied from around 27.7 °C to 28.1 °C, while the winter months’ average temperature (December to February of the next year) varied from around −1.16 °C to 1.8 °C. The research region saw 692 mm of rainfall on an average year, with roughly 50–60% of the total falling between July and August. The average annual evaporation was 1475.6 mm.
The study area contains two major aquifer formations: the fissure-karst aquifer and the porous aquifer. The porous aquifer is widely distributed along the Yufu River and its banks, with the upper part of the aquifer belonging to the Quaternary system. In the study area, the Quaternary system is a single- or double-layered structure, with an increasing thickness from Zhai’er Tou to South-North Bridge, ranging from 7 to 30 m. The exposed rocks in the riverbed consist of Quaternary loess, while the rocks within the riverbed mainly comprise pebbles with low water-retaining capacity but good permeability. There is a good hydraulic connection between the Quaternary system and the porous aquifer, resulting in significant seepage. The porous aquifer primarily receives recharge from atmospheric precipitation and lateral seepage from the river water. The underlying fissure-karst aquifer is mainly composed of Cambrian Zhangxia Formation limestone, characterized by developed fissure-karst features and strong water yield property. The hydrogeologic section of the strong leakage zone of the Yufu River is shown in Figure 2. The interaction between the surface water in this strong seepage zone and the groundwater is intense. According to local pumping test results, the hydraulic conductivity of the fractured karst aquifer is 7.293 m/day [25].
Since 2003, Jinan City has been importing about 18 million m3 of recharge water to the upper reaches of the Yufu River every year, using the multi-source artificial recharge project [8]. Among these, water from the Yellow River is pumped through the Tianshan Irritate Station and released through four water outlets in the study area via water pipelines. Water from the Yangtze River is transported to the Wohushan Reservoir for storage and then released downstream according to demand.

2.2. SWAT Setup and Validation

SWAT is a semi-distributed hydrological model based on a physical foundation [27]. It uses a daily time step for continuous calculations and can simulate hydrological cycle processes at the basin scale [28]. Using a digital elevation model (DEM), the research region is first separated into subbasins. These subbasins are then further classified into combinations of soil type, land use type, and slope, or hydrologic response units (HRUs). The model run was finished by extending the HRU percentage region within the subbasin to the subbasin outflow once SWAT calculations for each HRU were finished. Detailed information about the SWAT model can be found in Melaku and Wang [29].
The model used in this study is based on a DEM with a resolution of 30 m × 30 m obtained by resampling the Geospatial Data Cloud DEM. The study area was divided into 33 subbasins by using the function of automatic subbasin delineation of ArcSWAT. The watershed extent, stream network distribution, and location of point source inputs in the watershed are shown in Figure 1.
To represent soil types, a resolution of 30 m × 30 m Harmonized World Soil Database (HWSD) was used [30]. Most of the parameters were selected from the attribute table accompanying the HWSD, and the remaining parameters (hydraulic conductivity, etc.) were calculated using the SPAW model. The hydrologic grouping of the soils was referenced to the hydrologic component grading standards published by the Soil Conservation Service of the United States Department of Agriculture [31].
The land use data of the study area was acquired from the FROM-GLC Dataset, and seven land use types were classified. As for the slope, to simplify the subsequent SWAT-MODFLOW model, this terrain slope was divided into two categories by 10 degrees. Based on the above soil type (Figure 3a), land use (Figure 3b), and slope classes (Figure 3c), the finalized number of HRUs in this study area is 941.
Meteorological data such as precipitation and evaporation were obtained from the Changqing weather station.
To make the model more realistic, the CA-Markov model was chosen to predict future land use [32]. Additionally, CSFR was selected as the weather generator of the model to simulate the missing meteorological data (e.g., precipitation, air temperature, and relative humidity) in the study area [33].
According to the collected measured data, the water recharge will be input to the river as a point source. The amount of water recharged from the Yellow River is distributed equally to each outlet (yellow triangles in Figure 1) according to the maximum 200,000 m3/d during the recharge period. During this simulation period, the amount of water released in Wohushan Reservoir (red dot in Figure 1) is shown in Figure S1. The ‘.dbf’ files of the point source input location and the point source input volume were established, respectively, and input into the model when the SWAT model was built. The water resources recharge data were imported into the model in the form of daily input in the ArcSWAT point source replenishment editing directory, and a .dat file was generated. The file would record the model’s point source input in the form of daily replenishment and read during the model run.
The measured data determine the initial soil DOC content. The soil DOC contents in the upper, middle, and lower sections of the watershed were 1.03, 11.62, and 6.14 g/kg, respectively. The input of DOC from the recharge water source was achieved through the point source input module. The measured values of the DOC concentrations were 6.33 mg/L for Yellow River water and 6.6 mg/L for Yangtze River water.
After completing the model construction, the SWAT model was run and the ‘.sub’, ‘.hru’, and ‘.rch’ files were selected as results for output. The other parameters required for SWAT model operation and their values are shown in Table 1 and Supplementary Material.
Potential Evapotranspiration (PET) is one of the key factors studied in hydrological cycles. However, different assessment methods can lead to different results. The semi-empirical and semi-theoretical Priestley–Taylor model requires fewer parameters and can be applied to calculate PET for different underlying surfaces [35]. Additionally, simulation results of daily runoff in the southeastern United States show that the Priestley–Taylor method performs better in simulating runoff compared to the Hargreaves and Penman-Monteith methods, especially under extreme conditions [36]. In this study, the Priestley–Taylor method was selected to calculate PET. The simulated valve was compared with the measured values from a meteorological station in 2019 to evaluate the performance of the SWAT model. The measured and simulated evaporation values in the study area are shown in Figure S2. The correlation coefficient (R2) between them is 0.7487, which means that the fit is good, and the evaporation obtained from the SWAT simulation is in line with the actual situation.

2.3. MODFLOW Setup

By solving the numerical equations governing groundwater flow using finite difference methods, MODFLOW can simulate groundwater’s spatial characteristics and movement [37]. According to Molina-Navarro et al. [28], the research area’s geology, boundary conditions, and recharge and discharge circumstances all have an impact on the model’s design. The MODFLOW model’s correctness is directly impacted by the collection and accuracy of these parameters [38].
The model is simplified as a single-layer heterogeneous isotropic unconfined aquifer based on geological data from the Yufu River basin and considering the aquifer’s lithology and thickness. Based on the research area’s 30 m resolution DEM data (Figure 1), the north and south sides are watersheds, thus the borders on the north and south sides are simplified as zero-flow bounds. The east and west bounds of the research area are parallel to the contour of the water table of the initial flow field, which is based on the initial groundwater flow field of the study region (Figure S3). As a result, the research area’s east and west bounds have been condensed into flow boundaries. The schematic diagram of the boundary condition generalization is shown in Figure S4.
The model boundary’s geographic breadth is compatible with the SWAT model. GMS was used to carry out the research area’s grid dissection. The entire model was dissected into 114 rows × 113 columns rectangles with 12,882 grids, each of which was 100 m × 100 m in size. The conceptual model of the study area is shown schematically in Figure S7.
The model’s other initial conditions, including the initial flow field, aquifer parameters, and source/sink terms, are determined based on water level monitoring data and actual geological information. The source/sink terms consider both precipitation recharge and river seepage. The “Recharge” and “River” modules of MODFLOW are used to implement the model, respectively. In this study, MODFLOW-NWT [39] will be used to simulate the groundwater model in the basin.

2.4. SWAT-MODFLOW Coupling and Validation

SWAT can simulate surface runoff processes, baseflow, and soil hydrological processes, while MODFLOW can simulate three-dimensional groundwater flow processes. SWAT-MODFLOW is a coupled model for surface water and groundwater interaction based on SWAT and MODFLOW-NWT while preserving the benefits of both separate models [14,40,41]. In recent years, this model has been widely used to quantitatively assess water resources and the impact of pumping and recharge on groundwater [42,43,44].
The key to building the SWAT-MODFLOW model is the generation of linkage files. This study used the QSWATMOD plug-in in the QGIS platform to generate the linkage files required for model operation. Details of the coupling process and the generation of linkage files can be found in Bailey et al. [14] and Park et al. [18]. Validation results for the coupled model are provided in the Supporting Information. Additionally, an analysis of hydrological processes during the simulation period is conducted.
The validation of the coupled model includes MODFLOW and SWAT. In this section, MODFLOW will be validated based on the joint simulation of SWAT and MODFLOW. The validation results are determined by analyzing the groundwater levels obtained from the joint simulation. The groundwater flow field at the end of the period simulated by this coupled model is shown in Figure S5. The groundwater level is generally high in the southeast and low in the northwest. From the groundwater level fitting results shown in Figure S6, it can be seen that the coupled model achieves a good fit between the simulated groundwater levels and the measured values, with a correlation coefficient of R2 = 0.85.

2.5. SWAT-MODFLOW-RT3D Setup

The three-dimensional reactive transport model (RT3D) can simulate the migration and reaction processes of various dissolved substances in groundwater by solving the advection-dispersion-reaction (ADR) mass balance equation [45]. As a subroutine contained within the MODFLOW-NWT software, RT3D has been implemented within the SWAT-MODFLOW model architecture and is accessible at each time step [19].
SWAT estimated the mass of organic carbon in the water column during precipitation leaching and river confluence in the model run and then computed the organic carbon recharge resulting from both recharging independently. For the material transfer process from surface water to groundwater, this study utilizes the smrt_conversionrt3d package of the S-M-R model, which adds the incremental increase in organic carbon due to precipitation infiltration and riverine portion to the model. MODFLOW calculates groundwater levels, groundwater fluxes, and source/sink terms for each grid and links them to RT3D. The process of transferring data between them is shown in Figure 4. RT3D then solves the ADR equation based on the flow information provided by MODFLOW and the concentration information contained within RT3D, and ultimately yields a value for DOC concentration on each grid. The ADR equation in a saturated porous medium can be found in Wei and Bailey’s work [21].

2.5.1. Model Modification

The SWAT-MODFLOW model, through its coupling with the RT3D model, enables the simulation of nitrate and phosphate in groundwater during the interactions between surface water and groundwater. However, the existing ADR equation does not express the reaction processes of DOC in groundwater. In this study, based on the reaction mechanism of DOC, the relevant code about the chemical reaction rate law in the rt_rxns file of RT3D was modified under the Intel Visual Fortran platform, and the original equations were changed to the chemical reaction equations of DOC in groundwater (Equation (3)) and compiled into an executable file so that the SWAT-MODFLOW-RT3D model can perform the simulation of DOC migration.
In the groundwater system, DOC was utilized by aerobic respiration as follows:
C H 2 O + O 2 H 2 O + C O 2
Based on the ADR equation in saturated porous media [21], the ADR for DOC transport in the groundwater system is as follows:
C D O C t R D O C = x i ( v i C D O C ) + x i ( D i j C D O C x j ) + q s ϕ C s D O C + r D O C
where C D O C M f L f 3 is the concentration of DOC in aqueous phase; R D O C is the retardation coefficient for DOC, representing linear sorption with aquifer sediment surface sites, and in this study it is set to 1 for all grid cells [21,46]; x i , j L is the position of the dissolved substance in the coordinate system; D i j L 2 T 1 is the hydrodynamic dispersion coefficient; v i L b T 1 is the average groundwater velocity where b denotes the bulk phase; ϕ L f 3 L b 3 is soil porosity; q s L f 3 T 1 L b 3 is the volume of the source and sink; C s D O C M f L f 3 is the concentration of DOC in the source and sink; and r D O C M f L f 3 T 1 represents the rate of all reactions that occur in the aqueous phase for DOC.
The single Monod expression was used as the rate law for DOC reactions [47,48]:
r D O C = X A R V A R ( C D O C K D O C + C D O C ) ( C D O K D O + C D O )
where X A R M f L f 3 is the biomass of the microbial population engaged in aerobic respiration, and 6.25 × 10⁻⁵ g/L3 was taken as an empirical value in this study [48]; V A R T 1 is the maximum specific uptake rates of the substrate, and 2/h was taken as an empirical value in this study [47]; K D O C M f L f 3 is the Monod half-saturation constant for DOC, and 1 mg/L was taken as an empirical value in this study [49]; K D O M f L f 3 is the Monod half-saturation constant for dissolved oxygen, and 1 mg/L was taken as an empirical value in this study [49]; C D O M f L f 3 is the concentration of DOC; and C D O M f L f 3 is the concentration of dissolved oxygen.

2.5.2. Model Set-Up

Based on the MODFLOW model, an RT3D model was built for this investigation. The model’s upper border is designated as the boundary for precipitation, and the Yufu River is set as the river boundary. The impermeable border on both sides and the research area’s bottom are set as zero-flux boundaries, whereas the groundwater flow model’s lateral inflow boundary is set as a constant concentration boundary. According to the actual measurement results, the average groundwater DOC concentration in the watershed is 3.0 mg/L, and the groundwater DOC concentration entering the study area through lateral runoff is 3.2 mg/L. Therefore, 3.0 mg/L will be used as the initial groundwater DOC concentration in the study area.
Based on research of the relevant domestic literature and field visits, the following sources of DOC in groundwater in the study area were considered: organic carbon enters groundwater with leaching during atmospheric precipitation; organic carbon enters groundwater when water exchange occurs between rivers and groundwater; and lateral flow of groundwater between aquifers leads to the entry of organic carbon into aquifers from groundwater outside the study area [26,50,51].

2.6. Sensitivity Analysis of the Model

The effect of the model parameter uncertainty on groundwater chemistry model outcomes may be quantified by sensitivity analysis [52]. In this study, the hydraulic conductivity (K), the biomass of the microbial population engaged in aerobic respiration (XAR), and porosity (φ) were selected as representative parameters. K is a variable in the differential groundwater flow equation [53] and is essential for MODFLOW to correctly model the hydrodynamic field in the study area. XAR and φ are variables in the ADR equation representing the rate of chemical reaction of organic carbon and the effect of lithologic media on DOC concentration, respectively. The calculation formulas are as follows:
S i = F ( x 1 . . . , x i + Δ x i . . . , x n ) F ( x 1 . . . , x i . . . , x n ) F ( x 1 . . . , x i . . . , x n ) Δ x i x i
where S i is the sensitivity of the i th parameter; Δ x i is the amount of change of the parameter; x i is the initial value of the parameter; F ( x 1 . . . , x i . . . , x n ) is the model output result with the parameters in the initial state; and F ( x 1 . . . , x i + Δ x i . . . , x n ) is the model output result after changing the parameter value.
To determine the effect of the parameters on the model, ±10% and ±20% are varied sequentially from their initial values, and the degree of variation in the model output results is analyzed. The calculated results are shown in Table S2. In the reactive transport model constructed in this study, DOC showed the highest sensitivity to changes in porosity, with values ranging from 0.63 to 0.67. The sensitivity of the hydraulic conductivity and the biomass of the microbial population engaged in aerobic respiration were similar, ranging from 0.1 to 0.2. Therefore, the lithological media had the greatest impact on groundwater DOC concentration in this study.

3. Results and Discussion

3.1. Distribution of DOC in Groundwater by Leaching

The amount of infiltration recharge in different areas of the basin can be influenced by many factors. It is easy to identify the impact of terrain slope, land use, and soil type on groundwater recharge via precipitation infiltration by examining the infiltration quantity of the grid. It is also feasible to assess the increase in groundwater DOC quality due to precipitation recharge in various places indirectly. The coupled model was used to assess the 2018 precipitation data in this study, and the findings are given in Figure 5a.
The spatial distribution of average daily precipitation recharge reveals that the quantity of precipitation recharge to groundwater in the research region is impacted more by terrain slope. The average daily groundwater recharge for the same land use type is larger in locations with a topographic slope of less than 10 degrees. Cropland with a topographic slope of less than 10 degrees has the highest average daily recharge in the research region, with daily recharge ranging from 1.37 to 2.61 m3/d. Groundwater recharge in forests and watershed upstream of the basin is less than 0.96 m3/d, primarily because of the steeper topography of the area, where much of the precipitation is lost as runoff [54]. Furthermore, due to ground hardness, precipitation recharge to groundwater near communities is near nil [55]. Slope and land-use type work together to limit precipitation infiltration.
The main source of DOC in groundwater within the basin is the leaching of DOC from the soil caused by precipitation and runoff recharge. However, the results of the simulation based on infiltration recharge of precipitation (Figure 5b) showed that the leaching of soil organic carbon has a limited contribution to the DOC provided to groundwater. DOC concentrations decreased significantly in all areas except for an increase in some parts of the midstream (up to 3.43 mg/L). In most areas within the study area, the groundwater DOC concentration was below 2.31 mg/L. The advection-dispersion and biological degradation rates exceeded the efficiency of DOC infiltration recharge.

3.2. Distribution of DOC in Groundwater under River Recharge

Due to the high concentration of DOC in the recharge water sources, the Yufu River can continuously provide organic carbon to the surrounding groundwater through water exchange. As the annual artificial recharge increases, so does the river recharge to groundwater in terms of volume and DOC quality. The average recharge of the river to the groundwater was 9524.7 m3/d in 2018 and increased to 10,389.8 m3/d in 2019. Correspondingly, the DOC input to the groundwater was 15.81 kg/ha in 2018 and increased to 18.93 kg/ha in 2019. Figure 6a shows the concentration of DOC in the groundwater at different locations in the basin. The results indicate that the trends of groundwater levels (Figure 6b) and DOC concentrations at each observation point remain consistent during artificial recharge.
At the three observation sites close to the river, both groundwater levels and DOC concentrations demonstrated an increasing trend. However, groundwater levels and DOC concentrations in the vicinity of different reaches varied in their trends. The groundwater level at the upper reaches rises rapidly at the beginning of the simulation, slowing down in the later stages and eventually stabilizing. The amount of river water entering the aquifer and the infiltration distance are positively correlated functions concerning the hydraulic gradient [56,57]. In the early stages of the simulation, the reservoir releases lead to an increase in river water levels [58]. Because of the considerable hydraulic gradient, intensive water mixing and exchange occurs between the aquifer and river water, resulting in a fast rise in aquifer water levels and DOC concentrations along the riverbank [59]. In the later stages of the simulation, the gap between river water levels and nearby groundwater levels decreases. The lateral recharge of the river is weakened, and the groundwater level rises slowly. The fluctuation of river water levels controlled by reservoirs alters the surface water–groundwater interaction in the basin through changing hydraulic gradients and expanding high water-level areas [60]. Seasonal variations in runoff in the middle reaches of the river are moderate due to the regulating effect of anthropogenic water releases [61]. The limited river recharge and flat terrain resulted in relatively stable growth rates of aquifer groundwater levels and DOC concentrations throughout the simulation period. Groundwater levels and DOC concentrations near the downstream area rise slowly at the beginning and become faster at the later stages of the simulation. There is a time lag in the effect of reservoir releases on downstream aquifers due to the long river reaches in the study area [62]. Impacts from reservoir releases began to manifest gradually in July 2018 and increased with the 2019 artificial recharge.
In the three locations furthest from the river, the DOC concentrations and groundwater levels stayed essentially stable. At the beginning of the simulation, the groundwater level in the area far from the river is higher than that of the river. The groundwater in this region does not receive recharge from the river and the groundwater level and DOC concentrations remain stable. As time passes, the river water level rises and exceeds the groundwater levels, and the recharge area of the river gradually expands from upstream to downstream. Therefore, in the later stages of the simulation, a slight increase in groundwater levels and DOC concentrations can be observed in the area farther from the river. Hydraulic gradients may be reversed due to a rise in river level during water recharge. Such a transition of flow paths will lead to the expansion of lateral solute exchange [63].
Changes in the water cycle caused by artificial recharge have a greater impact on DOC concentrations in surface water and groundwater in the study area than the leaching effect of precipitation. After the simulation, the basin’s groundwater DOC concentration distribution is depicted in Figure 6c. From the Figure, it can be seen that the distribution of organic carbon concentration has obvious spatial differences, and the high values of the concentration in the study area all appeared near the river, distributed between 3.88 mg/L and 6.53 mg/L. Since the reservoir receives the recharge from the Yangtze River water with high organic carbon concentration, when the reservoir is utilized for the management of the recharge, the confluence of the Yangtze River water will lead to a rapid increase in the concentration of DOC in the surface water in the study area, especially in the section of the river closest to Wohushan Reservoir. The highest range of DOC concentration in the basin is below the Wohushan Reservoir, with a concentration ranging from 5.82 mg/L to 6.53 mg/L, which is close to the 6.60 mg/L for Yangtze River water. It indicates that under the continuous artificial recharge, DOC from surface water will continue to enter the groundwater by infiltration. The lowest areas of DOC concentration are distributed around the basin upstream, with a concentration ranging from 0.66 mg/L to 1.57 mg/L. The region has steep terrain slopes, which easily lead to surface runoff. This situation is unfavorable for the accumulation of DOC in the soil and the infiltration of surface water, resulting in a lower concentration of DOC in the groundwater [54,64]. Influenced by the regional topography, the upstream forested areas and the downstream farmland receive precipitation recharge and subbasin convergence, and the concentrations are distributed between 2.66 mg/L and 3.35 mg/L. In addition, groundwater DOC concentrations are low in some villages due to impervious surfaces that impede rainfall and surface water infiltration [55,65]. Furthermore, in most places on both sides of the riverbanks, groundwater DOC concentrations varied from 2.66 to 3.04 mg/L, which was higher than what was predicted under precipitation-leaching situations. Because the Yufu River’s water level is higher than the groundwater table, lateral seepage causes the DOC pollution halo to progressively extend out from the riverbed, eventually affecting the majority of the watershed.
In conclusion, the additional recharge from the Yellow River and Yangtze River water resulted in a gradual increase in surface water level and DOC concentration from upstream to downstream. The change in hydraulic gradient affects the recharge relationship between surface water and groundwater. The lateral seepage of surface water was enhanced, which eventually led to the increase in groundwater level and DOC concentration in the majority of the basin.

3.3. Effect of Different Recharge Sources on DOC Concentrations in Groundwater

Based on the local multi-source recharge project, the present study simulated the changing pattern of groundwater DOC concentration under three artificial recharge scenarios: (a) recharge by the Yellow River water; (b) recharge by the Yangtze River water; and (c) recharge by the Yangtze River and the Yellow River water. This allowed researchers to ascertain the degree of influence that various artificial recharge sources had on the groundwater DOC concentration in the Yufu River basin. The results indicate that DOC concentrations in groundwater in the basin increased to varying degrees under all three recharge scenarios. Correspondingly, in most regions, the DOC concentration reached and exceeded 5.83 mg/L, 6.08 mg/L, and 6.11 mg/L, respectively. However, in upstream watershed areas of the basin, the DOC concentration remained low, with only a slight increase compared to the end of 2019. The higher groundwater levels and low river water recharge in this region affected the influx of DOC. However, the high concentrations of DOC in downstream groundwater can still enter the upstream watershed through dispersion, resulting in a slight increase in DOC concentration in this area. The regions with the lowest DOC concentrations in the basin are the low-lying villages in the middle and lower reaches. DOC concentrations are below 1.10, 1.06, and 1.34 mg/L in the three simulation scenarios. Impervious surfaces in the area decrease the aquifer’s permeability, which has an impact on the inflow of DOC [65,66]. However, compared to the single-water recharge models (Figure 7a,b), this region has a smaller extent and higher concentration in the multi-water recharge model (Figure 7c). The higher rate of groundwater replenishment plays a significant role in facilitating the influx of DOC. Furthermore, the concentration of DOC in the middle and upper watershed areas is influenced by elevation and topography. Specifically, low-lying areas exhibit higher DOC concentrations, ranging from 3.84 to 4.44 mg/L, 3.78 to 4.45 mg/L, and 4.14 to 4.73 mg/L in the three simulated scenarios. Conversely, areas with steep terrain display lower DOC concentrations, ranging from 3.31 to 3.84 mg/L, 3.19 to 3.78 mg/L, and 3.61 to 4.14 mg/L in the three simulated scenarios.
In summary, when recharge water was used as an additional source of groundwater recharge in the study area, a substantial increase in DOC concentrations in groundwater was observed in all areas of the basin. The downstream cropland showed the highest increase in DOC concentration, ranging from 229% to 245%; followed by the upstream forest, with an increase of 133% to 159%; and the smallest increase in DOC concentration occurred in the midstream valley, ranging from 122% to 132%. Additionally, the area of low DOC concentration due to the presence of impermeable surfaces was also significantly reduced. Water exchange plays a large role in the enrichment of DOC in groundwater.
Different recharge sources and recharge points can affect the final results of the DOC model for groundwater. Among the three recharge scenarios, the Yellow River water recharge contributes the smallest increase in DOC concentration in the underground water of the Yufu River basin. According to the interannual recharge for groundwater and DOC (Table S1), the maximum groundwater recharge can reach 3.280 million m3 when selecting Yellow River water, which is only 0.542 million m3 less than the multi-source recharge scenario. Additionally, when using the Yellow River water for recharge, the input quantity of DOC unit volume of groundwater is 0.013 kg/m3, which is lower than that of Yangtze River water (0.019 kg/m3) and the multi-source water resource (0.016 kg/m3). Therefore, future artificial recharge plans should consider increasing the proportion of Yellow River water in the recharge source.

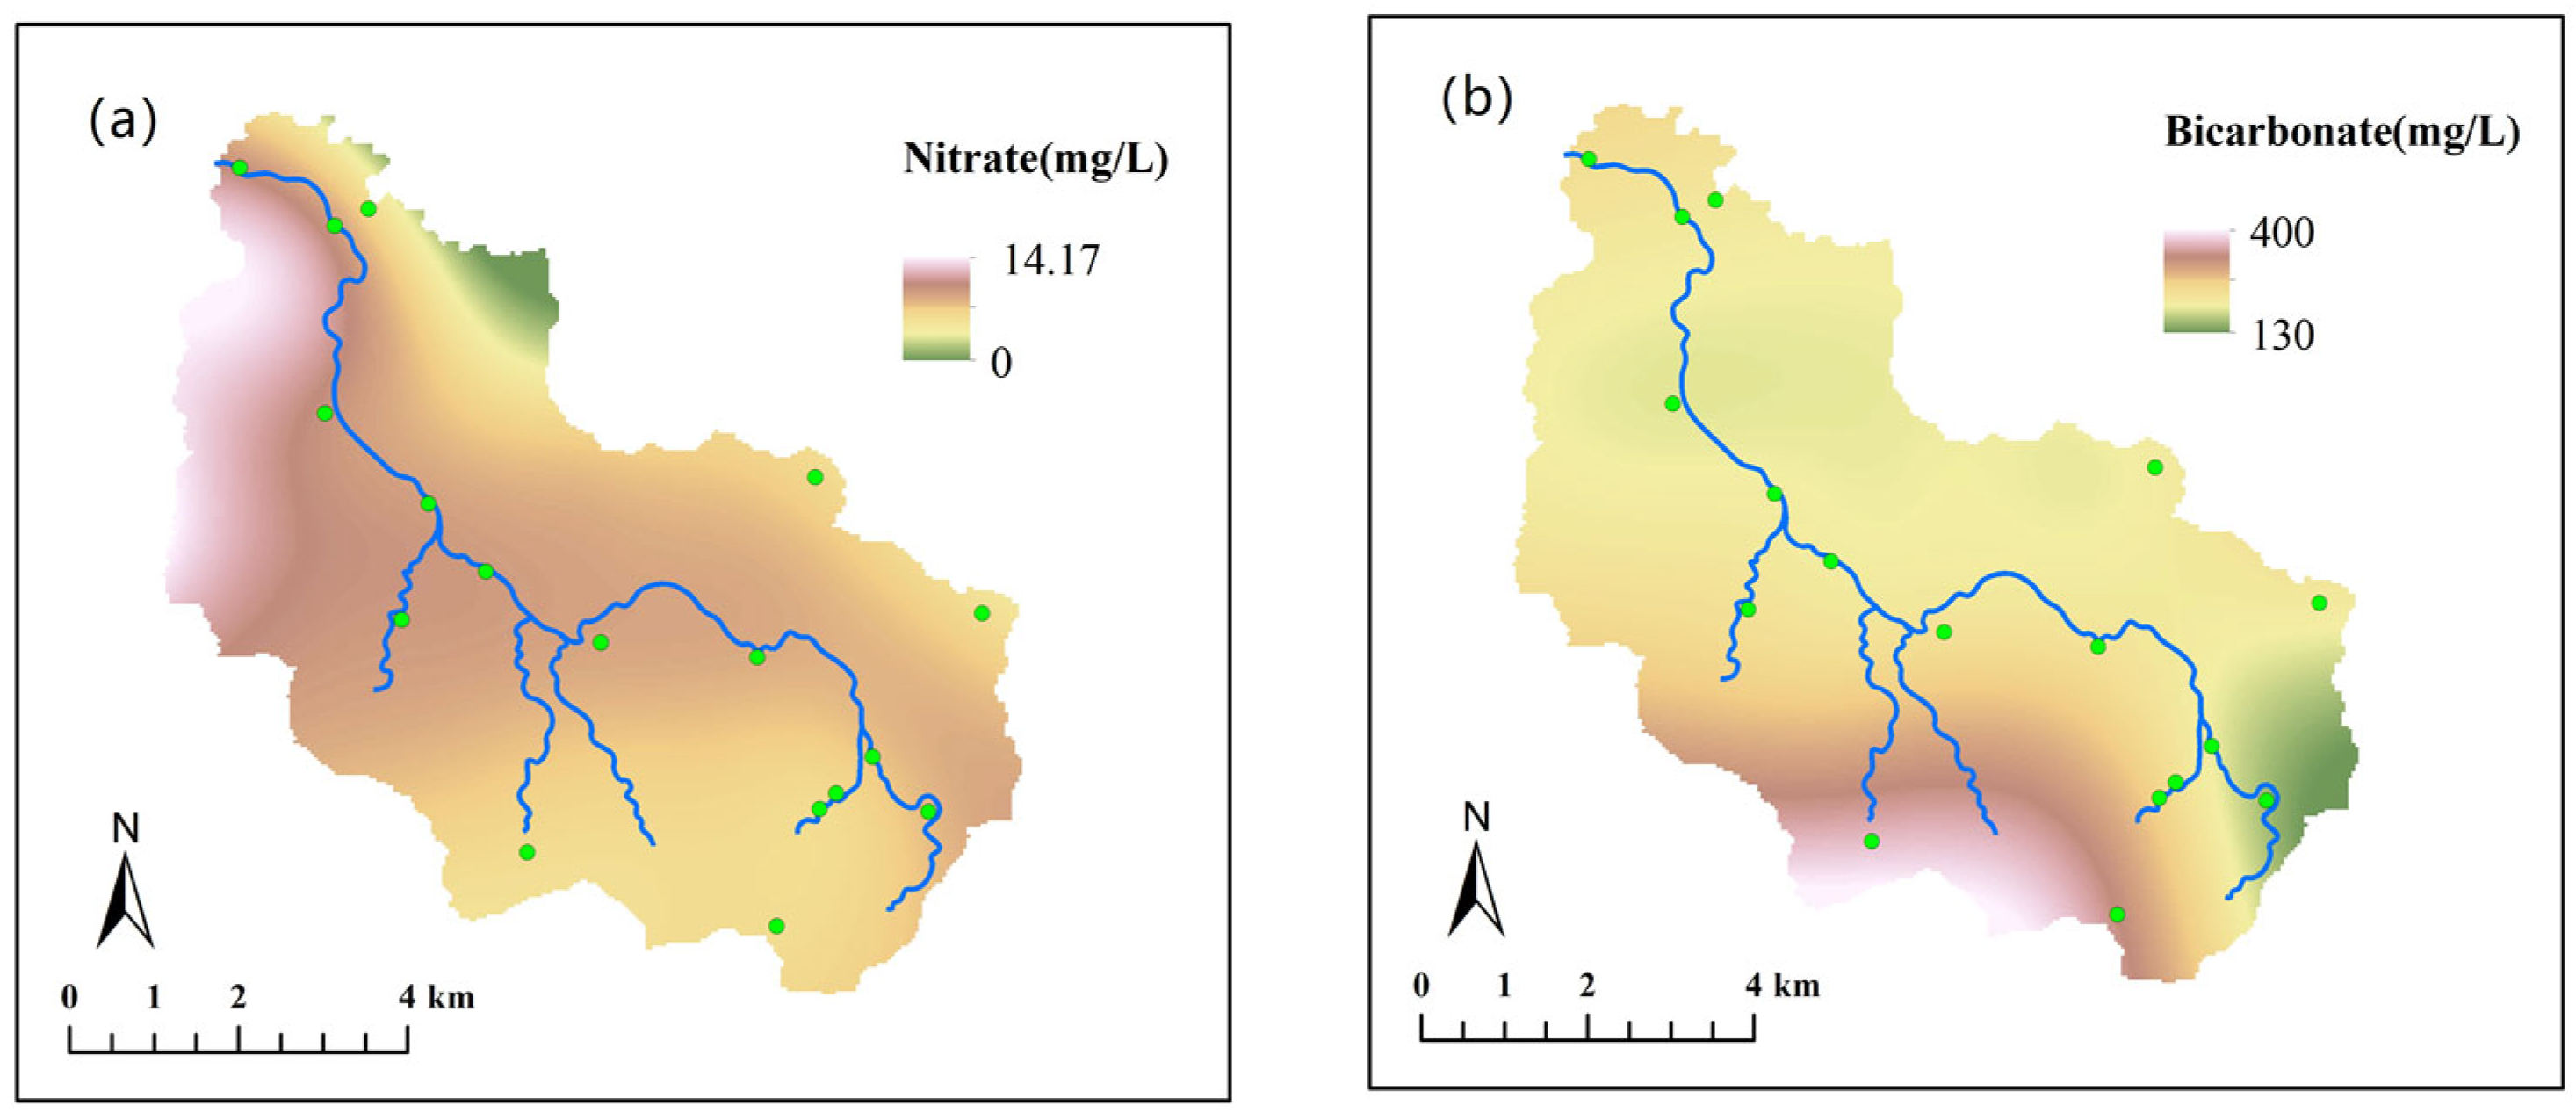
3.4. Assessment of Nitrate and DIC Concentration Levels in the Study Area

Alterations to the water cycle within a watershed can affect not only surface and groundwater DOC concentrations but also the stability of the nitrogen cycle and the dissolved inorganic carbon (DIC) cycle. Comparison of the DOC simulation results with the measured data of nitrate and bicarbonate can reflect the magnitude of DOC correlation with them to a certain extent. Nitrification is an important process in the nitrogen cycle. On the one hand, the nitrate produced increases the degree of eutrophication of water bodies; on the other hand, nitrate is very easily converted into nitrosamines, which pollute groundwater. The concentration distribution of nitrate in groundwater is closely associated with artificial recharge, according to spline function interpolation of measured groundwater nitrate concentration data from different places. As shown in Figure 8a, in the upstream area, groundwater nitrate concentration decreases with increasing distance from the river, which is consistent with the trend of DOC concentration in groundwater. Organic carbon is an important component of the nitrogen cycle, which has a direct or indirect effect on processes such as nitrogen conversion and energy sources. Nitrification showed a strong positive correlation with DOC concentration [67]. The probable reason is that the abundance of DOC in groundwater enhances the biological activity of ammonia-oxidizing microorganisms and provides them with additional energy and carbon sources [68]. Furthermore, there is a significant concentration of nitrate in the groundwater in the downstream area. The type of land use in this area is cropland, and as a result of human activity, a significant amount of chemical fertilizers seep into the groundwater through leaching and are nitrified into nitrate, contaminating the groundwater. In summary, exogenous DOC inputs resulted in elevated groundwater nitrate concentrations in the basin.
In aquatic ecosystems, DOC and dissolved inorganic carbon (DIC) are the two main forms of carbon present. DOC in groundwater can be converted to DIC either by microbial uptake or by abiotic degradation [69], and the main form of DIC present in groundwater is bicarbonate. The sinking of exogenous DOC increases groundwater DOC concentrations in the basin, which enhances microbial activity and promotes the accumulation of CO2 in the subsurface environment. However, the results of interpolating groundwater bicarbonate concentrations in the watershed indicate that changes in groundwater DOC concentrations have little effect on DIC. As can be seen in Figure 8b, the highest DIC concentration in groundwater is located in the upstream forested area, where carbonate deposits in the soil release carbonate ions under the influence of leaching and are present as bicarbonate ions in the groundwater. In contrast, groundwater DIC concentrations in the upper Yufu River and in the vicinity of the river showed lower levels, and lateral seepage of river water with low DIC concentrations reduced groundwater DIC concentrations in the basin to some extent.
Artificial recharge not only affects the DOC cycle but may indirectly affect the nitrogen and DIC cycles. Therefore, when managing aquifer recharge, it is important to consider all aspects of the impact of exogenous water on the chemical stability of groundwater in the basin.

4. Conclusions

In the Yufu River watershed, artificial recharge projects have been implemented recently to address the ongoing reduction in groundwater levels. The concentration of DOC in groundwater in the Yufu River basin has grown, which could be dangerous for groundwater in the Jinan Spring area because recharge water and groundwater have different chemical compositions.
This study proposes a physically based, three-dimensional reactive transport model that simulates the transport of DOC in the coupled river-aquifer system and applies this model to investigate the impact of multi-source recharge on DOC in the groundwater of the Yufu River Basin. With modifications to the response module code and model calibration, the SWAT-MODFLOW-RT3D model enables the simulation of the hydrological transport and spatial-temporal distribution of DOC concentration in both surface water and groundwater at different locations within the basin. It considers various water resource inputs, including river flow and precipitation, and provides valuable insights into how these factors influence the movement of DOC.
Model output was compared with measured groundwater level and evaporation in a 63.25 km2 heavy seepage zone in the Yufu River basin, Jinan, over the 2018 to 2020 time frame. The validated model was utilized to assess how different recharge scenarios will affect groundwater DOC concentrations in the future. The findings of this study are as follows:
(1) The rate of advection-diffusion and biodegradation exceeds the efficiency of leaching in recharging DOC to groundwater. Infiltration from rivers, rather than leaching, is the main source of DOC recharge in groundwater.
(2) Artificial recharge alters DOC concentrations in rivers and nearby groundwater. As the recharge period increases, the influence area of river infiltration on groundwater will also expand. Different regions within the basin exhibit varying trends in the growth of DOC concentration in groundwater. In the upstream area, DOC concentration shows a logarithmic increase; in the downstream area, DOC concentration exhibits an exponential increase; while in areas far from the river, DOC concentration remains relatively stable.
(3) The DOC concentrations in groundwater in the Yufu River basin show a wide range of increases in all three recharge scenarios: Yellow River water, Yangtze River water, and multiple water resources. The peak DOC content in the basin’s groundwater is predicted to occur in 2030 at 6.20, 6.51 and 6.59 mg/L, respectively. Variations in recharge water sources lead to differences in simulation results.
The most sensible of the three solutions is to recharge the Yufu River only with water from the Yellow River. The recharge of the Yellow River water to groundwater is 3.20 million m3/a, while the DOC input per unit volume of groundwater is only 0.013 kg/m3.
(4) The change in groundwater DOC concentration may indirectly affect the nitrogen cycle and DIC cycle in the basin.
Based on the above conclusions, this study suggests that during water resource management, regular monitoring of DOC concentration should be conducted, and models should be established to assess future trends. Additionally, measures can be taken to lower the DOC content in the recharge water source throughout the ensuing backfilling operation, which is crucial in preventing a rise in the DOC concentration in groundwater and stabilizing the nitrogen and DIC cycles.

Supplementary Materials

The following supporting information can be downloaded at: https://www.mdpi.com/article/10.3390/su16156692/s1, Figure S1: Artificial recharge volume of Wohushan Reservoir during the simulation period; Figure S2: Correlation analysis between measured and simulated values of evaporation; Figure S3: Initial groundwater flow field in the study area; Figure S4: Generalization of aquifer boundary conditions; Figure S5: The simulated flow field in January 2020; Figure S6: Correlation analysis between measured values and simulated values of groundwater level; Figure S7: Schematic diagram of the conceptual model of the study area; Table S1: List of Soil Parameters Required for SWAT Model; Table S2: SCS Soil Hydrology Grouping; Table S3: Water recharge and DOC input under multiple scenarios; Table S4: Results of sensitivity analysis.

Author Contributions

X.H.: data curation, formal analysis, investigation, methodology, software, validation, visualization, writing—original draft. X.C.: methodology, project administration, resources, investigation. K.X.: resources, investigation. W.Z. (Wenqing Zhang): funding acquisition, visualization, validation. Z.W.: data curation, investigation, methodology, software, visualization, validation. D.L.: resources, investigation. S.L.: investigation, validation. W.Z. (Wenjing Zhang): conceptualization, data curation, funding acquisition, methodology, project administration, resources, supervision, validation, writing—review and editing. All authors have read and agreed to the published version of the manuscript.

Funding

This study was supported by the National Key Research and Development Program of China [project number: 2023YFC3706002] and the Jilin Provincial Natural Science Foundation [grant number 20210101096JC].

Institutional Review Board Statement

Not applicable.

Informed Consent Statement

Informed consent was acquired from each participant before this survey.

Data Availability Statement

Data are contained within the article and Supplementary Materials.

Conflicts of Interest

The authors declare no conflicts of interest.

References

  1. Shen, D. Water Resources Allocation and Regulation. In Water Resources Management of the People’s Republic of China: Framework, Reform and Implementation; Global Issues in Water Policy; Springer International Publishing: Cham, Switzerland, 2021; pp. 113–127. ISBN 978-3-030-61931-2. [Google Scholar]
  2. Shumilova, O.; Tockner, K.; Thieme, M.; Koska, A.; Zarfl, C. Global Water Transfer Megaprojects: A Potential Solution for the Water-Food-Energy Nexus? Front. Environ. Sci. 2018, 6, 150. [Google Scholar] [CrossRef]
  3. Grigg, N.S. Large-Scale Water Development in the United States: TVA and the California State Water Project. Int. J. Water Resour. Dev. 2023, 39, 70–88. [Google Scholar] [CrossRef]
  4. Wilson, M.C.; Li, X.-Y.; Ma, Y.-J.; Smith, A.T.; Wu, J. A Review of the Economic, Social, and Environmental Impacts of China’s South–North Water Transfer Project: A Sustainability Perspective. Sustainability 2017, 9, 1489. [Google Scholar] [CrossRef]
  5. Sprenger, C.; Hartog, N.; Hernández, M.; Vilanova, E.; Grützmacher, G.; Scheibler, F.; Hannappel, S. Inventory of Managed Aquifer Recharge Sites in Europe: Historical Development, Current Situation and Perspectives. Hydrogeol. J. 2017, 25, 1909–1922. [Google Scholar] [CrossRef]
  6. Demir, C.; Fanta, D.; Akıntuğ, B.; Ünlü, K. Modeling Coastal Güzelyurt (Morphou) Aquifer in Northern Cyprus for Mitigation of Groundwater Depletion through Managed Aquifer Recharge. Sustain. Water Resour. Manag. 2022, 8, 96. [Google Scholar] [CrossRef]
  7. Dillon, P.; Stuyfzand, P.; Grischek, T.; Lluria, M.; Pyne, R.D.G.; Jain, R.C.; Bear, J.; Schwarz, J.; Wang, W.; Fernandez, E.; et al. Sixty Years of Global Progress in Managed Aquifer Recharge. Hydrogeol. J. 2019, 27, 1–30. [Google Scholar] [CrossRef]
  8. Zhang, Z. A Thesis Submitted to the University of Jinan in Partial Fulfillment of the Requirements for the Degree of Master of Engineering. Master’s Thesis, University of Jinan, Jinan, China, 2019. [Google Scholar]
  9. Ding, G.; Li, C.; Wei, S.; Wang, S.; Li, Y.; Lu, Q.; Sun, B.; Liu, H. Study on the influence of external recharge of Yufu river on karst groundwater. Carsologica Sin. 2023, 42, 907–916. [Google Scholar] [CrossRef]
  10. Yanxin, W.; Yao, D.; Yamin, D.; Yiqun, G.; Peifang, W.; Teng, M.; Jianbo, S.; Xianjun, X. Lacustrine Groundwater Discharge and Lake Water Quality Evolution. Bull. Geol. Sci. Technol. 2022, 41, 1–10. [Google Scholar] [CrossRef]
  11. McDonough, L.K.; Santos, I.R.; Andersen, M.S.; O’Carroll, D.M.; Rutlidge, H.; Meredith, K.; Oudone, P.; Bridgeman, J.; Gooddy, D.C.; Sorensen, J.P.R.; et al. Changes in Global Groundwater Organic Carbon Driven by Climate Change and Urbanization. Nat. Commun. 2020, 11, 1279. [Google Scholar] [CrossRef]
  12. Brailsford, F.L.; Glanville, H.C.; Golyshin, P.N.; Johnes, P.J.; Yates, C.A.; Jones, D.L. Microbial Uptake Kinetics of Dissolved Organic Carbon (DOC) Compound Groups from River Water and Sediments. Sci. Rep. 2019, 9, 11229. [Google Scholar] [CrossRef]
  13. Regan, S.; Hynds, P.; Flynn, R. An Overview of Dissolved Organic Carbon in Groundwater and Implications for Drinking Water Safety. Hydrogeol. J. 2017, 25, 959–967. [Google Scholar] [CrossRef]
  14. Bailey, R.T.; Wible, T.C.; Arabi, M.; Records, R.M.; Ditty, J. Assessing Regional-Scale Spatio-Temporal Patterns of Groundwater–Surface Water Interactions Using a Coupled SWAT-MODFLOW Model. Hydrol. Process. 2016, 30, 4420–4433. [Google Scholar] [CrossRef]
  15. Bao, C.; Li, L.; Shi, Y.; Duffy, C. Understanding Watershed Hydrogeochemistry: 1. Development of RT-Flux-PIHM. Water Resour. Res. 2017, 53, 2328–2345. [Google Scholar] [CrossRef]
  16. Arora, B.; Spycher, N.F.; Steefel, C.I.; Molins, S.; Bill, M.; Conrad, M.E.; Dong, W.; Faybishenko, B.; Tokunaga, T.K.; Wan, J.; et al. Influence of Hydrological, Biogeochemical and Temperature Transients on Subsurface Carbon Fluxes in a Flood Plain Environment. Biogeochemistry 2016, 127, 367–396. [Google Scholar] [CrossRef]
  17. Guo, Z.; Chen, K.; Yi, S.; Zheng, C. Response of Groundwater Quality to River-Aquifer Interactions during Managed Aquifer Recharge: A Reactive Transport Modeling Analysis. J. Hydrol. 2023, 616, 128847. [Google Scholar] [CrossRef]
  18. Park, S.; Nielsen, A.; Bailey, R.T.; Trolle, D.; Bieger, K. A QGIS-Based Graphical User Interface for Application and Evaluation of SWAT-MODFLOW Models. Environ. Model. Softw. 2019, 111, 493–497. [Google Scholar] [CrossRef]
  19. Wei, X.; Bailey, R.T.; Records, R.M.; Wible, T.C.; Arabi, M. Comprehensive Simulation of Nitrate Transport in Coupled Surface-Subsurface Hydrologic Systems Using the Linked SWAT-MODFLOW-RT3D Model. Environ. Model. Softw. 2019, 122, 104242. [Google Scholar] [CrossRef]
  20. Jafari, T.; Kiem, A.S.; Javadi, S.; Nakamura, T.; Nishida, K. Fully Integrated Numerical Simulation of Surface Water-Groundwater Interactions Using SWAT-MODFLOW with an Improved Calibration Tool. J. Hydrol. Reg. Stud. 2021, 35, 100822. [Google Scholar] [CrossRef]
  21. Wei, X.; Bailey, R.T. Evaluating Nitrate and Phosphorus Remediation in Intensively Irrigated Stream-Aquifer Systems Using a Coupled Flow and Reactive Transport Model. J. Hydrol. 2021, 598, 126304. [Google Scholar] [CrossRef]
  22. Fu, D.; Jin, X.; Jin, Y.X.; Mao, X.F.; Zhai, J.Y. Modelling of the Surface-Ground Water Exchange Yield in Zelinggou Basin, Middle Reaches of the Bayin River Based on SWAT-MODFLOW Coupled Model. Sci. Geogr. Sin. 2022, 42, 1124. [Google Scholar] [CrossRef]
  23. Chen, X.; Guan, Q.; Li, F.; Liu, D.; Han, C.; Zhang, W. Study on the Ecological Control Line in the Major Leakage Area of Baotu Spring in Shandong Province, Eastern China. Ecol. Indic. 2021, 133, 108467. [Google Scholar] [CrossRef]
  24. Beck, H.E.; Zimmermann, N.E.; McVicar, T.R.; Vergopolan, N.; Berg, A.; Wood, E.F. Present and Future Köppen-Geiger Climate Classification Maps at 1-Km Resolution. Sci. Data 2018, 5, 180214. [Google Scholar] [CrossRef] [PubMed]
  25. Li, J. Study on Model of Managed Aquifer Recharge through Yufu Channel Infiltration Experiment in Jinan. Master’s Thesis, University of Jinan, Jinan, China, 2017. [Google Scholar]
  26. Zheng, Q. Study on Migration and Transformation of Atrazine Inporous Media during the Groundwater Recharge by theYellow River Water in the Yufuhe River. Master’s Thesis, University of Jinan, Jinan, China, 2020. [Google Scholar]
  27. Zhao, J.; Zhang, N.; Liu, Z.; Zhang, Q.; Shang, C. SWAT Model Applications: From Hydrological Processes to Ecosystem Services. Sci. Total Environ. 2024, 931, 172605. [Google Scholar] [CrossRef]
  28. Molina-Navarro, E.; Bailey, R.T.; Andersen, H.E.; Thodsen, H.; Nielsen, A.; Park, S.; Jensen, J.S.; Jensen, J.B.; Trolle, D. Comparison of Abstraction Scenarios Simulated by SWAT and SWAT-MODFLOW. Hydrol. Sci. J. 2019, 64, 434–454. [Google Scholar] [CrossRef]
  29. Melaku, N.D.; Wang, J. A Modified SWAT Module for Estimating Groundwater Table at Lethbridge and Barons, Alberta, Canada. J. Hydrol. 2019, 575, 420–431. [Google Scholar] [CrossRef]
  30. Choi, Y.; Jung, Y.; Kim, J.; Kim, K.-T. Soil Related Parameters Assessment Comparing Runoff Analysis Using Harmonized World Soil Database (HWSD) and Detailed Soil Map. J. Korean Soc. Agric. Eng. 2016, 58, 57–66. [Google Scholar] [CrossRef]
  31. USDA. National Engineering Handbook Hydrology Chapters. 1997. Available online: https://hydrocad.net/neh/630contents.htm (accessed on 31 July 2024).
  32. Wang, H.; Stephenson, S.R.; Qu, S. Modeling Spatially Non-Stationary Land Use/Cover Change in the Lower Connecticut River Basin by Combining Geographically Weighted Logistic Regression and the CA-Markov Model. Int. J. Geogr. Inf. Sci. 2019, 33, 1313–1334. [Google Scholar] [CrossRef]
  33. Saha, S.; Moorthi, S.; Pan, H.-L.; Wu, X.; Wang, J.; Nadiga, S.; Tripp, P.; Kistler, R.; Woollen, J.; Behringer, D.; et al. The NCEP Climate Forecast System Reanalysis. Bull. Am. Meteorol. Soc. 2010, 91, 1015–1058. [Google Scholar] [CrossRef]
  34. Feng, B.; Liang, X.; Zeng, Z. Optimizing Land Usage in Southern Mountain Areas of Jinan Based on the SWAT Model. J. Irrig. Drain. 2018, 37, 121–128. [Google Scholar] [CrossRef]
  35. Wu, H.; Zhu, W.; Huang, B. Seasonal Variation of Evapotranspiration, Priestley-Taylor Coefficient and Crop Coefficient in Diverse Landscapes. Geogr. Sustain. 2021, 2, 224–233. [Google Scholar] [CrossRef]
  36. Samadi, S.Z. Assessing the Sensitivity of SWAT Physical Parameters to Potential Evapotranspiration Estimation Methods over a Coastal Plain Watershed in the Southeastern United States. Hydrol. Res. 2016, 48, 395–415. [Google Scholar] [CrossRef]
  37. Fioreze, M.; Mancuso, M.A. MODFLOW and MODPATH for Hydrodynamic Simulation of Porous Media in Horizontal Subsurface Flow Constructed Wetlands: A Tool for Design Criteria. Ecol. Eng. 2019, 130, 45–52. [Google Scholar] [CrossRef]
  38. Schuol, J.; Abbaspour, K.C.; Srinivasan, R.; Yang, H. Estimation of Freshwater Availability in the West African Sub-Continent Using the SWAT Hydrologic Model. J. Hydrol. 2008, 352, 30–49. [Google Scholar] [CrossRef]
  39. Niswonger, R.G.; Panday, S.; Ibaraki, M. MODFLOW-NWT, a Newton Formulation for MODFLOW-2005; U.S. Geological Survey: Reston, VA, USA, 2011. [Google Scholar]
  40. Sathe, S.S.; Mahanta, C. Groundwater Flow and Arsenic Contamination Transport Modeling for a Multi Aquifer Terrain: Assessment and Mitigation Strategies. J. Environ. Manag. 2019, 231, 166–181. [Google Scholar] [CrossRef]
  41. Aloui, S.; Mazzoni, A.; Elomri, A.; Aouissi, J.; Boufekane, A.; Zghibi, A. A Review of Soil and Water Assessment Tool (SWAT) Studies of Mediterranean Catchments: Applications, Feasibility, and Future Directions. J. Environ. Manag. 2023, 326, 116799. [Google Scholar] [CrossRef]
  42. Gao, F.; Feng, G.; Han, M.; Dash, P.; Jenkins, J.; Liu, C. Assessment of Surface Water Resources in the Big Sunflower River Watershed Using Coupled SWAT–MODFLOW Model. Water 2019, 11, 528. [Google Scholar] [CrossRef]
  43. Wei, X.; Bailey, R.T. Assessment of System Responses in Intensively Irrigated Stream–Aquifer Systems Using SWAT-MODFLOW. Water 2019, 11, 1576. [Google Scholar] [CrossRef]
  44. Liu, W.; Park, S.; Bailey, R.T.; Molina-Navarro, E.; Andersen, H.E.; Thodsen, H.; Nielsen, A.; Jeppesen, E.; Jensen, J.S.; Jensen, J.B.; et al. Quantifying the Streamflow Response to Groundwater Abstractions for Irrigation or Drinking Water at Catchment Scale Using SWAT and SWAT–MODFLOW. Environ. Sci. Eur. 2020, 32, 113. [Google Scholar] [CrossRef]
  45. Clement, T.P.; Sun, Y.; Hooker, B.S.; Petersen, J.N. Modeling Multispecies Reactive Transport in Ground Water. Groundw. Monit. Remediat. 1998, 18, 79–92. [Google Scholar] [CrossRef]
  46. Wang, Z. Simulation Study on the Influence of Multiple Waterresources Regulation on Organic Carbon in Groundwater of YufuRiver Basin. Master’s Thesis, Jilin University, Jilin, China, 2023. [Google Scholar]
  47. Zarnetske, J.P.; Haggerty, R.; Wondzell, S.M.; Bokil, V.A.; González-Pinzón, R. Coupled Transport and Reaction Kinetics Control the Nitrate Source-Sink Function of Hyporheic Zones. Water Resour. Res. 2012, 48, W11508. [Google Scholar] [CrossRef]
  48. Shuai, P.; Cardenas, M.B.; Knappett, P.S.K.; Bennett, P.C.; Neilson, B.T. Denitrification in the Banks of Fluctuating Rivers: The Effects of River Stage Amplitude, Sediment Hydraulic Conductivity and Dispersivity, and Ambient Groundwater Flow. Water Resour. Res. 2017, 53, 7951–7967. [Google Scholar] [CrossRef]
  49. Gu, C.; Anderson, W.; Maggi, F. Riparian Biogeochemical Hot Moments Induced by Stream Fluctuations. Water Resour. Res. 2012, 48, W09546. [Google Scholar] [CrossRef]
  50. Li, C.; Jia, T.; Gang, S.; Chen, H.; Liu, C. Research on the division of protection areas of key recharge areas of groundwater source area—Take the Yufu river basin for example. Ground Water 2021, 43, 33–36. [Google Scholar] [CrossRef]
  51. Guan, Q.; Wang, Y.; Chen, X.; Zeng, G.; Xin, G. Recharge Characteristics and Protection of Karst Groundwater in Major Leakage Area of Yufu River in Jinan. Carsologica Sin. 2023, 42, 233–244. [Google Scholar] [CrossRef]
  52. Ceriotti, G.; Guadagnini, L.; Porta, G.; Guadagnini, A. Local and Global Sensitivity Analysis of Cr (VI) Geogenic Leakage Under Uncertain Environmental Conditions. Water Resour. Res. 2018, 54, 5785–5802. [Google Scholar] [CrossRef]
  53. Sethi, R.; Di Molfetta, A. The Groundwater Flow Equation. In Groundwater Engineering: A Technical Approach to Hydrogeology, Contaminant Transport and Groundwater Remediation; Springer Tracts in Civil Engineering; Springer International Publishing: Cham, Switzerland, 2019; pp. 27–32. ISBN 978-3-030-20516-4. [Google Scholar]
  54. Morbidelli, R.; Saltalippi, C.; Flammini, A.; Govindaraju, R.S. Role of Slope on Infiltration: A Review. J. Hydrol. 2018, 557, 878–886. [Google Scholar] [CrossRef]
  55. Delgado, M.I.; Carol, E.; Casco, M.A. Land-Use Changes in the Periurban Interface: Hydrologic Consequences on a Flatland-Watershed Scale. Sci. Total Environ. 2020, 722, 137836. [Google Scholar] [CrossRef]
  56. Liu, H.-H.; Birkholzer, J. On the Relationship between Water Flux and Hydraulic Gradient for Unsaturated and Saturated Clay. J. Hydrol. 2012, 475, 242–247. [Google Scholar] [CrossRef]
  57. Welch, C.; Harrington, G.A.; Cook, P.G. Influence of Groundwater Hydraulic Gradient on Bank Storage Metrics. Groundwater 2015, 53, 782–793. [Google Scholar] [CrossRef]
  58. Li, X.; Ye, X.; Yuan, C.; Xu, C. Can Water Release from Local Reservoirs Cope with the Droughts of Downstream Lake in a Large River-Lake System? J. Hydrol. 2023, 625, 130172. [Google Scholar] [CrossRef]
  59. Binet, S.; Joigneaux, E.; Pauwels, H.; Albéric, P.; Fléhoc, C.; Bruand, A. Water Exchange, Mixing and Transient Storage between a Saturated Karstic Conduit and the Surrounding Aquifer: Groundwater Flow Modeling and Inputs from Stable Water Isotopes. J. Hydrol. 2017, 544, 278–289. [Google Scholar] [CrossRef]
  60. Francis, B.A.; Francis, L.K.; Cardenas, M.B. Water Table Dynamics and Groundwater–Surface Water Interaction during Filling and Draining of a Large Fluvial Island Due to Dam-Induced River Stage Fluctuations. Water Resour. Res. 2010, 46, W07513. [Google Scholar] [CrossRef]
  61. Yang, Y.; Zhang, M.; Zhu, L.; Liu, W.; Han, J.; Yang, Y. Influence of Large Reservoir Operation on Water-Levels and Flows in Reaches below Dam: Case Study of the Three Gorges Reservoir. Sci. Rep. 2017, 7, 15640. [Google Scholar] [CrossRef] [PubMed]
  62. He, K.; Shi, H.; Chen, C.; Cheng, Y.; Liu, J. The Study on the Time Lag of Water Level in the Three Gorges Reservoir under the Regulation Processes. Hydrol. Res. 2021, 52, 734–748. [Google Scholar] [CrossRef]
  63. Dudley-Southern, M.; Binley, A. Temporal Responses of Groundwater-Surface Water Exchange to Successive Storm Events. Water Resour. Res. 2015, 51, 1112–1126. [Google Scholar] [CrossRef]
  64. Hou, J.; Zhang, Y.; Tong, Y.; Guo, K.; Qi, W.; Hinkelmann, R. Experimental Study for Effects of Terrain Features and Rainfall Intensity on Infiltration Rate of Modelled Permeable Pavement. J. Environ. Manag. 2019, 243, 177–186. [Google Scholar] [CrossRef]
  65. Zheng, Q.; Qu, S.; Li, J.; Wang, W.; Zhang, Z. The Overlying Influence of Underground Structure and Impermeable Surface of the Ground on Groundwater Recharge in Residential Area Construction. In Proceedings of the 2017 6th International Conference on Energy, Environment and Sustainable Development (ICEESD 2017), Zhuhai, China, 11–12 March 2017; Jiangsu Univ Sci & Technol: Zhenjiang, China; Shanghai Univ Elect Power: Shanghai, China, 2017; Volume 129, pp. 248–252. [Google Scholar]
  66. Li, W.; Sun, Q.; Wang, W.; Qu, S.; Zhang, Z.; Xu, Q. Effective Water Quantity of Multi-Source Water Recharging Aquifers in Yufuhe River Based on Groundwater and Surface Water Semi-Coupled Modelling. Water Supply 2019, 19, 2280–2287. [Google Scholar] [CrossRef]
  67. Guo, A.; Duan, G.; Zhao, Z.; Tang, Z.; Wang, Y.; Wang, B. Effects of CaCO3 Application on Soil Microbial Nitrogen Cycle in an Acid Soil. Environ. Sci. 2017, 38, 3483–3488. [Google Scholar] [CrossRef]
  68. Rumeau, M.; Sgouridis, F.; MacKenzie, R.; Carrillo, Y.; Reay, M.K.; Hartley, I.P.; Ullah, S. The Role of Rhizosphere in Enhancing N Availability in a Mature Temperate Forest under Elevated CO2. Soil Biol. Biochem. 2024, 197, 109537. [Google Scholar] [CrossRef]
  69. Cooper, K.J.; Whitaker, F.F.; Anesio, A.M.; Naish, M.; Reynolds, D.M.; Evans, E.L. Dissolved Organic Carbon Transformations and Microbial Community Response to Variations in Recharge Waters in a Shallow Carbonate Aquifer. Biogeochemistry 2016, 129, 215–234. [Google Scholar] [CrossRef]
Figure 1. Location of the Yufu River basin and its delineation in SWAT, including subbasin division, digital elevation model (DEM), river network, and artificial recharge points.
Sustainability 16 06692 g001
Figure 2. Hydrogeologic profile of the strong seepage zone of the Yufu River [26].
Sustainability 16 06692 g002
Figure 3. Geographical inputs for HRU definition in SWAT: (a) soil types (b) land use and (c) slope classes.
Sustainability 16 06692 g003
Figure 4. Data transfer process for coupled model.
Sustainability 16 06692 g004
Figure 5. Differences in average daily groundwater recharge (a) and DOC concentrations (b) due to leeching in the basin.
Sustainability 16 06692 g005
Figure 6. Changes in groundwater DOC concentrations (a) and water levels (b) at different locations in the basin during artificial recharge (the observation point is close to the river if the lines are solid, and it is distant from the river if the lines are dashed). (c) Distribution of groundwater DOC concentration in the basin at the end of artificial recharge period.
Sustainability 16 06692 g006
Figure 7. Distribution of DOC concentration in groundwater in 2030 under different water recharge scenarios: (a) recharged by Yellow River water; (b) recharged by Yangtze River water; and (c) recharged by Yangtze River and Yellow River water.
Sustainability 16 06692 g007
Figure 8. Distribution of nitrate (a) and bicarbonate (b) concentration in groundwater.
Sustainability 16 06692 g008
Table 1. The values of SWAT model parameters in the Yufu River basin [34].
ParameterParameter DescriptionParameter Values
CN2SCS Runoff Curve Number56.47
SOL_AWCSoil water-holding capacity0.48
ESCOSoil evaporation compensation factor0.97
SPCONLinear exponent affecting the sediment carrying capacity 0.03657
USLE_PSupport practice factor 0.64
Disclaimer/Publisher’s Note: The statements, opinions and data contained in all publications are solely those of the individual author(s) and contributor(s) and not of MDPI and/or the editor(s). MDPI and/or the editor(s) disclaim responsibility for any injury to people or property resulting from any ideas, methods, instructions or products referred to in the content.

