Assessing Sustainable Development in Community Welfare and Economic Resilience to Extreme Weather in Indonesia

 , , and
Abstract
1. Introduction
2. Materials and Methods
2.1. Data Source and Variables
2.2. Negative Binomial Regression
2.3. Self-Organizing Maps (SOMs) Clustering
3. Results
3.1. Negative Binomial Regression Analysis
3.2. Self-Organizing Maps (SOMs) Clustering Analysis
4. Discussion
5. Conclusions
Author Contributions
Funding
Institutional Review Board Statement
Informed Consent Statement
Data Availability Statement
Conflicts of Interest
References
- Warsito, G.M.; Budiharsana, M.; Burns, S. Identifying the Weak Foundation of Public Health Resilience ForNational Disaster Policy in Indonesia’s Mid-Term DevelopmentAgenda 2015–2019: A Policy Content Analysis. Kesmas Natl. Public Health J. 2020, 15, 54–58. [Google Scholar] [CrossRef]
- Kalfin; Sukono; Supian, S.; Mamat, M. Model for Determining Insurance Premiums Taking into Account the Rate of Economic Growth and Cross-Subsidies in Providing Natural Disaster Management Funds in Indonesia. Sustainability 2023, 15, 16655. [Google Scholar] [CrossRef]
- Wibowo, A. UPDATE: Rekapitulasi Data Bencana Di Indonesia per 21 Januari 2020; Badan Nasional Penanggulangan Bencana (BNPB): East Jakarta, Indonesia, 2020. [Google Scholar]
- Haryanto, B.; Lestari, F.; Nurlambang, T. Extreme Events, Disasters, and Health Impacts in Indonesia. In Extreme Weather Events and Human Health; Springer International Publishing: Cham, Switzerland, 2020; pp. 227–245. [Google Scholar]
- Badan Nasional Penanggulangan Bencana (BNPB) Data Informasi Bencana Indonesia (DIBI). Available online: https://dibi.bnpb.go.id/ (accessed on 5 April 2024).
- BBC Indonesia: Volcano Nation. BBC News, 5 November 2015. Available online: https://www.bbc.com/news/world-asia-26167897#:~:text=As%20Indonesia%20faces%20yet%20another,the%20holiday%20island%20of%20Bali (accessed on 2 April 2024).
- Caraka, R. Pemodelan tinggi pasang air laut di kota semarang dengan menggunakan maximal overlap discrete wavelet transform (MODWT). J. Meteorol. Klimatol. Dan Geofis. 2015, 2, 104–114. [Google Scholar]
- Gustati, G.D. El Nino, Climate Change and the Effect on Indonesia. Universitas Muhammadiyah Surakarta, 20 October 2023. Available online: https://www.ums.ac.id/en/news/global-pulse/el-nino-climate-change-and-the-effect-on-indonesia (accessed on 29 March 2024).
- Calliari, E.; Surminski, S.; Mysiak, J. The Politics of (and Behind) the UNFCCC’s Loss and Damage Mechanism. In Loss and Damage from Climate Change: Concepts, Methods and Policy Options; Mechler, R., Bouwer, L., Schinko, T., Surminski, S., Linnerooth-Bayer, J., Eds.; Springer International Publishing: Cham, Switzerland, 2019; pp. 155–178. ISBN 978-3-319-72026-5. [Google Scholar]
- Simangunsong, N.A.; Wardani, D.A.; Pramudya, A.R.; Arrahman, M.I.; Wulandari, S. Peran Pertumbuhan Ekonomi Dalam Menunjang Kesejahteraan Masyarakat. El-Mal J. Kaji. Ekon. Bisnis Islam 2023, 4, 1289–1298. [Google Scholar] [CrossRef]
- Lis, E.M.; Nickel, C. The Impact of Extreme Weather Events on Budget Balances. Int. Tax Public Financ. 2010, 17, 378–399. [Google Scholar] [CrossRef]
- Hasbiah; Hasanuddin, B.; Madris; Anwar, A.I. The Importance of Community Welfare in Economic Growth Through Government Spending. Int. J. Account. Financ. Asia Pac. 2023, 6, 50–66. [Google Scholar]
- Saraswati, A.W. Cuaca Ekstrem Indonesia Hasil Campur Tangan Ulah Manusia. Available online: https://greeneration.org/publication/green-info/cuaca-ekstrem-indonesia-hasil-campur-tangan-ulah-manusia/ (accessed on 19 March 2024).
- Fávero, L.P.; Souza, R.D.F.; Belfiore, P.; Corrêa, H.L.; Haddad, M.F.C. Count Data Regression Analysis: Concepts, Overdispersion Detection, Zero-Inflation Identification, and Applications with R. Pract. Assess. Res. Eval. 2021, 26, 13. [Google Scholar]
- Gardner, W.; Mulvey, E.P.; Shaw, E.C. Regression Analyses of Counts and Rates: Poisson, Overdispersed Poisson, and Negative Binomial Models. Psychol. Bull. 1995, 118, 392–404. [Google Scholar] [CrossRef] [PubMed]
- Famoye, F. Generalized Binomial Regression Model. Biom. J. 1995, 37, 581–594. [Google Scholar] [CrossRef]
- Ariani, P.M.; Widodo, E. Analisis Faktor Penyebab Penyakit DBD Di Jawa Tengah Menggunakan Regresi Binomial Negatif. J. Kesehat. Vokasional 2018, 3, 1. [Google Scholar] [CrossRef]
- Kalbe, L.; Recknagel, R.-D. Zur Statistischen Auswertung von Mikroskopischen Plankton- Und Partikelzählungen. Acta Hydrochim. Hydrobiol. 1987, 15, 471–480. [Google Scholar] [CrossRef]
- Pingit, S. Analisis Data Kategorik; Jurusan Statistika ITS: Surabaya, Indonesia, 2009. [Google Scholar]
- Usman, H.; Sobari, N. Aplikasi Teknik Multivariate Untuk Riset Pemasaran, 1st ed.; Rajawali Pers: Jakarta, Indonesia, 2013. [Google Scholar]
- Maria, F.; Efthimios, K.; Eleni, C.; Michael, S. Using Self Organising Maps in Applied Geomorphology. In Self Organizing Maps; Mwasiagi, J.I., Ed.; IntechOpen: Rijeka, Croatia, 2011. [Google Scholar]
- Prasetyo, E. Data Mining: Konsep Dan Aplikasi Menggunakan MATLAB, 1st ed.; CV Andi Offset: Yogyakarta, Indonesia, 2012. [Google Scholar]
- Kohonen, T. Self-Organizing Feature Maps. In Self-Organization and Associative Memory; Springer: Berlin, Germany, 1989; pp. 119–157. [Google Scholar]
- Fausett, L. Fundamentals of Neural Networks: Architectures, Algorithms And Applications; Prentice Hall: Upper Sadle River, NJ, USA, 1994. [Google Scholar]
- Hardiansyah, B. Pengenalan Ekspresi Wajah Menggunakan Jaringan Syaraf Tiruan Kohonen Self Organizing Map (K-SOM); Institut Teknologi Sepuluh Nopember: Surabaya, Indonesia, 2015. [Google Scholar]
- Fitriani, D.; Faisol, F.; Yulianto, T. Penerapan Metode Kohonen Som Dalam Pengenalan Karakter Seseorang Melalui Bentuk Bibir. Zeta Math J. 2017, 3, 52–58. [Google Scholar] [CrossRef]
- Siang, J.J. Jaringan Syaraf Tiruan Dan Pemrogramannya Menggunakan MATLAB, 2nd ed.; CV Andi Offset: Yogyakarta, Indonesia, 2009. [Google Scholar]
- Tasri, E.S.; Karimi, K.; Muslim, I. The Effect of Economic Variables on Natural Disasters and the Impact of Disasters on Economic Variables. Heliyon 2022, 8, e08678. [Google Scholar] [CrossRef] [PubMed]
- Freitas, C.R.; D’Avignon, A.L. de A.; Castro, A.C. Urban Social Vulnerability and Climate Change in Rio de Janeiro City Associated with Population Mobility. J. Environ. Policy Plan. 2019, 21, 797–810. [Google Scholar] [CrossRef]
- Pudyastuti, P.S.; Nugraha, N.A. Climate Change Risks to Infrastructures: A General Perspective. AIP Conf. Proc. 2018, 1977, 040030. [Google Scholar]
- Panwar, V.; Sen, S. Economic Impact of Natural Disasters: An Empirical Re-Examination. Margin J. Appl. Econ. Res. 2019, 13, 109–139. [Google Scholar] [CrossRef]
- Higgins, E.T. Self-Discrepancy: A Theory Relating Self and Affect. Psychol. Rev. 1987, 94, 319–340. [Google Scholar] [CrossRef] [PubMed]
- Hallegatte, S. The Indirect Cost of Natural Disasters and an Economic Definition of Macroeconomic Resilience; The World Bank: Washington, DC, USA, 2015. [Google Scholar]
- Hadian, S.D.; Khadijah, U.L.S.; Saepudin, E.; Budiono, A.; Yuliawati, A.K. Community Participation in Tsunami Early Warning System in Pangandaran Town. AIP Conf. Proc. 2017, 1857, 110005. [Google Scholar]

| Intercept | HDI | Ln_GDP | Likelihood Ratio Test Prob. (>Chisq) | Dispersion | |
|---|---|---|---|---|---|
| Estimate | 6.647 | −0.00275 | 1.090 × 10⁻⁶ | 0.0002145 | 0.8868 a |
| Standard error | 3.633 | 0.05164 | 2.863 × 10⁻⁷ | 1609.874 b | |
| Wald statistics (z) | 1.830 | −0.053 | 3.808 | ||
| Prob (>|z|) | 0.00067 | 0.00958 | 0.00014 |
| Cluster | Total | Province |
|---|---|---|
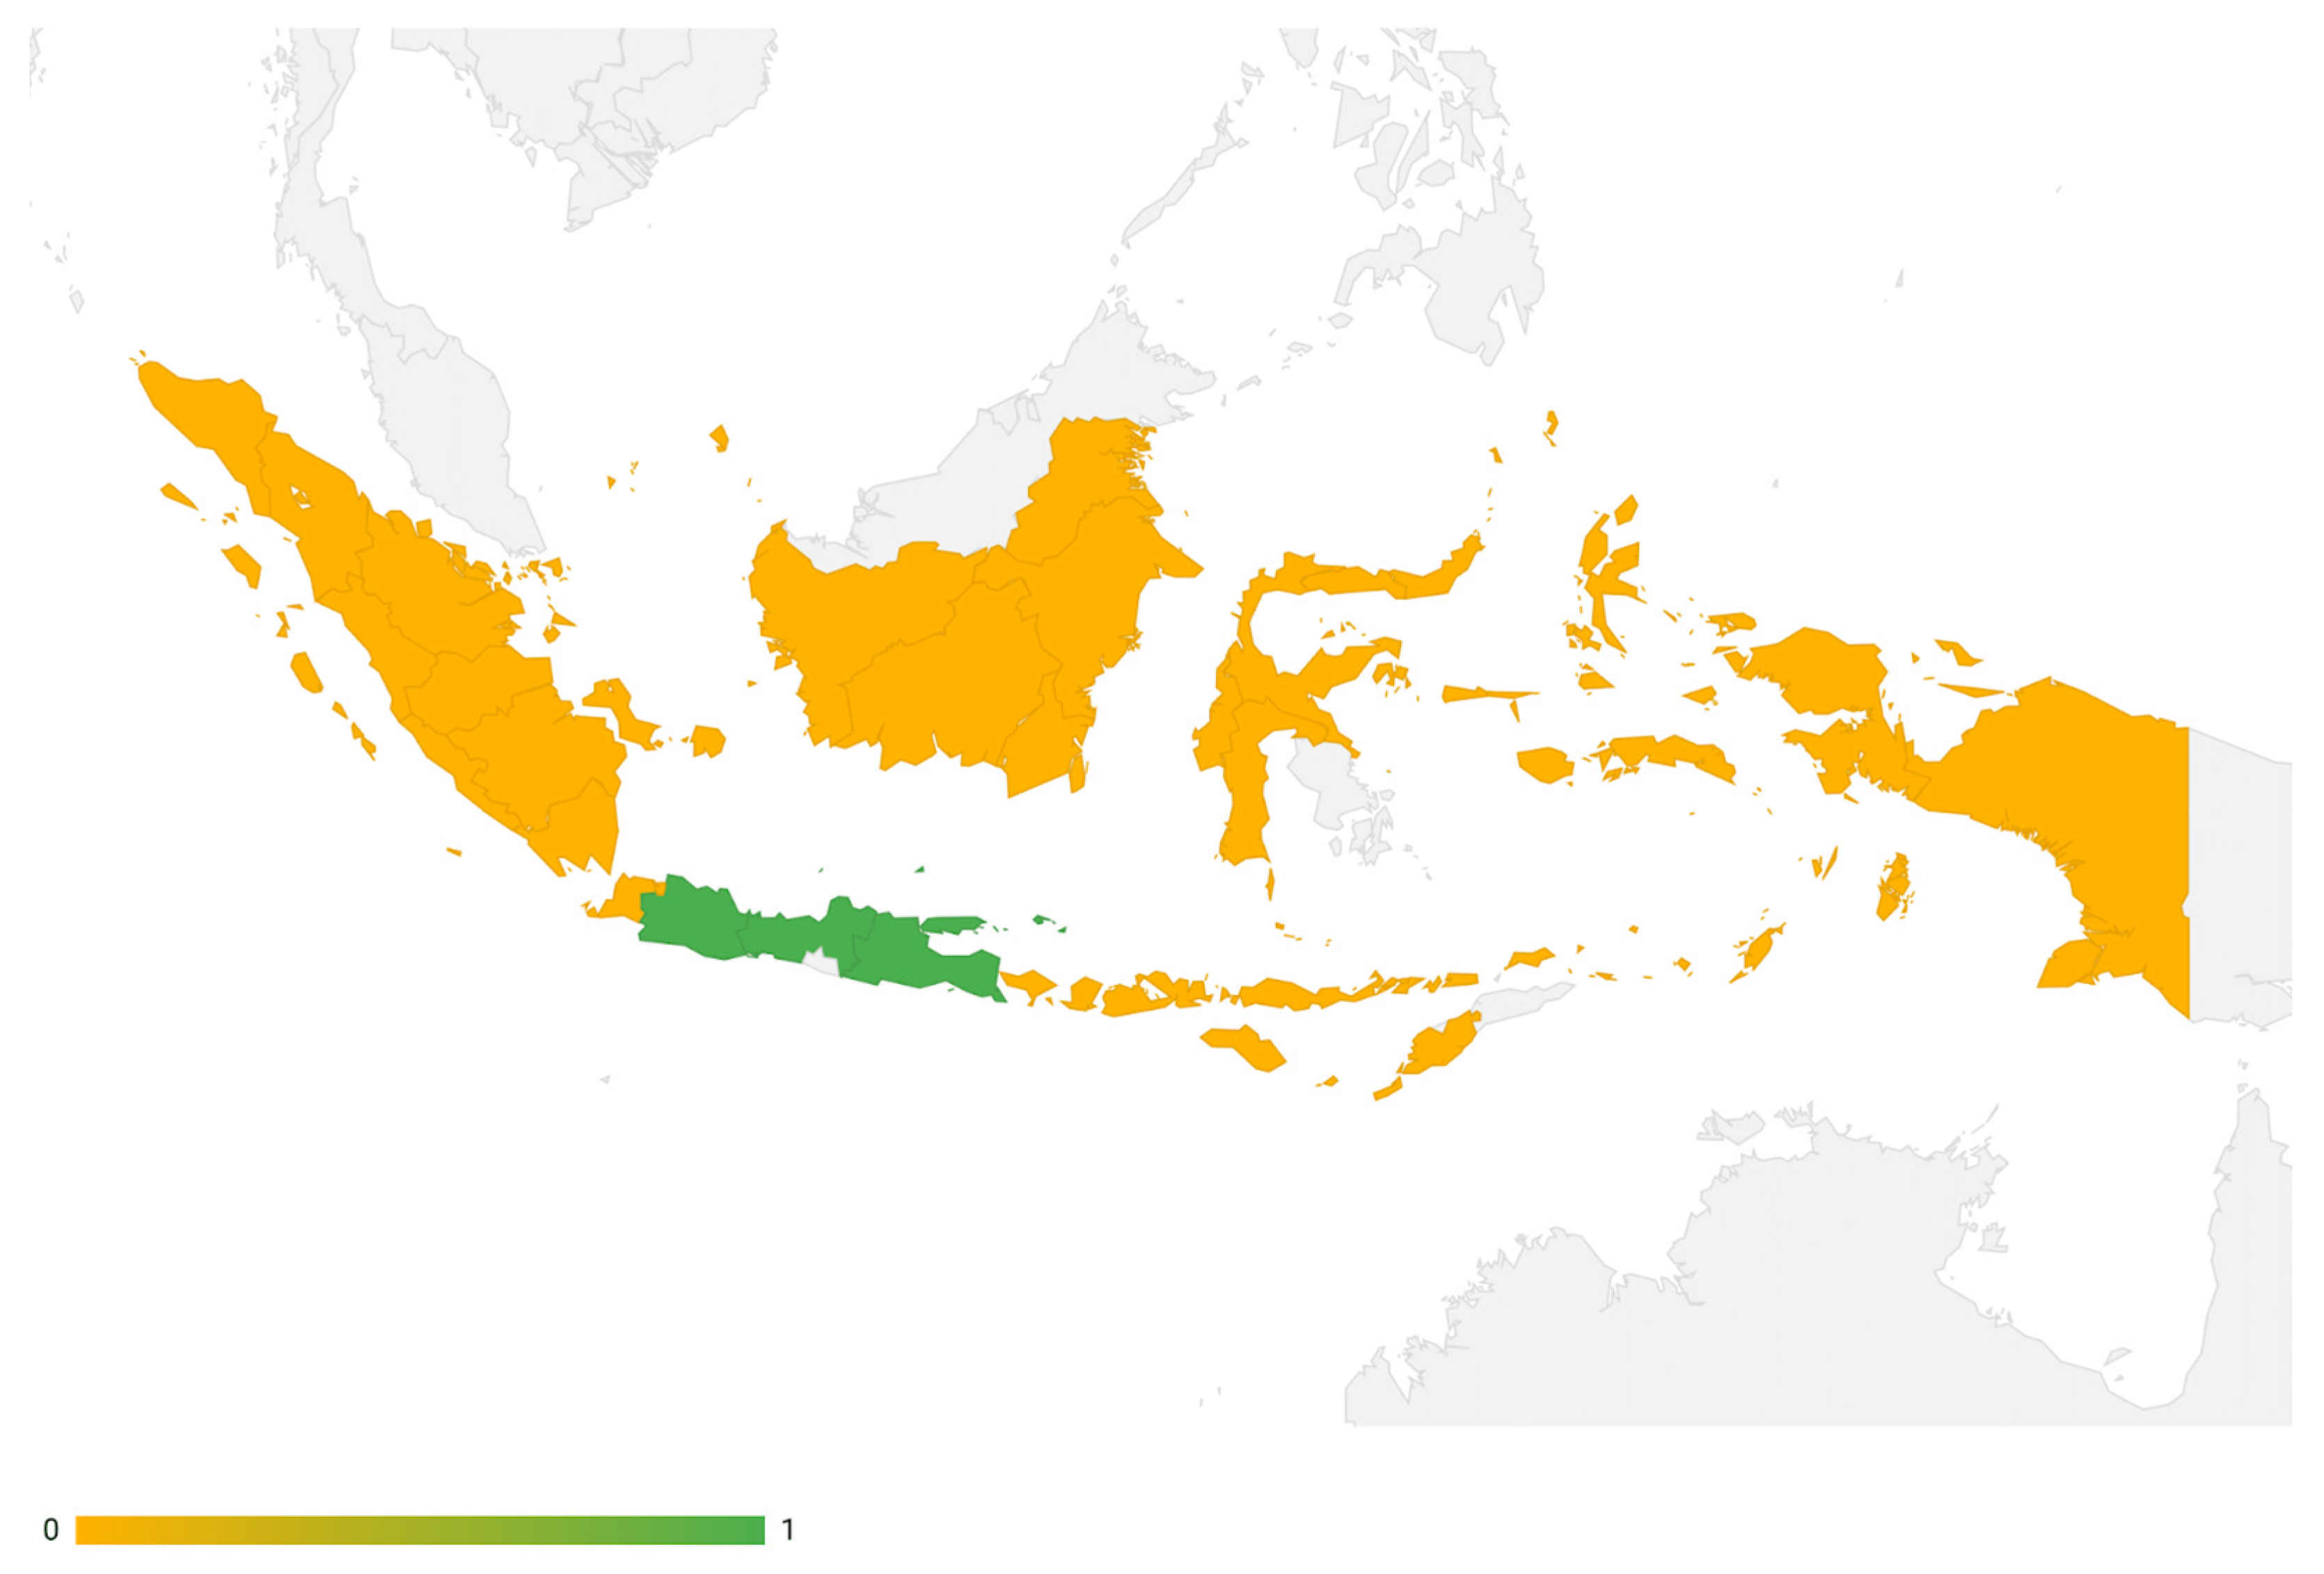
| 1 | 31 | Aceh Province, North Sumatra Province, West Sumatra Province, Riau Province, Jambi Province, South Sumatra Province, Bengkulu Province, Lampung Province, Bangka Belitung Islands Province, Riau Islands Province, DKI Jakarta Province, DI Yogyakarta Province, Banten Province, Bali Province, West Nusa Tenggara Province, East Nusa Tenggara Province, West Kalimantan Province, Central Kalimantan Province, South Kalimantan Province, East Kalimantan Province, North Kalimantan Province, North Sulawesi Province, Central Sulawesi Province, South Sulawesi Province, Southeast Sulawesi Province, Gorontalo Province, Province West Sulawesi, Maluku Province, North Maluku Province, West Papua Province and Papua Province |
| 2 | 3 | West Java Province, Central Java Province, and East Java Province |
| Category | Cluster 1 | Cluster 2 |
|---|---|---|
| Number of missing and dead victims | 3 | 20 |
| Number of injured victims | 14 | 190 |
| Number of impacted victims | 4237 | 40,920 |
Disclaimer/Publisher’s Note: The statements, opinions and data contained in all publications are solely those of the individual author(s) and contributor(s) and not of MDPI and/or the editor(s). MDPI and/or the editor(s) disclaim responsibility for any injury to people or property resulting from any ideas, methods, instructions or products referred to in the content. |
© 2024 by the authors. Licensee MDPI, Basel, Switzerland. This article is an open access article distributed under the terms and conditions of the Creative Commons Attribution (CC BY) license (https://creativecommons.org/licenses/by/4.0/).
Share and Cite
Pontoh, R.S.; Yang, V.V.; Laura, G.Y.; Riantika, R.A.; Arisanti, R.; Winarni, S.; Gumelar, F. Assessing Sustainable Development in Community Welfare and Economic Resilience to Extreme Weather in Indonesia. Sustainability 2024, 16, 6693. https://doi.org/10.3390/su16156693
Pontoh RS, Yang VV, Laura GY, Riantika RA, Arisanti R, Winarni S, Gumelar F. Assessing Sustainable Development in Community Welfare and Economic Resilience to Extreme Weather in Indonesia. Sustainability. 2024; 16(15):6693. https://doi.org/10.3390/su16156693
Chicago/Turabian StylePontoh, Resa Septiani, Valerie Vincent Yang, Ginta Yufendi Laura, Rahma Ariza Riantika, Restu Arisanti, Sri Winarni, and Farhat Gumelar. 2024. "Assessing Sustainable Development in Community Welfare and Economic Resilience to Extreme Weather in Indonesia" Sustainability 16, no. 15: 6693. https://doi.org/10.3390/su16156693
APA StylePontoh, R. S., Yang, V. V., Laura, G. Y., Riantika, R. A., Arisanti, R., Winarni, S., & Gumelar, F. (2024). Assessing Sustainable Development in Community Welfare and Economic Resilience to Extreme Weather in Indonesia. Sustainability, 16(15), 6693. https://doi.org/10.3390/su16156693