Article

Spatiotemporal Evolution and Driving Forces of Production-Living-Ecological Space in Arid Ecological Transition Zone Based on Functional and Structural Perspectives: A Case Study of the Hexi Corridor

by
Xianglong Tang
,
Leshan Cai
* and
Pengzhen Du
School of Architecture and Urban Planning, Lanzhou Jiaotong University, Lanzhou 730070, China
*
Author to whom correspondence should be addressed.
Sustainability 2024, 16(15), 6698; https://doi.org/10.3390/su16156698 (registering DOI)
Submission received: 16 June 2024 / Revised: 21 July 2024 / Accepted: 1 August 2024 / Published: 5 August 2024

Abstract

:
The rational allocation of land resources is crucial to ensuring human well-being, livelihood, and survival. The study of Production-Living-Ecological Space (PLES) provides new perspectives on land resource allocation. However, few studies have assessed the feasibility of PLES optimization in ecological transition zones. For this study, using the composite functional space classification method, a classification and functional utility scoring system were constructed. Various methods, including dynamic attitude, transfer matrix, and spatial autocorrelation, were employed to characterize the evolution of the quantity and quality of PLES in the Hexi Corridor. Moreover, the mechanisms driving these changes were explored using a geodetector. Our findings revealed that: (1) The distribution of Production-Ecological Space (PES) is higher in the west and south and lower in the east and north. Production-Living Space (PLS) is scattered. Ecological-Production Space (EPS) is mostly distributed in the south or west, whereas Ecological Space (ES) is mainly located in the north and west of the Hexi Corridor. (2) From 1980 to 2020, the area of PES and PLS increased by 2037.84 km2 and 673 km2, respectively; the area of EPS was relatively stable, and the area of ES decreased by 2523.06 km2. (3) The evolution of PLES quality indicated that the high functional utility area of PES and PLS was roughly the same as the expanded functional utility area, whereas the expanded functional utility area of EPS and ES is similar to the median functional utility area. (4) The spatiotemporal evolution of PLES is closely linked to natural, economic, and social factors.

1. Introduction

Space is a crucial resource for all human activities. With the progress of science and technology and the rapid increase in the global population, human activities have given rise to various new forms of land use, resulting in substantial changes in global land utilization [1]. For instance, the expansion of cultivated land in Southeast Asia has led to deforestation [2], whereas extensive afforestation efforts in East Asia have positively impacted vegetation conditions [3]. Anthropogenic pressures have caused severe eutrophication in water bodies [4] and the loss of wetlands in some continental European watersheds [5]. Profound shifts in land use significantly influence biodiversity, global climate change, and ecosystem resilience [6,7,8]. Given that the rational allocation of land resources is closely tied to human well-being, health, livelihood, and survival [9,10], the multifunctional use and spatiotemporal evolution of land have recently garnered increasing attention [7,11,12].
Since China’s reform and opening up, rapid urbanization and industrialization have propelled social and economic development [13,14]. However, this progress has given rise to increasingly severe problems, including significant soil erosion, declining biodiversity, heightened conflicts between humans and land, and a looming crisis in sustainable land allocation [3,15]. In 2012, the Chinese government specifically put forward the overall goal of “intensive and efficient production space, livable and moderate living space, and clear and beautiful ecological space”, emphasizing “overall planning of territorial spatial development, scientific layout of production space, living space, and ecological space, and leaving more space for nature” [16]. The comprehensive spatial zoning method known as Production-Living-Ecological Space (PLES) classifies space based on the production, living, and ecological functions of the land, encompassing all human activities [17]. PLES is one of the thematic research elements of territorial spatial planning, as well as a zoning approach to territorial spatial planning [18]. This approach provides a novel perspective for evaluating spatial development suitability and maximizing spatial functions in the process of territorial space development and protection, gaining favor from the Chinese government and researchers [19,20]. PLES has now become a pivotal basis for optimizing land allocation in China, with significant implications for managing land use conflicts and regulating land allocation based on social and economic factors [21,22]. The concept of PLES is based on the functional perspective of land use. According to the theoretical viewpoint of “element-structure-function” in system theory, the system structure is the basis for the realization of system function. Therefore, if land use is regarded as a system, the structure of land use is the basis for the realization of land use functions. Based on the structure of land-use types and the establishment of a logical connection and classification system between land-use types and land-use functions, a scientific spatial classification and evaluation system for PLES can be constructed.
Understanding the characteristics of PLES classification and its spatiotemporal evolution forms the foundation of PLES-related research. PLES classification methods primarily fall into two categories: the land class merging method and the index system method [21]. The land class merging method identifies the evolutionary characteristics of PLES quantity but struggles to describe the differences in PLES quality [23]. In contrast, the index system method assesses the functional strength of PLES using natural, social, and economic data [17]. While this method can identify the evolution characteristics of PLES quality, its evaluation of functional strength relies on a series of indicators, all considering the administrative unit as the evaluation unit, making it challenging to fully and accurately reflect spatial function. Another approach that is sometimes used is PLES identification through point-of-interest (POI) data and social behavior activities [24]. With economic and social development, human demand for land increases. The functions played by each of the PLES show a diversified trend, and the identification of PLES in a fixed scale range should be based on the dominant function of land use. The results of existing studies do not sufficiently take into account the multifunctionality of land use [21]. Therefore, we propose a model for dividing the composite functional space. The model of composite functional space is based on the characteristics of spatial functional composability, which analyzes functions for the three types of single spaces, namely, ecological, production, and living spaces, as well as composite spaces such as Production-Living Space, Production-Ecological Space, and Ecological-Production Space [25]. Currently, driven by the demand for multifunctional space utilization and coordinated development, the composite functional space classification method has gained widespread acceptance in China [25,26]. Therefore, we employed this method to characterize the study area and established a function evaluation system to score the spatial function of PLES in the Hexi Corridor. This approach only requires land use data from different periods, enabling precise identification of the quality and quantity evolution characteristics of PLES [19,27]. When exploring the driving mechanisms of the evolution of PLES, common methods include geographically weighted regression [28], correlation coefficient [29], and geodetector [28]. The advantage of geodetector is that it permits the analysis of both numerical and qualitative data, as well as the interaction of two factors on the dependent variable [30]. For the purposes of our study, we are also considering our case as an example of an ecological transition zone. Ecological transition zones are characterized by a large environmental gradient [31]. Further characteristics include evident changes for various landscape elements, with a strong edge effect. The regional climate of such zones is typically more sensitive to global climate change [31,32]. Land cover types in the ecological transition zone are complex and diverse [33], and conflicts between different land use types are more intense [34]. The Hexi Corridor is a highly representative ecological transition zone, characterized by a harsh climate and a fragile ecological environment. This transition zone features diverse landforms such as snow-capped mountains, forests, grasslands, deserts, rivers, and oases [35,36]. Overall, the Hexi Corridor exhibits relatively slow social and economic development and a low level of urbanization. Nevertheless, the arid zone contains several oases that represent higher concentrations of human activity, noticeable land-use conflicts, and detrimental impacts of human activity on the environment [37]. The PLES evolution model and driving mechanisms in the Hexi Corridor differ significantly from those in other regions. With the introduction of the Western Development Strategy and the Belt and Road Initiative. Initiative, the importance of the Hexi Corridor is becoming increasingly significant as an important corridor for international land transportation connecting Eurasia and as a key region for the implementation of the Belt and Road initiative [4,38]. With the expansion of oasis towns, pressure on water resource supply increases, rendering the distribution of PLES more complex [39]. Agricultural and industrial activities place additional pressure on water resources. The functional integrity of PLES within the Hexi Corridor therefore holds considerable ecological, economic, and cultural value for promoting regional sustainable development and enhancing the well-being of the populations of the surrounding areas.
Previous studies on PLES identification and evolution have focused on urbanized areas due to the personal backgrounds of the researchers, the availability of data, and the more intense conflicts over production, living, and ecological spaces within highly urbanized areas [40]. Comparatively few studies have to date assessed and classified patterns in ecological transition zones within arid areas. Moreover, most relevant studies have focused on either the quality evolution [41] or quantity changes [31,42] of PLES, making it challenging to accurately pinpoint the temporal and spatial evolution characteristics. Analysis of driving factors in previous studies primarily revolved around social, economic, and demographic factors, with limited attention to natural factors.
Therefore, this study sought to construct a PLES classification and function scoring system from the novel perspective of land use compound function. This approach aims to unveil the temporal and spatial evolution of PLES in the Hexi Corridor, both in terms of quality and quantity. Additionally, geodetector is employed to assess the influence of different factors on the temporal and spatial evolution of PLES in the Hexi Corridor and elucidate the mechanisms driving these changes. Furthermore, by integrating research findings and related studies, we sought to propose a scientific and rational strategy for the sustainable development and spatial management of the Hexi Corridor. Collectively, the strategies proposed herein aim to facilitate the rational allocation and sustainable development of land space in the areas surrounding the Belt and Road Initiative.

2. Materials and Methods

2.1. Study Area and Data Sources
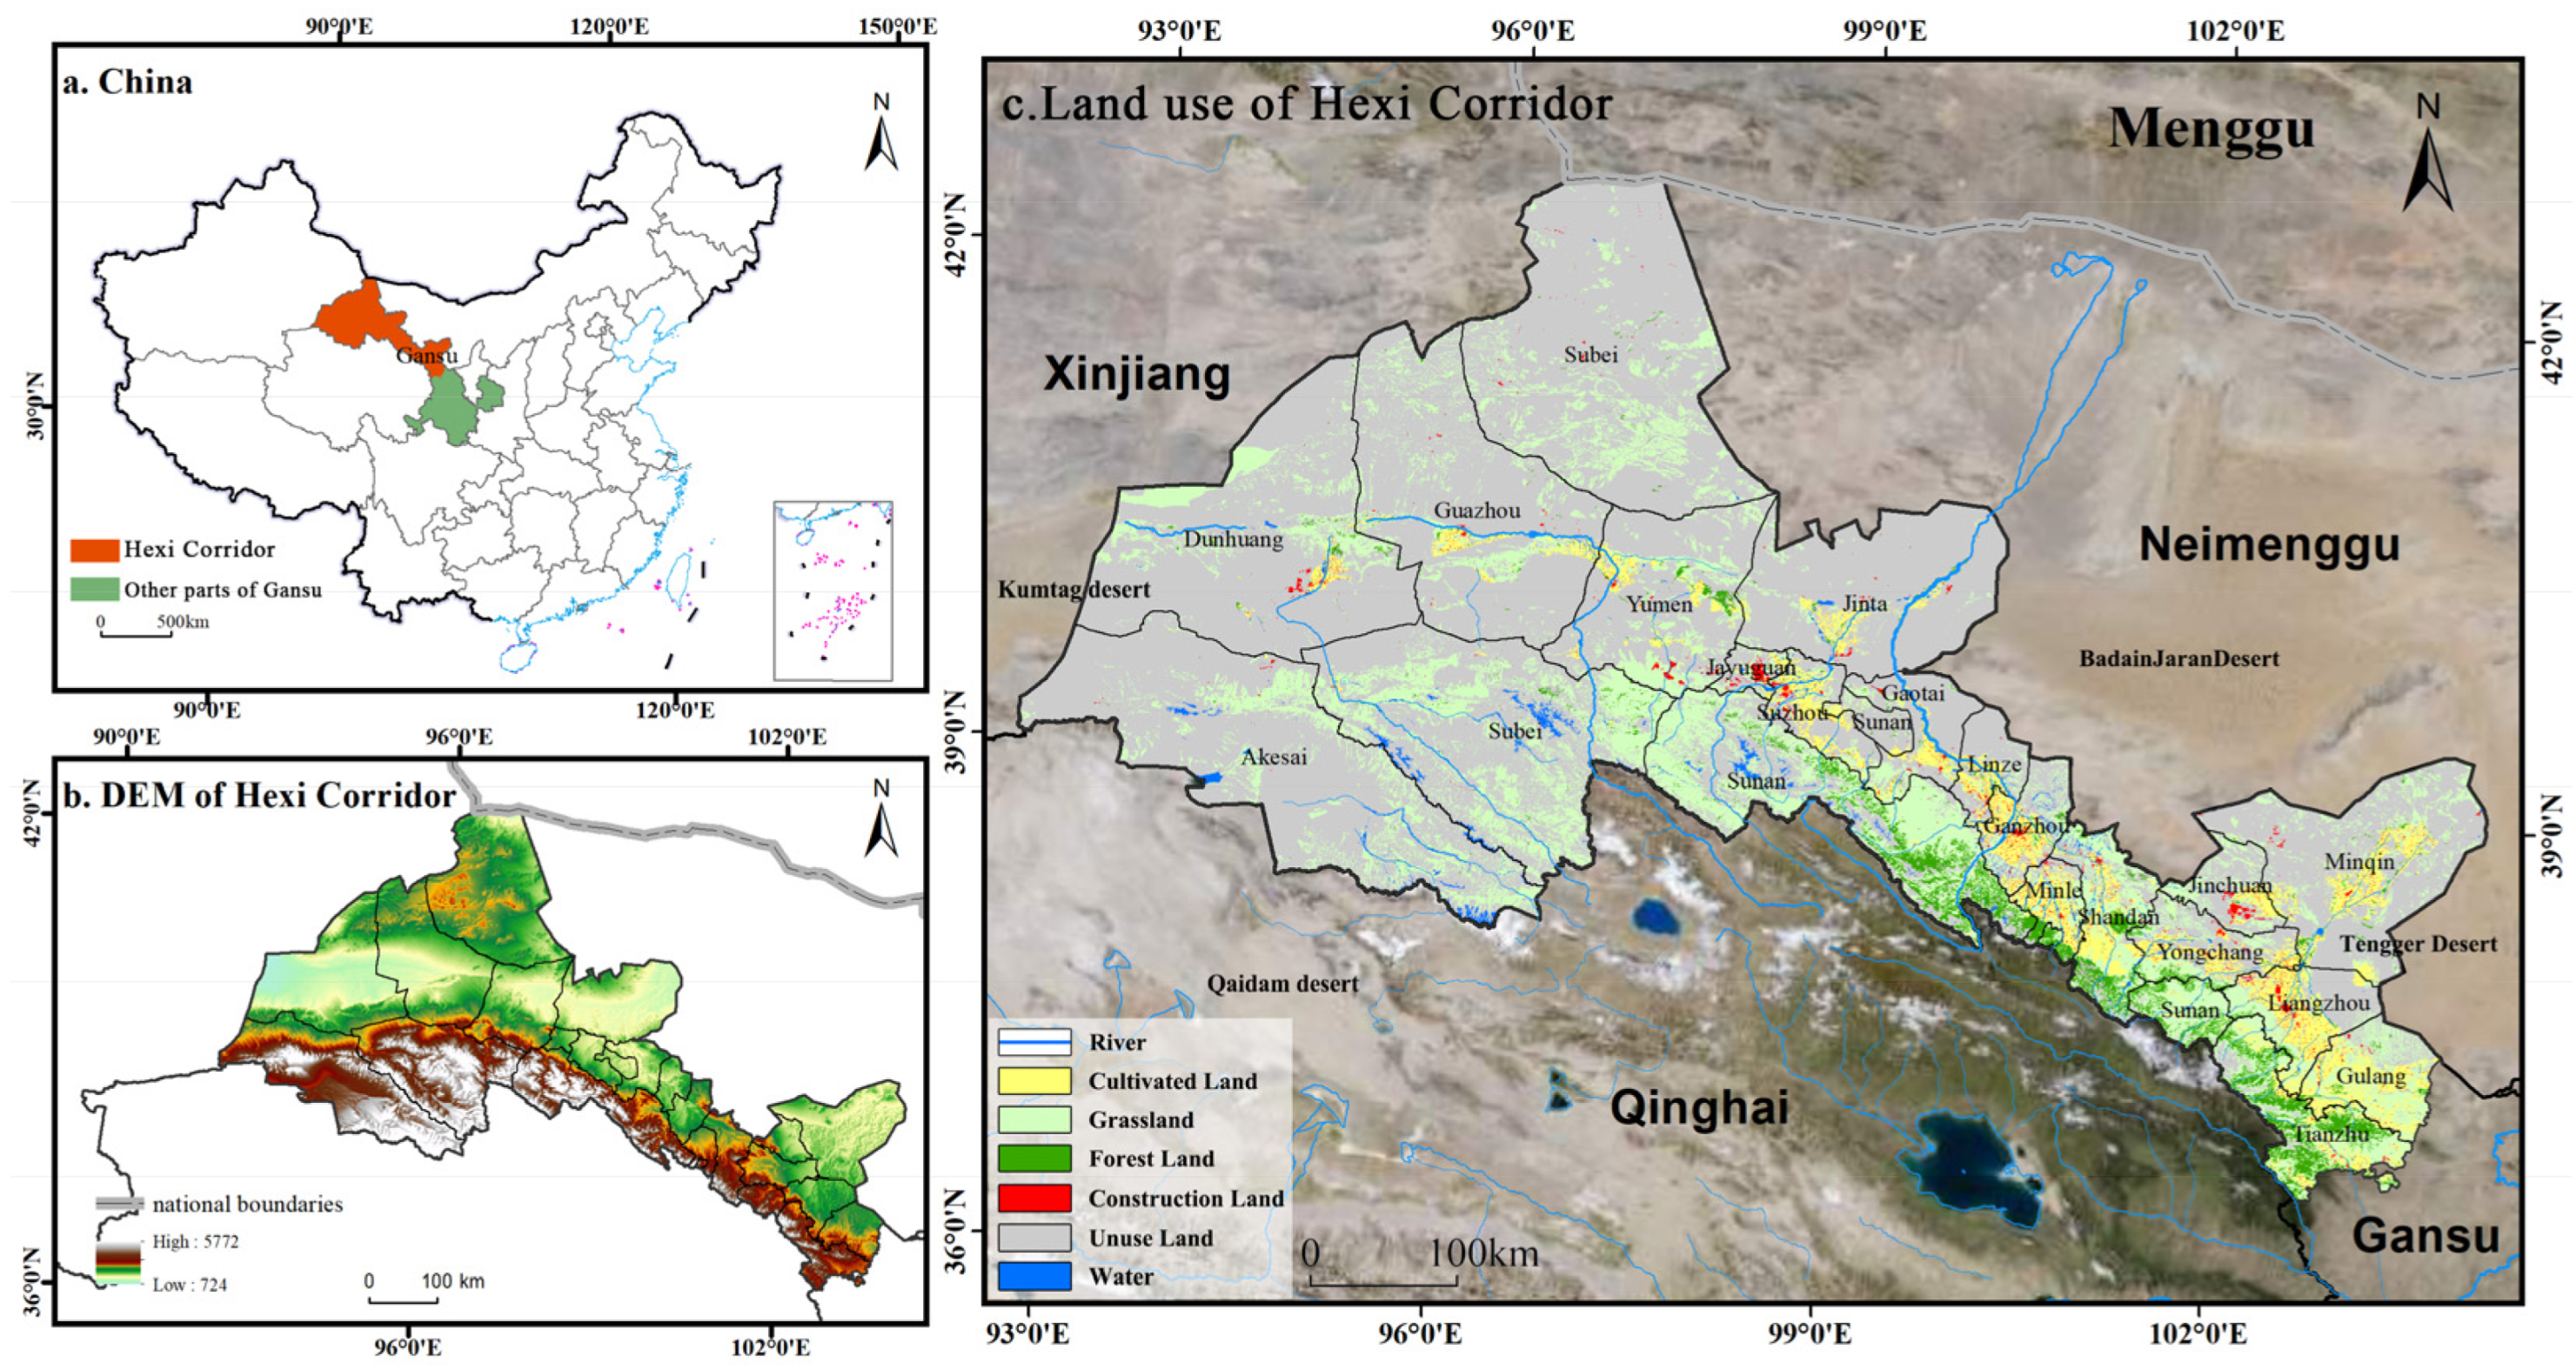
2.1.1. Study Area

The Hexi Corridor is located in northwest China, west of the Yellow River, north of the Qilian Mountains, and south of the Beishan Mountains. The Hexi Corridor includes five prefecture-level cities (Wuwei, Jinchang, Zhangye, Jiuquan, and Jiayuguan), with a total of 20 county-level administrative units, covering an area of 27.74 × 10⁴ km2 (Figure 1). The Hexi Corridor has an average annual temperature of 4–10 °C and annual precipitation of approximately 200 mm, with sunshine and annual total solar radiation up to 5700–6400 MJ/m2. Its landforms mainly include snow-capped mountains, oases, grasslands, deserts, and rivers. Both regions as a whole exhibit typical characteristics of ecological transition zones [38]. The Hexi Corridor hosts three major river basins—the Yanghe River, Heihe River, and Leshuhe River—constituting the primary distribution areas of oases in the region. Settlements are predominantly located within or on the periphery of oases [36,39,43], which account for approximately 10% of the total area of the Hexi Corridor but contribute approximately 90% of the region’s GDP [44]. In recent years, the development of land resources in the Hexi Corridor has become increasingly active, and a large amount of unused land has been transformed into construction land, arable land, and grassland [45], leading to increasingly rapid and far-reaching changes in PLES. Given its unique characteristics, the Hexi Corridor serves as an ideal location for studying the temporal and spatial evolution, as well as the driving mechanisms, of ecological transition zone PLES in arid regions.

2.1.2. Sources and Processing of Land Use Data

The study selected the “China Land Cover” (CNLUCC) data provided by the National Resources and Environment Database of the Chinese Academy of Sciences (https://www.resdc.cn/ (accessed on 15 April 2024)). Several studies have shown that this data are one of the most suitable datasets for regional-scale studies in China [32,46]. The land use classification of this dataset is shown in Table 1, which has a raw precision of 30 m × 30 m. This study uses land use data from this dataset for the years 1980, 1990, 2000, 2010, and 2020.

2.1.3. Sources and Processing of Other Data

The other data types, sources, and accuracy of this study are summarized in Table 2. The study standardized the spatial accuracy of all data to 1 km × 1 km when using geodetector.

2.2. Methods

2.2.1. Classification System and Spatial Scoring Standard System of PLES in Hexi Corridor

This study focuses on the classification of land use types, function identification, and scoring, aiming to explore the relationship between changes in PLES types and function scores. The objective of this study was to establish a scientific basis for spatial planning and management by assessing the spatial evolution of PLES from both a qualitative and quantitative perspective. The most significant advantage of this method lies in its more systematic and comprehensive assessment of the temporal and spatial evolution of PLES. This holistic approach not only considers the quantitative evolution trend of land use types but also incorporates the qualitative evolution trend of land use functions. Moreover, the proposed approach integrates the multifunctional utility of a single land type (e.g., cultivated land serves both productive and ecological functions) into quantitative data, emphasizing the crucial role of land in coordinating and balancing production, life, and ecology. Liu et al. constructed a functional evaluation system for PLES in China based on CNLUCC, according to the field research method and expert scoring method [47]. Given the growing emphasis on the multifunctional use of land and its diverse social and ecological contributions, this study integrates existing classification methods and functional evaluation frameworks of PLES, national standards, and pertinent research [16,19,48,49,50]. Drawing on methodologies applied in these prior studies [26,51,52], we constructed a PLES functional scoring system applicable to the Hexi Corridor based on the characteristics of land use in the Hexi Corridor using field survey methods (Table 1).
The land use types in the Hexi Corridor underwent meticulous classification, with each assigned function score drawing on the methodology proposed by Liu et al. [47]. We have further categorized PLES into Production-Ecological Space (PES), Production-Living Space (PLS), Ecological Production Space (EPS), and Ecological Space (ES). In turn, its functional utility is divided into a Production-Ecological Functional Score (PEFS), a Production-Living Functional Score (PLFS), an Ecological Production Functional Score (EPFS), and an Ecological Functional Score (ESFS)—comprising four functional scores. To express the primary and secondary relationships of the four spatial functions, we used a six-grade scale from 0 to 5. For example, cultivated land (paddy fields and dryland) primarily serves agricultural production but also has an ecological function. Its PEFS, EPFS, and ESFS scores are 4, 2, and 4, respectively.
The PLES classification system (Table 3) corresponds to CNLUCC [26,29,51,53]. On the other hand, we score the function of land use types in CNLUCC according to the actual situation of the Hexi Corridor and the research of Liu et al. [47]. The scoring standards are derived from the study of Liu et al. [47]. The scoring results are shown in Table 4. We combine Table 3 and Table 4 to get the classification system and spatial scoring standard system of PLES in the Hexi Corridor (Table 5).

2.2.2. Dynamic Degree of PLES Change

In this study, a single dynamic index was used to describe the change of a single space in the Hexi Corridor [29]. The formula for calculating single dynamic attitude is as follows:
K = (Ub − Ua)/Ua/T × 100%
where K represents the dynamic patterns of a certain type of space in the region within a certain period of time. Ua is the area of a certain type of space at the beginning of the study period, Ub is the area of the space at the end of the study period, and T is the research period.
A single comprehensive dynamic index was used to describe the overall change severity of the Hexi Corridor PLES. This comprehensive dynamic index was calculated as follows:
KC = Σ i = 1 n Δ L U i - j 2 Σ i = 1 n L U i × 1 T × 100 %
where KC is the comprehensive dynamic pattern; T is the study period; ΔLUi−j represents the absolute area transformed from space i to space j; LUi is the area of space i at the beginning of the study period.

2.2.3. Transition Matrix of PLES

The transition matrix was used to characterize the change of PLES structure [54]. The land use transfer matrix can be used to quantitatively explore the change of PLES and reveal the direction and overall effect of PLES transfer in different periods. The calculation formula is as follows:
S ij = S 11 S 12 S 1 n S 21 S 22 S 2 n S n 1 S n 2 S nn
where Sij is the area of space i transformed into space j; n indicates the number of types of PLES.

2.2.4. Geodetector

Geodetector is a statistical method to detect the spatial differentiation of geographical phenomena and identify the main driving forces, including a factor detector, risk detector, ecological detector, and interactive detector [29,55]. Factors and interactive detectors were used in this study. These factors were calculated as follows:
q = 1 h = 1 L N h σ h 2 / N σ 2
In the formula, q is an explanatory index that affects the function score of PLES, ranging from 0 to 1. Larger values indicate a greater influence of driving factors on the function score of PLES and vice versa; L is the classified number of influencing factors; Nh and N are the number of units in layer h and the study area. σh2 and σ2 are the variances of the function score of PLES for layer h and the study area, respectively.

3. Results

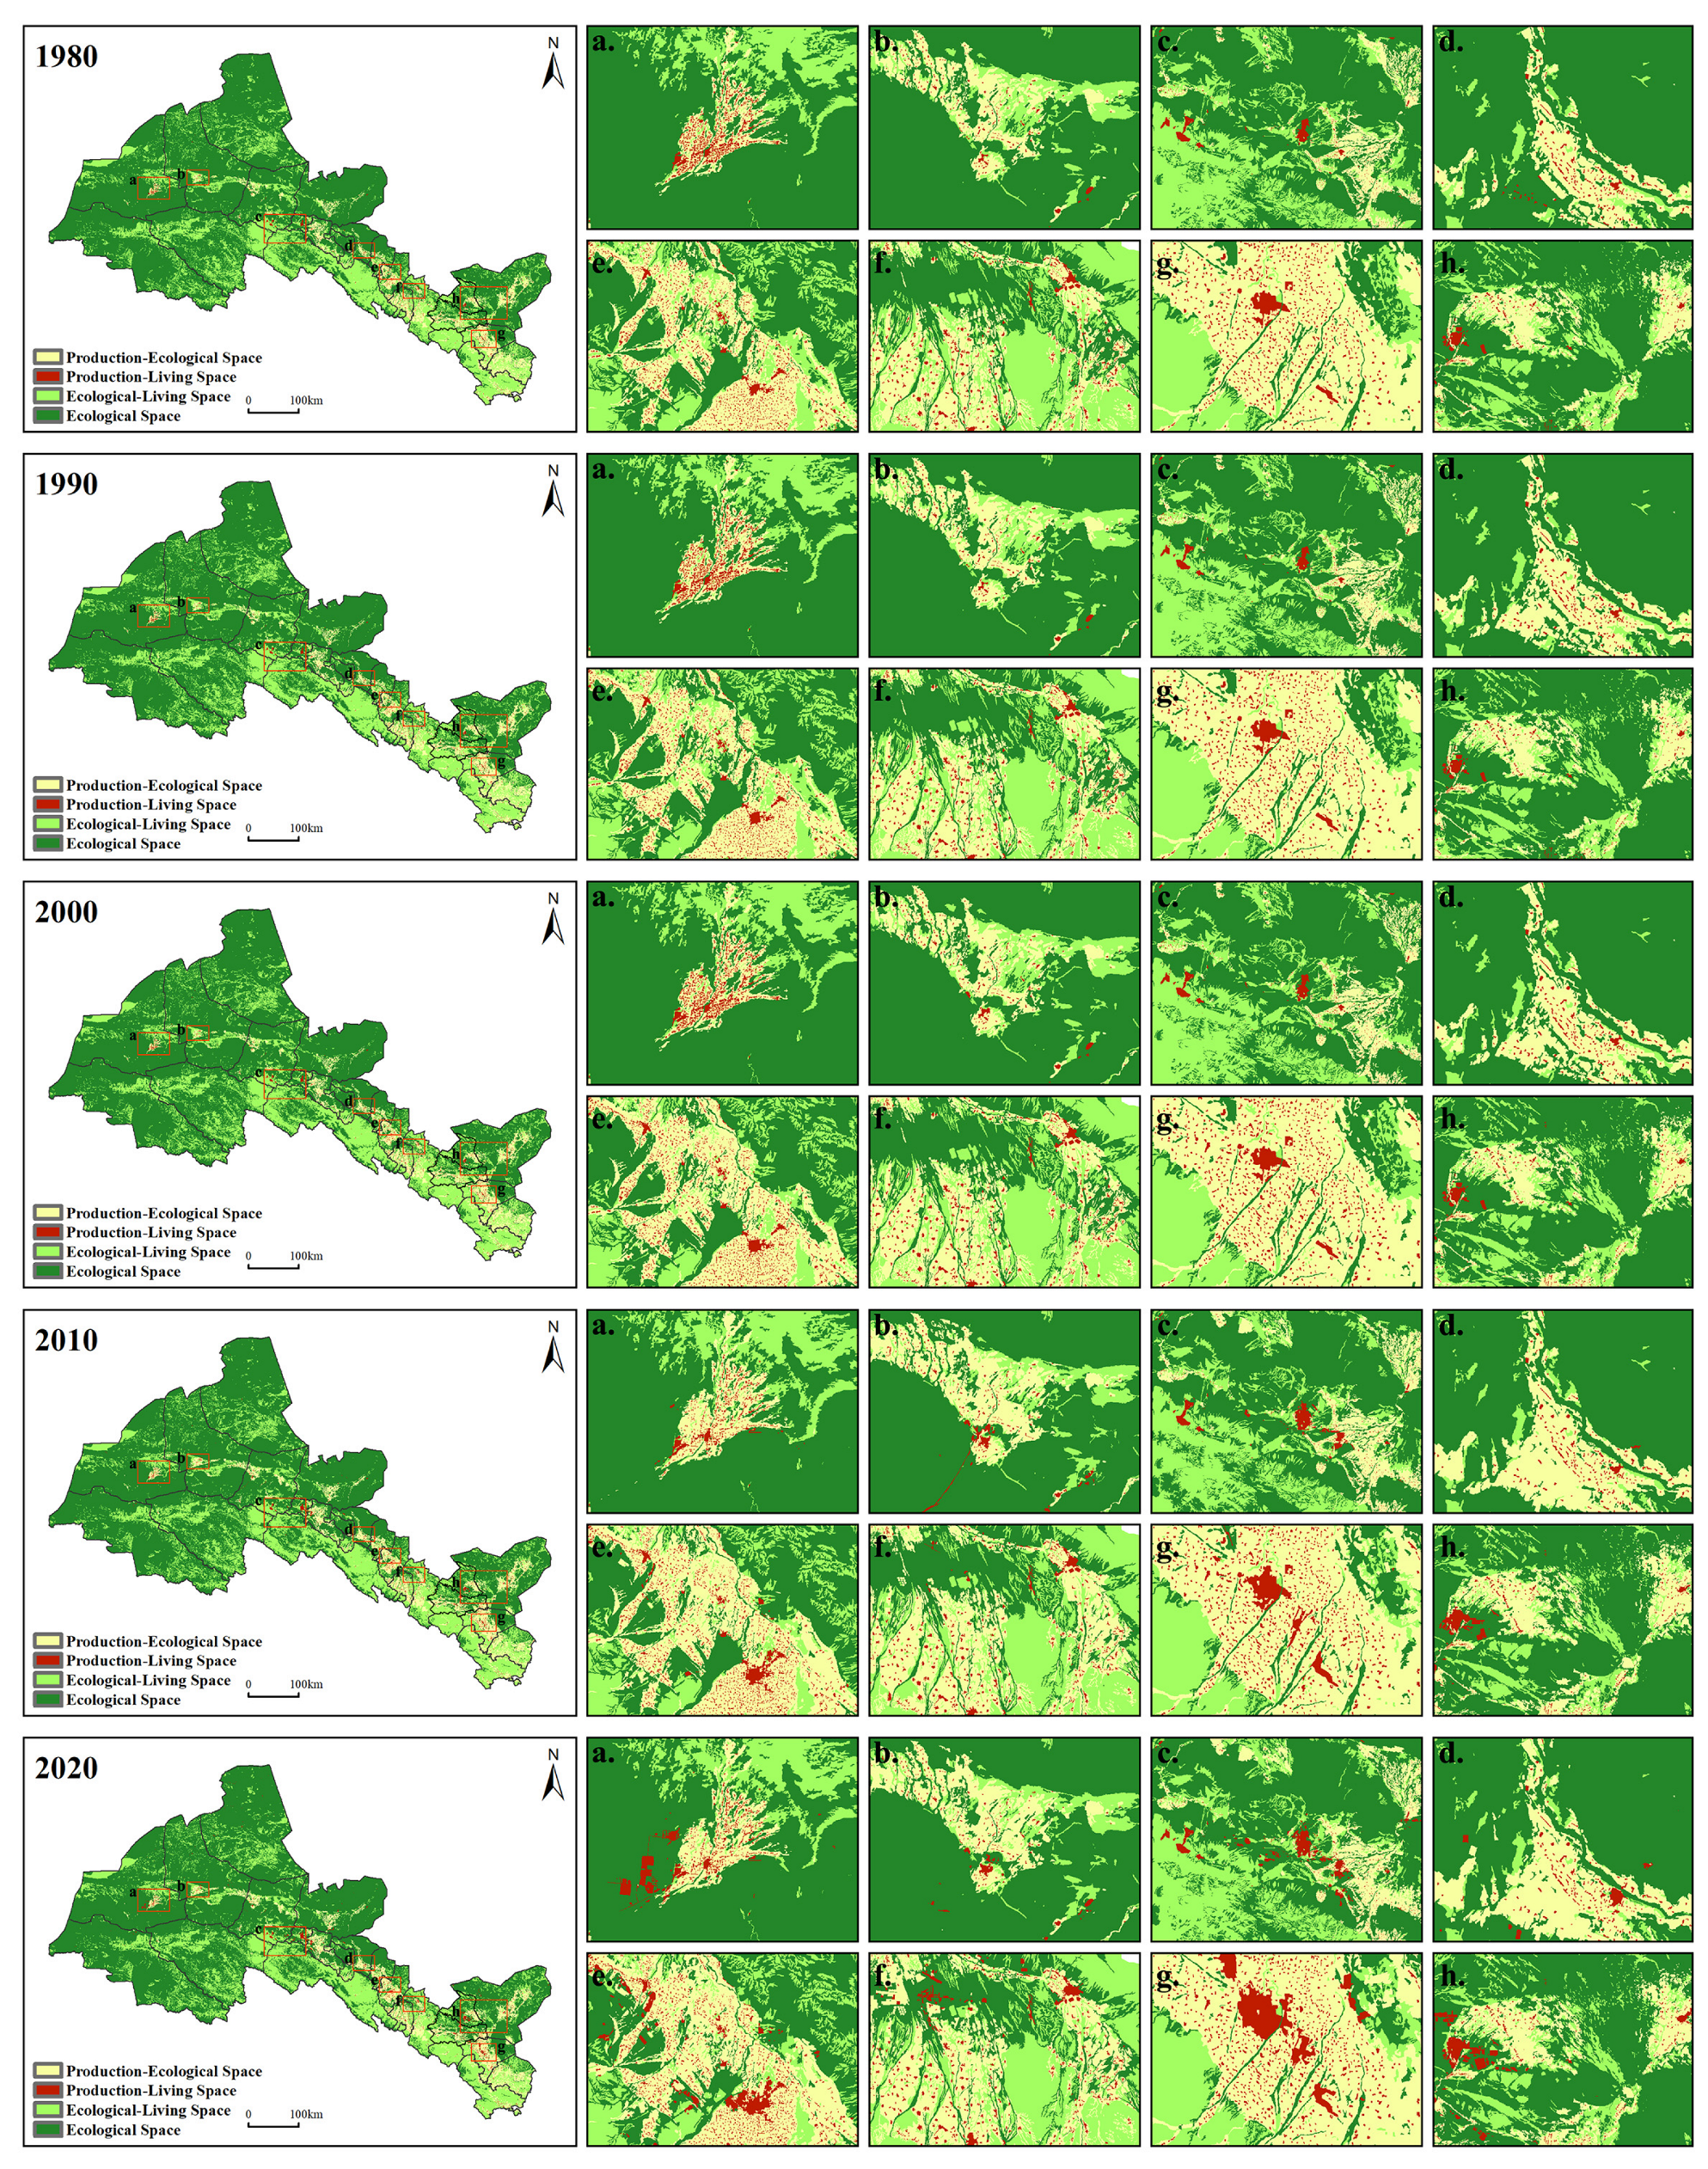
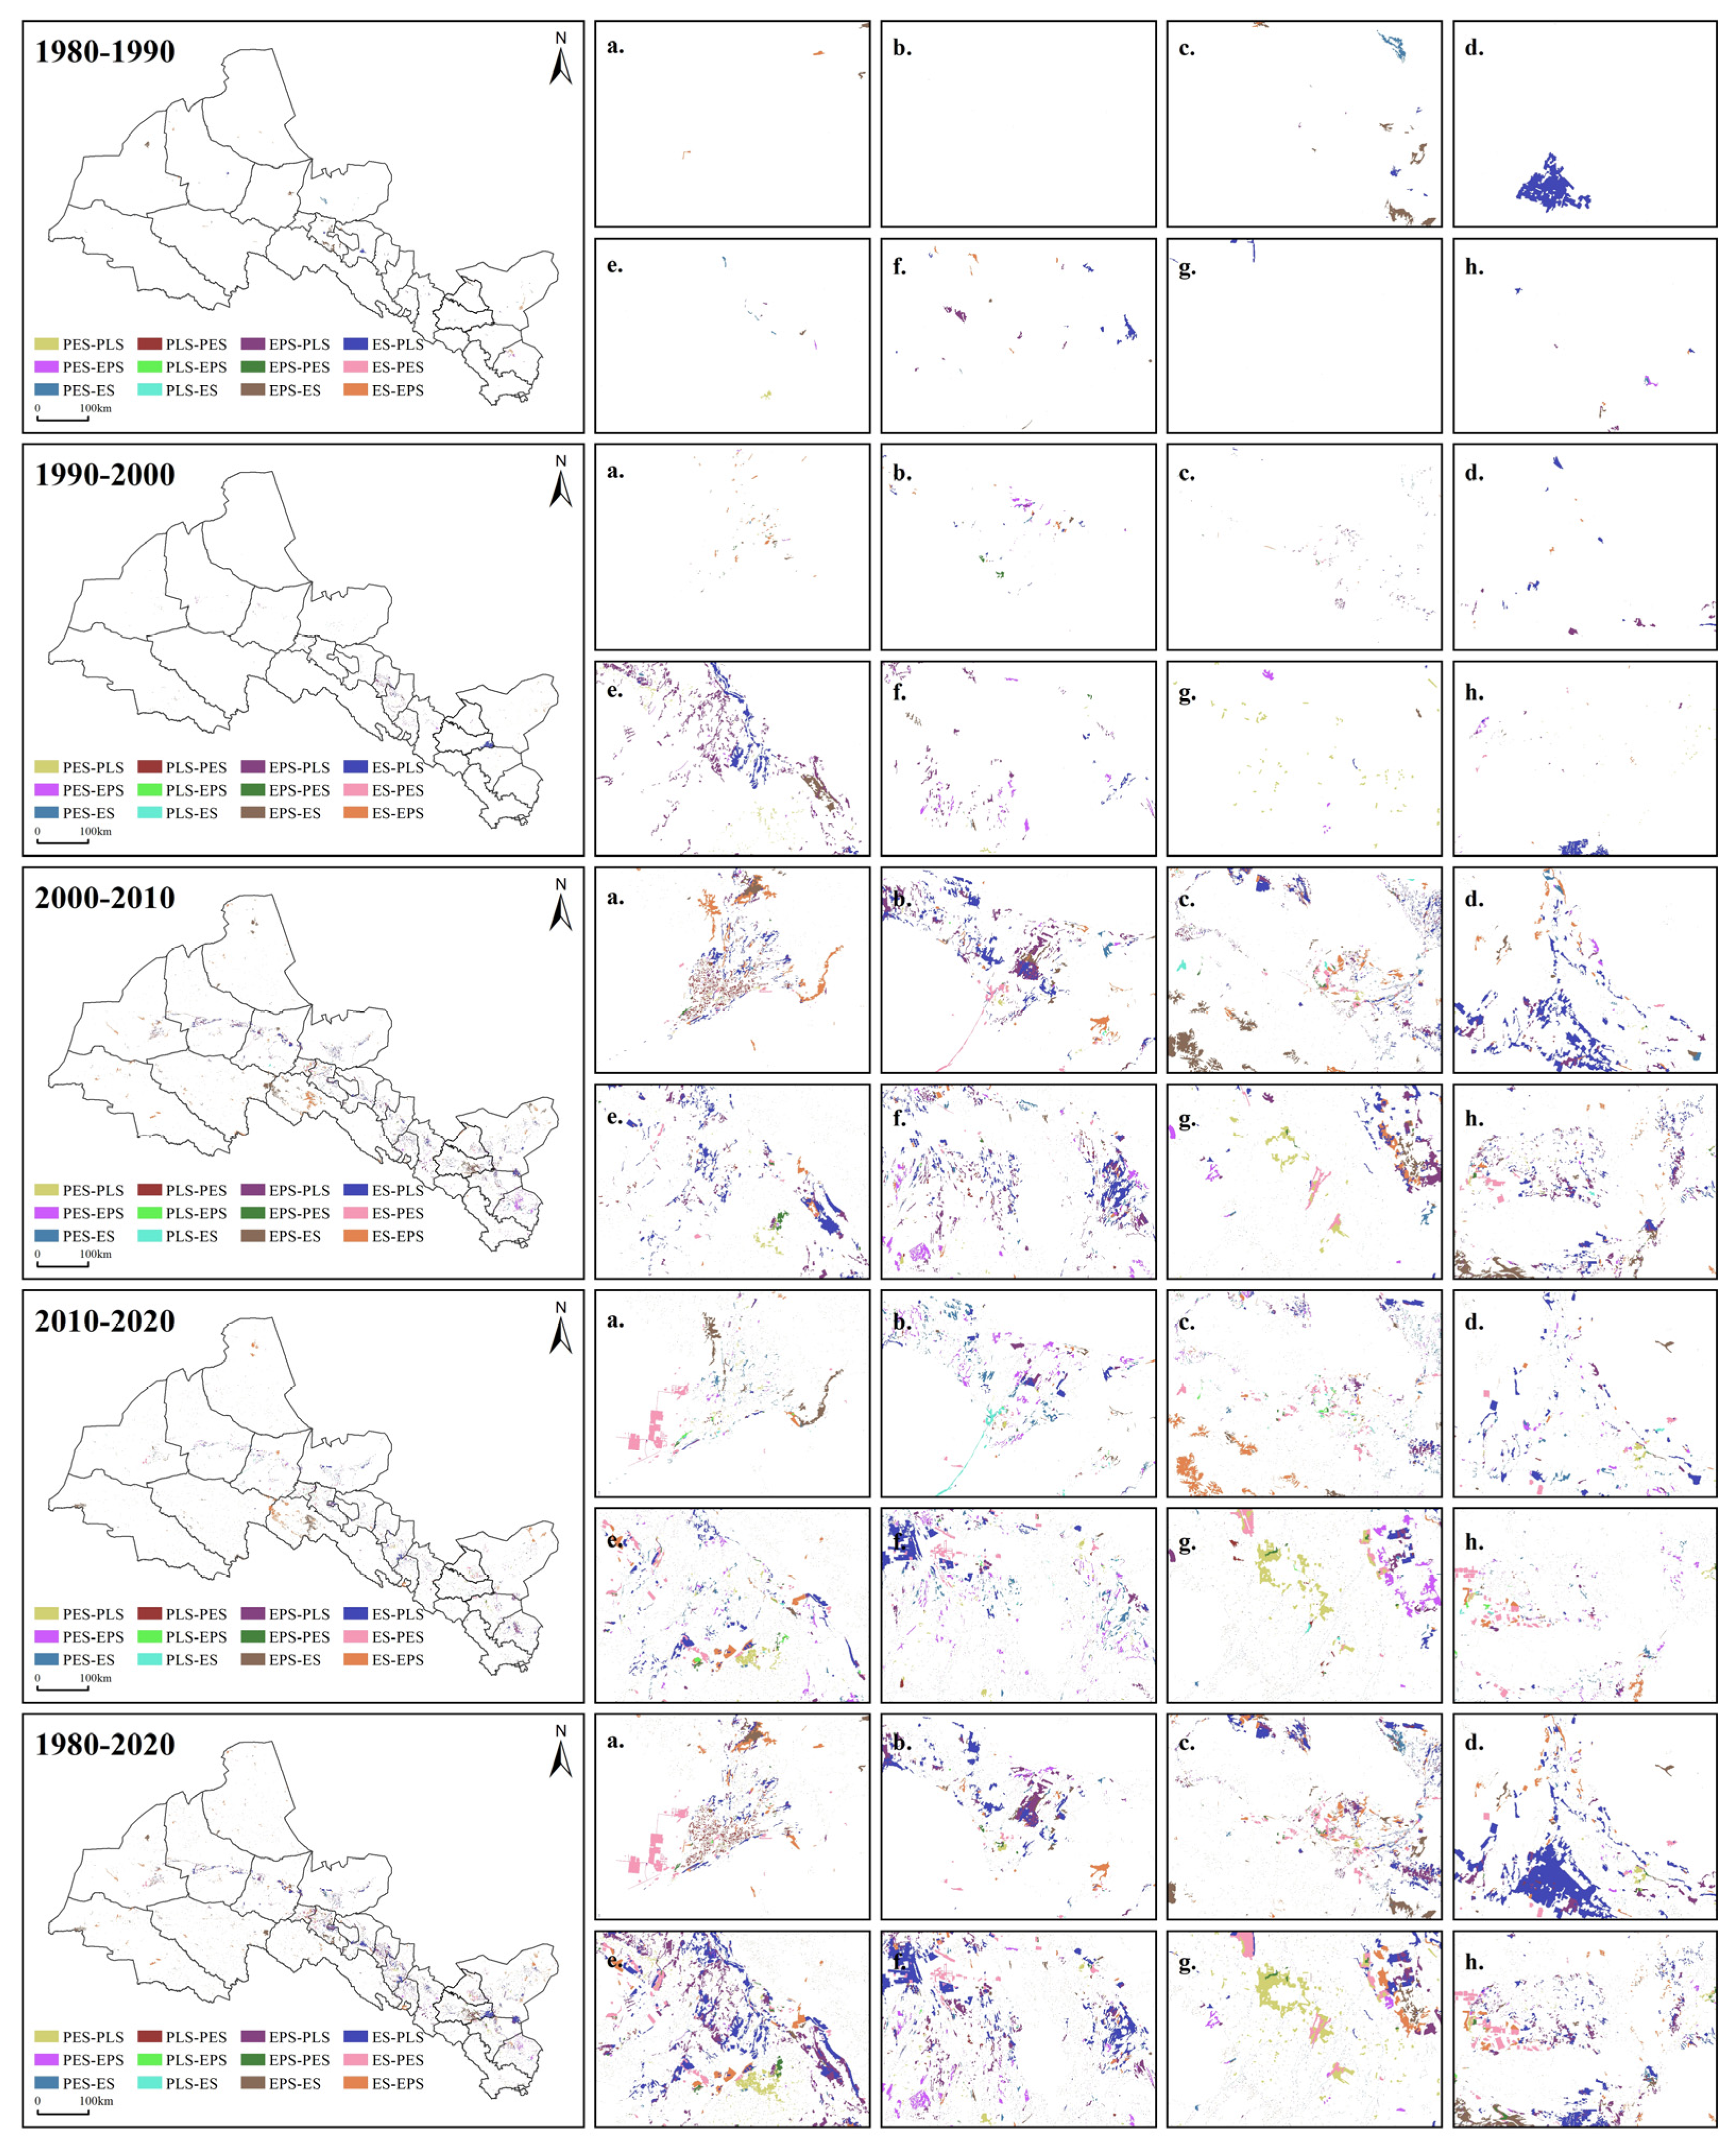
3.1. Spatiotemporal Variation Characteristics of PLES

The PLES distribution in the Hexi Corridor exhibits distinct characteristics based on location and topography. In the Gobi and desert hinterland, changes in PLES are relatively steady, while the variations in various oases and their peripheral regions are more pronounced (Figure 2), though still constrained within a specific regional range. The overall pattern of PLES over the past 40 years can be summarized as follows: (1) PES is characterized by high levels in the west and south and low levels in the east and north. PES is predominantly distributed along the rivers and alluvial plains of the Hexi Corridor and is mainly concentrated in Liangzhou, Minqin, Minle, Ganzhou, Linze, Suzhou, and Jiayuguan. (2) PLS accounts for a relatively small number of towns and villages of varying sizes; PLS is scattered across major oasis areas in the Hexi Corridor. These areas are mostly surrounded by production ecological space. (3) EPS is mostly distributed in the south or west of the Hexi Corridor and is composed of an alpine meadow formed after the melting of the Qilian Mountains glacier. They are mainly concentrated in the north and west of the Hexi Corridor, particularly in the Gobi and desert regions. Concentrated mainly in Minqin, Jinta, Subei Mongolian Autonomous County (Beishan area), Dunhuang, Guazhou, Yumen, and Aksai.

3.2. Quantitative Evolution of PLES

3.2.1. The Characteristics of the Scale Evolution of PLES Quantity

As of 2020 (Table 6), ES covered an area of 168,996.09 km2, accounting for 68.31% of the total area, and stands as the predominant category. The EPS area is 60,658.36 km2, accounting for 24.52% of the total area. The PES area spans 15,989.58 km2, accounting for 6.46% of the total area. PLS has the smallest area of 1758.32 km2, accounting for 0.71% of the total area. Over the past 40 years, there have been changes in the areas of these PLES categories. The PES area increased by 2469.08 km2, equivalent to 1.00% of the total area. The PLS area experienced an increment of 742.32 km2, comprising 0.30% of the total area. Conversely, the EPS area decreased by 689.03 km2, accounting for 0.28% of the total area. The ES area saw a reduction in 2523.06 km2, representing 1.02% of the total area.
The comprehensive dynamic index of PLES has undergone increasingly dramatic changes over time (Table 7). The most significant change in the Comprehensive Dynamic Index occurred during the 2000–2010 period, registering a substantial increase in 0.08, which was notably higher than in other periods. This surge was primarily attributed to a sudden and considerable expansion of production space coupled with a gradual decrease in ecological space. During the study period, PES and PLS exhibited a large expansion trend, with a dynamic index of 1.83% and 7.31%, respectively. The most noticeable expansion for PES occurred during 2010–2020, with a change rate of 1.34%. Likewise, the most prominent expansion for PLS was observed during 2010–2020, with a dynamic rate of 3.71%. On the other hand, EPS and ES displayed a tendency to contract, with dynamic rates of −0.11% and −0.15%, respectively. EPS tended to initially decrease and then increase, whereas ES exhibited the opposite trend.
The conflict between cultivated land and construction land and forest, grassland, and desert land is prominent in the Hexi Corridor. The decrease in the area of ES and EPS is due to the fact that the development of the Hexi Corridor requires an increasing amount of construction land as the urbanization process accelerates and policies and strategies such as Western Development are promoted. The conversion of ES into EPS is mainly from unutilized land (sand, Gobi, etc.) to grassland and forest land. The area of EPS turns from decreasing to increasing, indicating the obvious role of ecological environmental protection projects in the Hexi Corridor. Typically, built-up land will only represent a small portion of land use, but the increase is nevertheless concerning due to the negative impacts of human activity concentrated in these areas [45]. Both the increase in areas of construction land and the conversion of desert land and Gobi to grassland and forest land place additional pressure on scarce water resources in this arid region [56,57].

3.2.2. The Characteristics of the Spatial Distribution Evolution of PLES Quantity

By comparing the transfer matrix for the four periods (Table 8), it was evident that the transfer area of PLES exhibited a significant increase in 2000–2010 and 2010–2020, particularly with a notable rise in the net transfer area of PES and PLS. In 2000–2010, the net transfer area of EPS was the largest, totaling 1862.98 km2, and the net transfer area of ES was also substantial, at 1586.38 km2. In 2010–2020, the net transfer area of PLS reached 475.35 km2, and the net transfer area of ES was 783.82 km2. Next, the transition matrix was visualized, and the evolution pattern of the PLES type was obtained (Figure 3). PES was composed of fragmented spaces that gradually connected into cohesive units. PLS space continued to expand, with stable point-like rural settlements, while planar urban settlements exhibit varying degrees of expansion. Linear PLS indicates a stronger connection between cities and towns. After experiencing a sharp reduction in EPS from 2000 to 2010, the period exhibited an expanding trend. ES has been showing a declining trend, but other spaces are also transforming into ES.
As illustrated in Figure 3a, Dunhuang experienced relatively calm periods in 1980–1990 and 1990–2000, a contraction of PLS in 2000–2010, and a significant increase in three groups in 2010–2020. The transition from ES to PLS is attributed to the local government’s promotion of the photoelectric industry. Figure 3b illustrates the PLS in Yumen, which increased in the 1980–1990, 1990–2000, and 2000–2010 periods and decreased in 2010–2020 due to resource exhaustion, leading to the town’s inability to sustain its past prosperity. Figure 3c depicts Jiayuguan as a newly emerging resource town, where PLS expansion was intense in 2000–2010 and 2010–2020, displaying distinct characteristics of group development. Figure 3d–g reveals the convergence of PLES evolution characteristics in the central oasis area of the Hexi Corridor. In most cases, ES transforms into PLS, PES, and EPS, indicating continuous expansion of the oasis area in the central and southern regions. Finally, as shown in Figure 3h, the ongoing transformation of ES into PES/EPS results from the Chinese government’s ecological restoration and regulation project in Minqin, successfully preventing the convergence of the Badain Jaran Desert and Tengger Desert.

3.3. Evolution of PLES Quality

Characteristics of Scale Evolution of PLES Quality

The five PLES functional scores (PLESFS) for 1980, 1990, 2000, 2010, and 2020 are represented on a grid scale of 1 km × 1 km. The threshold values of function scores for different periods are standardized. The spatial evolution characteristics of PLES quality in the Hexi Corridor are described by shrinking, maintaining, and expanding (Figure 4).
The high-value area of EPFS is mainly distributed in the central and southern parts of the Hexi Corridor, with most expansion areas being concentrated along riverbanks and major oasis areas. Northern areas, such as Guazhou and Yumen, show a linear expansion trend along the river. Regions in the middle of the corridor, including Jinta, Jiayuguan, Suzhou, Gaotai, Linze, and Ganzhou, exhibit concentrated continuous expansion similar to the oasis distribution in the middle of the Hexi Corridor. The primary expansion areas in the south, such as Minqin, Jinchuan, Yongchang, and Liangzhou, are valley delta plains formed by river alluvial and artificial irrigation areas covered by the Hongyashan reservoir.
The spatial distribution of PLFS is high in the south and low in the north, with various oases as the core. This is related to the fact that the local population is mainly concentrated in major oasis towns. The distribution of PLS expansion regions is more consistent with the high-value region of PLFS, showing characteristics of multi-center cluster expansion, but the expansion region is more widely distributed. This indicates that the distribution range of PLS also presents a diffusion trend. Four PLS clusters are formed in the Hexi Corridor, namely Dunhuang, Jiayuguan, Jinchuan, and Ganzhou.
The high-value area of EPFS is mainly concentrated near the Qilian Mountains, particularly in Sunan and Tianzhu. The melting glaciers of the Qilian Mountains have formed many inland rivers, and the grassland nearby is an important agricultural and pastoral area in the Hexi Corridor, with widely distributed cultivated land and grassland. EPFS expansion regions are located in the peripheral region of its high-value region, showing a diffusion trend. However, EPFS also exhibits a shrinking trend in some regions, primarily in Yongchang, Suju, and Shandan, due to the conversion of some woodland and grassland to arable land.
EFS tended to be high in the south and middle, coinciding with the southern and middle high-value regions, whereas it was low in the north. The distribution pattern of EFS is consistent with the geomorphic distribution pattern of the Hexi Corridor. The Qilian Mountain region, Shule River basin, Shiyang River basin, and Heihe River basin are not only important ecological resources in the Hexi Corridor but also high-value distribution areas of EFS. The EFS contraction area and expansion area are interwoven in the Hexi Corridor.

3.4. Geodetector-Based Analysis of Influence Factors for PLESFS Differentiation

Since some of the socio-economic data were collected only from 2000 onwards, only the periods 2000, 2010, and 2020 are considered in the content of this section. In this study, based on pertinent research findings on the driving mechanisms of PLES distribution [29,31], we selected 16 indicators that fell within 2 categories: natural factors and social and economic development factors. These indicators serve as independent variables for geographical exploration, whereas the PLES function score was designated as the dependent variable (Y). The natural factors examined herein included average annual temperature (X1), average annual precipitation (X2), normalized difference vegetation index (NDVI) (X3), average altitude (X4), average slope (X5), annual evaporation (X6), annual sunshine duration (X7), soil type (X8), and soil erosion degree (X9). The social and economic development factors included population density (X10), per capita GDP (X11), added value of the primary industry (X12), added value of the secondary industry (X13), added value of the tertiary industry (X14), and total grain production (X15). Considering data availability, this study encompassed three periods of data from 2000, 2010, and 2020 to measure the influence of each factor on the evolution of PLES, thereby gaining insights into the driving mechanism of both the quantity and quality of PLES.

3.4.1. Geodetector-Based Analysis of Natural-Social-Economic Factor Detection

The single-factor detection results of PLES spatial differentiation are illustrated in Figure 5. The p-values of each single factor are 0, and the results were tested at a 0.05 significance level. Our findings indicated that natural factors have a higher explanatory degree in the spatial differentiation of PLES, with this effect being dominated by ecological functions. The spatial differentiation of production and living functions was also largely explained by social and economic factors such as X3, X7, X9, and X10, whereas other factors contribute more to the spatial differentiation effect of PEFS in the study area. X9, X10, and other factors contributed more to the spatial differentiation effect of PLFS. X3, X6, X7, X8, and X9 contributed significantly to the spatial differentiation of EPFS and EFS.

3.4.2. Geodetector-Based Factor Interaction Detection Analysis

The interactive detection of the drivers of the PLES utility is shown in Figure 6. The interaction of any two of the 15 drivers is greater than that of a single factor, indicating that PLESFS is influenced by a combination of many factors. For PEFS, interactions between X3 and X10 had the greatest impact in 2000 and 2010, while interactions between X3 and X6 had the greatest impact in 2020. For PLFS, interactions between X3 and X11 had the greatest impact in 2000, X10 and X15 interactions had the greatest impact in 2010, and interactions between X3 and X10 had the greatest impact in 2020. For EPFS, interactions between X2 and X3 had the greatest impact in 2000 and 2010, and interactions between X3 and X6 had the greatest impact in 2020. For EFS, the interaction between X3 and X8 had the greatest influence in 2000, the interaction between X3 and X4 had the greatest influence in 2010, and the interaction between X1 and X3 had the greatest influence in 2020.

4. Discussion

When examining the spatial and temporal evolution and driving mechanisms of the ecotone in the Hexi Corridor, gaining insights into the diversity and complexity of land use is essential. The ecological transition zone exhibits significant environmental gradients, strong heterogeneity, and pronounced edge effects, leading to higher species richness and a more complex community structure. Moreover, this zone is particularly sensitive to global climate change. In contrast to existing studies, this paper assesses the spatial and temporal variability and formation mechanisms of PLES in the ecological transition zone of the Hexi Corridor, considering both the quality and quantity of PLES. This approach aids decision-makers in identifying inappropriate land protection and utilization strategies in specific regions based on the overall development characteristics of the area. Therefore, our findings provide a foundation for optimizing territorial spatial patterns as well as for land management and allocation.

4.1. Multifunctionality of Land Use

According to the needs of human beings at different levels, land has formed different types of land use and different land use structures. Structure determines function, and the products and services supplied under different land-use structures differ greatly, resulting in spatial differences in land-use functions [58]. Under the role of regional dominant functions, the spatial pattern of PLES is formed. Space is the carrier of function, and function is the important basis for identifying and optimizing PLES [21]. The multifunctionality of land use is the ability of a region to provide various products and services to human beings in a certain period of time during the process of human beings transforming and utilizing the land according to their needs, and it is a variety of functional characteristics formed by the interconnection and interaction of different types of land use, including living function, production function, and ecological function [59]. The multifunctionality of land use analyzes the well-being of land for human society from the perspective of supplying products and services demanded by human beings and reflects the ability of land use to meet human needs [60,61], which coincides with the essence of PLES identification and the optimization concept of “human-centeredness” [21].

4.2. Spatiotemporal Evolution of PLES

The findings indicate that the primary function of the ecotone in the Hexi Corridor is ecological, with the highest proportion of area and function score, aligning with results from other ecotone studies [27,31]. This result is consistent with the current regional development strategy and circumstances in the Hexi Corridor. Positioned between the Qilian Mountains and the Tengger Desert in northwest China, the Hexi Corridor boasts abundant resources and stands as a crucial grain-producing area in China. However, it faces challenges such as inadequate infrastructure and water resources [43]. Currently, the primary industry serves as the main source of local income, with industrial development gaining momentum. Consequently, the ecological function level in the ecological transition zone of the Hexi Corridor is notably prominent, whereas the production function falls in the lower-middle range and the living function is relatively low.
The spatial and temporal evolution of PLES in the Hexi Corridor differs significantly from economically developed areas [26,31]. In economically developed eastern coastal areas of China, the proportion of PS and LS areas is higher, the proportion of ES areas is lower, and the function scores for production and living are higher, while the ecological function scores are lower. What sets the Hexi Corridor apart from the development histories of other regions is the noticeable increase in the maximum ecological function score, indicating strengthened ecological environment protection in certain areas. However, at the same time, the decrease in the minimum score for ecological function also suggests environmental degradation in certain areas.

4.3. Impact Mechanisms of Driving Factors

The geodetector results highlight significant variations in the influence of 15 driving factors on PLEFS in the Hexi Corridor. NDVI (X3) was identified as the most influential factor affecting the spatial differentiation of PEFS, EPFS, and EFS in the study area. This can be attributed to the substantial diversity in land types and distinct variations in vegetation growth states within the Hexi Corridor [21]. Population density (X10) and GDP per capita (X11) explained the PLFS to the highest degree, indicating that population distribution interacts with the distribution of construction land and that there is a tendency for population agglomeration in urban oasis areas [38].
The results from both interactive detection and single-factor detection complement each other, providing a more comprehensive understanding of the driving mechanism. In the context of PLESFS, natural environmental factors, especially the demand for water resources, play a decisive role in variation within the Hexi Corridor. In arid regions with limited rainfall, the influence of X6 (annual evaporation) often surpasses that of X2 (average annual precipitation), indicating that transpiration has a greater impact on the formation of river systems, the growth of alpine meadows, and unused land such as deserts and the Gobi [43].
Analysis of the driving factors influencing the three life spaces in the Hexi Corridor suggests that the initial selection of spatial utilization patterns is driven by towns and villages according to local conditions. Afterward, the cumulative impact of various social activities and the formulation and implementation of policies continue to shape spatial functions, with socio-economic factors becoming crucial short-term influencers. However, with the ongoing urbanization process and the unique geographical factors of the Hexi Corridor, natural factors related to resource and environmental carrying capacity gradually assume a decisive role in the region’s transformations [26].

4.4. Influence of the Ecological Transition Zone of the Hexi Corridor

The evolution and driving factors of Production-Living-Ecological Space (PLES) spatial and temporal distribution are influenced by the natural conditions, location conditions, and the social and economic development level of the study area. While previous studies often attribute the spatiotemporal evolution of PLES in various regions to socio-economic factors such as economic development, urbanization level, and population growth [23,27,41], this study underscores the varying degrees of influence of the same factors on PLESFS in different periods. This observation highlights the complexity and diversity of PLES evolution in the Hexi Corridor. In the Hexi Corridor, natural factors play a predominant role in influencing the distribution of ES, whereas population and socio-economic factors exert a more substantial influence on the distribution of PS and LS. Densely populated areas with robust economic and social development experience spatial-temporal evolution primarily in cultivated land, construction land, and ecological land. The rapid urbanization in these areas intensifies the competition between environmental protection, food security, and economic development. Conversely, in the Hexi Corridor, where large-scale desert distribution was prevalent, factors such as climate, water resources, and natural conditions imposed greater constraints on environmental protection, food security, and economic development. Therefore, when discussing the mechanisms that drive PLES distribution in a region comprising several ecotones, such as the Hexi Corridor, natural conditions, social and economic development degree, and land use should be comprehensively considered.

4.5. Strategies and Suggestions for Sustainable Development and Space Management

The results of this study emphasize the significance of the NDVI as a major factor influencing the sustainable development of oases in the Hexi Corridor. Previous research has already highlighted the importance of precipitation and temperature in the increasing trend of NDVI in the region [62,63]. This aligns with the notion that water resources’ carrying capacity significantly impacts sustainable development in arid areas.
Based on these findings, our study proposes a spatial management and control strategy for the ecological transition zone of the Hexi Corridor to ensure production that meets needs while simultaneously avoiding irreversible degradation of soil, ecosystems, and water resources [37]. Based on our findings, we propose that spatial management and control strategies could be organized with respect to three distinct regions:
  • Qilian Mountains-front meadow area. This region, characterized by the distribution of ES and EPS (Figure 2), holds the highest ESFS (Figure 3). To preserve the native vegetation and conserve water and soil resources, the study recommends implementing strict use control policies in this area.
  • Oasis town area. This region is dominated by the distribution of PLS and PES in the Hexi Corridor; this region represents the primary distribution area of high-value agglomeration for PLFS and PEFS (Figure 2 and Figure 3). According to the river system that supplies each oasis, we suggest establishing upper limits for oasis town construction based on the water resources’ environmental carrying capacity. Additionally, promoting agricultural systems suitable for oases, exploring ecological agriculture and tourism, and facilitating industrial transformation are proposed strategies.
  • Desert-Gobi region. ES is mainly distributed in this region, accounting for more than 50% of the total area of the Hexi Corridor (Table 4). Soil and water conservation and ecological restoration in this area are emphasized. Based on our findings, we recommend establishing anti-desertification forests on the desert’s edge to enhance the protection of vegetation authenticity and integrity in desert areas.

5. Conclusions

Based on its complex geographical features, our study examined PLES distribution in the Hexi Corridor, focusing on the land use coverage data of the fifth period from 1980 to 2020, which was supplemented with other geospatial data and various socio-economic data. Particularly, we examined the spatiotemporal evolution and driving mechanism of PLES distribution in the Hexi Corridor. The main conclusions of this study are outlined below:
  • More than 99% of the Hexi Corridor’s total area is covered by spaces with ecological functions, demonstrating strong continuity. Specifically, Ecological Space (ES) covers over 65%, mainly distributed around the Qilian Mountains and Tengger Desert. Ecological-Production Space (EPS) accounts for about 25%, primarily in the grassland in front of the Qilian Mountains. Production-Ecological Space (PES) covers approximately 6%, concentrated in various oases within the corridor. Production-Living Space (PLS) constitutes less than 1%, mainly comprising oasis towns and villages.
  • From 1980 to 2020, the changes in the Hexi Corridor in the past 10 years were more profound than in the previous 30 years. Particularly, the spatial fluctuation of PLES has gradually become more drastic, shifting from ES and EPS to PES and PLS. The past decade has seen higher change intensity than the previous 30 years. Quality-wise, PLS, PES, and EPS function scores increased, while ES function scores decreased. High- and low-value areas of PLES functions exhibited an agglomerated distribution, with less occurrence of low and high clustering.
  • The spatial-temporal evolution of PLES in the Hexi Corridor results from the interaction of natural and socioeconomic factors. Nonlinear enhancements and two-factor enhancement effects were observed for each factor in the spatial-temporal evolution of PLES. Notably, NDVI (X3) had a significant influence on EFS, PEFS, and EPFS, while population density strongly affected PLFS. In the current conditions, the impact of annual evaporation is greater than that of annual precipitation.
Given the vastness and rich natural resources of the ecological transition zone in the Hexi Corridor, the study recommends formulating sustainable development strategies. It emphasizes the unique location, transportation advantages, and human conditions of the region. The proposed strategies highlight the corridor’s green ecological characteristics and underscore the importance of coordinated development in ecology, production, and living.

Author Contributions

Conceptualization, L.C.; Data curation, L.C.; Formal analysis, L.C.; Funding acquisition, X.T.; Methodology, X.T.; Project administration, X.T.; Software, L.C.; Supervision, P.D.; Validation, X.T. and P.D.; Writing—original draft, L.C.; Writing—review and editing, X.T. and P.D. All authors have read and agreed to the published version of the manuscript.

Funding

This research was funded by the National Natural Science Foundation of China, grant number 52068040.

Institutional Review Board Statement

Not applicable.

Informed Consent Statement

Not applicable.

Data Availability Statement

The original contributions presented in the study are included in the article.

Conflicts of Interest

The authors declare no conflicts of interest.

References

  1. Mendoza-Ponce, A.; Corona-Núñez, R.; Kraxner, F.; Leduc, S.; Patrizio, P. Identifying effects of land use cover changes and climate change on terrestrial ecosystems and carbon stocks in Mexico. Glob. Environ. Chang. 2018, 53, 12–23. [Google Scholar] [CrossRef]
  2. Dohong, A.; Aziz, A.A.; Dargusch, P. A review of the drivers of tropical peatland degradation in south-east Asia. Land Use Policy 2017, 69, 349–360. [Google Scholar] [CrossRef]
  3. Bryan, B.A.; Gao, L.; Ye, Y.; Sun, X.; Connor, J.D.; Crossman, N.D.; Stafford-Smith, M.; Wu, J.; He, C.; Yu, D.; et al. China’s response to a national land-system sustainability emergency. Nature 2018, 559, 193–204. [Google Scholar] [CrossRef] [PubMed]
  4. Álvarez, X.; Valero, E.; Santos, R.M.B.; Varandas, S.G.P.; Sanches Fernandes, L.F.; Pacheco, F.A.L. Anthropogenic nutrients and eutrophication in multiple land use watersheds: Best management practices and policies for the protection of water resources. Land Use Policy 2017, 69, 1–11. [Google Scholar] [CrossRef]
  5. Lathouwers, E.; Segers, Y.; Verstraeten, G. Reconstructing Valley Landscapes. GIS-analyses of past land use changes in three Flemish River Valleys since the late 18th century. Land Use Policy 2023, 135, 106960. [Google Scholar] [CrossRef]
  6. Alexandru, A.; Sushama, L. Impact of land-use and land-cover changes on CRCM5 climate projections over north America for the twenty-first century. Clim. Dyn. 2016, 47, 1197–1209. [Google Scholar] [CrossRef]
  7. Gebeyehu, A.K.; Snelder, D.; Sonneveld, B. Land use-land cover dynamics, and local perceptions of change drivers among Nyangatom Agro-Pastoralists, Southwest Ethiopia. Land Use Policy 2023, 131, 106745. [Google Scholar] [CrossRef]
  8. Nunez, S.; Alkemade, R.; Kok, K.; Leemans, R. Potential biodiversity change in Central Asian Grasslands: Scenarios for the impact of climate and land-use change. Reg. Environ. Chang. 2020, 20, 39. [Google Scholar] [CrossRef]
  9. Alexander, H. Nature’s Services: Societal dependence on natural ecosystems: Edited by Gretchen C. Daily Island press, 1997, $24.95, 392 Pages. Corp. Environ. Strategy 1999, 6, 219. [Google Scholar] [CrossRef]
  10. Somorin, O.A.; Brown, H.C.P.; Visseren-Hamakers, I.J.; Sonwa, D.J.; Arts, B.; Nkem, J. The Congo Basin Forests in a changing climate: Policy discourses on adaptation and mitigation (REDD+). Glob. Environ. Chang. 2012, 22, 288–298. [Google Scholar] [CrossRef]
  11. Winkler, K.; Fuchs, R.; Rounsevell, M.; Herold, M. Global land use changes are four times greater than previously estimated. Nat. Commun. 2021, 12, 2501. [Google Scholar] [CrossRef] [PubMed]
  12. Potapov, P.; Hansen, M.C.; Pickens, A.; Hernandez-Serna, A.; Tyukavina, A.; Turubanova, S.; Zalles, V.; Li, X.; Khan, A.; Stolle, F.; et al. The global 2000–2020 land cover and land use change dataset derived from the landsat archive: First results. Front. Remote Sens. 2022, 3, 856903. [Google Scholar] [CrossRef]
  13. Fan, J.; Wang, J.; Qiu, J.; Li, N. Stage effects of energy consumption and carbon emissions in the process of urbanization: Evidence from 30 provinces in China. Energy 2023, 276, 127655. [Google Scholar] [CrossRef]
  14. Ren, Q.; Liu, D.; Liu, Y. Spatial-temporal variation of ecosystem services and the response to urbanization: Evidence based on Shandong Province of China. Ecol. Indic. 2023, 151, 110333. [Google Scholar] [CrossRef]
  15. Cui, Q.; Tan, L.; Ma, H.; Wei, X.; Yi, S.; Zhao, D.; Lu, H.; Lin, P. Effective or useless? Assessing the impact of park entrance addition policy on green space services from the 15-min city perspective. J. Clean. Prod. 2024, 467, 142951. [Google Scholar] [CrossRef]
  16. Wang, J.; Sun, Q.; Zou, L. Spatial-temporal evolution and driving mechanism of rural production-living-ecological space in Pingtan Islands, China. Habitat. Int. 2023, 137, 102833. [Google Scholar] [CrossRef]
  17. Yu, Z.; Xu, E.; Zhang, H.; Shang, E. Spatio-temporal coordination and conflict of production-living-ecology land functions in the Beijing-Tianjin-Hebei region, China. Land 2020, 9, 170. [Google Scholar] [CrossRef]
  18. Zhou, Y.; Wen, L.; Wang, F.; Xu, C.; Weng, A.; Lin, Y.; Li, B. Exploring and predicting landscape changes and their driving forces within the Mulan River Basin in China from the perspective of production–living–ecological space. Sustainability 2024, 16, 4708. [Google Scholar] [CrossRef]
  19. Wang, D.; Fu, J.; Xie, X.; Ding, F.; Jiang, D. Spatiotemporal evolution of urban-agricultural-ecological space in China and its driving mechanism. J. Clean. Prod. 2022, 371, 133684. [Google Scholar] [CrossRef]
  20. Zhang, R.; Li, S.; Wei, B.; Zhou, X. Characterizing production–living–ecological space evolution and its driving factors: A case study of the Chaohu Lake Basin in China from 2000 to 2020. IJGI 2022, 11, 447. [Google Scholar] [CrossRef]
  21. Huang, A.; Xu, Y.; Lu, L.; Liu, C.; Zhang, Y.; Hao, J.; Wang, H. Research progress of the identification and optimization of production-living-ecological spaces. Prog. Geogr. 2020, 39, 503–518. [Google Scholar] [CrossRef]
  22. Liu, Y.; Li, J.; Yang, Y. Strategic adjustment of land use policy under the economic transformation. Land Use Policy 2018, 74, 5–14. [Google Scholar] [CrossRef]
  23. Xia, C.; Dong, Z.; Chen, B. Spatio-temporal analysis and simulation of urban ecological resilience: A case study of Hangzhou. Acta Ecol. Sin. 2022, 42, 116–126. [Google Scholar] [CrossRef]
  24. Li, J.; Zhang, H.; Xu, E. Quantifying production-living-ecology functions with spatial detail using big data fusion and mining approaches: A case study of a typical Karst region in Southwest China. Ecol. Indic. 2022, 142, 109210. [Google Scholar] [CrossRef]
  25. Yang, D.; Yang, Q.; Tong, Z.; Du, W.; Zhang, J. Coupling coordination analysis of production, living, and ecological spaces in wetlands: A case study of Xianghai Wetland nature reserve, China. Ecol. Indic. 2024, 158, 111578. [Google Scholar] [CrossRef]
  26. Fu, J.; Bu, Z.; Jiang, D.; Lin, G.; Li, X. Sustainable land use diagnosis based on the perspective of production–living–ecological spaces in China. Land Use Policy 2022, 122, 106386. [Google Scholar] [CrossRef]
  27. Zhou, H.; Wu, X.; Nie, H.; Wang, X.; Zang, S. Coupling coordination analysis and obstacle factors identification of rural living-production-ecological functions in a farming-pastoral ecotone. Ecol. Indic. 2024, 158, 111398. [Google Scholar] [CrossRef]
  28. Zhao, J.; Zhao, Y. Synergy/trade-offs and differential optimization of production, living, and ecological functions in the Yangtze River Economic Belt, China. Ecol. Indic. 2023, 147, 109925. [Google Scholar] [CrossRef]
  29. Xia, N.; Hai, W.; Tang, M.; Song, J.; Quan, W.; Zhang, B.; Ma, Y. Spatiotemporal evolution law and driving mechanism of production–living–ecological space from 2000 to 2020 in Xinjiang, China. Ecol. Indic. 2023, 154, 110807. [Google Scholar] [CrossRef]
  30. Liang, Y.; Xu, C. Knowledge diffusion of Geodetector: A perspective of the literature review and Geotree. Heliyon 2023, 9, e19651. [Google Scholar] [CrossRef]
  31. Zhang, L.; Hu, B.; Zhang, Z.; Liang, G. Research on the spatiotemporal evolution and mechanism of ecosystem service value in the Mountain-River-Sea transition zone based on “production-living-ecological space”—Taking the Karst-Beibu Gulf in Southwest Guangxi, China as an example. Ecol. Indic. 2023, 148, 109889. [Google Scholar] [CrossRef]
  32. Dai, L.; Tang, H.; Pan, Y.; Zhang, L. Assessment of ecosystem stability in the agro-pastoral transitional zone for local sustainable management: A case study in Duolun county, Northern China. Ecol. Indic. 2024, 162, 112018. [Google Scholar] [CrossRef]
  33. Aili, A.; Xu, H.; Xu, Q.; Liu, K. Aeolian dust movement and deposition under local atmospheric circulation in a desert-oasis transition zone of the Northeastern Taklimakan desert. Ecol. Indic. 2023, 157, 111289. [Google Scholar] [CrossRef]
  34. Yu, J.; Liu, D.; Wang, X.; Zhu, J.; Liao, Z.; Cai, J. A transition zone boundary determining method based on MIKE21: A case study of Baiyangdian lake, North China. J. Hydrol. 2024, 638, 131447. [Google Scholar] [CrossRef]
  35. Wang, X.; Chen, F.; Dong, Z. The relative role of climatic and human factors in desertification in semiarid China. Glob. Environ. Chang. 2006, 16, 48–57. [Google Scholar] [CrossRef]
  36. Yin, J.; Su, Y.; Fang, X. Climate change and social vicissitudes in China over the past two millennia. Quat. Res. 2016, 86, 133–143. [Google Scholar] [CrossRef]
  37. Fienitz, M. Taking Stock of Land Use Conflict Research: A systematic map with special focus on conceptual approaches. Soc. Nat. Resour. 2023, 36, 715–732. [Google Scholar] [CrossRef]
  38. Yang, L.; Feng, Q.; Adamowski, J.F.; Deo, R.C.; Yin, Z.; Wen, X.; Tang, X.; Wu, M. Causality of climate, food production and conflict over the last two millennia in the Hexi Corridor, China. Sci. Total Environ. 2020, 713, 136587. [Google Scholar] [CrossRef]
  39. Tang, L.; Liang, G.; Gu, G.; Xu, J.; Duan, L.; Zhang, X.; Yang, X.; Lu, R. Study on the spatial-temporal evolution characteristics, patterns, and driving mechanisms of ecological environment of the ecological security barriers on China’s land borders. Environ. Impact Assess. Rev. 2023, 103, 107267. [Google Scholar] [CrossRef]
  40. Tian, F.; Li, M.; Han, X.; Liu, H.; Mo, B. A production–living–ecological space model for land-use optimisation: A case study of the core Tumen River region in China. Ecol. Model. 2020, 437, 109310. [Google Scholar] [CrossRef]
  41. Duan, Y.; Wang, H.; Huang, A.; Xu, Y.; Lu, L.; Ji, Z. Identification and Spatial-temporal evolution of rural “production-living-ecological” space from the perspective of villagers’ behavior—A case study of Ertai Town, Zhangjiakou City. Land Use Policy 2021, 106, 105457. [Google Scholar] [CrossRef]
  42. Sun, X.; Zhang, B.; Ye, S.; Grigoryan, S.; Zhang, Y.; Hu, Y. Spatial pattern and coordination relationship of production–living–ecological space function and residents’ behavior flow in rural–urban fringe areas. Land 2024, 13, 446. [Google Scholar] [CrossRef]
  43. Feng, Q.; Yang, L.; Deo, R.C.; AghaKouchak, A.; Adamowski, J.F.; Stone, R.; Yin, Z.; Liu, W.; Si, J.; Wen, X.; et al. Domino effect of climate change over two millennia in ancient China’s Hexi Corridor. Nat. Sustain. 2019, 2, 957–961. [Google Scholar] [CrossRef]
  44. Feng, Q.; Miao, Z.; Li, Z.; Li, J.; Si, J.; S, Y.; Chang, Z. Public perception of an ecological rehabilitation project in Inland River Basins in Northern China: Success or failure. Environ. Res. 2015, 139, 20–30. [Google Scholar] [CrossRef] [PubMed]
  45. Shao, W.; Wang, Q.; Guan, Q.; Zhang, J.; Yang, X.; Liu, Z. Environmental sensitivity assessment of land desertification in the Hexi Corridor, China. CATENA 2023, 220, 106728. [Google Scholar] [CrossRef]
  46. Jia, G.; Hu, W.; Zhang, B.; Li, G.; Shen, S.; Gao, Z.; Li, Y. Assessing impacts of the ecological retreat project on water conservation in the Yellow River Basin. Sci. Total Environ. 2022, 828, 154483. [Google Scholar] [CrossRef] [PubMed]
  47. Liu, J.; Liu, Y.; Li, Y. Classification evaluation and spatial-temporal analysis of “production-living-ecological” spaces in China. Acta Geogr. Sin. 2017, 72, 1290–1304. [Google Scholar] [CrossRef]
  48. Dong, Z.; Zhang, J.; Si, A.; Tong, Z.; Na, L. Multidimensional analysis of the spatiotemporal variations in ecological, production and living spaces of Inner Mongolia and an identification of driving forces. Sustainability 2020, 12, 7964. [Google Scholar] [CrossRef]
  49. Wei, W.; Nan, S.; Xie, B.; Liu, C.; Zhou, J.; Liu, C. The spatial-temporal changes of supply-demand of ecosystem services and ecological compensation: A case study of Hexi Corridor, Northwest China. Ecol. Eng. 2023, 187, 106861. [Google Scholar] [CrossRef]
  50. Long, H.L.; Liu, Y.Q.; Li, T.T.; Wang, J.; Liu, A.X. A primary study on ecological land use classification. Soil. Environ. Sci. 2015, 24, 1–7. [Google Scholar]
  51. Zhang, Q.; Li, F. Correlation between land use spatial and functional transition: A case study of Shaanxi Province, China. Land Use Policy 2022, 119, 106194. [Google Scholar] [CrossRef]
  52. Zou, L.; Liu, Y.; Yang, J.; Yang, S.; Wang, Y.; Cao, Z.; Hu, X. Quantitative identification and spatial analysis of land use ecological-production-living functions in rural areas on China’s southeast coast. Habitat. Int. 2020, 100, 102182. [Google Scholar] [CrossRef]
  53. Yang, X.; Chen, X.; Qiao, F.; Che, L.; Pu, L. Layout optimization and multi-Scenarios for land use: An empirical study of production-living-ecological space in the Lanzhou-Xining city cluster, China. Ecol. Indic. 2022, 145, 109577. [Google Scholar] [CrossRef]
  54. Lu, S.; Zhou, Z.; Houding, M.; Yang, L.; Gao, Q.; Cao, C.; Li, X.; Bu, Z. Study into the evolution of spatiotemporal characteristics and driving mechanisms of production–living–ecological spaces on the Indochina Peninsula. Land 2023, 12, 1767. [Google Scholar] [CrossRef]
  55. Wang, J.; Xu, C. Geodetector: Principle and prospective. Acta Geogr. Sin. 2017, 72, 116–134. [Google Scholar] [CrossRef]
  56. Li, Y.; Liu, W.; Feng, Q.; Zhu, M.; Yang, L.; Zhang, J. Effects of land use and land cover change on soil organic carbon storage in the Hexi regions, Northwest China. J. Environ. Manag. 2022, 312, 114911. [Google Scholar] [CrossRef] [PubMed]
  57. Yang, L.; Feng, Q.; Lu, T.; Adamowski, J.F.; Yin, Z.; Hatami, S.; Zhu, M.; Wen, X. The response of agroecosystem water use efficiency to cropland change in northwest China’s Hexi Corridor. Agric. Water Manag. 2023, 276, 108062. [Google Scholar] [CrossRef]
  58. Huang, A.; Xu, Y.; Hao, J.; Sun, P.; Liu, C.; Zheng, W. Progress review on land use functions evaluation and its prospects. China Land Sci. 2017, 31, 88–97. [Google Scholar]
  59. Callo-Concha, D.; Denich, M. A participatory framework to assess multifunctional land-use systems with multicriteria and multivariate analyses: A case study on agrobiodiversity of agroforestry systems in Tomé Açú, Brazil. Chang. Adapt. Socio-Ecol. Syst. 2014, 1, 40–50. [Google Scholar] [CrossRef]
  60. Wiggering, H.; Dalchow, C.; Glemnitz, M.; Helming, K.; Müller, K.; Schultz, A.; Stachow, U.; Zander, P. Indicators for multifunctional land use—Linking socio-economic requirements with landscape potentials. Ecol. Indic. 2006, 6, 238–249. [Google Scholar] [CrossRef]
  61. Liu, C.; Xu, Y.; Huang, A.; Liu, Y.; Wang, H.; Lu, L.; Sun, P.; Zheng, W. Spatial identification of land use multifunctionality at Grid Scale in farming-pastoral area: A case study of Zhangjiakou city, China. Habitat. Int. 2018, 76, 48–61. [Google Scholar] [CrossRef]
  62. Guan, Q.; Yang, L.; Pan, N.; Lin, J.; Xu, C.; Wang, F.; Liu, Z. Greening and browning of the Hexi Corridor in Northwest China: Spatial patterns and responses to climatic variability and anthropogenic drivers. Remote Sens. 2018, 10, 1270. [Google Scholar] [CrossRef]
  63. Han, J.-C.; Huang, Y.; Zhang, H.; Wu, X. Characterization of elevation and land cover dependent trends of NDVI variations in the Hexi region, Northwest China. J. Environ. Manag. 2019, 232, 1037–1048. [Google Scholar] [CrossRef] [PubMed]
Figure 1. Map of the Hexi Corridor in the year 2020. (a) is the map of China; (b) is the DEM of the Hexi Corridor; and (c) shows the land use of the Hexi Corridor. (Land use data from CNLUCC, DEM data from the European Space Agency, administrative boundaries from the National Geomatics Center of China).
Sustainability 16 06698 g001
Figure 2. Spatial pattern of PLES from 1980 to 2020. Figures (a,b) represent Dunhuang and Yumen, respectively, located in the north of the Hexi Corridor; Figures (cf) are Jiayuguan, Suzhou, Ganzhou, and Shandan, located in the middle of the Hexi Corridor; Figures (g,h) are located in the south of the Hexi Corridor, encompassing Gulang, Jinchuan, and Minqin.
Sustainability 16 06698 g002
Figure 3. Spatial transformation of PLES. Figures (a,b) represent Dunhuang and Yumen, respectively, located in the north of the Hexi Corridor; Figures (cf) are Jiayuguan, Suzhou, Ganzhou, and Shandan, located in the middle of the Hexi Corridor; Figures (g,h) are located in the south of the Hexi Corridor, encompassing Gulang, Jinchuan, and Minqin.
Sustainability 16 06698 g003
Figure 4. Spatial pattern of PLES in the Hexi corridor.
Sustainability 16 06698 g004
Figure 5. Results of factor detectors.
Sustainability 16 06698 g005
Figure 6. Results of interaction detectors.
Sustainability 16 06698 g006
Table 1. Classification system of CNLUCC.
Class I Land Use TypeClass II Land Use Type
CodeTypeSub CodeName
1Cultivated land11Paddy field
12Dry land
2Forest land21Woodland
22Shrub wood
23Open woodland
24Other forest land
3Grassland31High coverage grassland
32Medium coverage grassland
33Low coverage grassland
4Water41Canal
42Lake
43Permanent glacier and snow
44Beach land
45Reservoir pit
5Construction land51Urban construction land
52Rural construction land
53Other construction land
6Unused land61Sand
62Gobi
63Saline alkali land
64Swamp
65Bare land
66Bare rock gravel ground
67Other unused land
Table 2. Other data sources.
Data NameSourceAccuracy
Average annual precipitation, temperature, evaporation, sunshine hours, NDVI, population density, and per capita GDPResources and Environmental Science and Data Center, Chinese Academy of Sciences http://www.resdc.cn (accessed on 15 April 2024)1 km × 1 km
Administrative divisions of the Hexi Corridor areaNational Center for Basic Geographic Information https://www.ngcc.cn/ (accessed on 15 April 2024)-
COP-DEMEuropean Space Agency https://panda.copernicus.eu/panda (accessed on 15 April 2024)30 m × 30 m
Other social and economic development dataChina County Statistical Yearbook, National Economic and Social Development bulletinsInterpolating the data as 1 km × 1 km
Table 3. Classification system of PLES in the Hexi Corridor. The Class II land use types here correspond to the CNLUCC (shown in Table 1 above).
PLESClass II Land Use TypeBasis of Categorization
Production-Ecological space (PES)Paddy fieldCultivated land has the function of providing ecosystem supply services for food and other biological products, as well as ecosystem support functions such as climate regulation, atmospheric regulation, nutrient cycling, and soil and water regulation. It is also an important land for agricultural production.
Dry land
Reservoir pitThe reservoir pit has an important ecological service function and is an important water conservation land, as well as a fishery production function.
Production-Living
Space (PLS)
Urban construction landConstruction land is the main land for human production and living.
Rural construction land
Other construction land
Ecological-Production Space (EPS)WoodlandForest land has the functions of climate regulation, atmospheric regulation, water and soil regulation and other ecosystem regulation, and plays an important role in biodiversity, and is known as the “lungs of the earth”, which is an important ecological land. Grassland has the functions of providing biological products, atmospheric regulation, climate regulation, water conservation, soil conservation, ecological landscape and recreation, and is an important ecological land. At the same time, woodlands can provide some products for human use, such as the fruits of some trees. Human livestock are grazing on grassland. Therefore, woodlands and grasslands have a partially productive function.
Shrub wood
Open woodland
Other forest land
High coverage grassland
Medium coverage grassland
Low-coverage grassland
Ecological Space (ES)CanalCanals and Lakes play an important role in regulating regional air temperature and stabilizing local climate; permanent glaciers and snow have the functions of water conservation and climate regulation, and are important ecological land. Unused land has important landscape ecological functions, and sandy, bare, and saline land are the natural land cover types and are important ecological sites.
Lake
Permanent glaciers and snow
Beach land
Sand
Gobi
Saline alkali land
Swamp
Bare land
Bare rock gravel ground
Other unused land
Table 4. Spatial scoring standard system of CNLUCC in the Hexi Corridor. The Class II land use types here correspond to the CNLUCC (shown in Table 1 above).
Class II Land Use TypeProduction-Ecological Functional Score (PEFS)Production-Living Functional Score
(PLFS)
Ecological-Production Functional Score
(EPFS)
Ecological Functional Score
(EFS)
Sub CodeName
11Paddy field4024
12Dry land3013
21Woodland0015
22Shrub wood0014
23Open woodland0023
24Other forest land2133
31High coverage grassland3035
32Medium coverage grassland2024
33Low coverage grassland1013
41Canal2005
42Lake2005
43Permanent glacier and snow4003
44Beach land0005
46Reservoir pit1025
51Urban construction land3500
52Rural construction land3500
53Other construction land1300
61Sand0001
62Gobi0001
63Saline alkali land0002
64Swamp0004
65Bare land0001
66Bare rock gravel ground0001
67Other unused land0001
Table 5. Classification system and spatial scoring standard system of PLES in the Hexi Corridor.
PLESClass II Land Use TypeProduction-Ecological Functional Score (PEFS)Production-Living Functional Score
(PLFS)
Ecological-Production Functional Score
(EPFS)
Ecological Functional Score
(EFS)
Production-Ecological Space (PES)Paddy field4024
Dry land3013
Reservoir pit4003
Production-Living
Space (PLS)
Urban construction land3500
Rural construction land3500
Other construction land1300
Ecological-Production Space (EPS)Woodland0015
Shrub wood0014
Open woodland0023
Other forest land2133
High coverage grassland3035
Medium coverage grassland2024
Low coverage grassland1013
Ecological Space (ES)Canal2005
Lake2005
Permanent glacier and snow0005
Beach land1025
Sand0001
Gobi0001
Saline alkali land0002
Swamp0004
Bare land0001
Bare rock gravel ground0001
Other unused land0001
Table 6. Area and proportion of PLES from 1980 to 2020.
DatePESPLSEPSES
Area/km2Proportion
/%
Area/km2Proportion
/%
Area/km2Proportion
/%
Area/km2Proportion
/%
198013,520.505.461016.000.4161,347.3924.80171,519.1569.33
199013,568.405.481018.340.4161,141.0324.71171,675.0869.39
200013,951.745.641084.730.4460,999.6524.66171,366.7369.27
201015,814.776.391282.970.5260,524.8724.46169,780.6368.63
202015,989.586.461758.320.7160,658.3624.52168,996.0968.31
Table 7. Dynamic Index of PLES from 1980 to 2020.
DateSingle Dynamic Index (%)Comprehensive Dynamic Index (%)
PESPLSEPSES
1980–19900.040.02−0.030.010.01
1990–20000.280.65−0.02−0.020.02
2000–20101.341.83−0.08−0.090.08
2010–20200.113.710.02−0.050.03
1980–20201.837.31−0.11−0.155.00
Table 8. Spatial transformation of PLES from 2000 to 2020.
DateSpace CategoryTransfer Area (km2)
PESPLSEPSESReduced Area
1980–1990 PES-1.5427.0265.3793.93
PLS0.40-0.010.010.41
EPS36.170.01-346.21382.39
ES105.281.20149.04-255.52
Increased area141.852.75176.07411.59-
1990–2000PES-52.4466.828.59127.85
PLS0.2-0.020.000.22
EPS253.796.86-45.35305.99
ES257.217.3297.76-362.30
Increased area511.2166.62164.6053.94-
2000–2010PES-72.51466.07146.65685.23
PLS75.24-4.6422.90102.77
EPS1044.5152.42-1400.242497.17
ES1428.46176.081551.62-3156.17
Increased area2548.21301.012022.331569.79-
2010–2020 PES-123.75456.40390.86971.00
PLS52.67-34.9052.88140.45
EPS523.1665.39-986.161574.71
ES569.98426.651217.09-2213.72
Increased area1145.81615.801708.381429.90-
1980–2020 PES-205.62387.13182.74775.49
PLS87.37-8.734.15100.25
EPS1229.06108.17-1502.492839.72
ES1928.13528.771754.96-4211.87
Increased area3244.57842.572150.821689.37-
Disclaimer/Publisher’s Note: The statements, opinions and data contained in all publications are solely those of the individual author(s) and contributor(s) and not of MDPI and/or the editor(s). MDPI and/or the editor(s) disclaim responsibility for any injury to people or property resulting from any ideas, methods, instructions or products referred to in the content.

