Abstract
As the global transportation sector increasingly adopts electric vehicles, the demand for advanced and accessible charging infrastructure is rising. In addition to at-home electric vehicle (EV) charging, there is a growing need for the swift development of commercial direct current fast charging (DCFC) stations to meet on-the-go EV charging demands. While government funds are available to support the expansion of the EV charging network in the United States, the establishment of a robust nationwide EV charging infrastructure requires significant private sector investment. This study was conducted to assess the economic feasibility of various business models for fast charging stations in the U.S. using two case studies and exploring different operational strategies including sole ownership and collaborative ventures with public and private entities. The results indicate that based on the current adoption and utilization rates in the U.S., the business model involving an owner-operator collaborating with a public partner ensures profitability and protects the investment in DCFC stations from financial losses. The study also highlights that demand charges and electricity retail prices are the factors that affect the profitability of a DCFC station.
1. Introduction
There is a growing concern regarding the accessibility of charging stations for electric vehicles (EVs), with a focus on reducing charging time and enhancing efficiency. As EVs continue to gain popularity in the United States (U.S.), there is a growing demand for a fast and reliable charging infrastructure. This infrastructure is essential not only for supporting the widespread adoption of EVs but also for mitigating climate change and fostering sustainable economic growth. The expansion of the direct current fast charging (DCFC) network is particularly important to bolster EV adoption [1,2,3]. According to a recent report published by the National Renewable Energy Lab [4], there was a significant 8.3% increase in DC fast EV supply equipment (EVSE) ports in Q3 2023. However, to meet the needs of a mid-adoption scenario where 33 million EVs are expected on U.S. roads by 2030, projections suggest that approximately 182,000 DC fast EVSE ports with a power output of 150 kW or higher would be necessary, along with 1,067,000 Level 2 public EVSE ports [5].
On the scientific front, researchers are working to create an efficient and effective charging network for EVs. The goal is to optimize the charging process, reduce time, and improve overall efficiency. Addressing these factors makes EV ownership more convenient and practical and ultimately increases adoption rates. Improving EV infrastructure involves the design of charging stations that are compatible with various EV models and charging technologies while emphasizing standardization and interoperability. It is crucial to optimize construction and installation costs, aiming to balance between affordability and scalability to enable the deployment of charging infrastructure in diverse locations. Implementing smart charging technologies, monitoring systems, and maintenance protocols ensures efficient operations and encourages private investments. Furthermore, a comprehensive approach to incentives, including vehicle purchase incentives, tax credits for charging infrastructure, and reduced electricity rates during off-peak hours, is necessary to promote EV adoption and the growth of charging infrastructure, fostering a favorable environment for both consumers and investors.
The Bipartisan Infrastructure Law and Inflation Reduction Act of 2021 [6] is the most significant legislation to accelerate transportation electrification in U.S. history, providing $7.5 billion to support the buildout of electric vehicle (EV) infrastructure and an additional $43 billion (not including loans and tax incentives) in flexible spending (battery manufacturing, grid updates, retooling auto industry facilities, and retraining and rehiring existing auto workers). In a parallel effort, the Federal Highway Administration introduced the National Electric Vehicle Infrastructure (NEVI) Program in 2022. This initiative allocates a budget of $5 billion over the ensuing five years to enhance the nation’s infrastructure with a primary emphasis on the installation of EV chargers. By expanding the charging network, the program aims to address the availability and accessibility of charging stations. Furthermore, the formation of the National Electric Highway Coalition, which was announced by the Edison Electric Institute, involves 51 electric companies collaborating to establish a widespread network of DC charging stations. The overarching objective of this coalition is to facilitate long-distance travel for EV owners by ensuring they have access to fast-charging facilities across the country. Despite the availability of these funds, building a reliable EV charging infrastructure faces various challenges including site selection, utility infrastructure, permitting, private investment, and regulatory compliance. To meet the ambitious goals set by the U.S. government, it is vital to understand and explore the complexities associated with charging station deployment and advocate for additional support and resources through private investments to meet the growing demand for EV charging infrastructure.
Research on the economic aspects of DCFC infrastructure in the U.S. has been relatively limited, primarily relying on analyses focused on the owner-operator model and areas with high EV adoption rates [7,8,9,10,11,12,13]. This narrow scope has left a considerable gap in the literature regarding a broad spectrum of investment strategies for DCFC infrastructure, which is essential for the widespread adoption of EVs. Expanding this research to encompass a variety of investment models and broader geographical areas could provide deeper insights into the financial dynamics that underpin the EV charging infrastructure market. This broader approach would significantly contribute to understanding how to effectively scale DCFC infrastructure to support the growth of the EV market while ensuring the economic sustainability of these investments.
To address these economic complexities associated with the fast charging infrastructure in the U.S., this research study was conducted with the following objectives:
- Understand various components that contribute to the lifecycle cost of owning and operating DCFC stations;
- Evaluate the economic viability of deploying DCFC stations by analyzing various investment scenarios using the Net Present Value analysis;
- Conduct sensitivity analysis to evaluate the impact of key variables such as electricity prices, charging tariffs, and utilization rates on the economic viability of DCFC deployment.
By offering insights derived from economic analysis, this study seeks to assist stakeholders in making well-informed decisions about investments and infrastructure development, thus facilitating the meeting of the escalating demand for EV charging infrastructure in the United States.
The rest of the paper is organized as follows. Section 2 presents the literature review focused on the need and ownership cost of fast charging infrastructure in the U.S. Section 3 explains the methodology, including publicly available datasets utilized to conduct the economic analysis. Section 4 presents the data analysis, followed by sensitivity analysis in Section 5. Finally, concluding remarks are included and future research directions are discussed.
2. Literature Review
2.1. Need of Fast Charging Infrastructure
Transportation accounts for about one-third of total global energy consumption, with road vehicles accounting for nearly 80% of the third (using mostly fossil fuel) [14]. Electrified transportation currently only accounts for 1.4% of total energy usage [15], emphasizing the impact of transportation electrification on the current grid with an increase in electrical demand due to the transition of the transportation fleet. The projected power for publicly available fast chargers will require 400 GW of installed capacity and over 100 TWh by 2030 [16,17]. To meet this demand, the grid deployment must follow a strategic path for the charging infrastructure.
The development of charging infrastructure has gained significant attention globally, as inadequate charging infrastructure can affect EV promotion in the market [18]. Due to the increasing proportion of the EV market [19], operating public charging infrastructure tends to become more profitable. While many public charging stations installed until early 2022 were subsidized by the government, some countries are reaching a point where it could be financially viable for the private sector to install and operate stations without public funding [16]. Private or public electricity producers and distributors may also benefit from investing in charging infrastructure, as it can increase electricity sales for EVs and benefit all ratepayers. This has led energy providers and car manufacturers to invest in public charging infrastructure increasingly, indicating that it is becoming a more attractive business opportunity [16,20].
The U.S. Federal Government aims to have 500,000 public EV chargers in the U.S. by 2030. Currently, there are approximately 148,000 public chargers across the country, with the cities of Los Angeles, San Francisco, and Seattle having a higher EV adoption rate. Over the past couple of years, around $1.6 billion in funding has been approved for charging infrastructure, with the majority coming from New York and California [3]. Volkswagen has pledged $2 billion for charging infrastructure as part of the Dieselgate settlement, and other automakers are also investing independently or through partnerships with charging companies. Automakers, including BMW, General Motors, and Nissan, have a combined capitalization of around $15 billion, making significant investments in addressing the need for charging infrastructure [21]. Utility transportation electrification plans continue to be approved due to their broad economic benefits. Electric companies are in a favorable position to invest, taking various approaches including developing “make-ready” infrastructure (connection upgrades) and installing and owning infrastructure and charging equipment [21]. The estimated investment required for public and workplace chargers in the U.S. between 2021 and 2030 is $28 billion, whereas DCFCs make up 7% of these chargers, provide 57% of the charging energy, and represent 66% of the costs [3]. Federal policies can play a role in supporting these investments by implementing incentives such as federal tax credits. By sharing the costs and involving providers in the long-term success of the charging installations, tax credits can incentivize the expansion of charging infrastructure.
Proper management of charging power is necessary to maintain grid stability and ensure the balance between the demand and supply of power. Hence, it is important to understand the relationship between EVs and the grid. Over the last quarter of 2022, the number of EV ports with a power output over 250 kW increased by 25.9% in the U.S. Today, DCFC and extreme fast charging (XFC) can provide charging power levels between 50 kW and 350 kW or more [22]. However, the installation of new fast-charging stations requires a significant increase in power generation just to meet the charging demand of EVs and to upgrade transmission and distribution infrastructure. According to the U.S. Federal Zero-Emission Target of 2030, the annual demand for electricity will surge from 11 billion kWh to 230 billion kWh in 2030 if there is a 15% penetration of EVs [22].
Charging stations vary by design and have different charging functionalities, making them adaptable and suit any client’s and EV’s needs. DCFCs are popular because they reduce charging times to less than 30 min for a full charge. These stations are available for the public to use, but due to their limited availability, they are the main reason for the infrastructure demand. DC fast charging is supported by different connector standards, including Combo Charging System (CCS), CHAdeMO, and Tesla Supercharger [23]. Standardization of EV community charging infrastructure is crucial to accommodate EVs from various manufacturers with different specifications and charging standards because it is not feasible to offer all types of charging options at every charging station [24]. The increase in demand assumes that there will be technological improvements in the vehicles and greater availability of high-power charging. The total public power output analysis refers to the maximum power output that is publicly accessible simultaneously. However, some charging pools may have power-sharing capabilities that can limit the charging stations’ power output due to grid capacity [20].
2.2. Ownership Costs of a DC Fast Charger Station
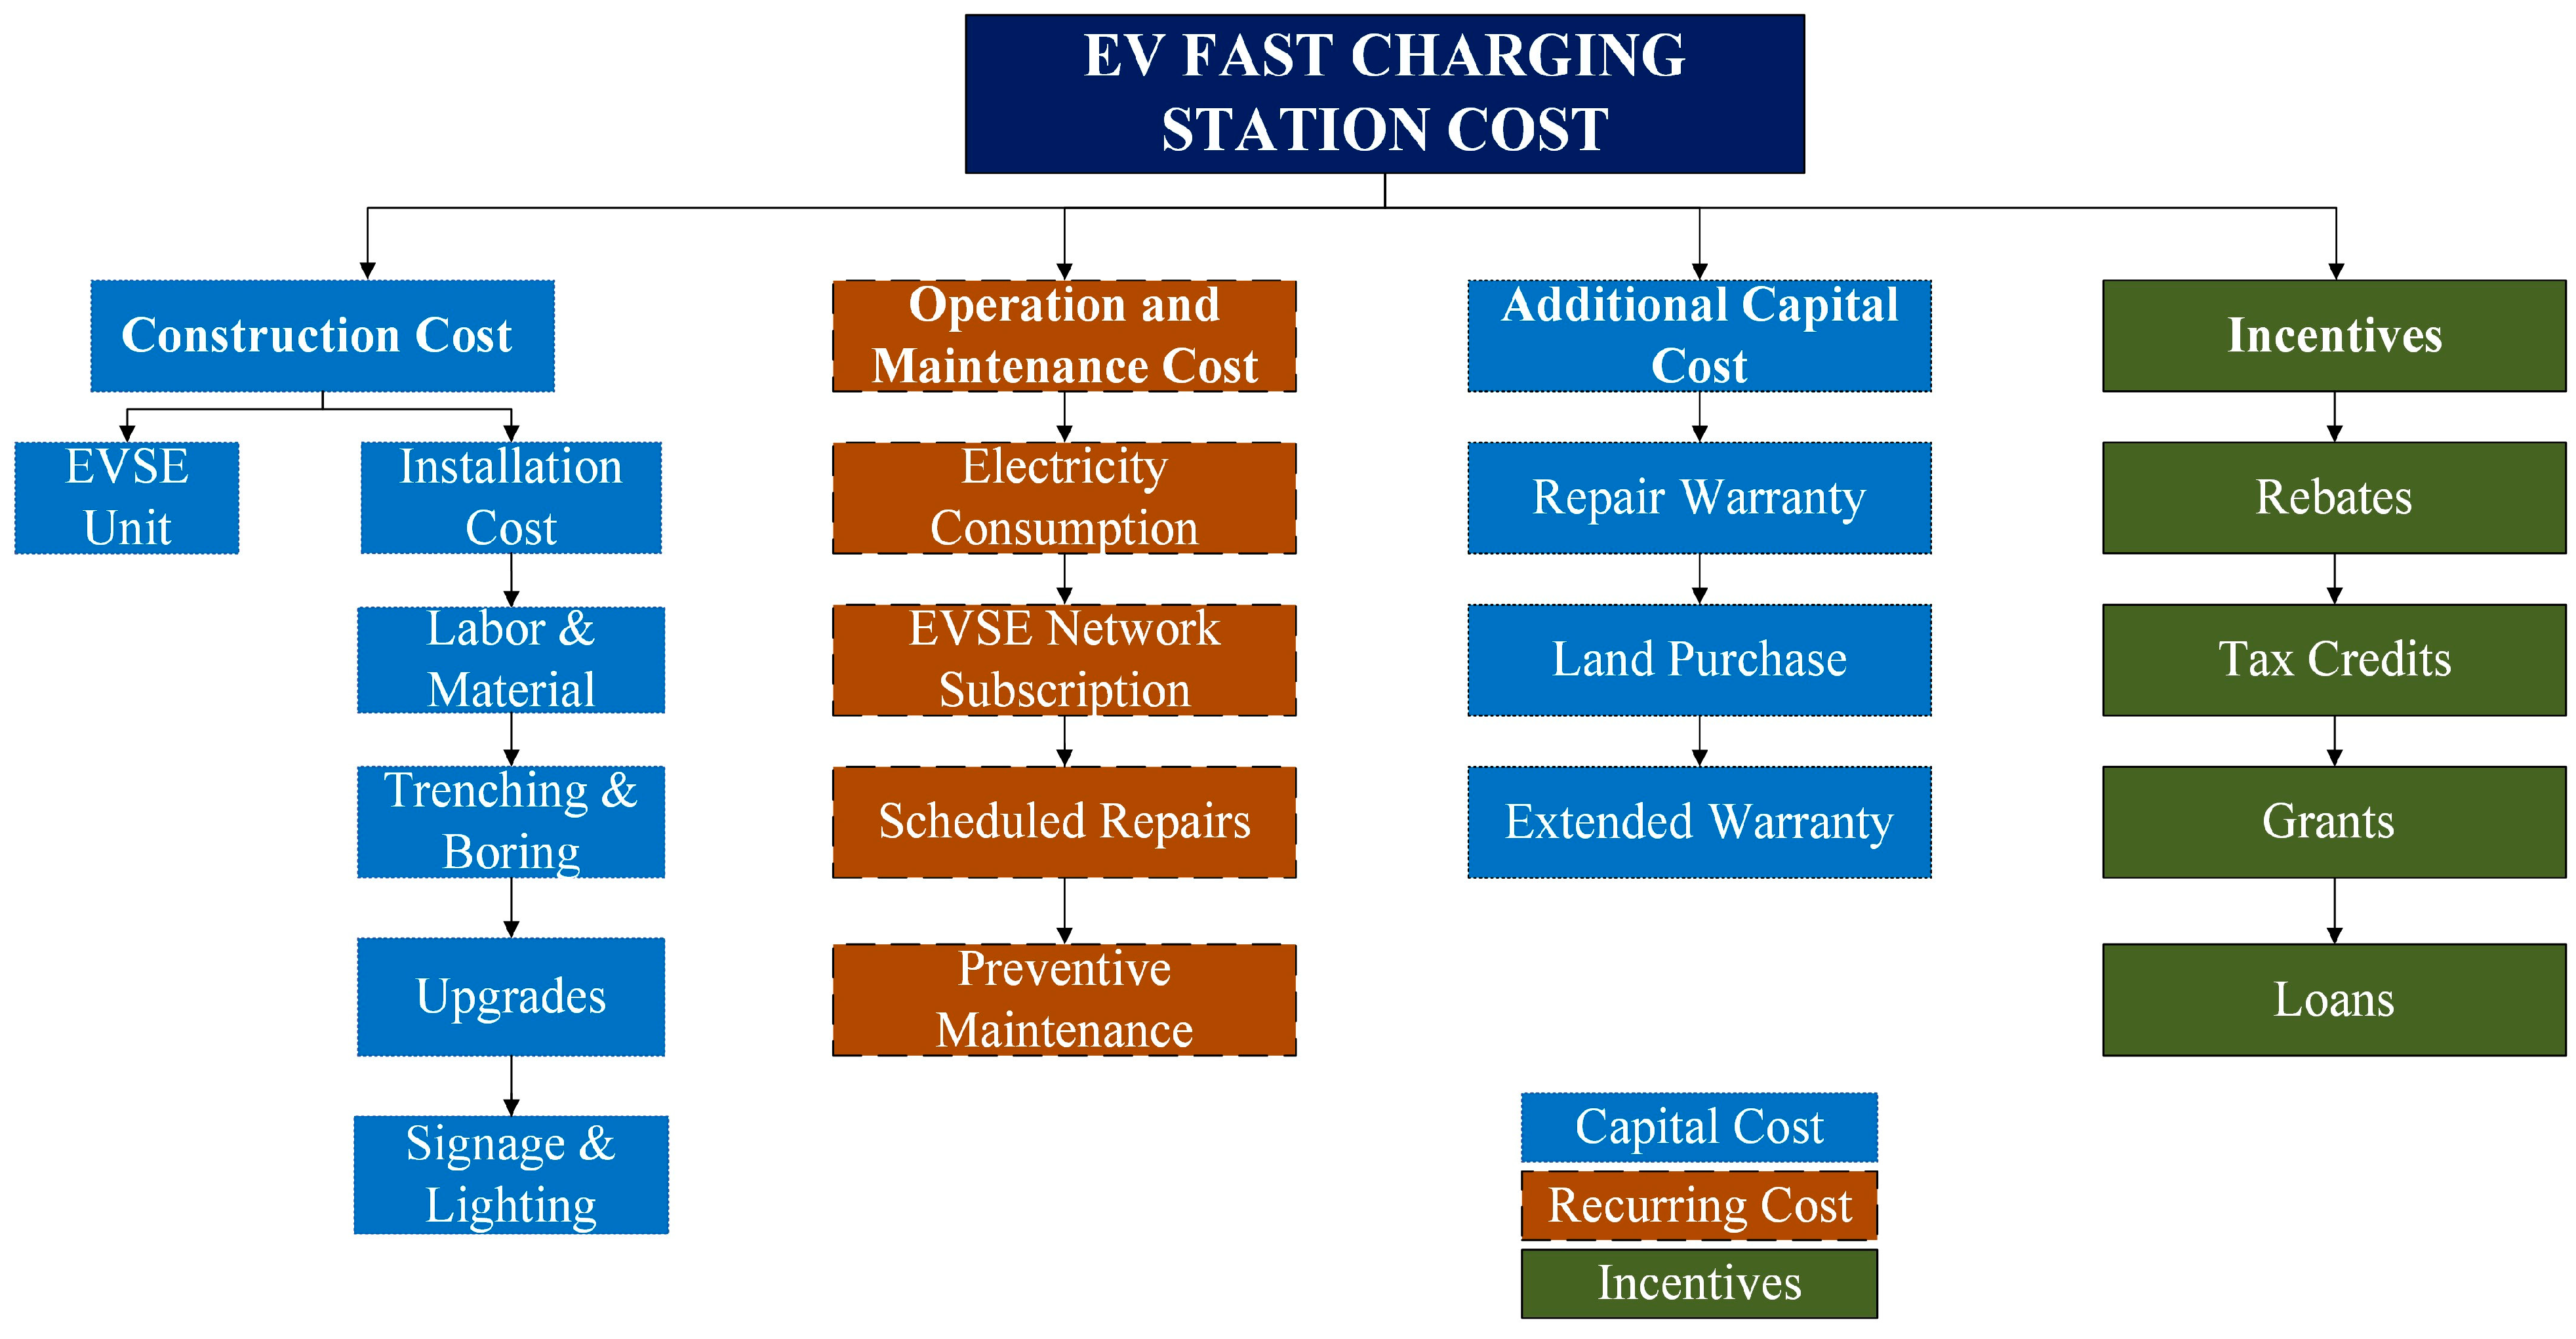
The ownership costs of a DCFC station include various components such as initial infrastructure investment, ongoing operational expenses, and long-term maintenance costs (Figure 1). The primary capital outlay involves the purchase and installation of charging equipment, power supply infrastructure, and site development. Depending on factors such as the number of charging ports, power capacity, and location, the upfront investment for a DCFC station can range from tens of thousands to hundreds of thousands of dollars. Additionally, regulatory requirements, land acquisition, and permitting processes can add to the initial costs and project timelines. According to a study conducted by the Rocky Mountain Institute [25], the cost range for a 50 kW DCFC station falls between $20,000 and $150,000. In contrast, data from the California Electric Vehicle Infrastructure Project, which are self-reported by site applicants seeking rebates from the California Energy Commission (CEC), show a total project cost per DC fast charger ranging from $75,841 to $118,131 [26,27]. Beyond the initial investment, ongoing operational expenses consist of electricity consumption, network connectivity fees (if applicable), and site maintenance. Electricity costs represent a significant portion of the operational budget, especially for high-power DCFC stations serving numerous vehicles daily. Network connectivity fees may apply for stations integrated into charging networks, facilitating remote monitoring, billing, and user access management. Moreover, routine maintenance, equipment servicing, and occasional upgrades are essential to ensure the reliability and safety of DCFC stations, adding to the long-term ownership expenses.

Figure 1.
Components of a financial model for the construction, operation, and maintenance of a commercial fast charging station.
Reducing the ownership costs of DCFC stations through federal or local incentives requires leveraging available programs and incentives tailored to support electric vehicle infrastructure development. Furthermore, streamlined permitting processes, zoning incentives, and reduced or waived fees for land use or electricity connections can help lower the overall ownership costs of DCFC stations. Collaborating with local governments, utilities, and community stakeholders to advocate for supportive policies and funding initiatives can also create an enabling environment for EV infrastructure development, reducing barriers and costs for station owners.
2.2.1. Capital Cost
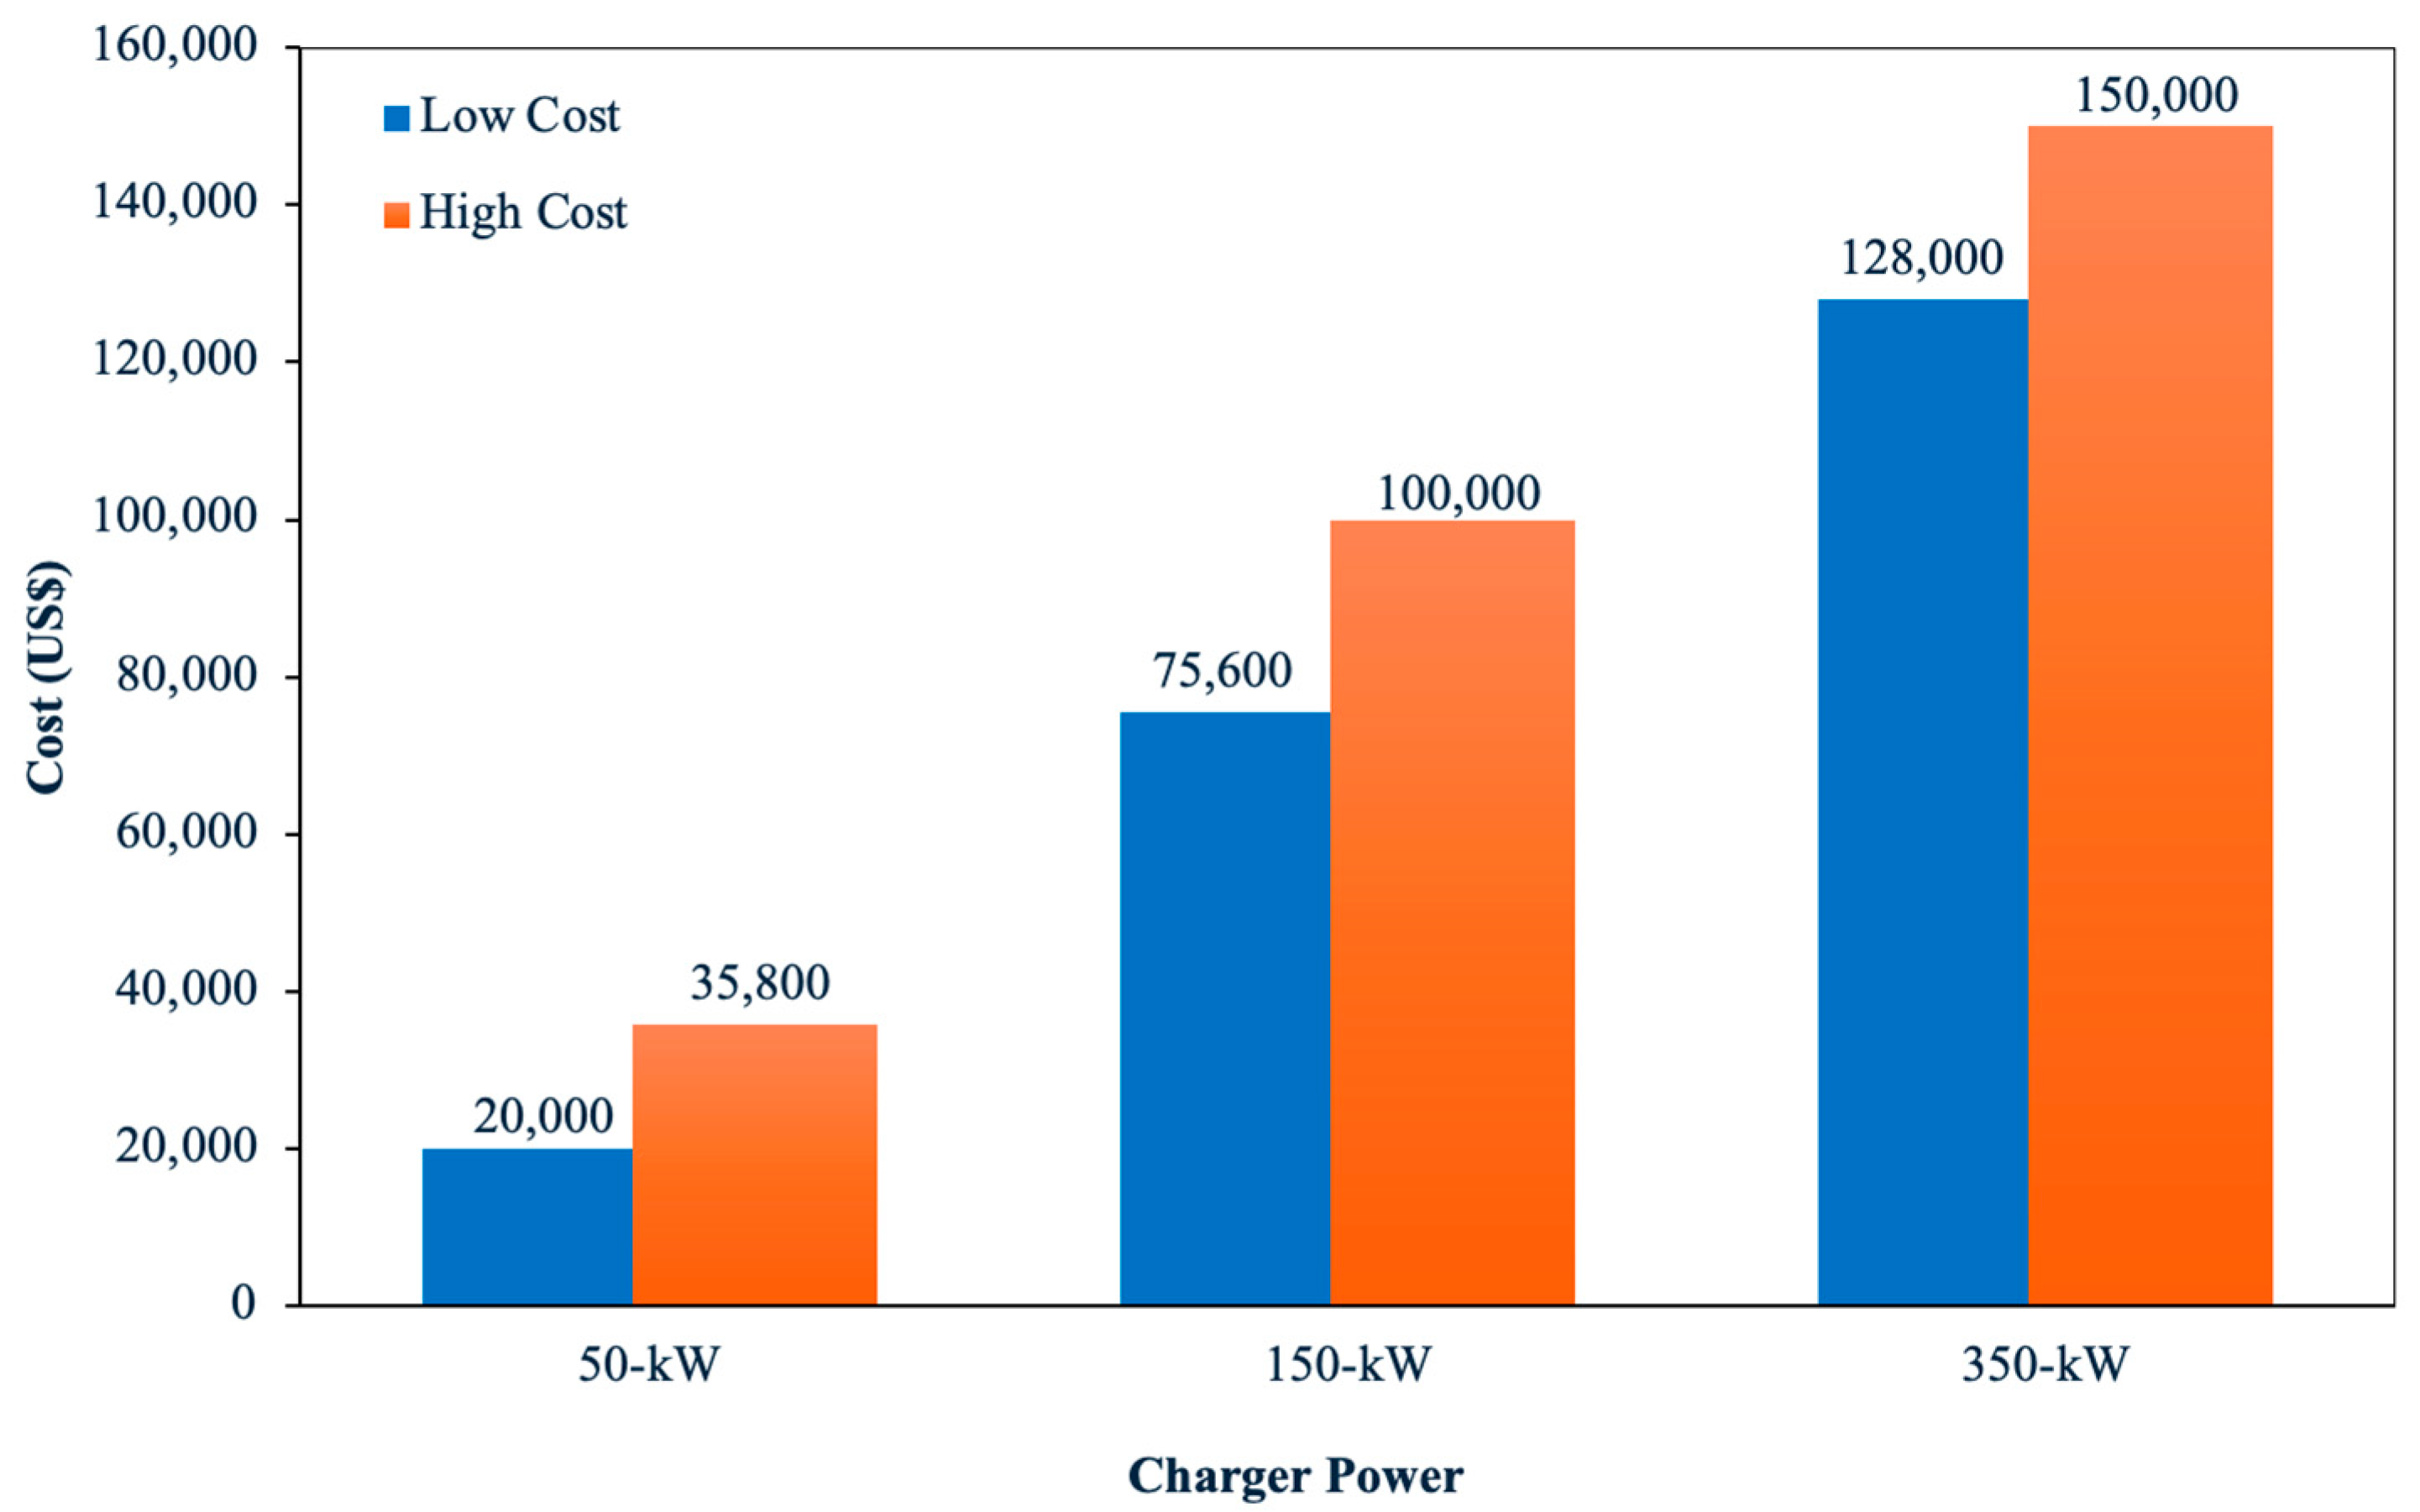
When it comes to DCFC, the cost is closely tied to the power rating of the charger. Generally, the higher the charger’s power rating, the greater the associated cost. However, it is important to note that the relationship between power and cost is not strictly linear. High-power DCFC requires specialized features to manage the increased power output effectively (Figure 2) [18,25,28]. For instance, these chargers often necessitate liquid-cooled cables to mitigate the risk of overheating while delivering more power. This cooling mechanism enables the chargers to operate at higher capacities without compromising safety or performance. Additionally, to ensure practical usability, high-power chargers must strike a balance between power output and physical weight. Thus, engineering considerations are crucial to ensure that these chargers remain lightweight enough for users to handle comfortably while delivering the required power levels. As a result, the design and manufacturing complexities associated with these advanced features contribute to the overall cost of high-power DCFC stations.

Figure 2.
Range of DC fast charger costs [25].
DCFC stations usually incorporate the essential electrical infrastructure for electric vehicles, ensuring sufficient power to charge 80% of a car within 30 min. This necessitates a substantial retrofit, typically involving 480 V AC at the input. Location impacts the cost of DCFC installation because city ordinances require fees, depending on how it is connected to the city’s electric circuit or a third-party provider [29]. Another associated cost is the type of internet connection; EV chargers should be connected to the internet to allow EV software systems to monitor their use, allowing for software updates, data recollection, and communication [30,31,32,33]. Like other system-tracking software, it is essential to forecast and determine how well operations are going and if additional tweaks are needed to the piece of equipment. Depending on where the chargers are plugged in, there may be need for a stronger a panel. Electricity connection from a building or power source will need to be flown in after panel work, trenching, and parking lot repaving. Metering systems are required to measure the voltage, current, and power of the EV charger or charging station. Metering systems also take the information and transfer the data out of the system into communication lines. Software and payment attachments can also be added to the station along with their subscription fees. Public charging stations are the costliest due to their requirement to connect to a citywide public network. Contracted work labor costs depend on the construction hours, with labor union costs adding an extra 20% to the contracted amount [32,33].
2.2.2. Maintenance and Operation Cost
The maintenance cost of DCFC stations constitutes a significant aspect of their operational expenses. These costs encompass routine upkeep, repairs, and periodic upgrades necessary to ensure that stations function reliably and efficiently (Table 1). Several factors contribute to the maintenance expenses of DCFC stations. Firstly, the complexity of the charging infrastructure, including power electronics, cooling systems, and high-voltage components, necessitates regular inspections and maintenance to prevent malfunctions and ensure user safety. Additionally, environmental factors such as temperature variations, exposure to dust, moisture, and electrical surges can accelerate wear and tear, requiring proactive maintenance measures. Furthermore, as DCFC technology advances and regulatory standards evolve, stations may require updates or retrofits to remain compliant and compatible with emerging electric vehicle (EV) models and charging protocols.

Table 1.
EV charging station–Maintenance cost factors [33].
According to a study by the International Council on Clean Transportation (ICCT) on the total cost of ownership for electric vehicles, maintenance costs for DCFC stations typically range from 7% to 10% of the total operational expenses over the lifetime of the infrastructure [3]. This includes expenditures on equipment servicing, technician labor, spare parts, and software updates. Most networks also offer a maintenance plan for an additional annual fee. According to the California Energy Commission’s EV Charger Selection Guide [26], annual extended warranties for DC fast chargers can cost over $800 per charger per year. Moreover, data from industry reports and case studies provide insights into specific maintenance cost trends and best practices adopted by operators to optimize the reliability and cost-effectiveness of DCFC networks [25,34]. By implementing proactive maintenance strategies, leveraging predictive analytics, and investing in durable, high-quality equipment, operators can mitigate downtime, reduce repair expenses, and enhance the long-term sustainability of DCFC infrastructure.
2.2.3. Infrastructure Development Incentives and Private Investment
Numerous studies have highlighted the vital role of government incentives in the expansion of charging infrastructure [35,36,37,38]. The landscape of EV charging infrastructure incentives in the U.S. is dynamic and multifaceted, with support coming from various sources including federal resources, private electric companies, and local governments. These incentives are crucial in promoting the growth of EV charging networks and encouraging the widespread adoption of electric vehicles. In the U.S., incentives often come in the form of rebates, fee coverage, and assistance with installation costs, making it financially appealing for businesses and individuals to invest in EV charging stations.
One significant driving force behind these incentives is the National Electric Vehicle Infrastructure Program (NEVI), a federal initiative aimed at accelerating the deployment of EV charging infrastructure. The NEVI program plays a pivotal role in providing funding and support to construct more electric charging stations across the country, but the funding varies between the states. For example, Texas is projected to receive over $86 million in NEVI funding, while Utah has a notable allocation of $7.7 million. Similarly, the National Electric Highway Coalition further amplifies the push for EV charging infrastructure expansion. With its substantial funding acceptance program of $3.7 billion, this coalition challenges entities across states to be more open and proactive in implementing incentive plans. The funding provided by the coalition serves as a catalyst for innovation and collaboration, encouraging states, private companies, and local governments to work together to create a comprehensive and accessible charging infrastructure. As the demand for electric vehicles continues to rise, the incentives offered by federal, private, and local entities become pivotal in ensuring the accessibility and affordability of EV charging solutions.
Although these funds and incentives will contribute significantly to the development of an expanded charging network, private investment is needed to bring additional capital into the EV charging sector, enabling faster deployment and expansion of charging networks. With the rising adoption of electric vehicles, especially in urban areas, the demand for convenient and accessible charging infrastructure is growing rapidly. Private investors can contribute funding, expertise, and innovation to accelerate the development of DCFC stations, addressing this increasing demand and promoting EV adoption. By supplementing public funding with private sector innovation and efficiency, the U.S. can maximize the impact of government programs like NEVI, accelerating the deployment of DCFC infrastructure and facilitating the transition to sustainable transportation.
3. Methodology
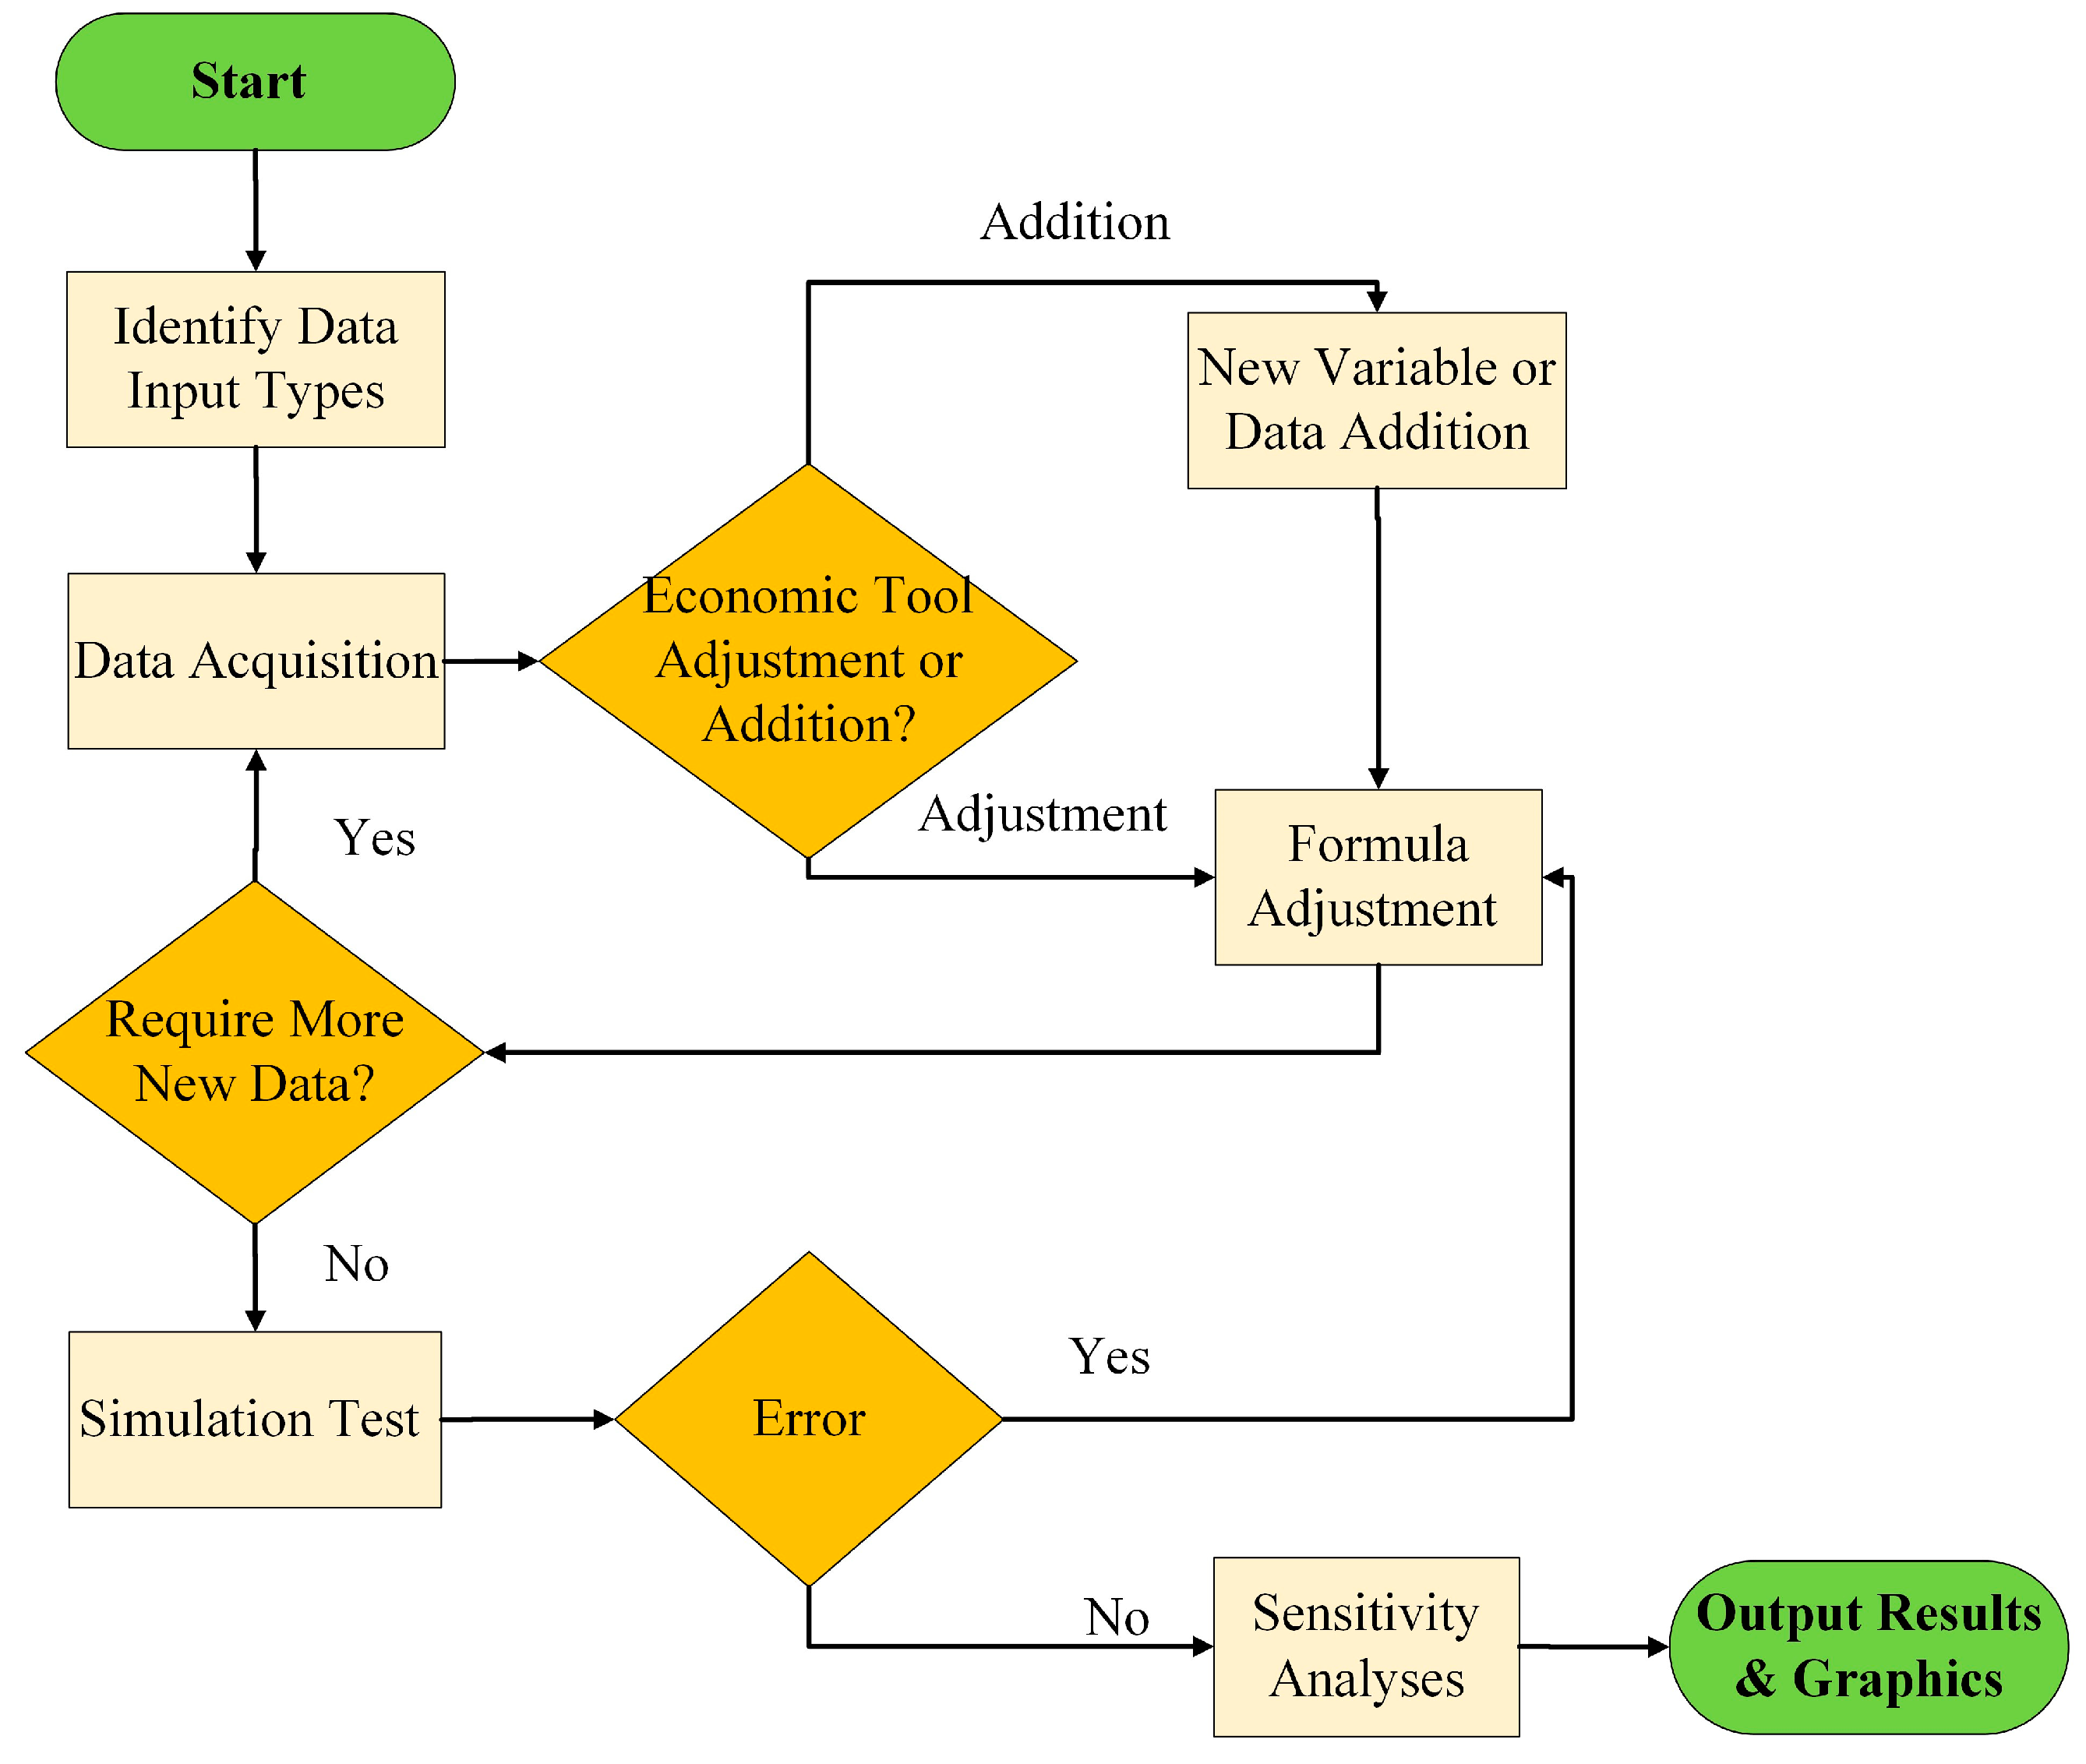
Figure 3 shows the methodology used for this case study. The process was completed in three steps: data acquisition, economic analysis, and sensitivity analysis to gain greater insights into the most significant cost factors. The Net Present Value (NPV) analysis was used to assess the financial health of the DCFC stations at the selected sites. Additionally, sensitivity analysis was performed to understand how changes in key assumptions (like the cost of capital, charge rates, or utilization rates) impact the profitability for various business scenarios.
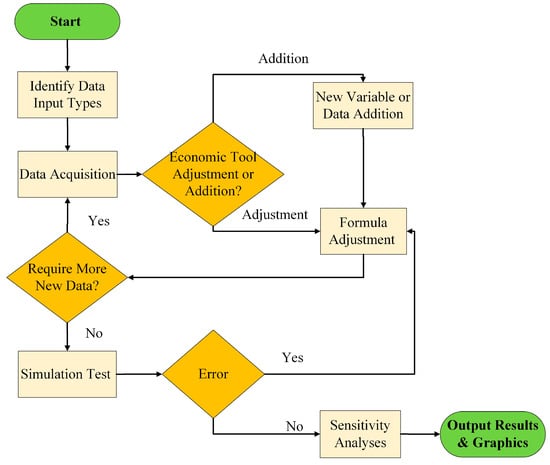
Figure 3.
Research Methodology.
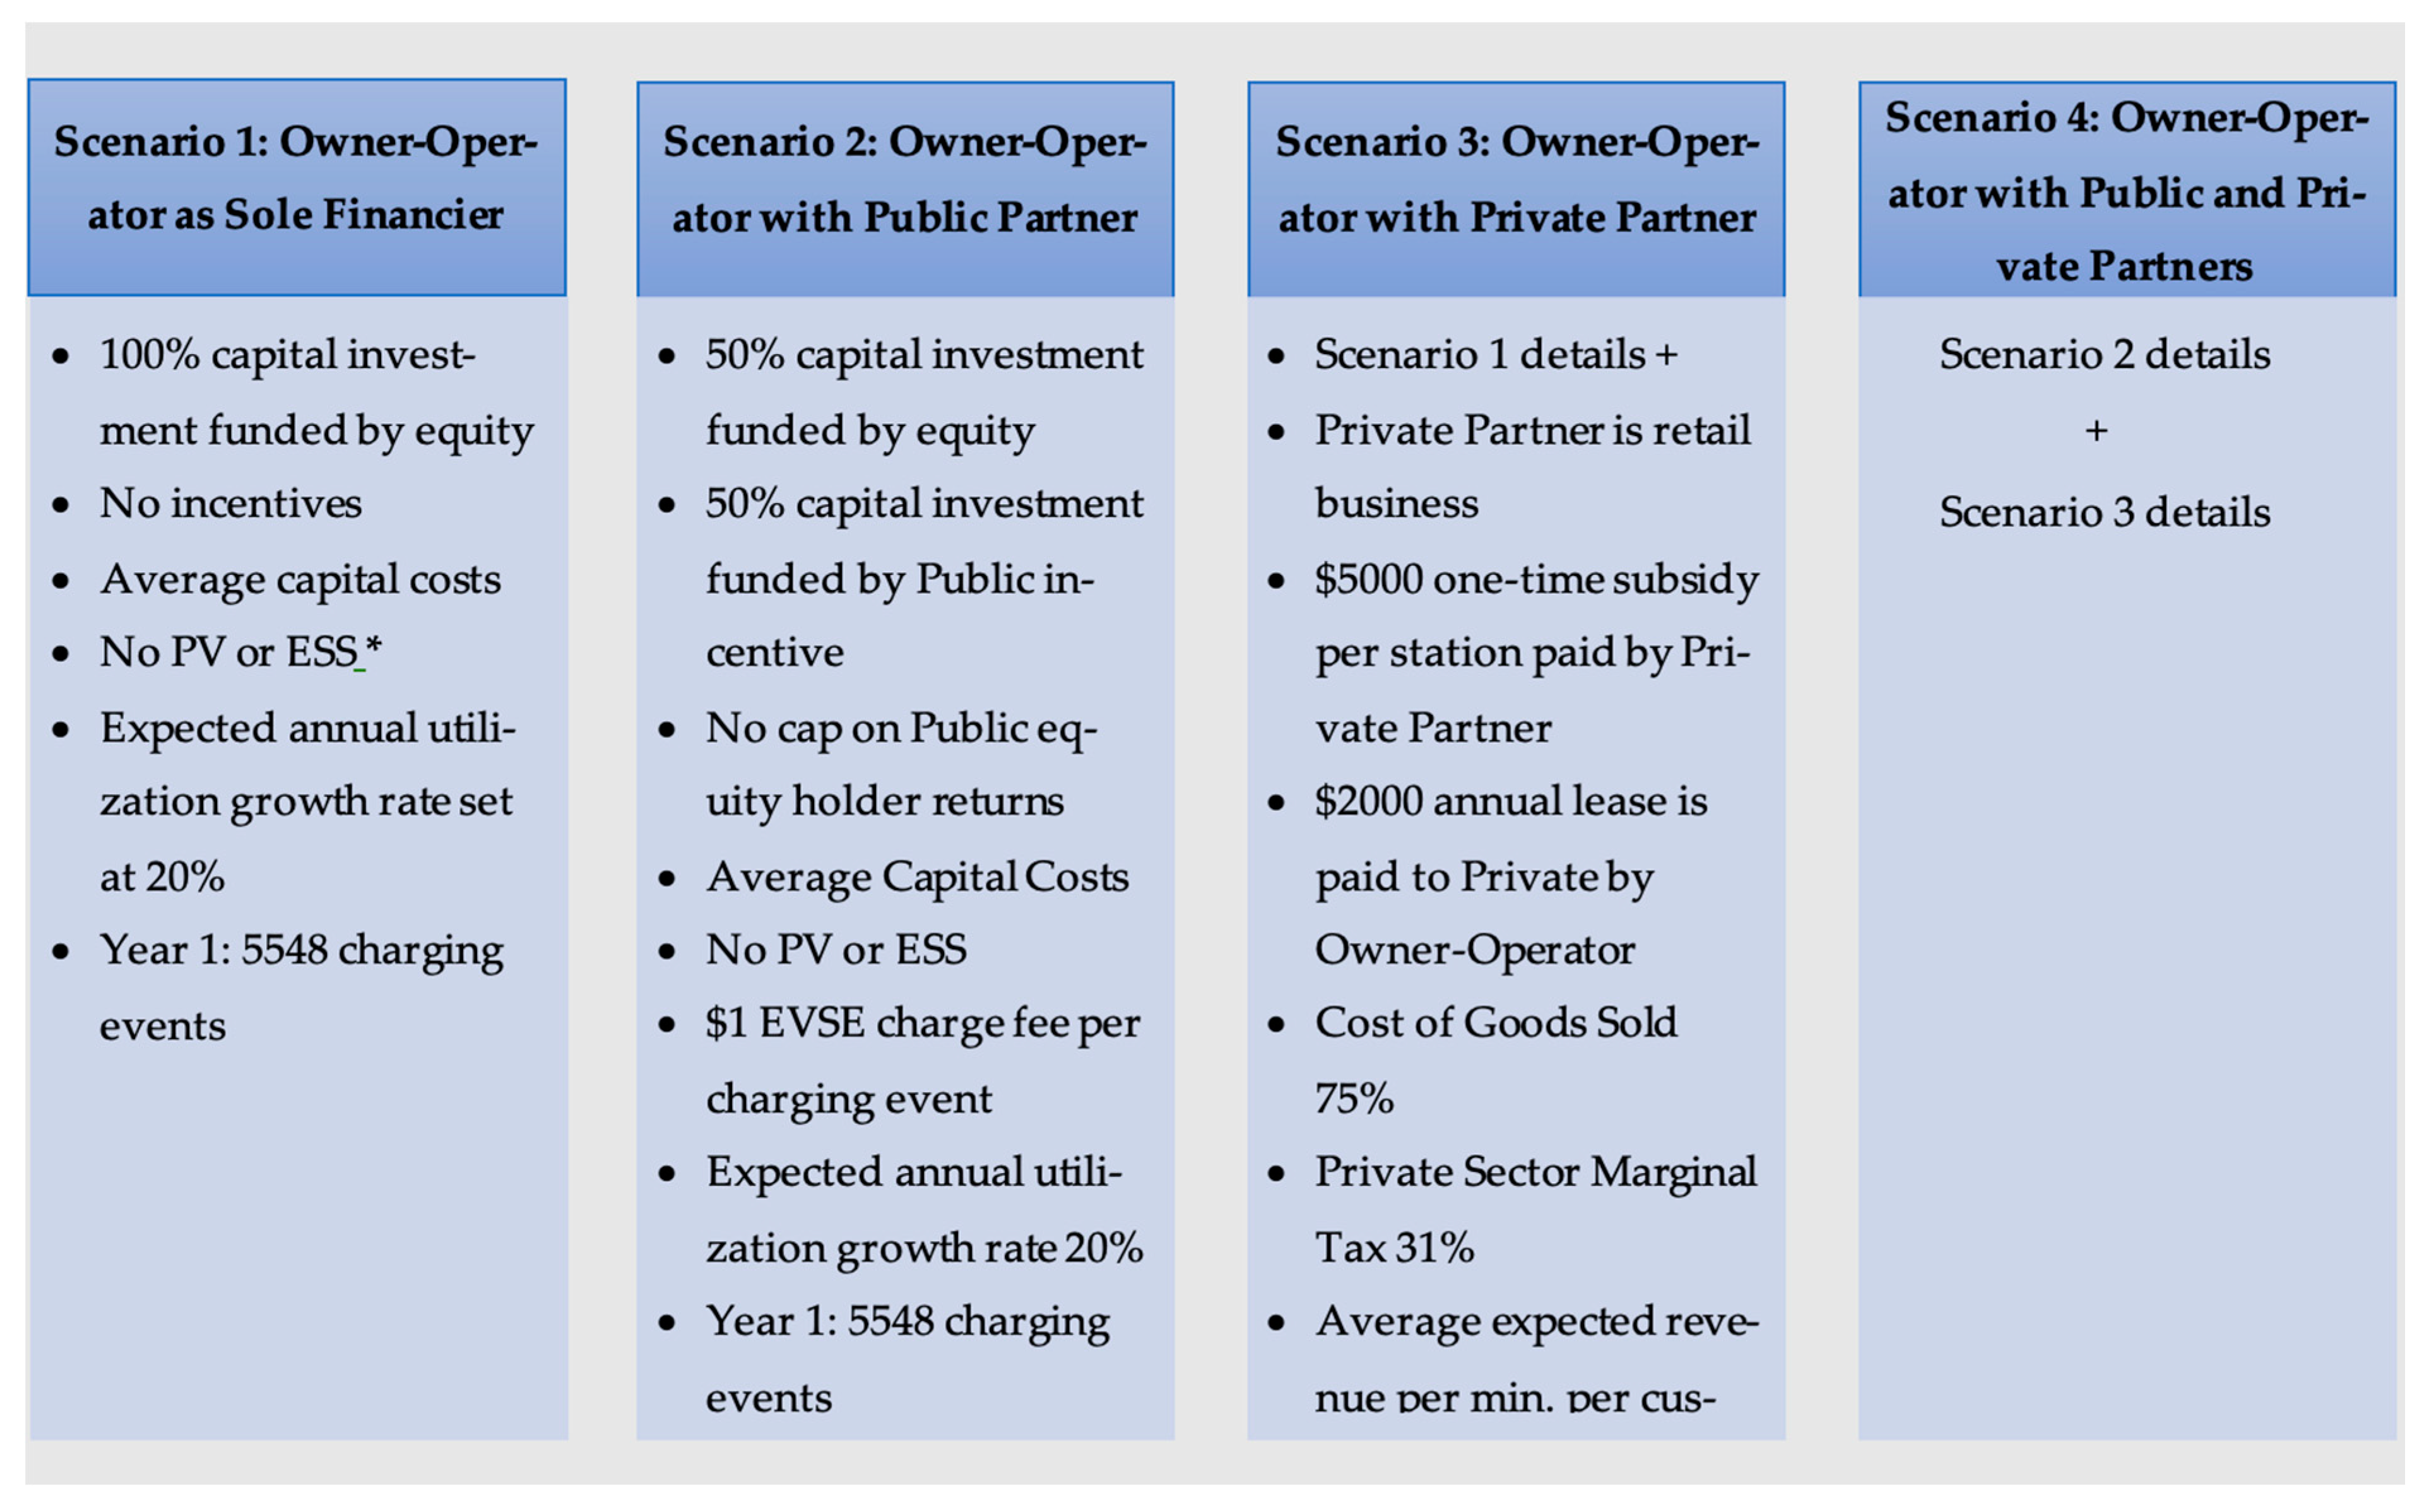
This study explored business scenarios where owners independently construct and operate DCFC stations, as well as scenarios involving partnerships with public and private entities. The partners represent entities that would have a financial stake in the project. The Owner-Operator is the entity involved in the daily management of the project and the particular owner of the equipment and business. The Public Partner could either be a publicly owned utility or a government entity that provides a financial incentive to the project. The incentive could take the form of a loan or grant. Furthermore, the Public Partner also represents the public good via social benefits and obtains a financial return in the form of taxes collected, financial investments in the electric grid, carbon dioxide (CO2) abated, and other typical public benefits [39,40,41,42]. The Private Partner is a private business or entity that could provide some additional capital funding to the Owner-Operator for a small return on the revenue generated or other types of business deals. For example, a Private Partner could be the one that provides some capital funding and a space in the parking lot for the EV charging site. All partners take part in the financial outcome of an EV charging site. The market inputs used in the research are based on existing trends, calculations, and assumptions collected from literature and private industry. The initial utilization rate was established at ~20% [43,44,45] for assessing profitability.
3.1. Data Acquisition
The data acquisition phase was focused on collecting data on costs associated with the locations of the selected sites: El Paso, TX, and Logan, UT. El Paso, situated as the largest among West Texas cities, shares borders with Mexico and the state of New Mexico. Its sole electric utility, the investor-owned El Paso Electric Company, serves over one million residents across the El Paso metropolitan area. On the other hand, Logan, Utah, is nestled within the Rocky Mountain Range. Positioned to the north of Salt Lake City and to the south of the Idaho state border, Logan enjoys its scenic location amidst this rugged landscape. Its metropolitan area comprises approximately 150,000 residents. Logan is serviced by two electric utilities: Logan Light & Power (LLP) and Rocky Mountain Power (RMP). While LLP is a locally owned power company, RMP is a substantially larger utility owned by MidAmerican Energy Holdings Company [46]. Therefore, for the purpose of this case study, LLP was chosen. The two case studies helped ground the research in real geographic locations that can face distinct barriers to having profitable DCFC businesses.
Table 2 shows the sources from which all the information, such as cost trends and incentives, was acquired for each partner and market inputs and their distinct data types. This information was used to run a comparison analysis between El Paso, TX, and Logan, UT.
Table 2.
Data sources for the data acquisition phase.
The utility data collected was primarily taken from the National Renewable Energy Lab’s Utility Rate Database (URDB) and cost schedules available through electric utility websites. This data consists of retail electricity price, demand charge costs, and others that make up the largest portion of the yearly operating costs. Table 3 shows the utility-related costs, including the utilities used in each selected city (as of December 2023). Furthermore, data on construction costs was also collected and adjusted using city cost indices provided in RS Means Cost Data (2023). The differences in construction costs are largely tied to the existing infrastructure. These differences could mean needing new electrical conduits, pavement resurfacing, and other construction operations to ensure that an EV charging site meets requirements.
Table 3.
Utility costs per kWh.
3.2. Economic Analysis
Equation (1) shows the NPV assessment for each partner. The net cash flow contains different inflows and outflows, given the partner type.
where ‘Z’ is the specific partner: Owner-Operator, Public, and Private; CFt is the net cash flow of the given year t; and r is the discount rate utilized for the given partner (Appendix A).
The following equations distinguish the net cash flow between the partners. Equation (2) shows the CFOwner where it equals the net cash flow from operation plus two additional terms. Equations (2)–(6) display the breakdown to calculate the NPV for the Owner-Operator. The Owner-Operator data inputs are mostly closely associated with the operation and management of the EV charging site. It takes on the capital costs data inputs associated with construction, the electric vehicle supply equipment (EVSE), leases, additional capital costs such as energy storage systems (ESS), and equipment lifespan. In this paper, δ refers to the ‘change of.’ Thus, the change of non-cash assets and liabilities will be shown as deductions.
where EBIT = Earnings before interest and taxes
where Rsite = Revenue of the DCFC site; Operating = Operating Cost
Equations (7)–(9) display the breakdown to calculate the NPV for the Public Partner. Equation (8) is made up of loan repayments that the Owner-Operator may have to pay to the Public Partner for subsidizing a loan. The R share is the revenue share that the Public Partner receives for the percentage of the capital investment it put down. The variables with the B subscript mean the monetary benefit for improving those qualities, which the public good overall benefits. The cash outflow is made up of the loan that the Public Partner subsidized, any incentive it gave to the Owner-Operator, and any recurring grants.
where CFin = Cash Inflow for Public Partner; CFout = Cash outflow for Public Partner.
Equation (10) displays the general breakdown of calculating the NPV for the Private Partner. The Private Partner data inputs are associated with the financial benefits the private entity can capitalize upon being tied to the charging site. Private revenue is made up of indirect revenue generated from increased traffic caused by the attraction of customers, primarily for the DCFC charging service. The Private Partner may represent a grocery store, restaurant, shopping mall, or other business that provides goods and services. Given that the average DCFC charge time is 18 min, there is enough time for customers to potentially make purchases from the Private Partner. The private revenue may also be made up of point-of-sale revenue and site leasing revenue if they provide the physical land to the Owner-Operator to have the DCFC site operated. The Private Partner operating costs are made up of the cost of goods and services sold. Furthermore, the Owner share is made up of the revenue cut and annual fees the Private Partner may provide to the Owner-Operator of the DCFC site. This may include EVSE cost subsidies, a flat fee, or a one-time payment.
Rprivate = revenue generated from the increased customer volume due to customers parking to charge their EV.
The NPV for each partner can make up the Project NPV, which is the summation of the NPV of all partners. Even if any partner incurs a loss, the Project NPV will reflect the total financial benefit of having a DCFC site over a 10-year period.
3.3. Sensitivity Analysis
This study used deterministic sensitivity analysis (DSA) to assess how variations in input parameters influence the model’s output. By applying a one-at-a-time approach, where one input variable is changed while all others remain constant, the study isolated the effect of each variable on the outcome. The NPV of each partner served as the dependent variable (output), while the independent variable (input) represented the parameter under adjustment to observe its influence on NPV. For instance, analyzing the installation and construction cost through sensitivity analysis explained the extent to which this capital expenditure impacts the NPV for each partner and the project holistically. Key data inputs included variables such as construction and installation costs, electricity retail prices, energy prices for users, and demand charge costs, among others. Through these analyses, the research aimed to determine which economic factors exerted a uniform influence on NPV across different cities and which factors demonstrated location-specific dependencies.
Table 4 displays the data types and the specific data inputs within those types that were the independent variables in each distinct sensitivity analysis.
Table 4.
Independent variables for sensitivity analyses.
4. Data Analysis and Results
This research presents data analysis by comparing business scenarios between two selected cities: El Paso, TX, and Logan, UT. This involved conducting sensitivity analyses for each scenario followed by trend analysis to explain any disparities identified within the existing literature. Scenario 1 was designed alongside three additional cases which involved the inclusion of partnerships or combinations thereof into the business scenario. Subsequently, these scenarios were designated as Scenarios 2, 3, and 4. The base case (scenario 1) entailed an assumed utilization rate of 20% for the DCFC site commencing in the first year. This translated to an average 5548 charging events per year per charging port, or approximately 15 charging events per day. Considering that the average DCFC event lasts 18 min at 150 kW, the total utilization amounted to 4.5 h per day. Figure 4 shows important variables used for analysis under each business scenario.
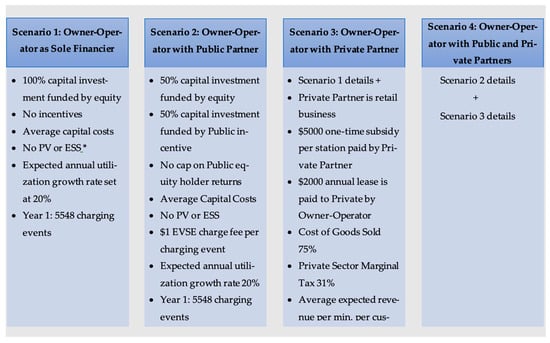
Figure 4.
Business scenarios. * PV: Photovoltaic; ESS: Energy Storage System.
4.1. DCFC Investment Scenarios in El Paso, Texas
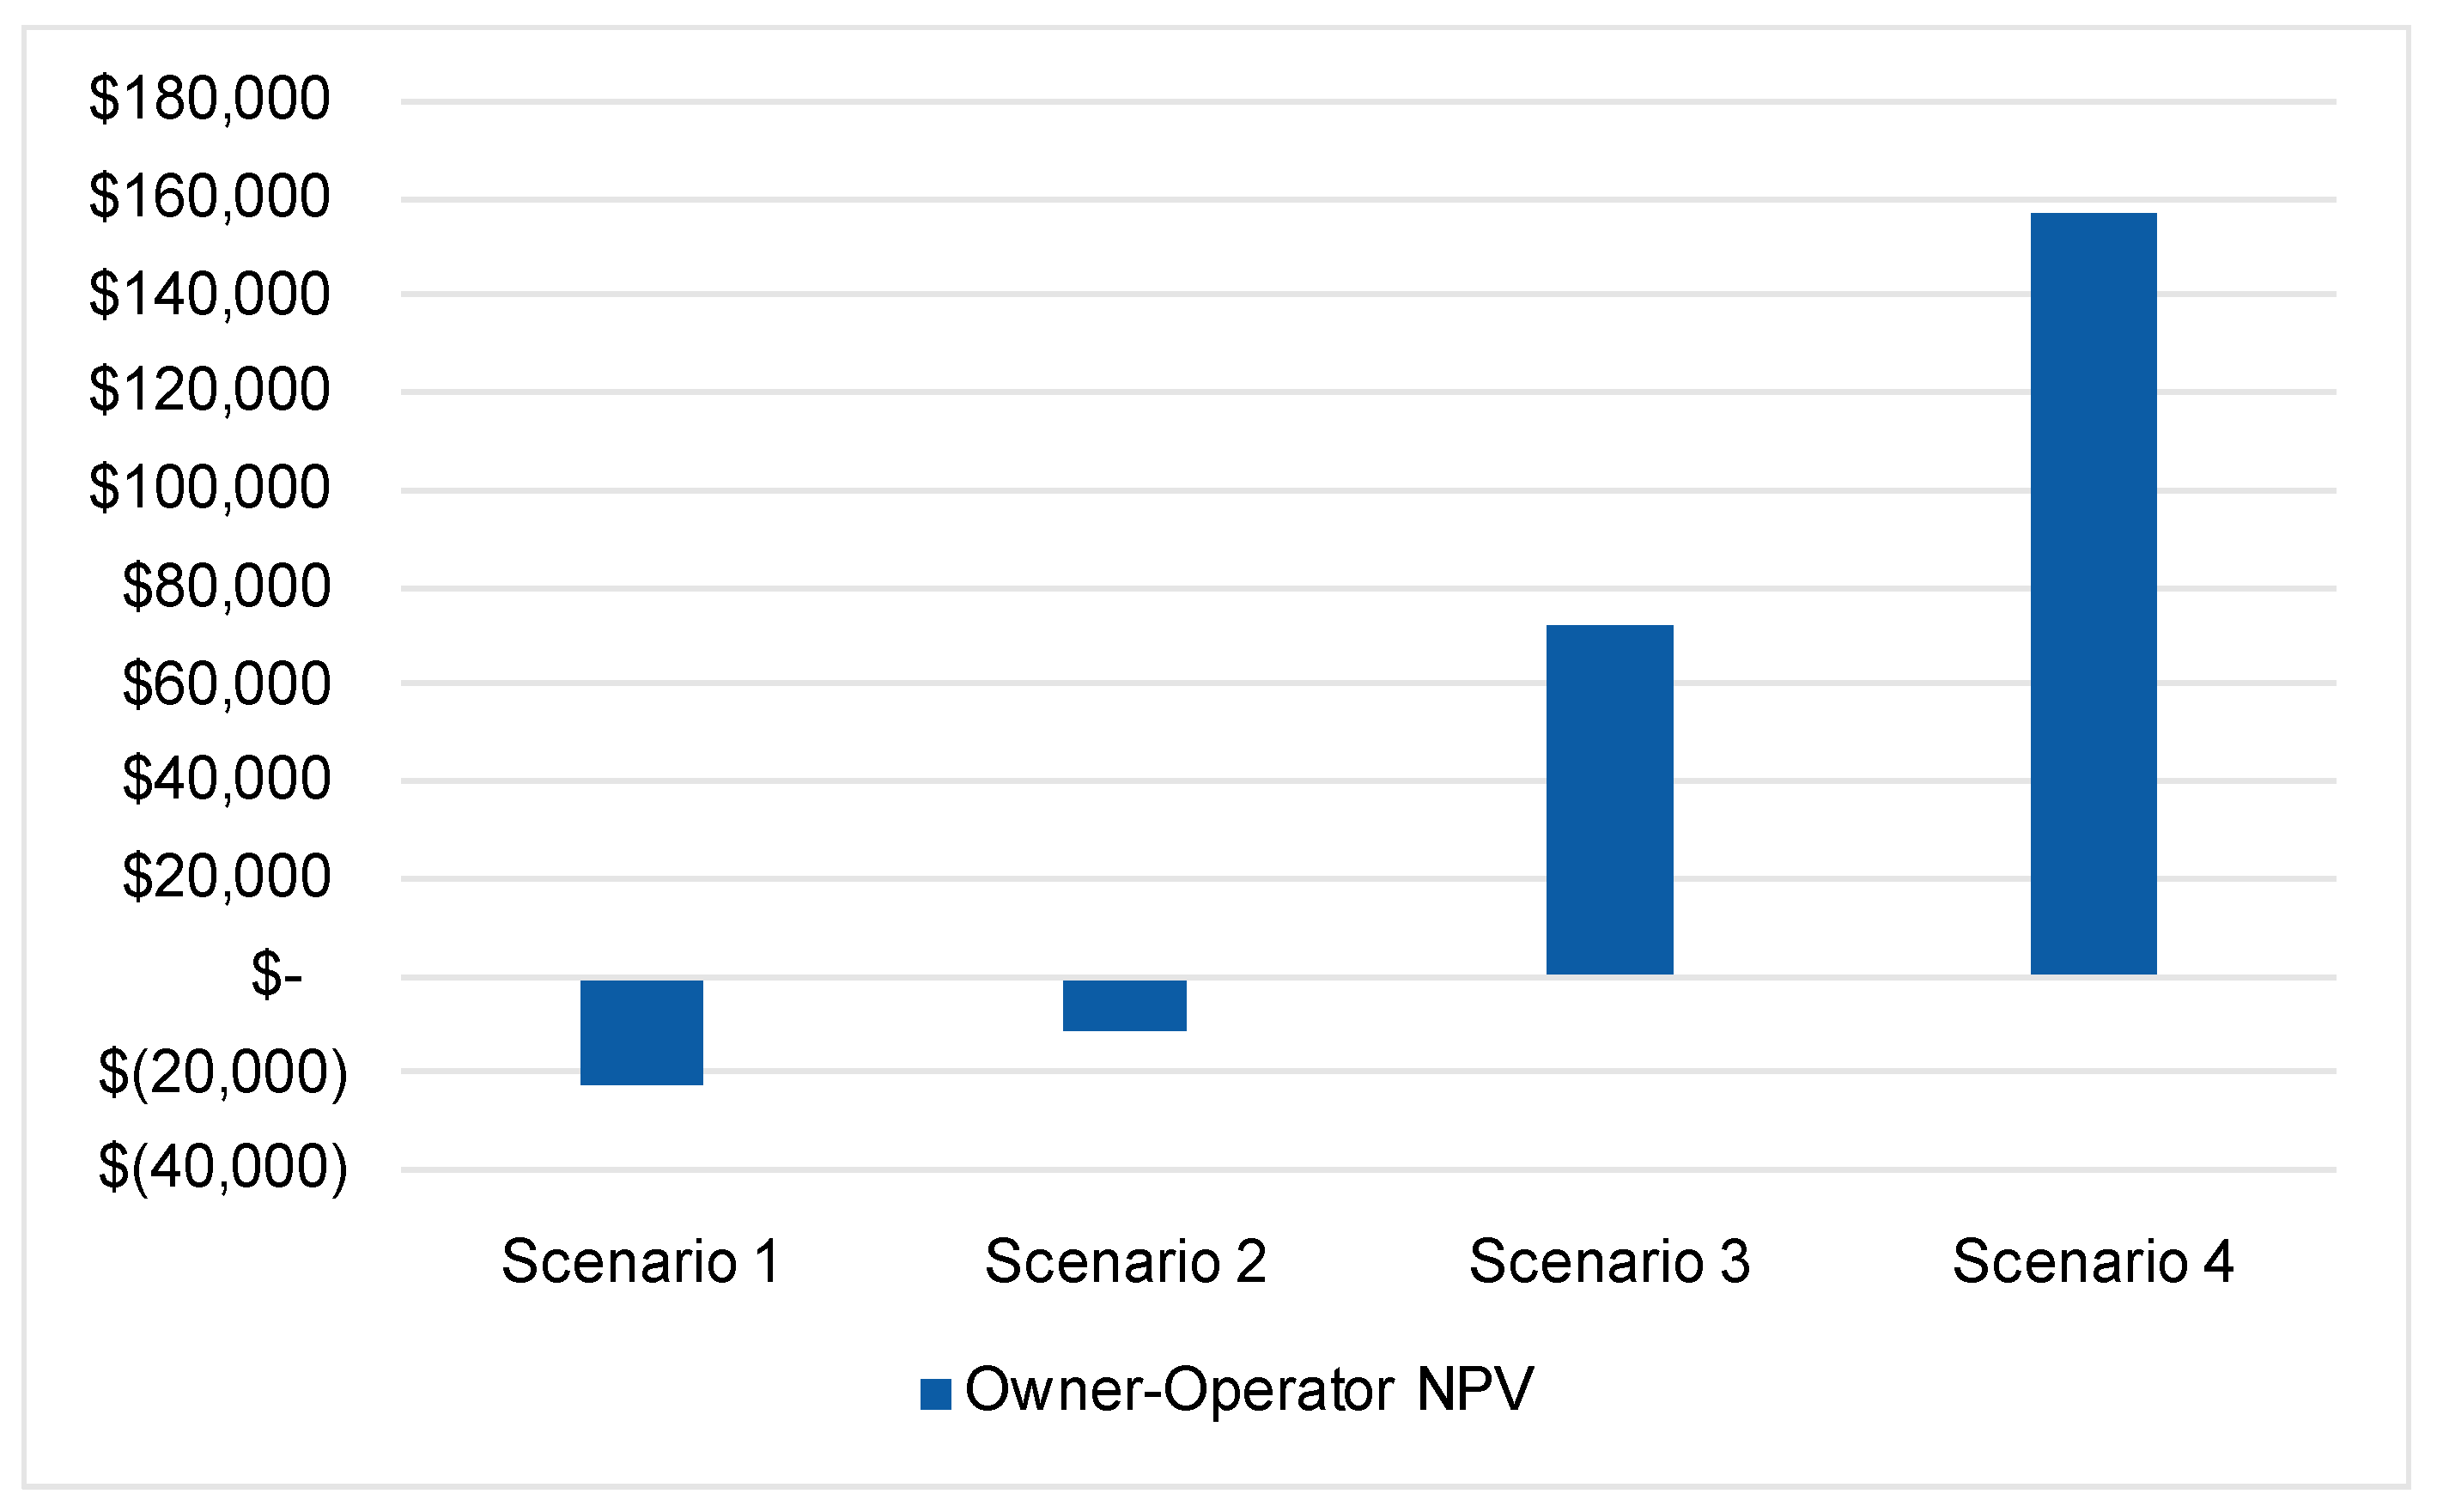
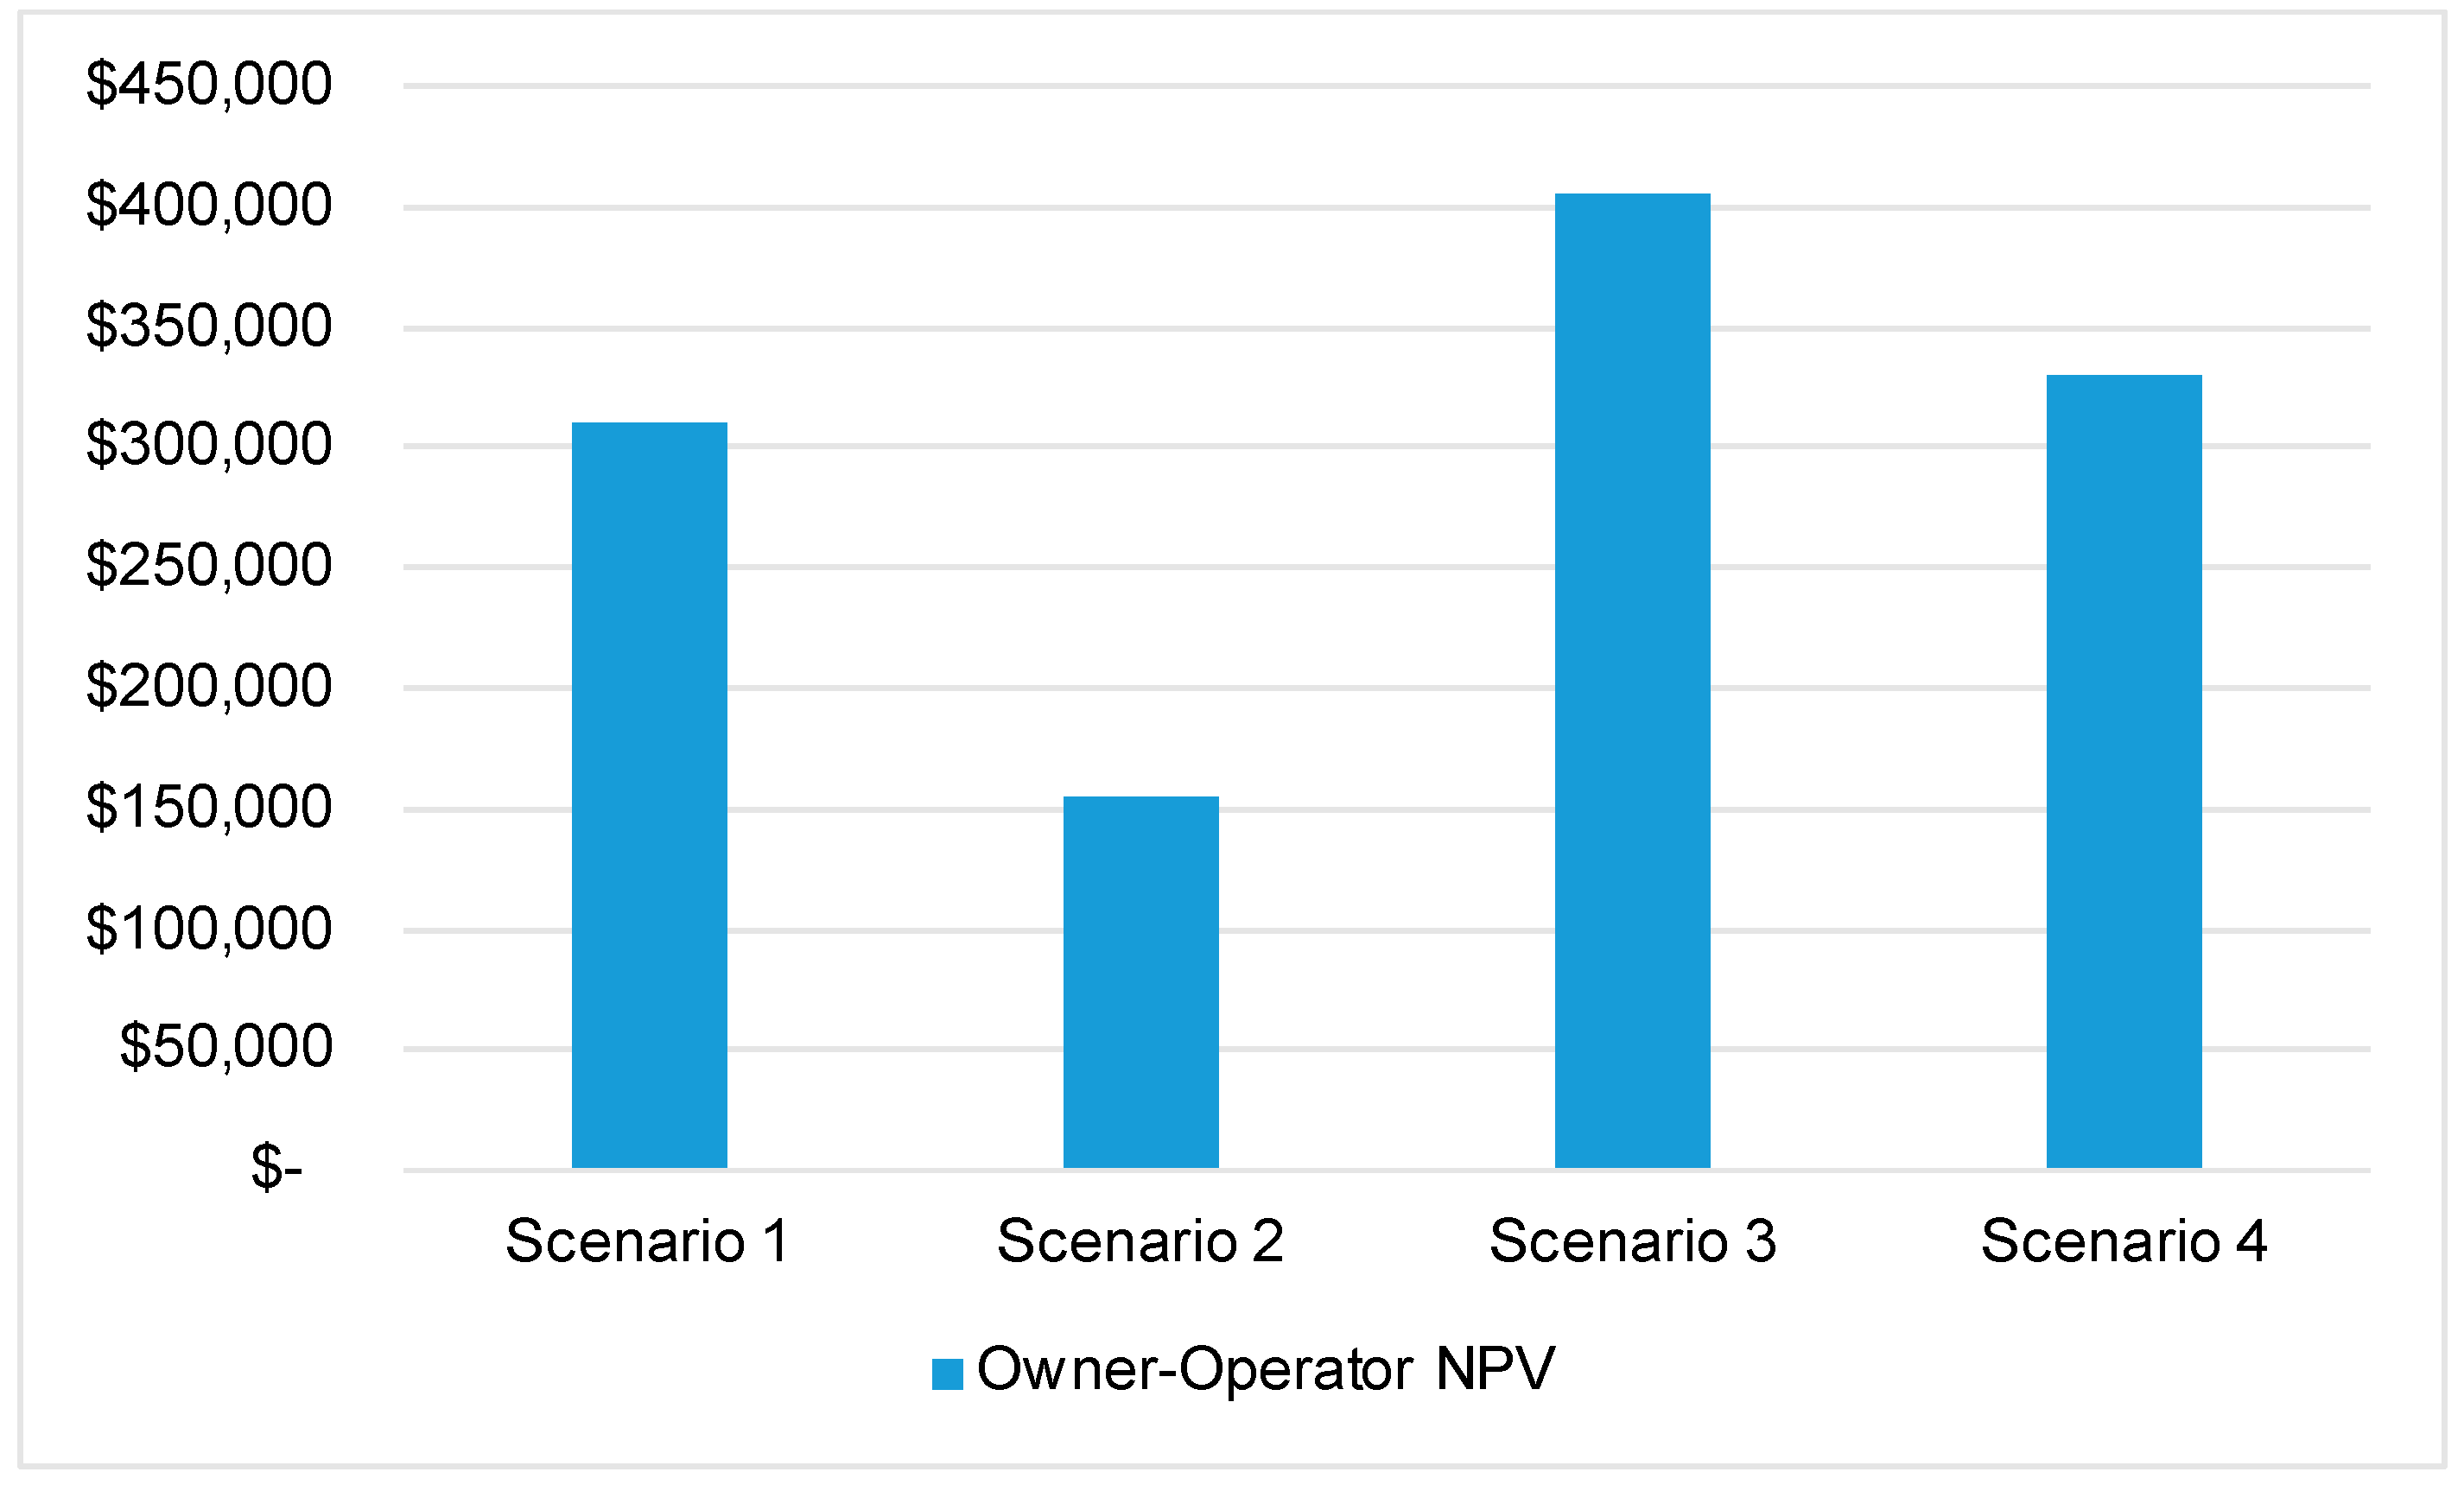
Figure 5 presents the Owner-Operator NPV for each simulated scenario for El Paso. The results have shown that based on the variables selected and assumptions made in this study, the DCFC business is at a negative NPV, thus losing money when the Owner-Operator is the sole financier and sole equity holder of the business, as shown in Scenario 1. Similarly, in Scenario 2 the site is still losing money because it must split the revenue with the Public Partner for being an equity shareholder for providing capital funds through an incentive. There may be instances where the incentive is not expected to return an equity share to the Public Partner. This would make it easier for the Owner-Operator to return a profit over time if it does not have to share the DCFC business’s generated revenue. For a DCFC site to be most profitable in El Paso, there needs to be a multi-partner business model where a Public Partner provides capital via an incentive or grant, and a Private Partner is tied to a revenue-sharing agreement directly with the Owner-Operator. This diversifies the revenue streams for the Owner-Operator. Specifically, the revenue stream that it receives through the revenue-sharing agreement does not incur extra operating costs to the Owner-Operator. When the DCFC site sells energy to EV users for charging, it must buy electricity from the utility to provide the charging service. In the revenue-sharing agreement, there is no cost to providing more business activity to the Private Partner. The Owner-Operator simply receives a cut from the additional revenue generated by the Private Partner due to increased customer volume in the Private Partner’s business.
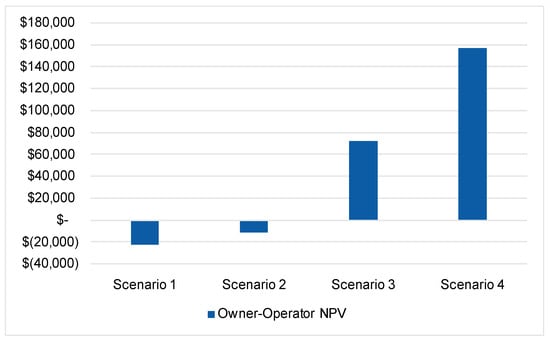
Figure 5.
Owner-Operator NPV in El Paso across scenarios.
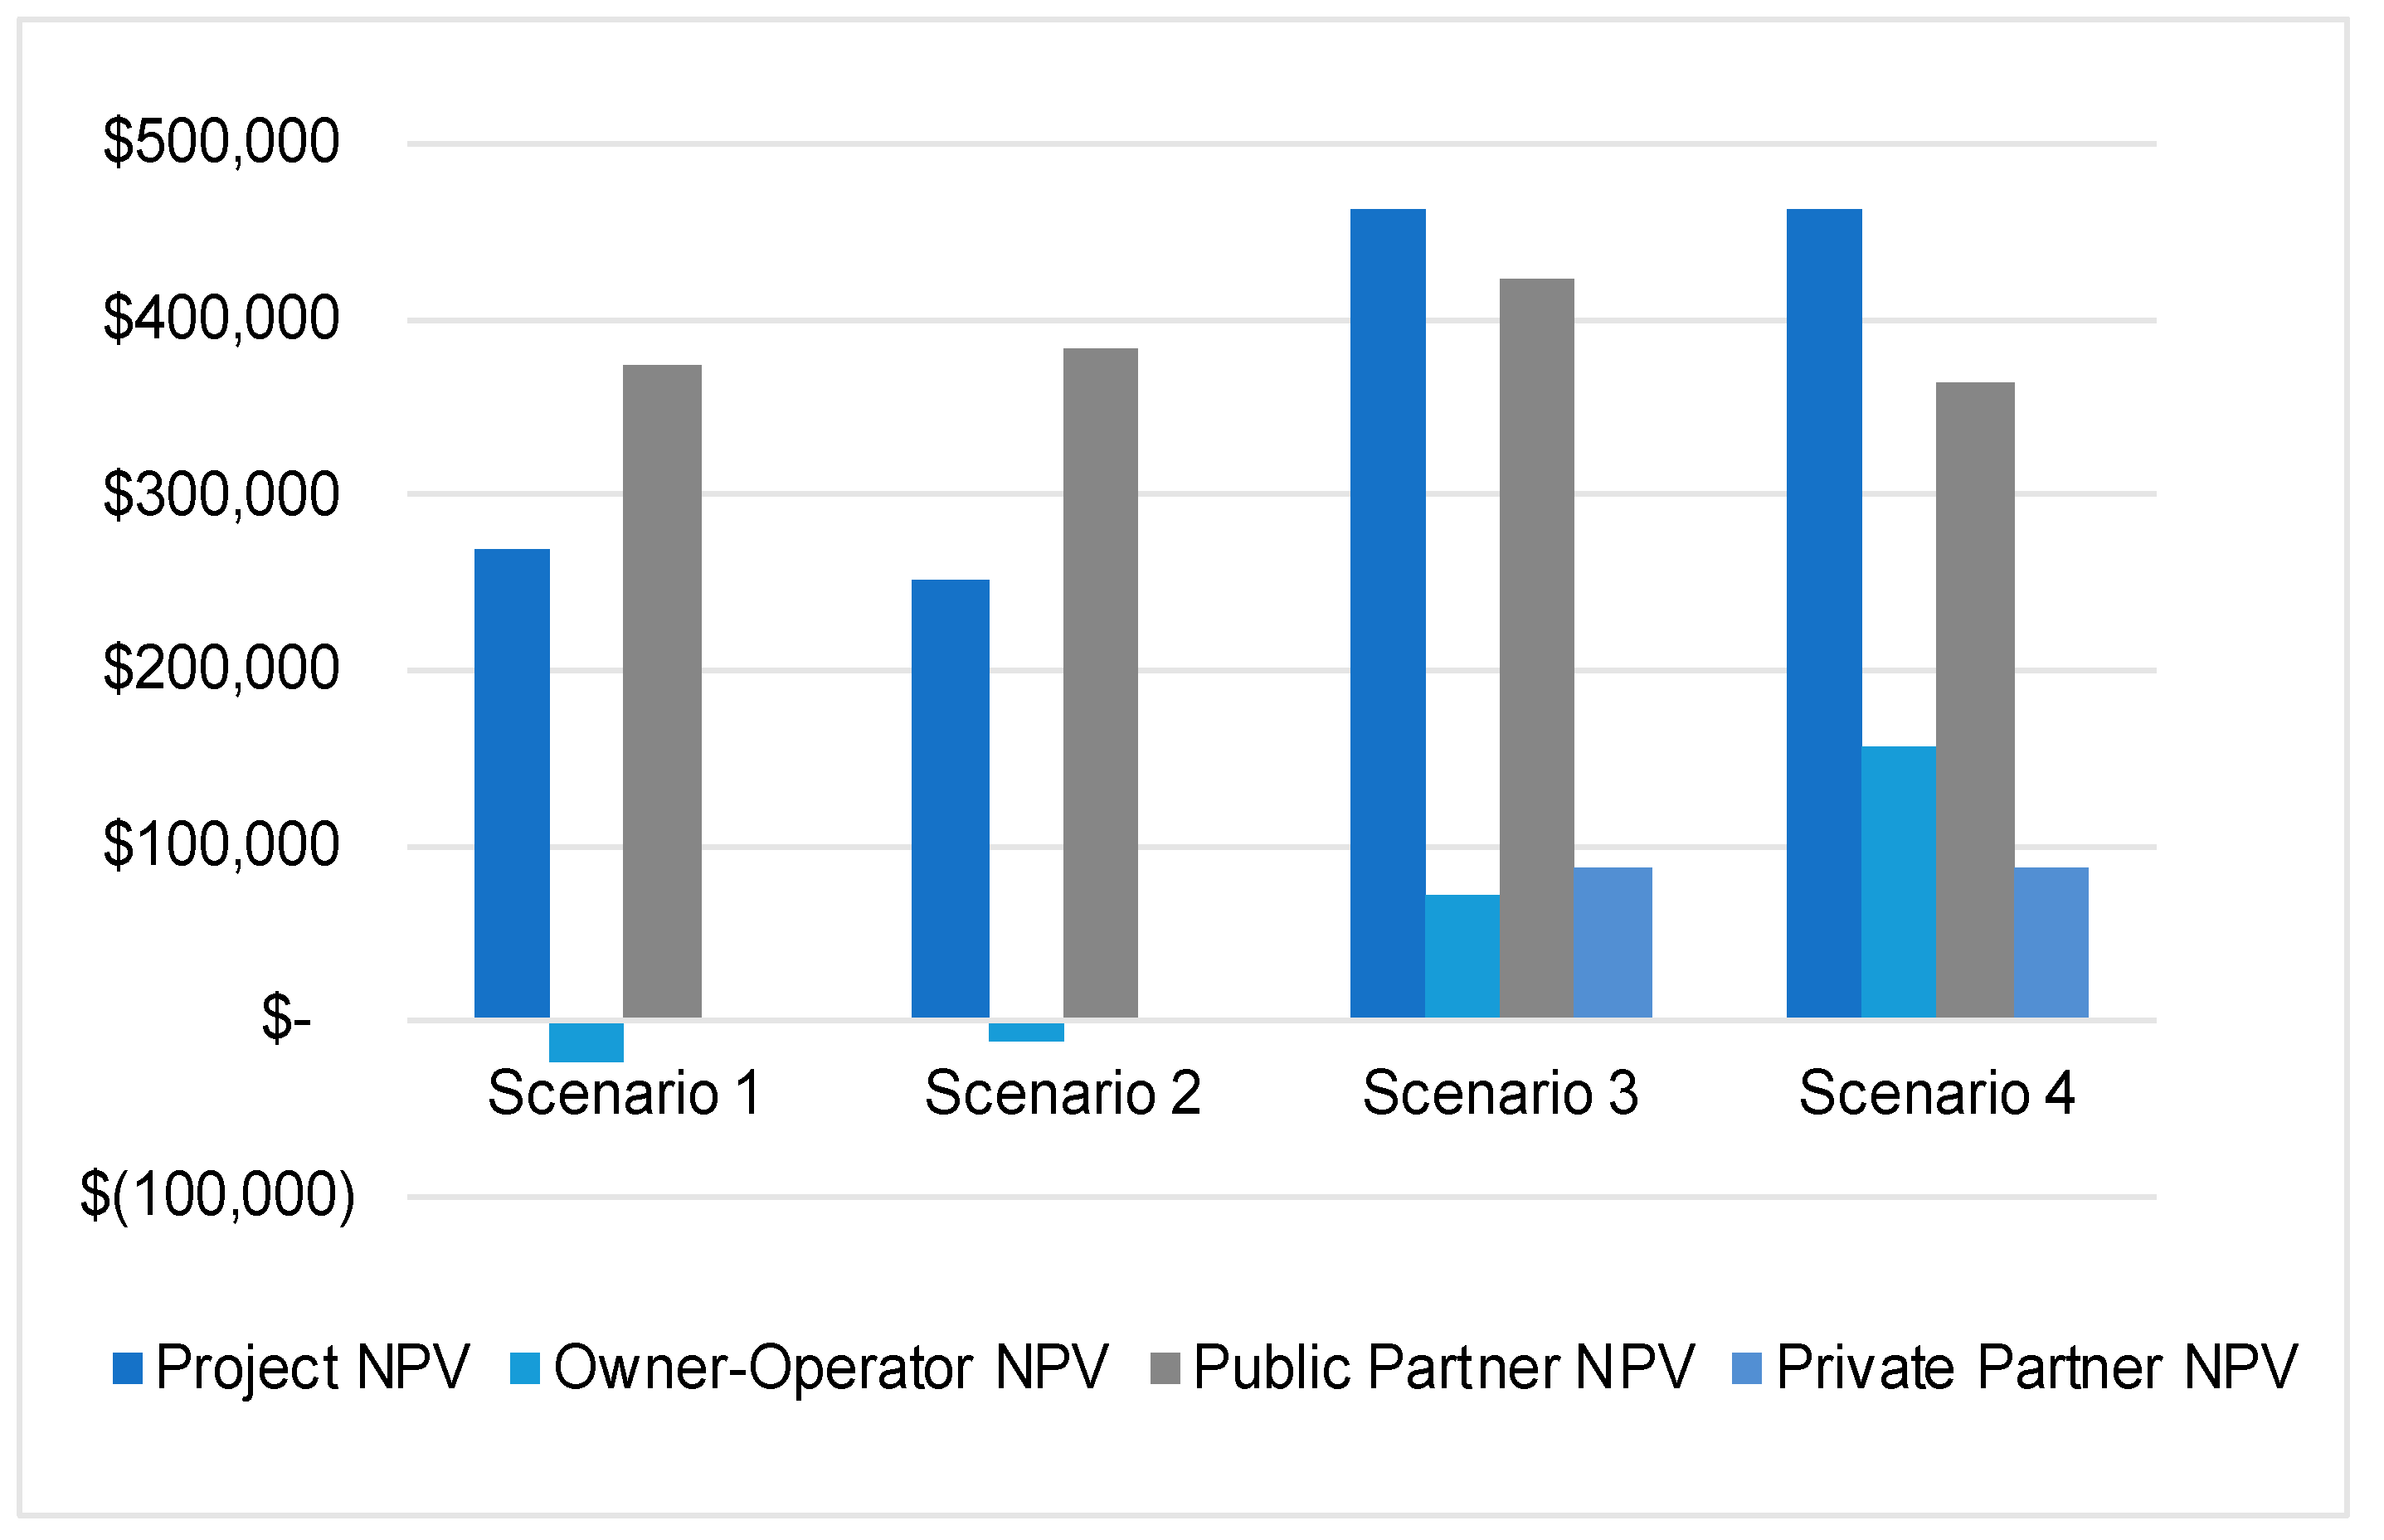
Figure 6 illustrates the differences in NPVs for the three partners (owner, public, and private) across four scenarios, highlighting Scenarios 3 and 4 as the most profitable for all partners, with higher NPVs. This is primarily attributed to the inclusion of a Private Partner within the business model. Introducing a Private Partner stimulates increased economic engagement for all involved parties, thereby benefiting the entire project. The presence of EV charging services incentivizes EV users to patronize businesses equipped with such amenities, enabling them to conveniently accomplish multiple tasks simultaneously. Consequently, businesses allied with DCFC are more inclined to attract EV users who might otherwise spend their money elsewhere or refrain from spending during the charging process.
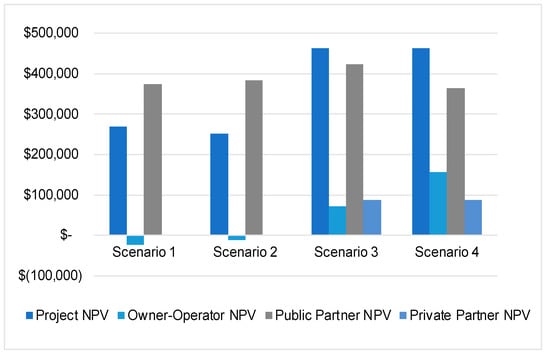
Figure 6.
Scenario comparison for all partner NPVs in El Paso.
4.2. DCFC Investment Scenarios in Logan, Utah
Figure 7 presents the NPV for the Owner-Operator business model specifically tailored for Logan. To ensure consistency in cross-city comparisons, the same assumptions as those used for El Paso were applied. In scenarios 2 and 4, where the DCFC site benefits from incentives provided by a Public Partner, the Owner-Operator realizes lower profits compared to scenarios 1 and 3, where revenue from charging services is not shared with any equity holders. However, it can be reasonably inferred that if there were a cap or no anticipated return for the public equity holders, the profitability of a DCFC site in Logan would progressively increase with each scenario offering additional financial support. Hence, if a DCFC site demonstrates sufficient utilization and sufficiently low utility-related costs, it may not necessitate financial support from a Public Partner to achieve profitability. A strategy to enhance profitability and overall economic activity for all partners would involve establishing a revenue-sharing agreement between the Private Partner and Owner-Operator.
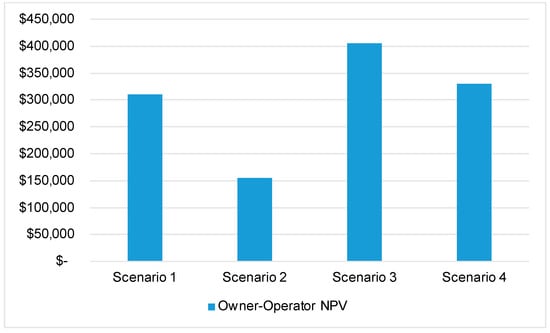
Figure 7.
Owner-Operator NPV in Logan across scenarios.
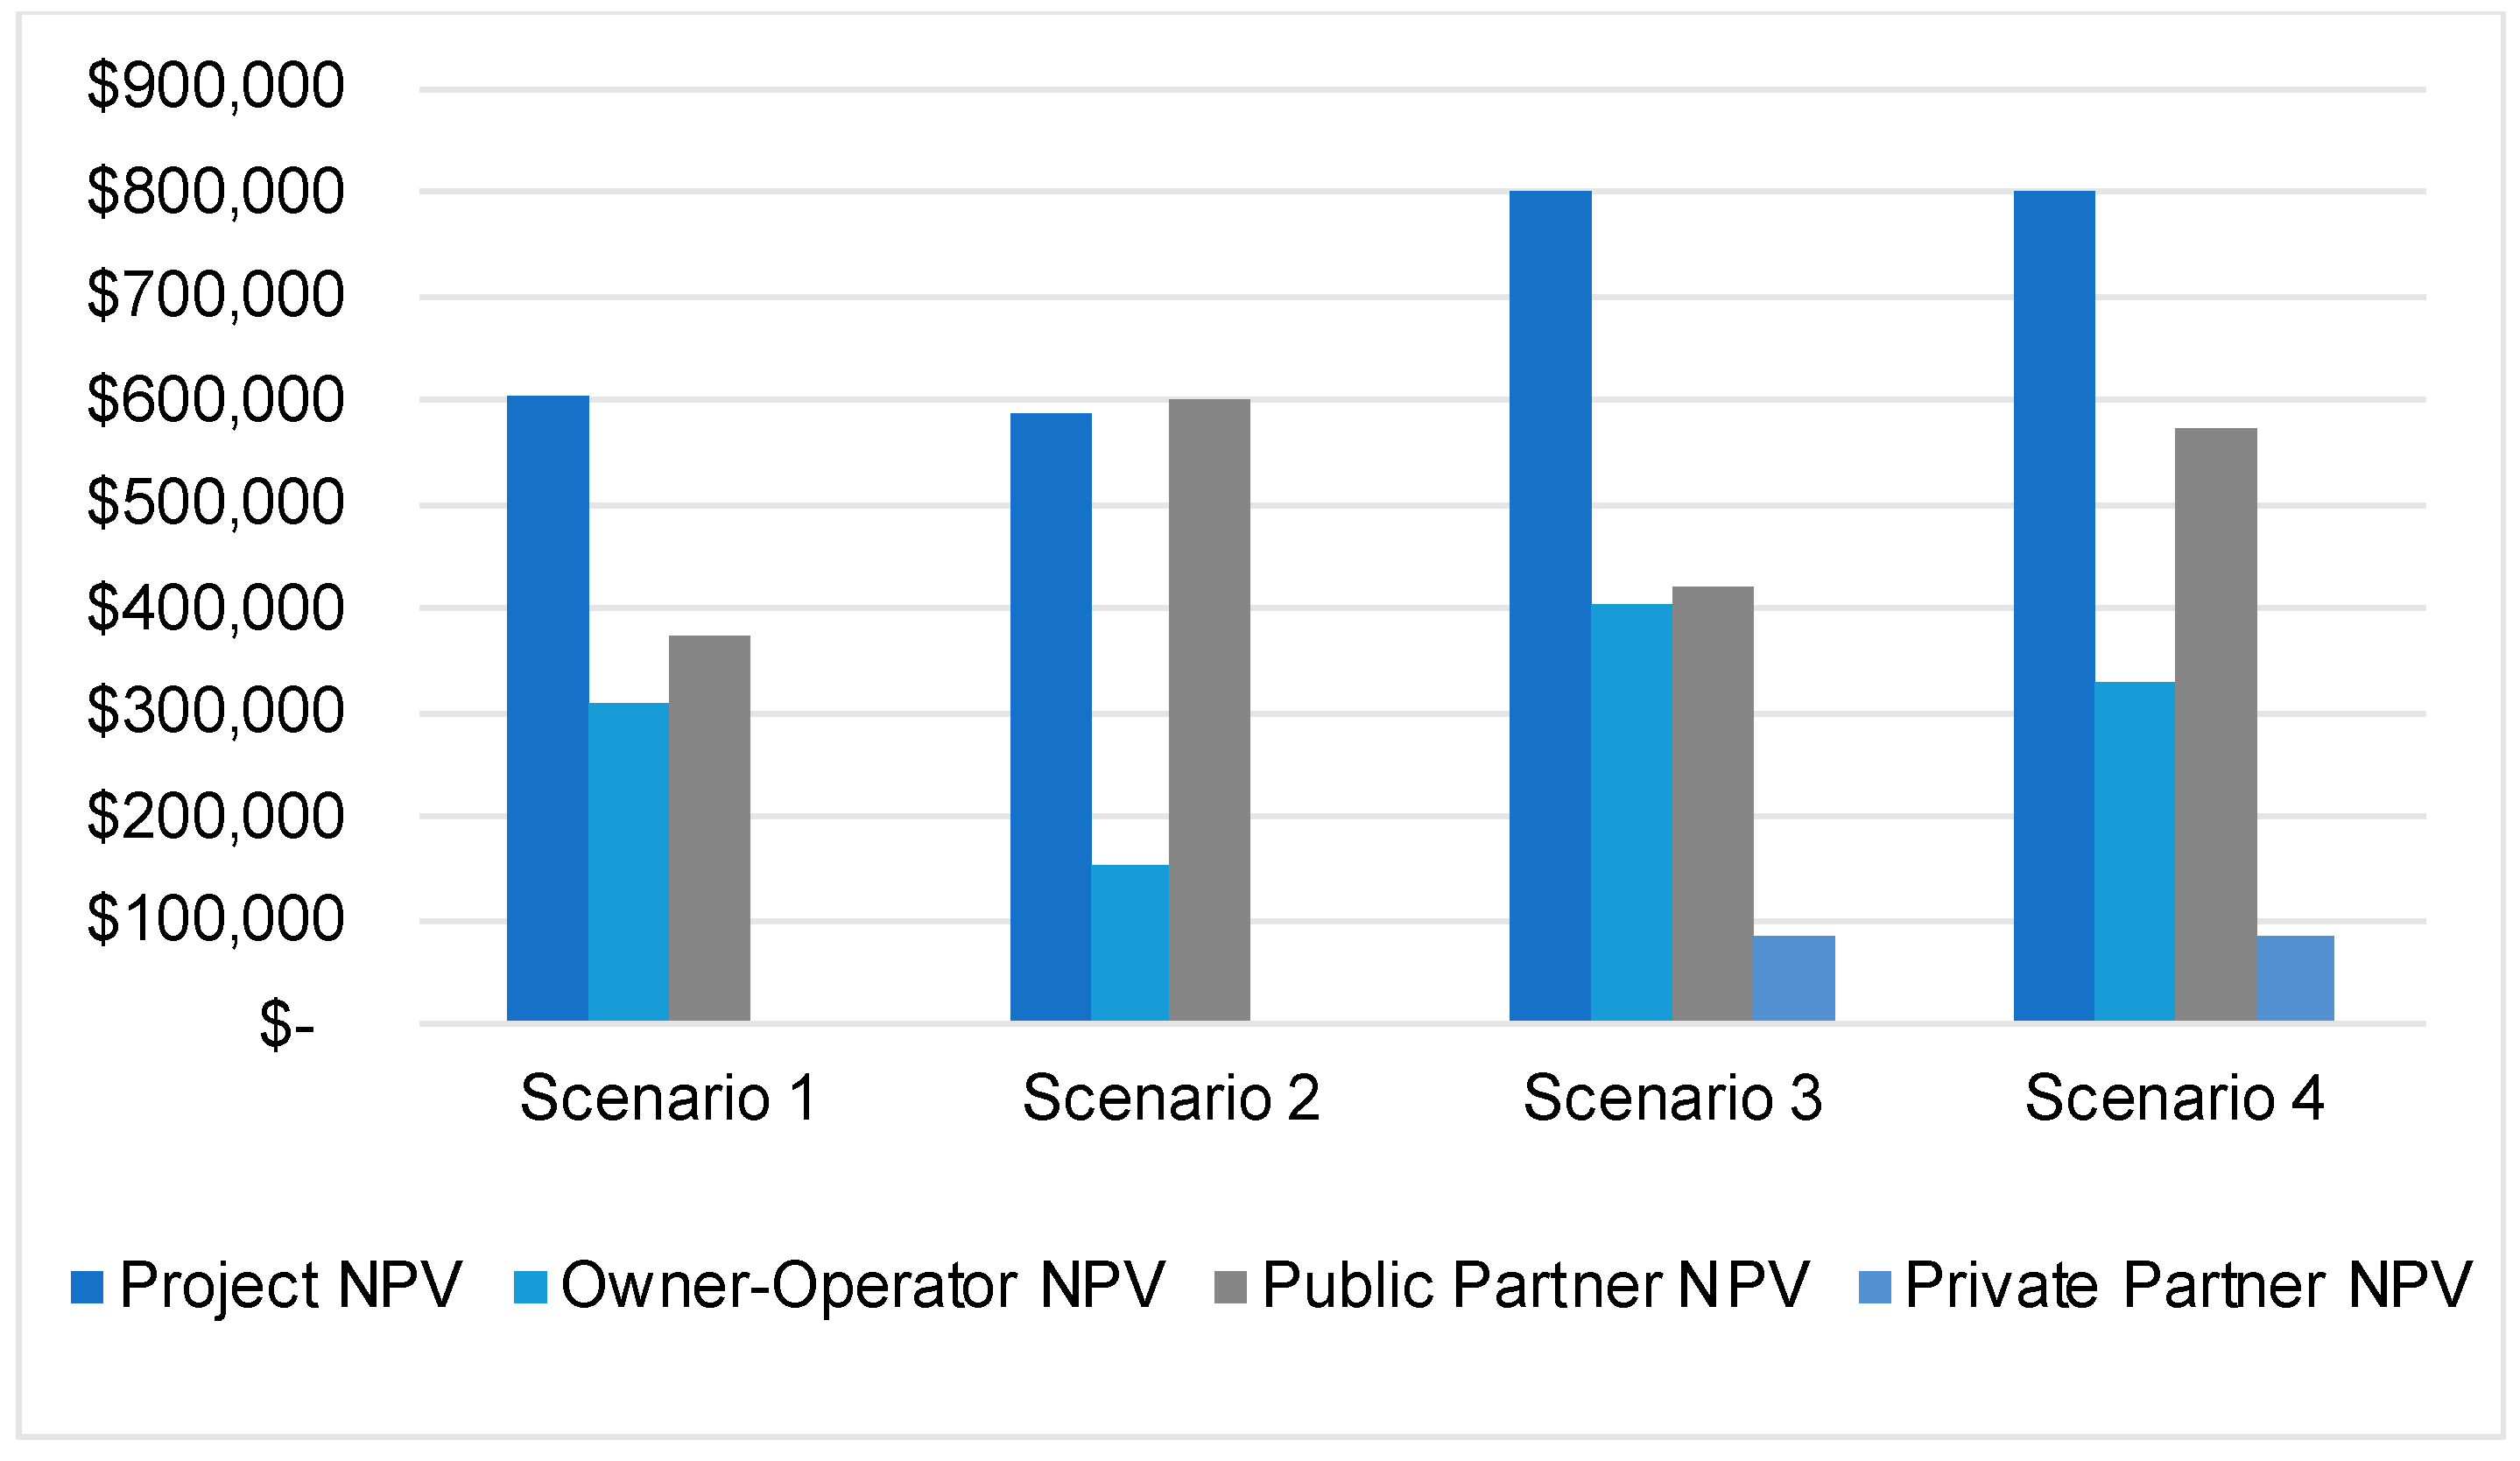
In Figure 8, the NPVs of all participating partners are compared across all the scenarios. Similar to the findings in the El Paso case, this analysis reaffirms that a multi-partner business model yields the highest economic returns for a DCFC site. However, the choice of partners can significantly impact the distribution of returns. For the Owner-Operator, refraining from involving a public equity holder in the business yields the highest return on their initial investment, depending on their priorities. In scenarios 3 and 4, the Private Partner earns the same rate of return, as their earnings remain unaffected by the revenue generated solely from the charging services.
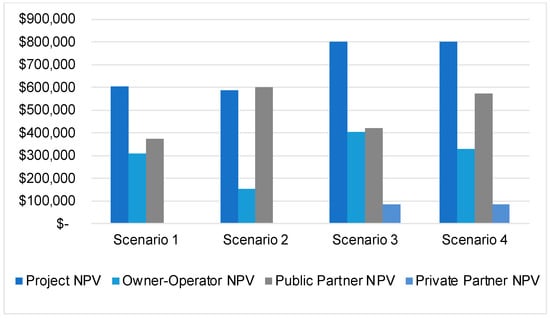
Figure 8.
Scenario Comparison for all partner NPVs in Logan.
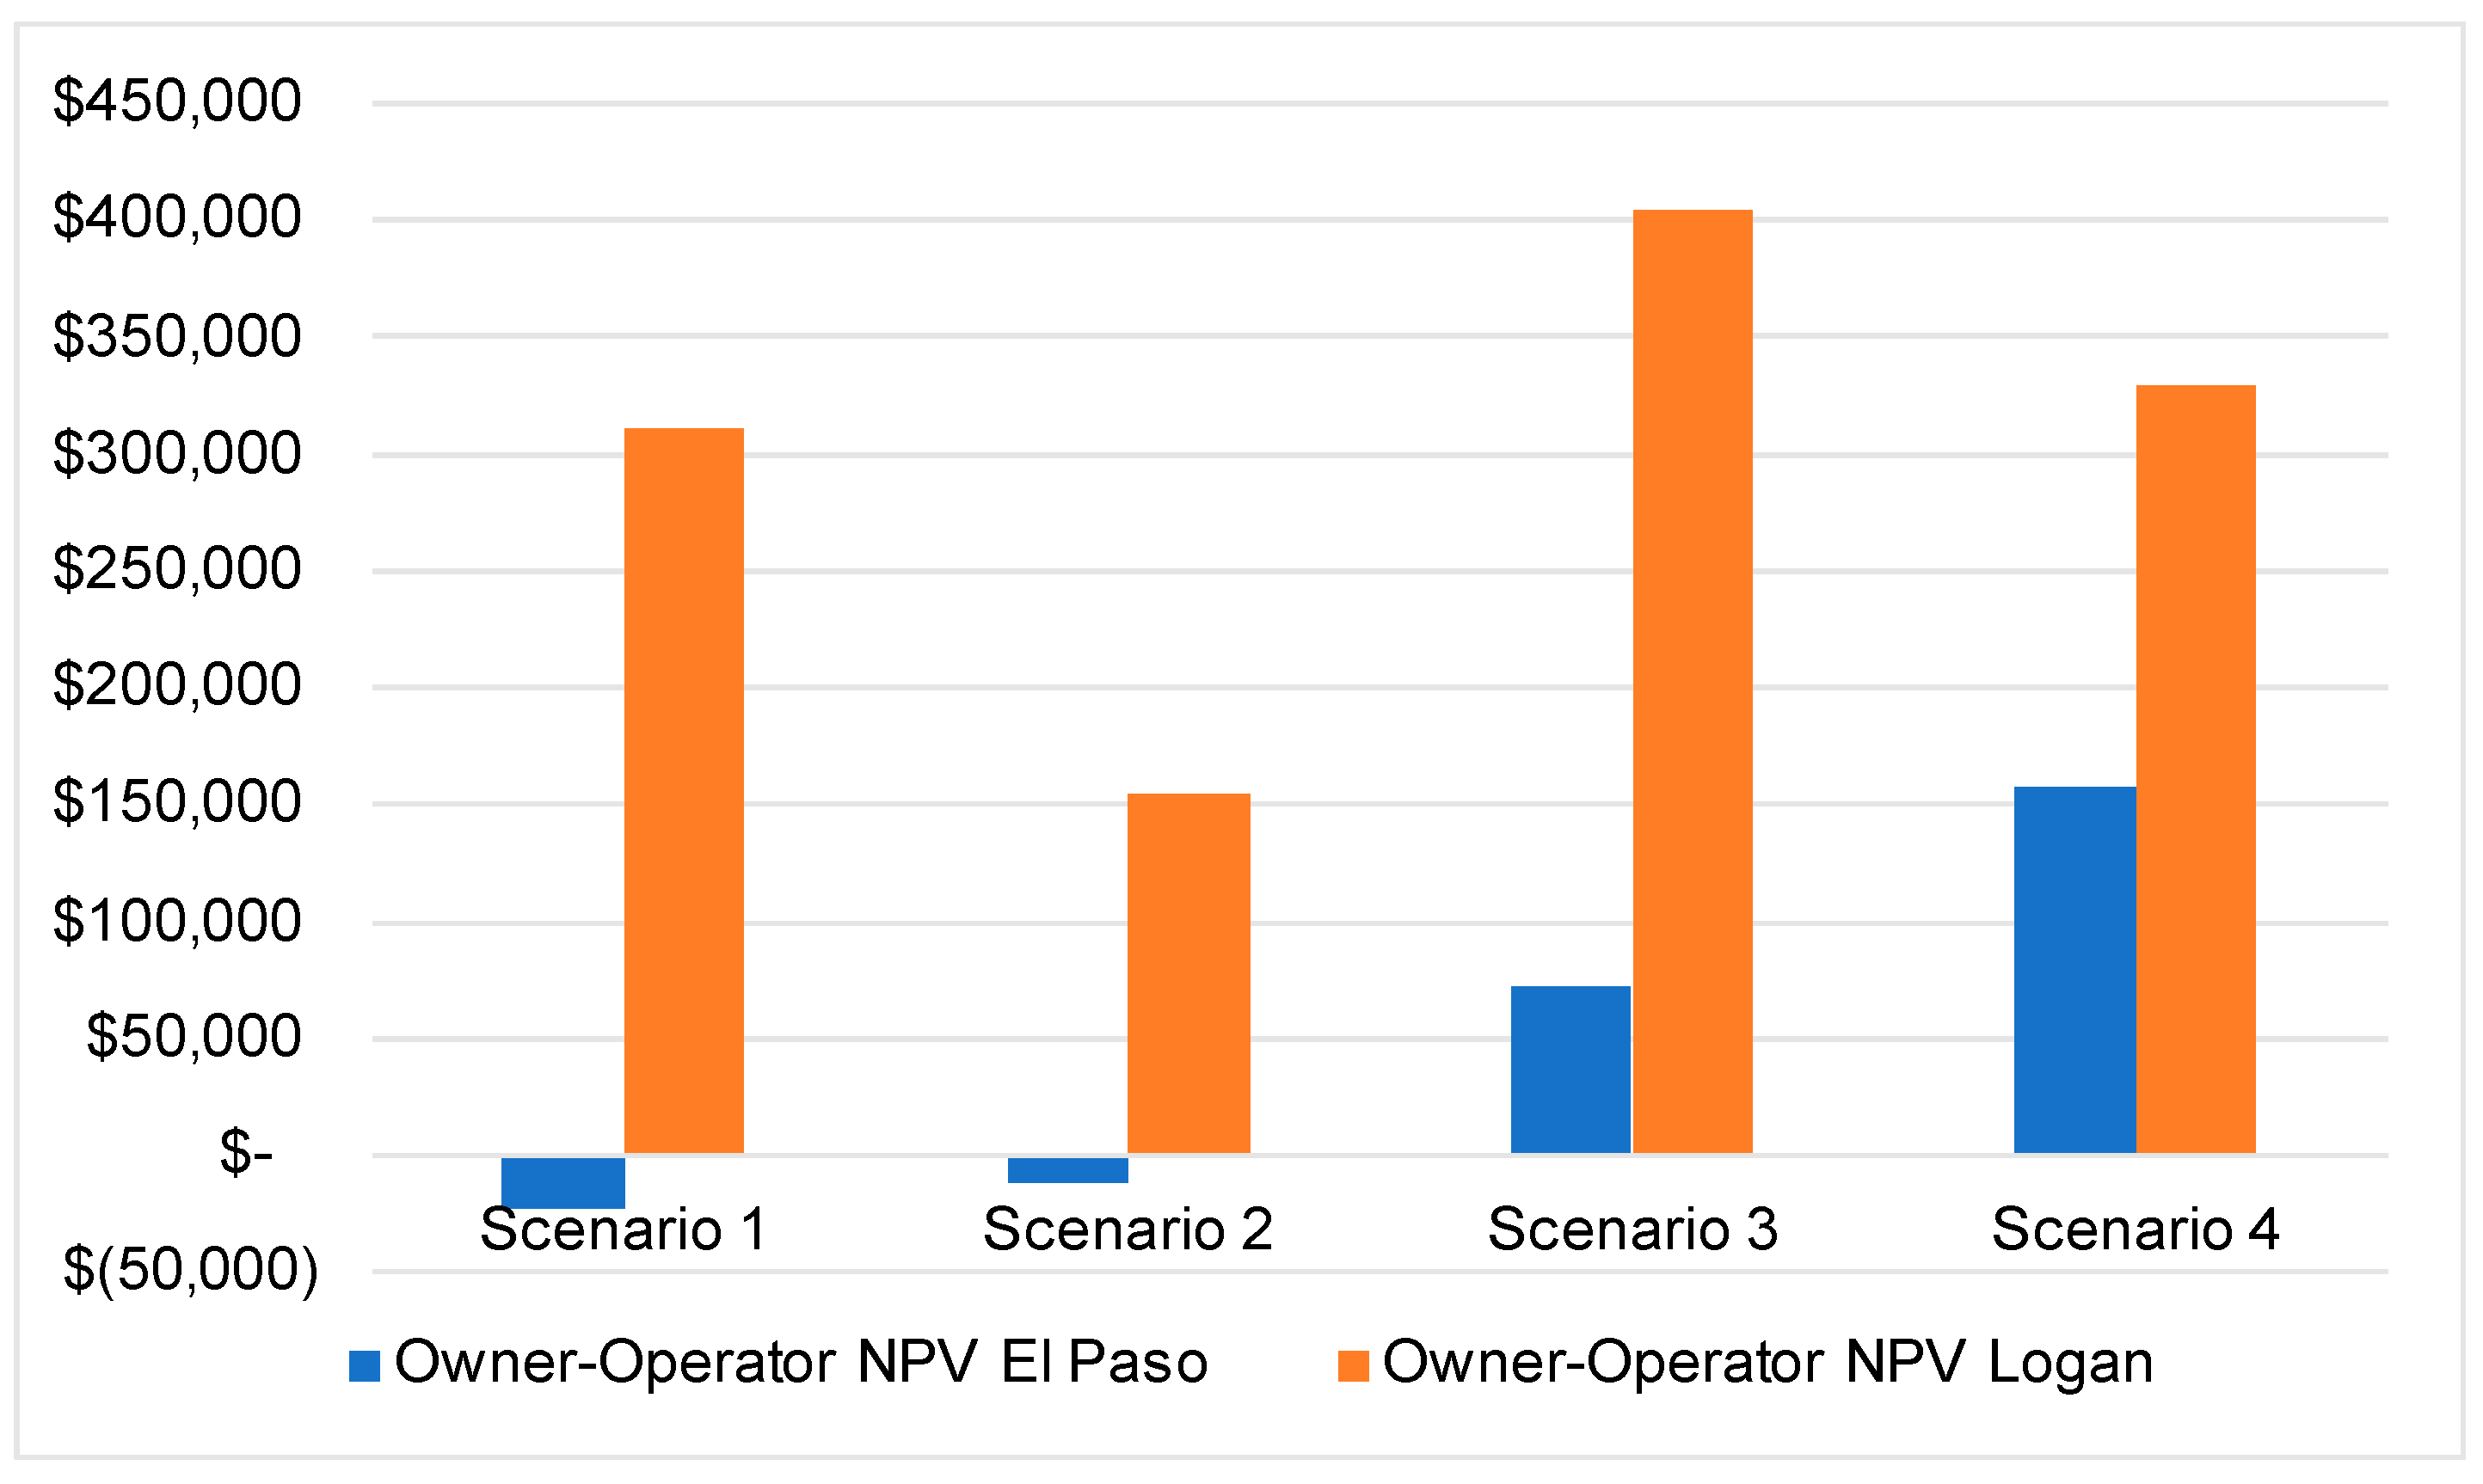
Figure 9 illustrates the significant variations in profitability observed between a DCFC site located in El Paso and another in Logan. Across all scenarios, Logan consistently demonstrates superior performance compared to El Paso, attributed to its lower utility-related costs. Moreover, the graph highlights that under Scenario 3, Logan attains the highest profitability, whereas in El Paso, Scenario 4 yields the greatest profits. This underscores the potential benefits of a multi-partner business model for the Owner-Operator, particularly in scenarios where utility costs are higher. Conversely, when faced with lower utility expenses, the imperative for a multi-partner business model to ensure profitability diminishes.

Figure 9.
Owner-Operator NPV city comparison across scenarios.
5. Sensitivity Analyses
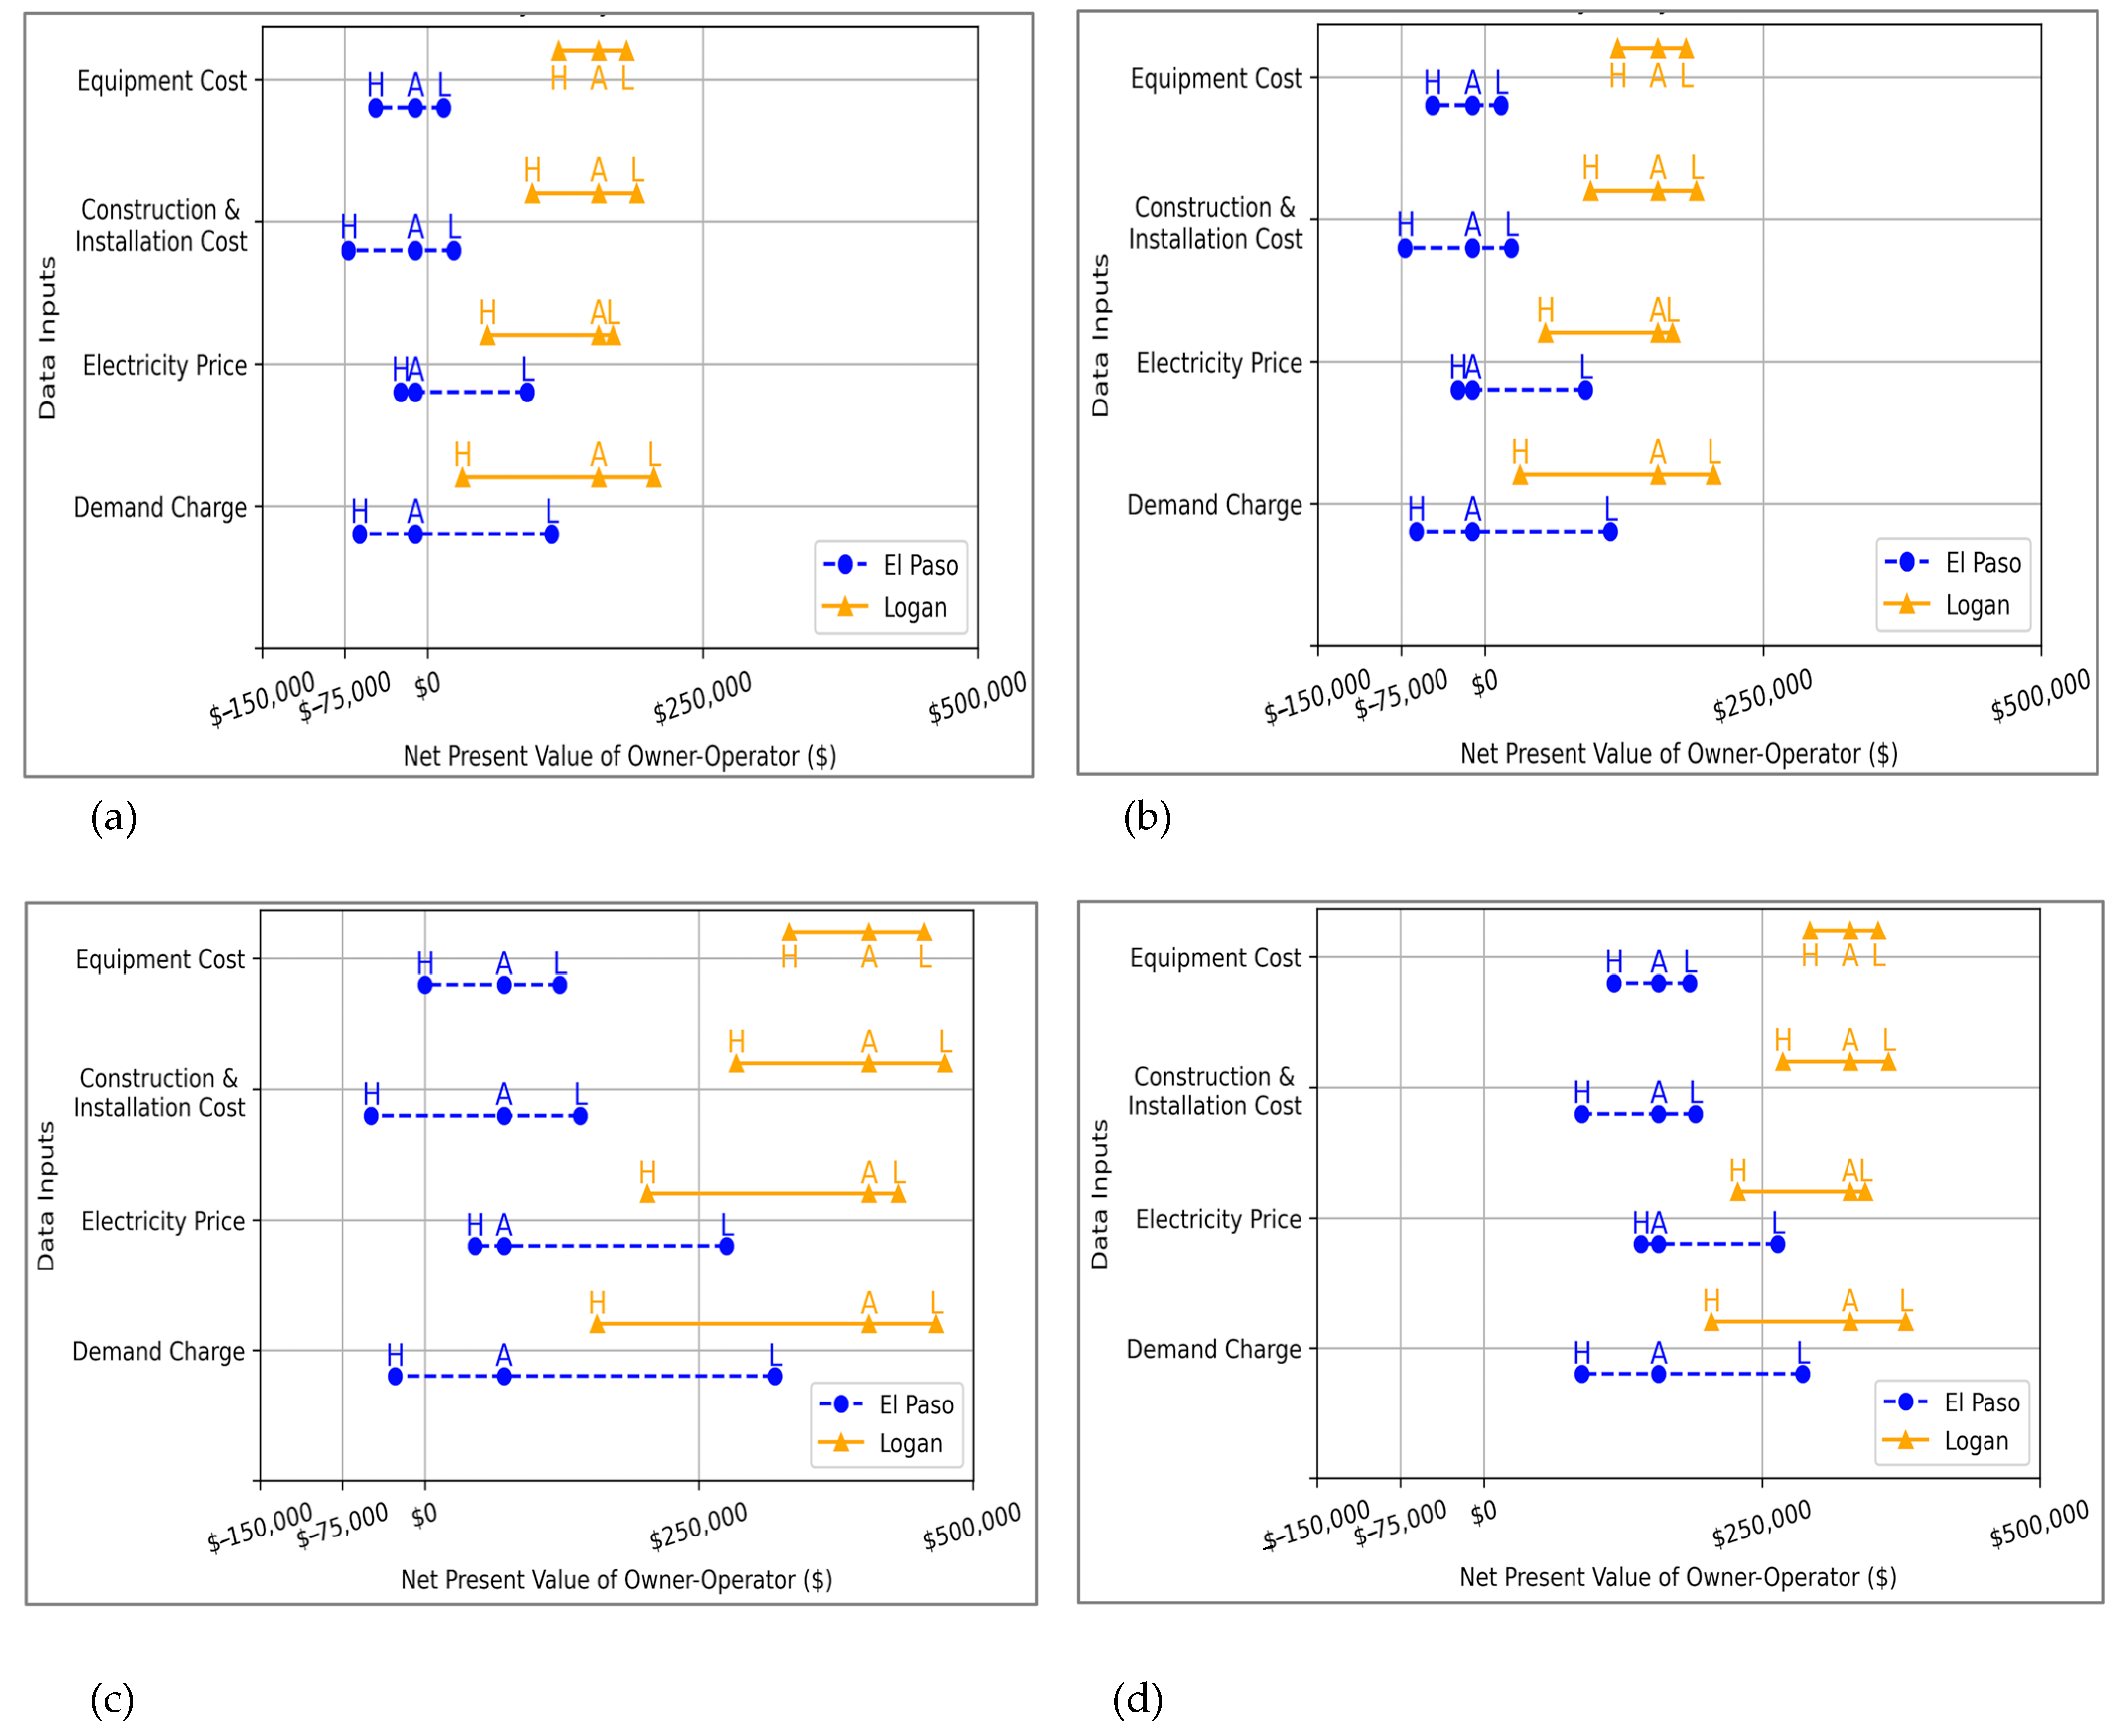
Figure 10a demonstrates the effect on the Owner-Operator NPV with an increase or decrease in the costs of the data inputs. The annotated letters represent the range, where H is the high-cost, A is the actual cost, and L is the low-cost range of the data inputs. The results have shown that utility-related costs have the most effect on the Owner-Operator NPV compared to capital-related costs in Scenario 1. Particularly, the demand charge emerges as the factor with the most significant influence on the Owner-Operator NPV. In both Logan and El Paso, an increase in the demand charge results in reduced profits for Logan and increased losses for El Paso, respectively.
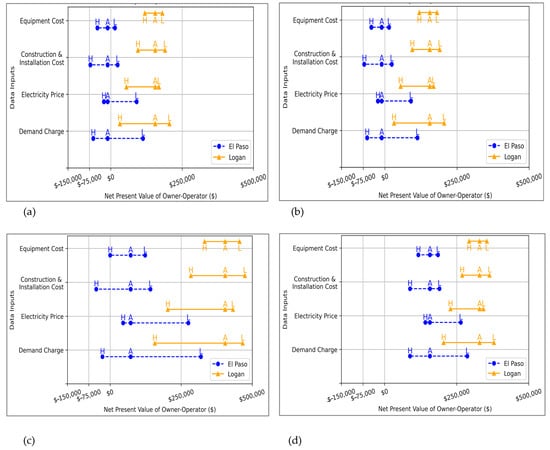
Figure 10.
Sensitivity analysis for scenarios 1–4. (a) Sensitivity Analysis for Scenario 1. (b) Sensitivity Analysis for Scenario 2. (c) Sensitivity Analysis for Scenario 3. (d) Sensitivity Analysis for Scenario 4. (H) stands for a High-cost scenario for that specific data input. (A) stands for an Actual-cost scenario for that specific data input. (L) stands for a Low-cost scenario for that specific data input.
Figure 10b shows sensitivity analysis conducted on the Owner-Operator NPV within the context of Scenario 2. In this scenario, the additional financial support applied to the capital costs has resulted in a comparatively milder impact on the Owner-Operator NPV as compared to the effects seen in Scenario 1, as presented in Figure 10. Furthermore, the analysis indicates a significant profit potential for El Paso if El Paso Electric (EPE) were to reduce their demand charge. However, it also becomes apparent that when the Owner-Operator collaborates with a Public Partner and operates under a low-cost demand charge scenario, the generated profit is lower than what was observed in Scenario 1, where the Owner-Operator retained all revenue generated. This underscores the disadvantage of having a partner transition into an equity holder through their capital investment.
Figure 10c illustrates the impact of sensitivity analyses for the Owner-Operator NPV within the context of Scenario 3. This particular scenario demonstrates the highest level of advantage for Logan. However, it also reveals that Logan remains significantly responsive to fluctuations in electricity prices and demand charges. Notably, El Paso displays greater sensitivity to reductions in utility-related costs compared to increases. Nevertheless, with lower utility expenses and the additional revenue influx from the Private Partner, El Paso manages to achieve a substantial level of profitability.
Figure 10d displays the sensitivity analyses for the Owner-Operator NPV in Scenario 4. The figure demonstrates that in both urban scenarios, the implementation of a multi-partner business model serves as a mitigating factor, preventing significant fluctuations in costs from causing drastic shifts in the profitability of the DCFC business. Notably, Scenario 4 distinctly exhibits the least susceptibility to cost variations for both El Paso and Logan.
The comparative insights drawn from the sensitivity analysis of NPV across different scenarios provided a detailed assessment of how various financial structures and cost influences can significantly impact profitability in different urban contexts. Some of the key insights are:
- Operational vs. Capital Cost Sensitivity: In scenarios where operational costs dominate, such as in Scenarios 1 and 3, the profitability of the Owner-Operator is significantly more sensitive to fluctuations in utility-related expenses like demand charges. This sensitivity analysis indicates that the control and reduction of these costs are pivotal for maintaining and improving profitability. In contrast, Scenario 2, which introduces additional financial support for capital costs, shows that capital costs can be managed more predictably through external financial mechanisms such as subsidies or partnerships, which cushion the impact of these costs on the NPV.
- Partnership Impact on Financial Outcomes: Scenario 2 introduces the complexity of partnerships where external support lessens the financial burden but also dilutes the ultimate profitability. This suggests a strategic dilemma: gaining financial support and sharing risk at the cost of potentially higher profits. Scenario 4, with a multi-partner model, demonstrates that having more stakeholders can provide a buffer against cost volatility. This model offers a more stable, albeit potentially less lucrative, financial outcome as risks and profits are spread across more entities, reducing the financial impact of negative shifts in cost or demand factors.
- Strategic Focus on Demand Charges: Demand charges emerge as a critical lever in all scenarios. For instance, in Scenario 1, Logan and El Paso show drastically different outcomes based on the same cost factor, emphasizing the local regulatory and operational environment’s role in financial modeling. The potential for strategic management of demand charges, whether through negotiation with utility providers or technological solutions to reduce peak demand, can be a crucial strategy for enhancing NPV.
- Risk Mitigation vs. Profit Maximization: Scenarios 2 and 4 offer insights into the trade-offs between mitigating risks through partnerships and maximizing profits when operating independently. Scenario 2 shows that while partnerships that provide capital can reduce the burden of initial expenses, they can also lead to lower returns due to the sharing of generated revenue. Scenario 4 illustrates that while multi-partner models add complexity, they also distribute the financial risks, making the business model more resilient to economic or regulatory changes.
- Flexibility and Adaptability: Across all scenarios, a theme of needing flexibility and adaptability emerges. Owner-Operators need to stay agile, adapting their business strategies based on evolving market conditions and regulatory environments. This might include shifting from solo operations to partnerships, renegotiating financial terms with partners, or investing in technologies that mitigate the most sensitive costs.
6. Conclusions, Limitations, and Future Work
The primary objective of this study was to present a comprehensive analysis of the financial dynamics of the DCFC ecosystem in the United States and provide valuable insights for stakeholders, investors, and industry players. Through extensive data collection and rigorous analysis, the study sought to explore the cost structure associated with the entire lifecycle of DCFC installations. By dissecting these costs into various elements, the research aimed to identify key drivers and potential areas for optimization. To address this the study explored various business models, meticulously examining their potential to gauge the economic viability of DCFC sites. A comprehensive analysis of multi-partner business models was conducted to unlock synergies and foster collaboration among various stakeholders, ranging from energy companies and infrastructure developers to EV manufacturers and technology providers. Through this analysis, the research presented avenues that could drive down costs, optimize resource allocation, and enhance the overall efficiency of DCFC infrastructure deployment. Moreover, the research included a sensitivity analysis of specific cost factors deemed pivotal in determining the financial viability of DCFC ventures. This granular analysis provides a deeper understanding of the variables that exert the most significant influence on profitability. By quantifying the impact of fluctuations in these key factors, the research contributed to the comprehension of risk and reward within the context of DCFC investments. Some of the significant findings of this research are as follows:
- The demand charge and electricity cost factors are most indicative of financially profitable DCFC investments.
- A multi-partner business model that includes a public and private partner can best ensure profitability but also shields the business profitability from any unexpected cost increases.
- There must be greater collaboration between public, private, and utility stakeholders when designing incentives and energy regulations to grow DCFC infrastructure.
- There must be more diversity in public incentives aimed at utilities and DCFC operating costs rather than those only focused on capital investment.
- A private partnership can be greatly beneficial to a DCFC business model as long as the site attracts new customers and additional spending to the private partner’s business.
While this study provides valuable insights, several limitations should be acknowledged, and future studies are warranted for the following reasons:
- A limitation of this study is its focus on the net present value (NPV) for each partner without considering other potential outcomes or performance metrics. Future research should analyze additional performance metrics such as internal rate of return, return on investment, and operating margin, among others, to provide more comprehensive insights for investors and policymakers [47].
- The study was limited to specific economic factors, such as capital costs, demand charges, and electricity retail prices, potentially overlooking other relevant variables like insurance costs, carbon credits, and environmental incentives, etc.
- Given the insight on the demand charge being an integral cost to the profitability of a DCFC site, future work may include investigating the technological and financial pathways for utilities, DCFC site owners, and governments to reduce the cost of demand charges.
- This study conducted economic viability analyses for El Paso, TX, and Logan, UT. Given that demand charges are utility-related costs and vary across the U.S., a comprehensive comparative analysis across utilities in the U.S. could identify trends and rank optimal locations for profitable DCFC sites.
- Additionally, expanding the economic analysis to include photovoltaic and energy storage systems at DCFC sites could help reduce energy loads during peak hours and lower energy charges.
- This study relied on deterministic sensitivity analysis (DSA), which does not account for interactions between variables or input uncertainty. Future research should conduct a more robust optimization analysis that considers these factors to provide more useful information [47,48].
Finally, the economic feasibility assessment reveals that a business model where owner-operators partner with public entities is the best strategy for profitable DCFC station operations in the U.S., with demand charges and electricity prices as key determinants of profitability. Although the current analysis was performed within the U.S., the model can be adapted to other geographical locations using specific local inputs.
Author Contributions
Conceptualization, D.B., A.A.R., S.I. and H.W.; methodology, D.B., A.A.R. and S.I.; formal analysis, D.B., A.A.R. and S.I.; investigation, A.A.R., D.B. and S.I.; data curation, D.B., A.A.R. and S.I.; writing—original draft preparation, D.B. and A.A.R.; writing—review and editing, D.B., A.A.R., S.I. and H.W.; visualization, D.B.; supervision, A.A.R.; project administration, A.A.R. and H.W.; funding acquisition, A.A.R. and H.W. All authors have read and agreed to the published version of the manuscript.
Funding
This research was funded by The National Science Foundation through the Advancing Sustainability through Powered Infrastructure for Roadway Electrification (ASPIRE) award, an Engineering Research Center program, grant number EEC-1941524.
Institutional Review Board Statement
Not applicable.
Informed Consent Statement
Not applicable.
Data Availability Statement
Data are contained within the article.
Acknowledgments
The authors would like to thank the Atlas EV Hub for providing permission and guidance on using the EV charging financial analysis tool for this research.
Conflicts of Interest
The authors declare no conflicts of interest.
Appendix A
Table A1.
List of Abbreviations used in the Economic Analysis.
Table A1.
List of Abbreviations used in the Economic Analysis.
| Abbreviated Term | Term |
|---|---|
| Discounted Cash Flow | |
| Net Present Value | |
| Rsite | Revenue of the DCFC Site |
| δ | Change |
| Earnings Before Interest and Taxes | |
| Discount Factor | |
| CFt | Net Cash Flow |
| Cash Inflow | |
| Cash Outflow | |
| R | Revenue Generated |
References
- Nie, Y.M.; Ghamami, M. A corridor-centric approach to planning electric vehicle charging infrastructure. Transp. Res. B 2013, 57, 172–190. [Google Scholar] [CrossRef]
- Funke, S.Á.; Sprei, F.; Gnann, T.; Plötz, P. How much charging infrastructure do electric vehicles need? A review of the evidence and international comparison. Transp. Res. D 2019, 77, 224–242. [Google Scholar] [CrossRef]
- Bauer, G.; Hsu, C.-W.; Nicholas, M.; Lutsey, N. Charging up America: Assessing the Growing Need for U.S. Charging Infrastructure through 2030; International Council on Clean Transportation: Washington, DC, USA, 2021. [Google Scholar] [CrossRef]
- Abby, B.; Cappellucci, J.; Heinrich, A.; Cost, E. Electric Vehicle Charging Infrastructure Trends from the Alternative Fueling Station Locator: Third Quarter 2023; NREL/TP-5400-88223; National Renewable Energy Laboratory: Golden, CO, USA, 2024. Available online: https://www.nrel.gov/docs/fy24osti/88223.pdf (accessed on 2 April 2024).
- Wood, E.; Brennan, B.; Matt, M.; Dong-Yeon, D.-Y.L.; Yanbo, G.; Fan, Y.; Zhaocai, L. The 2030 National Charging Network: Estimating U.S. Light-Duty Demand for Electric Vehicle Charging Infrastructure; NREL/TP-5400-85654; National Renewable Energy Laboratory: Golden, CO, USA, 2023. Available online: https://www.nrel.gov/docs/fy23osti/85654.pdf (accessed on 10 January 2024).
- The White House. A Guidebook to the Bipartisan Infrastructure Law for State, Local, Tribal, and Territorial Governments, and other Partners. Available online: https://www.whitehouse.gov/wp-content/uploads/2022/05/BUILDING-A-BETTER-AMERICA-V2.pdf#page=138 (accessed on 15 March 2024).
- Snyder, J.; Chang, D.; Erstad, D.; Lin, E.; Falken Rice, A.; Tzun Goh, C.; Tsao, A.; Financial Viability of Non-Residential Electric Vehicle Charging Stations. UCLA Luskin Center for Innovation. Available online: https://innovation.luskin.ucla.edu/wp-content/uploads/2019/03/Financial_Viability_of_Non-Residential_EV_Charging_Stations.pdf (accessed on 15 March 2024).
- Jabbari, P.; MacKenzie, D. EV everywhere or EV anytime? Co-locating multiple DC fast chargers to improve both operator cost and access reliability. In Proceedings of the Transportation Research Board 96th Annual Meeting, Washington, DC, USA, 8–12 January 2017. [Google Scholar]
- Lee, H.; Clark, A. Charging the Future: Challenges and Opportunities for Electric Vehicle Adoption; HKS Working Paper RWP18-026; Belfer Center for Science and International Affairs Harvard Kennedy School: Cambridge, MA, USA, 2018. [Google Scholar] [CrossRef]
- Fröde, P.; Lee, M.; Sahdev, S. Can Public EV-Fast Charging Stations Be Profitable in the United States? McKinsey & Company. 5 October 2023. Available online: https://www.mckinsey.com/features/mckinsey-center-for-future-mobility/our-insights/can-public-ev-fast-charging-stations-be-profitable-in-the-united-states#/ (accessed on 15 January 2024).
- Dimanchev, E.; Fleten, S.; MacKenzie, D.; Korpås, M. Accelerating electric vehicle charging investments: A real options approach to policy design. Energy Policy 2023, 181, 113703. [Google Scholar] [CrossRef]
- Burnham, A.; Dufek, E.J.; Stephens, T.; Francfort, J.; Michelbacher, C.; Carlson, R.B.; Zhang, J.; Vijayagopal, R.; Dias, F.; Mohanpurkar, M.; et al. Enabling fast charging—Infrastructure and economic considerations. J. Power Sources 2017, 367, 237–249. [Google Scholar] [CrossRef]
- Gamage, T.; Tal, G.; Jenn, A.T. The costs and challenges of installing corridor DC fast chargers in California. Case Stud. Transp. Policy 2023, 11, 100969. [Google Scholar] [CrossRef]
- International Energy Agency. Technology Needs in Long-Distance Transport. Energy Techn. Perspectives. 2020. Available online: https://www.iea.org/reports/energy-technology-perspectives-2020/technology-needs-in-long-distance-transport (accessed on 10 January 2024).
- REN21-Renewables 2023 Global Status Report Collection. Renewables in Energy Demand. 2023. Available online: http://www.ren21.net/gsr2023-demand-modules (accessed on 2 March 2024).
- International Energy Agency. Global EV Outlook-Securing Supplies for an Electric Future. 2023. Available online: https://www.oecd-ilibrary.org/energy/global-ev-outlook-2022_c83f815c-en (accessed on 2 January 2024).
- Rivera, S.; Goetz, S.M.; Kouro, S.; Lehn, P.W.; Pathmanathan, M.; Bauer, P.; Mastromauro, R.A. Charging infrastructure and grid integration for electromobility. Proc. IEEE 2023, 111, 371–396. [Google Scholar] [CrossRef]
- Savari, G.; Jagabar, M.; Anantha, L.; El-Shahat, A.; Hasanien, H.; Almakhles, D.; Aleem, S.; Omar, A. Assessment of charging technologies, infrastructure and charging station recommendation schemes of electric vehicles: A review. Ain Shams Eng. J. 2023, 14, 4. [Google Scholar] [CrossRef]
- Irle, R. Global EV Sales for 2022. EV Volume. 2023. Available online: https://ev-volumes.com/news/ev/global-ev-sales-for-2022/ (accessed on 10 January 2024).
- Bernard, M.R.; Nicholas, M.; Wappelhorst, S.; Hall, D. A Review of the AFIR Proposal: How much Power Output Is Needed for Public Charging Infrastructure in the European Union? 2022. Available online: https://theicct.org/publication/europe-ldv-review-of-afir-proposal-how-much-power-output-needed-for-public-charging-infrastructure-in-the-eu-mar22/ (accessed on 20 February 2024).
- Cooper, A.; Schefter, K. Electric Vehicle Sales Forecast and the Charging Infrastructure Required through 2030. 2018. Available online: https://www.edisonfoundation.net/-/media/Files/IEI/publications/IEI_EEI-EV-Forecast-Report_Nov2018.ashx (accessed on 11 January 2024).
- Powar, V.; Singh, R. End-to-End direct-current-based extreme fast electric vehicle charging infrastructure using Lithium-Ion battery storage. Batteries 2023, 9, 169. [Google Scholar] [CrossRef]
- Dimitriadou, K.; Rigogiannis, N.; Fountoukidis, S.; Kotarela, F.; Kyritsis, A.; Papanikolaou, N. Current trends in electric vehicle charging infrastructure; opportunities and challenges in wireless charging integration. Energies 2023, 16, 2057. [Google Scholar] [CrossRef]
- Kakkar, R.; Gupta, R.; Agrawal, S.; Tanwar, S.; Sharma, R.; Alkhayyat, A.; Neagu, B.C.; Raboaca, M.S. A Review on standardizing electric vehicles community charging service operator infrastructure. Appl. Sci. 2022, 12, 12096. [Google Scholar] [CrossRef]
- Nelder, C.; Rogers, E. Reducing EV Charging Infrastructure Costs. 2019. Available online: https://rmi.org/wp-content/uploads/2020/01/RMI-EV-Charging-Infrastructure-Costs.pdf (accessed on 4 January 2024).
- California Energy Commission. EV Charger Selection Guide. 2018. Available online: https://afdc.energy.gov/files/u/publication/EV_Charger_Selection_Guide_2018-01-112.pdf (accessed on 4 January 2024).
- California Energy Commission. California Electric Vehicle Infrastructure Project (CALeVIP) Cost Data. 2022. Available online: https://calevip.org/electric-vehicle-charging-101 (accessed on 15 December 2023).
- Khan, H.A.U.; Price, S.; Avraam, C.; Dvorkin, Y. Inequitable access to EV charging infrastructure. Electr. J. 2022, 35, 107096. [Google Scholar] [CrossRef]
- Nicholas, M. Estimating Electric Vehicle Charging Infrastructure Costs Across Major U.S. Metropolitan Areas. The International Council on Clean Transportation (ICCT). 2019. Available online: https://theicct.org/publication/estimating-electric-vehicle-charging-infrastructure-costs-across-major-u-s-metropolitan-areas/ (accessed on 6 January 2024).
- Botsford, C. The Economics of Non-Residential Level 2 EVSE Charging Infrastructure. In Proceedings of the EVS26 International Battery, Hybrid and Fuel Cell Electric Vehicle Symposium, Los Angeles, CA, USA, 6–9 May 2012. [Google Scholar]
- Idaho National Laboratory (INL). What Were the Cost Drivers for the Direct Current Fast Charging Installations? INL/MIS-15-35060. The EV Project; 2015. Available online: https://avt.inl.gov/sites/default/files/pdf/EVProj/WhatWereTheCostDriversForDCFCinstallations.pdf (accessed on 10 March 2024).
- Idaho National Laboratory (INL). How do Publicly Accessible Charging Infrastructure Installation Costs Vary by Geographic Location? INL/MIS-15-35319; The EV Project; 2014. Available online: https://avt.inl.gov/sites/default/files/pdf/EVProj/HowDoPubliclyAccessibleInfrastructureInstallationCostsVaryByGeographicLocation.pdf (accessed on 21 January 2024).
- Margaret, S.; Castellano, J. Costs Associated with Non-Residential Electric Vehicle Supply Equipment: Factors to Consider in the Implementation of Electric Vehicle Charging Stations; No. DOE/EE-1289; Department of Energy: Washington, DC, USA, 2015.
- U.S. Department of Energy. Federal Workplace Charging Program Guide. 2020. Available online: https://www.energy.gov/sites/default/files/2020/11/f80/federal-workplace-charging-guide.pdf (accessed on 3 January 2024).
- Tong, L.; Xing, J.; Zhou, Y. The market for electric vehicles: Indirect network effects and policy design. J. Assoc. Environ. Resour. Econ. 2017, 4, 89–133. [Google Scholar] [CrossRef]
- Münzel, C.; Plötz, P.; Sprei, F.; Gnann, T. How large is the effect of financial incentives on electric vehicle sales?—A global review and European analysis. Energy Econ. 2019, 84, 104493. [Google Scholar] [CrossRef]
- Cole, W.; Frazier, A.W.; Augustine, C. Cost Projections for Utility-Scale Battery Storage: 2021. Available online: https://www.nrel.gov/docs/fy21osti/79236.pdf (accessed on 21 February 2024).
- Egbue, O.; Long, S. Barriers to widespread adoption of electric vehicles: An analysis of consumer attitudes and perceptions. Energy Policy 2012, 48, 717–729. [Google Scholar] [CrossRef]
- Chakraborty, A.; Kumar, R.; Bhaskar, K. A game-theoretic approach for electric vehicle adoption and policy decisions under different market structures. J. Operat. Res. Soc. 2020, 72, 594–611. [Google Scholar] [CrossRef]
- Kumar, R.; Chakraborty, A.; Mandal, P. Promoting electric vehicle adoption: Who should invest in charging infrastructure? Transp. Res. Part E Logist. Transp. Rev. 2021, 149, 102295. [Google Scholar] [CrossRef]
- Christensen, C.; Salmon, J. EV adoption influence on air quality and associated infrastructure costs. World Electr. Veh. J. 2021, 12, 207. [Google Scholar] [CrossRef]
- Shao, L.; Yang, J.; Zhang, M. Subsidy scheme or price discount scheme? Mass adoption of electric vehicles under different market structures. Eur. J. Operat. Res. 2017, 262, 1181–1195. [Google Scholar] [CrossRef]
- Pearre, N.S.; Swan, L.G. Observational Evaluation of the Maximum Practical Utilization of Electric Vehicle DCFC Infrastructure. World Electr. Veh. J. 2022, 13, 190. [Google Scholar] [CrossRef]
- PricewaterhouseCoopers, PwC|Electric Vehicles and the Charging Infrastructure: A New Mindset? 2021. Available online: https://www.pwc.com/us/en/industrial-products/publications/assets/pwc-electric-vehicles-charging-infrastructure-mindset.pdf (accessed on 1 January 2024).
- Borlaug, B.; Yang, F.; Pritchard, E.; Wood, E.; Gonder, J. Public electric vehicle charging station utilization in the United States. Transport. Res. Part D Transp. Environ. 2023, 114, 103564. [Google Scholar] [CrossRef]
- PacifiCorp. PacifiCorp Facts. 2009. Available online: https://www.nrc.gov/docs/ML1018/ML101810206.pdf (accessed on 13 January 2024).
- Lei, X.; Yu, H.; Shao, Z.; Jian, L. Optimal bidding and coordinating strategy for maximal marginal revenue due to V2G operation: Distribution system operator as a key player in China’s uncertain electricity markets. Energy 2023, 283, 128354. [Google Scholar] [CrossRef]
- Lei, X.; Yu, H.; Yu, B.; Shao, Z.; Jian, L. Bridging electricity market and carbon emission market through electric vehicles: Optimal bidding strategy for distribution system operators to explore economic feasibility in China’s low-carbon transitions. Sustain. Cities Soc. 2023, 94, 104557. [Google Scholar] [CrossRef]
Disclaimer/Publisher’s Note: The statements, opinions and data contained in all publications are solely those of the individual author(s) and contributor(s) and not of MDPI and/or the editor(s). MDPI and/or the editor(s) disclaim responsibility for any injury to people or property resulting from any ideas, methods, instructions or products referred to in the content. |
© 2024 by the authors. Licensee MDPI, Basel, Switzerland. This article is an open access article distributed under the terms and conditions of the Creative Commons Attribution (CC BY) license (https://creativecommons.org/licenses/by/4.0/).